
Lab1_Oct1_2119pm
39
University of Waterloo Department of Civil and Environmental Engineering Tensile Testing of Metals Lab Report No. 1 CIVE 265 October 3, 2014 Prepared for Dr. Scott Walbridge Department of Civil and Environmental Engineering University of Waterloo Prepared by Heidi Vanheule Mena Shamshoom Michelle Liu Salika Gnanasampanthan 20505468 20519304 20457298 20521680
-
Upload
michelle-liu -
Category
Documents
-
view
64 -
download
0
Transcript of Lab1_Oct1_2119pm

University of Waterloo Department of Civil and Environmental Engineering
Tensile Testing of Metals Lab Report No. 1
CIVE 265
October 3, 2014
Prepared for Dr. Scott Walbridge
Department of Civil and Environmental Engineering University of Waterloo
Prepared by
Heidi Vanheule Mena Shamshoom
Michelle Liu Salika Gnanasampanthan
20505468 20519304 20457298 20521680
Heidi Vanheule Mena Shamshoom
Michelle Liu Salika Sampanthan
20505468 20519304 20457298 20521680

ii
Abstract The mechanical properties of metals under tensile loading are critical in all disciplines of
engineering. Tests were therefore performed on three types of common metal in order to study
their behaviour under tensile loading. Type 1 consisted of steel 350W, type 2 of Aluminum 6061,
and type 3 of annealed Aluminum 6061. All specimens were made according to ASTM E8-03.
MTS 810 Material Testing System was used to apply tensile loads to each specimen until the
material experiences brittle failure. Numerical and graphical data of force versus displacement
were collected by the testing apparatus throughout loading. The elongation and final cross-
section of specimens were manually measured after failure occurred.
Modulus of elasticity, yield stress, ultimate stress, resilience, toughness, failure strain, and
percent area reduction are among the properties analyzed. All data necessary for the computation
of above properties were obtained successfully.
The steel specimens had the greatest modulus of elasticity, yield stress, ultimate stress, and
toughness. Aluminum had the greatest modulus of resilience in comparison to the steel and
annealed aluminum specimens. The annealed aluminum specimens were more ductile compared
to both the aluminum and the steel specimens.

iii
Table of Contents List of Figures ··························································································· iv List of Tables ···························································································· iv 1.0 Introduction ························································································· 1
1.1 Purpose of Study ··············································································· 1 1.2 Objectives ······················································································· 1 1.3 Scope ···························································································· 1
2.0 Data Analysis ······················································································· 2 2.1 Details of Specimens ·········································································· 2 2.2 Specimen Geometry ··········································································· 2 2.3 Details of Testing Equipment ································································ 4 2.4 Measured Data ················································································· 4 2.5 Calculated Data ················································································· 12 2.6 Mechanical Properties ········································································· 16
3.0 Data Interpretation ·················································································· 19 3.1 The Effect of Annealing on Aluminum ····················································· 20 3.2 Possible Errors ·················································································· 20
4.0 Conclusion ··························································································· 22 5.0 References ··························································································· 22 6.0 Appendices ·························································································· 23
iv
List of Figures Figure 1. Typical Specimen. 2 Figure 2. Steel 350 W Specimens. 4 Figure 3. Force versus Displacement Curves of Steel 350W Specimens. 5 Figure 4. Yield stress using 0.2% rule for S1: Condensed range. 6 Figure 5. Aluminum 6061 Specimens. 7 Figure 6. Force vs. Displacement Curves of Aluminum 6061 Specimens. 8 Figure 7. Annealed Aluminum 6061 Specimens. 9 Figure 8. Force vs. Displacement Curves of Annealed Aluminum 6061 Specimens. 10 Figure 9. Engineering stress vs. strain curves comparing S1, Al 1 and Al-A1. 12 Figure 10. Stress vs. Strain Curves of Steel 350 W. 13 Figure 11. Stress vs. Strain Curves of Aluminum 6061. 14 Figure 12. Stress vs. Strain Curves of Annealed Aluminum 6061. 15 Figure 13. Engineering and true stress-strain curves of all specimens tested. 16 List of Tables Table 1. Specimen Geometry (mm). 3 Table 2. Specimen Dimensions After Testing (mm). 11 Table 3. Description of Load-Displacement Curves. 11 Table 4. Summary of mechanical properties of specimens. 17

1
1.0 Introduction
1.1 Purpose of Study
The purpose of this experiment was to collect data relating to the material properties of three
types of common metals: Steel 350W, aluminum 6061, and annealed aluminum 6061. Five test
specimens were made for steel, three for aluminum, and two for annealed aluminum, all
according to ASTM E8-03.
1.2 Objectives
Raw data obtained during the experiment include force versus displacement, elongation and final
cross-section dimension. The data were then used to compute the following material properties:
modulus of elasticity, yield stress, ultimate stress, resilience, toughness, failure strain, and
percent elongation and percent area reduction.
1.3 Scope
The experiments were performed along the guidelines of ASTM, but data is limited to the
specimens tested. Standard tools and devices were available, and data was collected in a
professional laboratory setting.

2
2.0 Data Analysis
The following section includes a detailed analysis of the results obtained during tensile testing.
Mechanical properties of metal specimens have been calculated and summarized and methods of
computations have been discussed. Outlying data points have been removed from the data set.
2.1 Details of Specimens
A total of three types of rectangular metal specimens were used to conduct the tensile test; five
samples of Steel 350W (S1, S2, S3, S4 and S5), three samples of Aluminum 6061 (Al 1, Al 2
and Al 3) and two samples of annealed Aluminum 6061 (Al-A 1, Al-A 2). Steel and a selected
number of aluminum specimens were tested as-received. Modifications were made to two
aluminum specimens. Annealed aluminum specimens had been maintained at a heat of 407°C
and cooled at a rate of 28°C per hour to a final temperature of 260°C prior to testing (Lab
Manual, 2014). Through this process, the softness, ductility and toughness of the aluminum
samples were increased and stresses within the metal had been reduced (Callister, 2014). All
three specimens were to be loaded beyond yield, unloaded and reloaded to failure.
2.2 Specimen Geometry
Rectangular specimens were used for the tensile test as shown in Figure 1. The reported
dimensions represent the average of dimensions obtained at three different locations of each
sample. Samples had varying widths and thicknesses and a constant gauge length. The gauge
length is represented by the symbol L in Figure 1.
Figure 1. Typical Specimen.

3
Widths, thicknesses, gauge lengths and areas of each specimen are summarized in Table 1.
Table 1. Specimen Geometry (mm).
Specimen Width (Wo)
Thickness (To)
Gauge Length (Lo)
Area (Ao)
S1 12.75 9.64 50.7 122.910 S2 12.76 9.65 50.7 123.134 S3 12.76 9.61 50.7 122.624 S4 12.8 9.56 50.7 122.368 S5 12.75 9.42 50.7 120.105
Al 1 12.73 9.75 50.7 124.118 Al 2 12.73 9.68 50.7 123.226 Al 3 12.72 9.78 50.7 124.402
Al-A 1 12.72 9.76 50.7 124.147 Al-A 2 12.71 9.75 50.7 123.923

4
2.3 Details of Testing Equipment
An MTS 810 Material Testing System was utilized to conduct the tensile testing, exhibiting a
maximum loading capacity of 100 kN. A Multipurpose Testware was used to monitor the
loading rate of preference. Data representing the forces, in Newtons (N) and corresponding
displacements, in millimetres (mm) are recorded through the software during testing (Lab
Manual, 2014).
2.4 Measured Data
Steel 350W Specimens
The cross-sectional area of the failure surface for the steel specimens was uneven. Extreme
necking of the specimen is evident along the failure surface. A sample failure surface of a steel
specimen is shown in Figure 2.
Figure 2. Steel 350 W Specimens.

5
Figure 3. Force versus Displacement Curves of Steel 350W Specimens.
The Force vs. Displacement curve of each steel specimen is presented in Figure 3. All five
samples follow a relatively similar path. Loading, unloading and reloading of the specimens
follow a linear relationship until exhibiting maximum yield load. At maximum yield load, the
force-displacement curve follows a non-linear relationship until failure of the specimen. Yield
loads of specimens were obtained using the 0.2% rule in which a parallel line is drawn through
the point corresponding to a strain value of 0.002 at zero load. An example of the two percent
rule can be seen in Figure 4. The intersection of this parallel line and the stress-strain curve is
established to be the yield stress. Based on the yield stress, the yield load and displacement were
calculated. This method of computation was used to determine yield loads of all specimens
including Aluminum and annealed Aluminum. Results of the yield load, the corresponding yield
displacement, maximum load and failure displacement of the specimens are summarized in
Table 3.
6
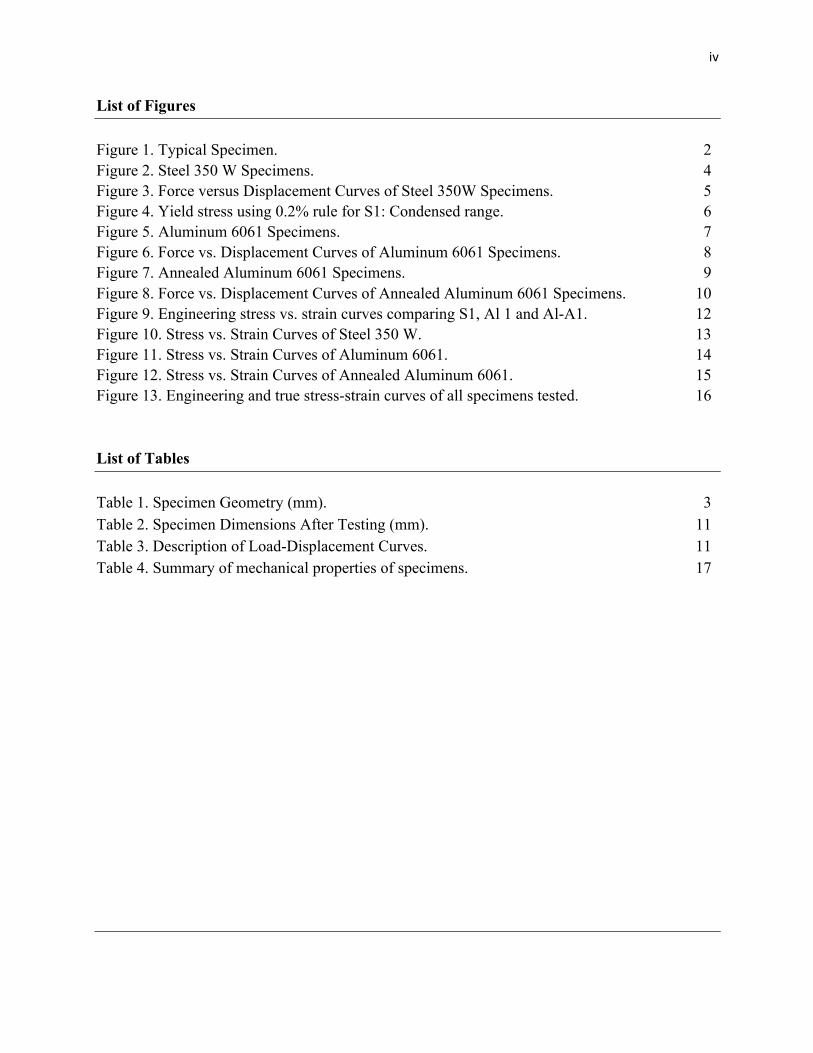
Figure 4. Yield stress using 0.2% rule for S1: Condensed range.
In order to calculate the yield stress, the 0.2% rule was employed. Using MATLAB code (found
in the Appendix), a line of the same slope as the initial loading was created. Strain values from
0.002 to 0.3 where generated and data points collected from the experiment were used to
determine the slope and y intercept of the new line, shown as a dotted line in Figure 4. In certain
cases where the initial loading slope was hard to determine, the slope of the reloading portion
was calculated instead. The line was translated down in order to zero it and the intersection of the
two polynomials was determined. The y-value of the intersection was the yield stress while the
x-value was used to calculate the yield displacement.
7
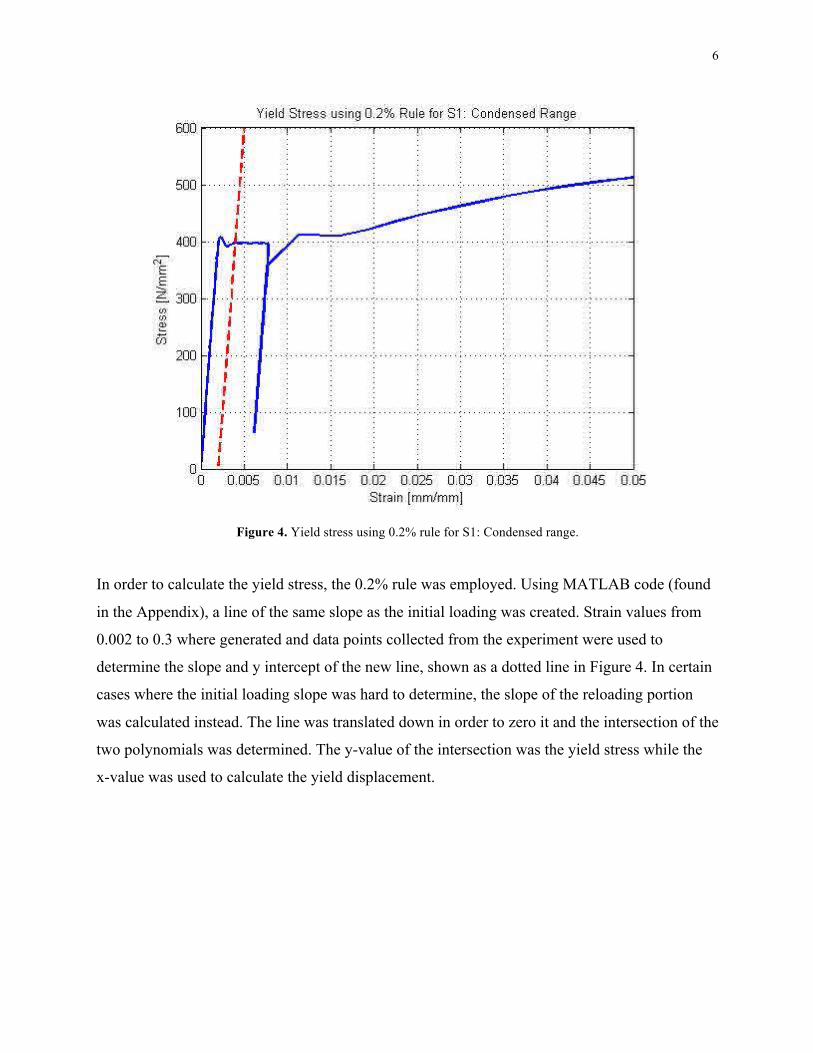
Aluminum 6061 Specimens
The cross-sectional area of the failure surface for the Aluminum Specimens were uneven.
Necking of the specimen is evident along the failure surface, although a reduction of the cross-
sectional area was less than the reduction seen in the steel specimens. A sample failure surface of
an aluminum specimen is shown in Figure 5.
Figure 5. Aluminum 6061 Specimens.

8
Figure 6. Force vs. Displacement Curves of Aluminum 6061 Specimens.
The Force vs. Displacement curves of Aluminum 6061 specimens follow a relatively similar path
to one another. The process of loading, unloading and reloading follows a linear relationship in
all three samples, until the yield load is reached. Upon reaching the yield load, the specimens
begin to follow a non-linear relationship along the force-displacement curves, until reaching the
point of fracture. Through graphical interpretation, it can be seen that Aluminum specimens have
a lower yield load than Steel specimens. Steel specimens also exhibit a larger displacement in
comparison to aluminum specimens.

9
Annealed Aluminum 6061
The cross-sectional area of the failure surface for the Annealed Aluminum Specimens were
uneven. The thickness of the specimen is much less in comparison to steel specimens. However,
the width is larger, indicating that the specimen experienced a greater percent elongation than
steel. A sample failure surface of an annealed aluminum specimen is shown in Figure 7.
Figure 7: Annealed Aluminum 6061 Specimens.
10
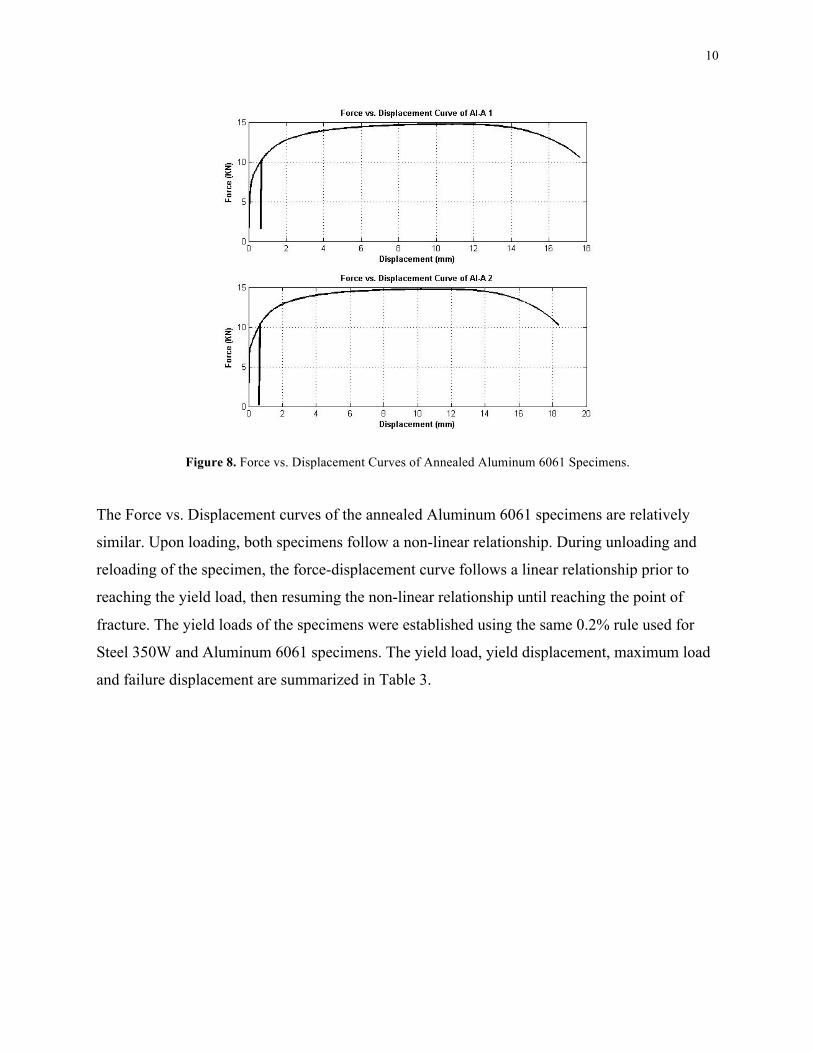
Figure 8. Force vs. Displacement Curves of Annealed Aluminum 6061 Specimens.
The Force vs. Displacement curves of the annealed Aluminum 6061 specimens are relatively
similar. Upon loading, both specimens follow a non-linear relationship. During unloading and
reloading of the specimen, the force-displacement curve follows a linear relationship prior to
reaching the yield load, then resuming the non-linear relationship until reaching the point of
fracture. The yield loads of the specimens were established using the same 0.2% rule used for
Steel 350W and Aluminum 6061 specimens. The yield load, yield displacement, maximum load
and failure displacement are summarized in Table 3.
11
Table 2. Specimen Dimensions After Testing (mm).
Specimen Width (Wf) Thickness (Tf) Gauge Length (Lf) Area (Af)
S1 8.92 6.57 67.33 58.6044 S2 8.93 6.46 67.72 57.6878 S3 9.1 6.64 67.53 60.424 S4 8.53 6.36 66.54 54.2508 S5 9.18 6.75 67 61.965
Al 1 10.5 6.96 61 73.08 Al 2 10.61 6.95 59.82 73.7395 Al 3 10.65 6.44 60.94 68.586
Al-A 1 9.82 5.81 69.18 57.0542 Al-A 2 9.3 5.32 70.35 49.476
Table 3. Description of Load-Displacement Curves.
Specimen Yield Load (kN)
Yield Displacement
(mm)
Maximum Load (kN)
Failure Displacement
(mm)
S1 48854.730 0.202792 70319.945 16.63
S2 49921.875 0.204700 70256.492 17.02
S3 47687.580 0.199877 70168.828 16.83
S4 47354.934 0.196152 70019.344 15.84
S5 46334.391 0.197481 70296.297 16.3
Al 1 35668.200 0.312076 38409.367 10.3
Al 2 35533.210 0.307171 38033.199 9.12
Al 3 35703.518 0.310308 38366.02 10.24
Al-A 1 7514.491 0.183228 14748.349 18.48
Al-A 2 7702.963 0.145509 14783.302 19.65
12
2.5 Calculated Data
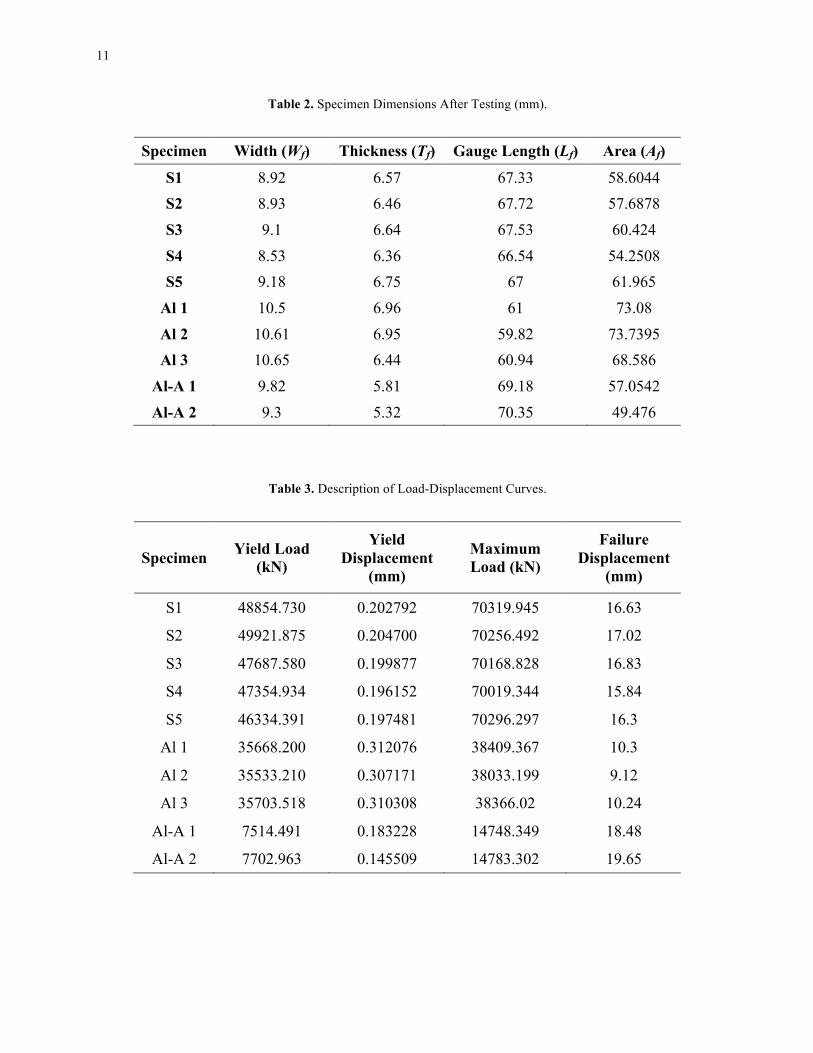
The engineering stress-strain curves of specimens S1, Al 1 and Al-A 1 is presented in Figure 9.
Figure 9. Engineering stress vs. strain curves comparing S1, Al 1 and Al-A1.
Through analysis of the slopes of the specimen curves, it is established that the steel specimen S1
has the largest Modulus of Elasticity value. The Elastic Modulus of S1 is 193 GPa, in
comparison to aluminum Al 1 which is 69 GPa and annealed aluminum Al-A 1 which is 39 GPa.
The steel specimen S1 has a larger value for Yield Stress in comparison to the aluminum Al 1
and annealed aluminum Al-A 1 specimens. This was determined by analyzing the point at which
the material transitions from elastic to plastic behaviour, defining the Yield Stress.
Specimen Al-A 1 has the greatest ductility in terms of percent elongation and percent reduction
in cross-sectional area, closely followed by the steel specimen S1. The aluminum specimen that
was tested as received is the least ductile with a Percent Elongation of 20% and Percent
Reduction in Cross-Sectional Area of 10%.
13
Through visual approximation of the area below the stress-strain curves of each specimen, it can
be determine that the steel specimen S1 has the largest value of Resilience in comparison to
aluminum Al 1 and annealed aluminum Al- A 1. Computed mechanical parameters for each
specimen can be found in Table 2.
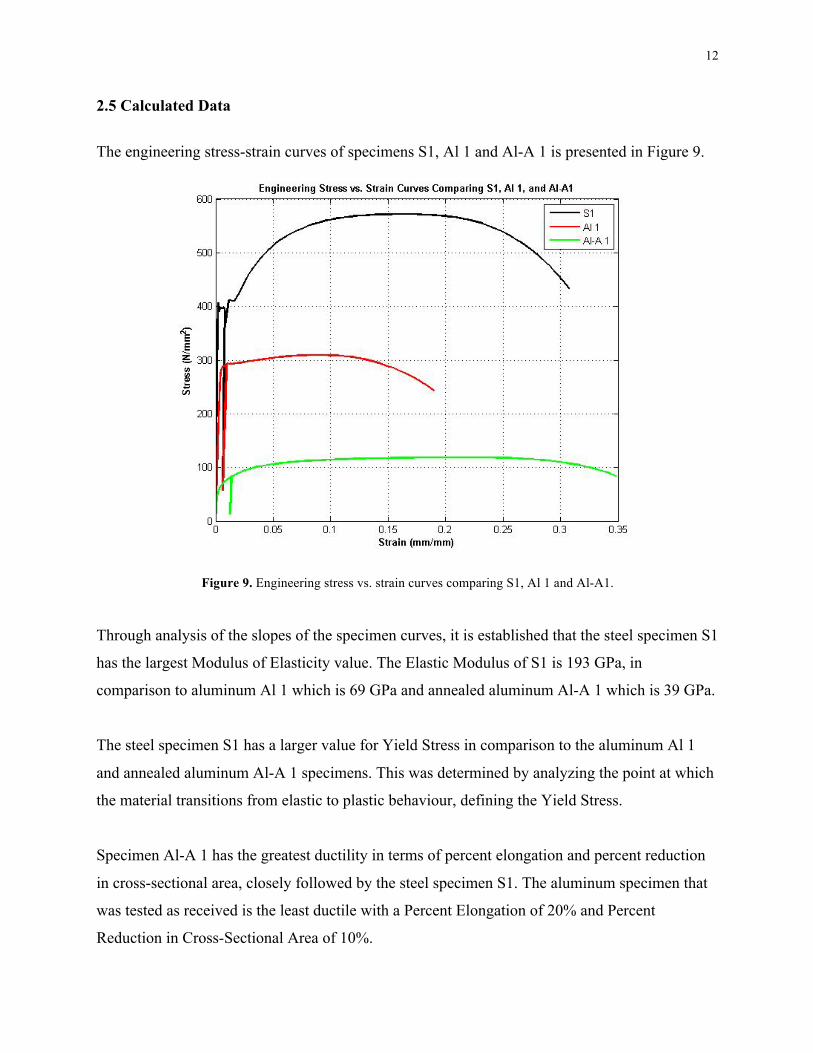
Figure 10. Stress vs. Strain Curves of Steel 350 W.
The Engineering Stress versus Strain curve of each steel sample tested is presented in Figure 10.
There is very little variability between all five specimens. The specimens follow a relatively
similar path along the stress-strain curve. The yield stress for each specimen varies noticeably,
ranging from 570.6 MPa to 585.3 MPa. Although specimen S5 produced the highest yield stress,
it had the lowest yield load due to a smaller initial cross-sectional area. Each specimen reached a
similar maximum load, differing by a value of 14.7 MPa. The corresponding maximum loads
differed by 300.6 kN. The displacement at failure of the specimens range from 15.84 mm to
17.02 mm, differing by 1.18 mm. Specimen S2 exhibited the greatest strain before failure, while
specimen S4 spanned the least.

14
Figure 11. Stress vs. Strain Curves of Aluminum 6061.
The engineering stress-strain curve of each aluminum sample tested is presented in Figure 11.
There is very little variability between the three specimens. The specimens follow a relatively
similar path along the stress-strain curve. The yield stress of each specimen varies slightly,
ranging from 287.4 MPa to 288.4 MPa. Specimen Al 2 exhibited the greatest yield stress
although Al 1 had the greatest ultimate stress of 309.5 MPa. Specimen Al 1 exhibited the greatest
strain prior to failure while specimen Al 2 endured the least strain prior to failure.
15
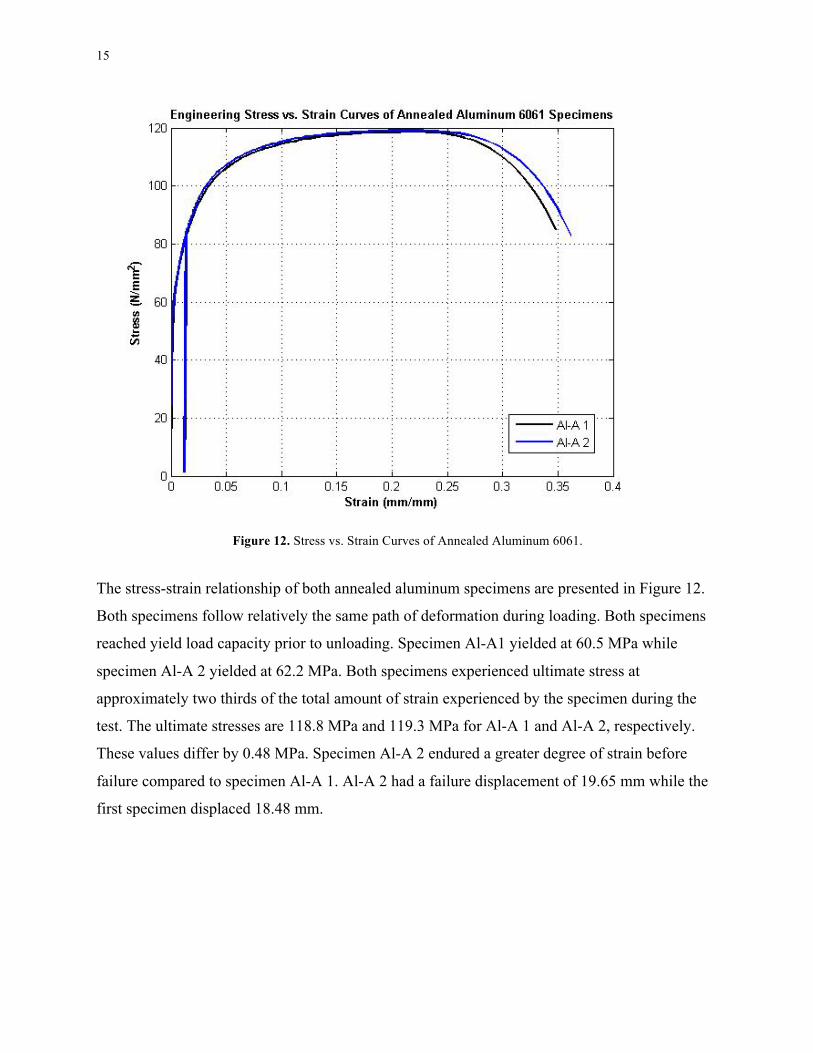
Figure 12. Stress vs. Strain Curves of Annealed Aluminum 6061.
The stress-strain relationship of both annealed aluminum specimens are presented in Figure 12.
Both specimens follow relatively the same path of deformation during loading. Both specimens
reached yield load capacity prior to unloading. Specimen Al-A1 yielded at 60.5 MPa while
specimen Al-A 2 yielded at 62.2 MPa. Both specimens experienced ultimate stress at
approximately two thirds of the total amount of strain experienced by the specimen during the
test. The ultimate stresses are 118.8 MPa and 119.3 MPa for Al-A 1 and Al-A 2, respectively.
These values differ by 0.48 MPa. Specimen Al-A 2 endured a greater degree of strain before
failure compared to specimen Al-A 1. Al-A 2 had a failure displacement of 19.65 mm while the
first specimen displaced 18.48 mm.

16
Figure 13. Engineering and true stress-strain curves of all specimens tested.
When analyzing the graphs of the engineering and true stress-strain curves for each specimen,
the ultimate stress can be determined by the point at which the engineering stress and the true
stress graphs diverge. Up until the ultimate stress point, both the engineering and true stress
graphs are nearly identical. The point at which the ultimate stress occurs is also when necking in
the material becomes evident. From analyzing the graphs in Figure 13, it can be seen that the
ultimate stress for all steel samples are approximately 570 MPa and occur at a strain of between
0.15 and 0.2. For the aluminum samples, all samples display an ultimate stress of approximately
287 MPa with a corresponding strain ranging between 0.8 and 1.0. Finally, the annealed
aluminum displays an ultimate stress of approximately 62 MPa at a strain ranging between 0.2
and 0.25.
2.6 Mechanical Properties
The mechanical properties of each specimen are summarized within Table 4. Practical
importance of each material property has been analyzed and discussed.

17
Table 4. Summary of mechanical properties of specimens.
Modulus of Elasticity (E) represents the resistance of a material to elastic deformation. (Callister,
2014). The importance of this design parameter can be seen in the design of bridges. There is a
restriction on the deflection amount of bridges. If the design parameter, E exceeds the accepted
deflection value, it does not abide by the safety factors.
Yield Stress is the point at which the behaviour of a material changes from elastic to plastic.
Knowledge of yield stress is important for design purposes to determine the maximum amount of
stress a material can withstand without causing permanent deformation. Designers attempt to
design in the elastic range of a material, implying that their material will withstand stresses only
less than the yield stress.
The Ultimate Tensile Stress (UTS) or Ultimate Stress (fu) is the maximum tensile stress a
material can withstand prior to failure. Ultimate tensile stresses are considered in civil
engineering applications to determine the amount of load a material can withstand before failure
of the material occurs. For example, the ultimate stress of steel cables required to support a
bridge will be considered during the design process to determine the maximum load capacity the
cables can withstand before failure.

18
Ductility is the degree of plastic deformation a material can sustain prior to the point of fracture.
It is the percent elongation (%EL) expressed using gauge length and percent reduction in cross-
section area (%RA) expressed using area. Therefore prior knowledge of the ductility of a
material may assist in selecting a particular material to use for a specific design, or how the
chosen material can be used in form work.
Resilience represents the capacity of a metal to absorb energy during elastic deformation. This
allows the material to deform upon loading, while being able to elastically return to its original
shape after the load is removed. Understanding the resilience of a material is key in designing
structures such as earthquake resistant buildings. These buildings absorb energy and deform
elastically so that there is no permanent damage caused to the building itself. The resilience or
the amount of energy a material can absorb is an important design parameter when designing
such buildings.
Toughness represents the capacity of a material to absorb energy up to the point of fracture.
Much like resilience, the toughness of a material can be useful in the design process of
earthquake resistant structures. This design parameter is not only used to determine how much
force a building can withstand, but also how much force the material can absorb prior to failure.

19
3.0 Data Interpretation
This section discusses the differences observed between the behaviour of steel, aluminum, and
annealed aluminum. The impact the annealing process on aluminum characteristics, as well as
the possible sources of error that were encountered during testing are analyzed and discussed in
this section.
Throughout the course of the testing, five Steel 350W samples, three Aluminum 6061 samples,
and two annealed Aluminum 6061 samples were tensile tested. All samples of the same material
displayed similar characteristics, with the exception of annealed aluminum, which displayed
varying values for the elastic modulus and the resilience modulus. The differences between the
two samples tested are considered when comparing all materials.
The elastic modulus of steel was approximately 65% greater than that of aluminum and 70%
greater than the elastic modulus of the first annealed aluminum sample and 65% greater than the
second annealed aluminum sample. Likewise, the yield stress of steel was 25% greater than yield
stress of aluminum and 85% greater than annealed aluminum, and the ultimate stress of steel was
45% greater than that of aluminum and 80% greater than that of annealed aluminum. Much in
the same way, the toughness of steel was 65% greater than that of aluminum samples, and 75%
greater than the annealed aluminum samples.
When considering ductility with respect to the elongation in the gauge length, the annealed
aluminum is approximately 15% more ductile than the steel and 50% more ductile than the
aluminum samples. For ductility with respect to the reduction in cross sectional area, again the
annealed aluminum was the most ductile, with its ductility being approximately 10% greater than
that of steel, and 25% more ductile than aluminum. For all materials, the ductility with respect to
gauge length was less than the ductility with respect to cross-sectional area.
For the resilience modulus, the aluminum samples had the greatest resilience modulus, which
was approximately 60% greater than that of steel, and 90% greater than that of annealed
aluminum.

20
3.1 The Effect of Annealing on Aluminum
When a material is annealed, the particles go through a three step process: recovery,
recrystallization, and grain growth (Walbridge, 2014). The recovery process is when thermal
energy is applied to the material, causing dislocations in the material to rearrange themselves
into energy configurations which are lower than the original configurations. This causes the
material to become more ductile and reduces the yield stress.
Recrystallization is when the newly configured material forms new strain-free grains, which
further reduces the yield stress and continues to make the material more ductile.
The grain growth process is when the newly formed grains continue to grow and eventually
overtake the original material, which decreases the amount of grain boundary, which in turn
reduces the strength of the material.
As seen by the mechanical properties of aluminum compared to annealed aluminum, the effect
that the annealing process has on aluminum is an approximately 80% decrease in the yield stress,
a 60% decrease in the ultimate stress, a 25% decrease in toughness, and a decrease in the
resilience modulus by 90%.
A 50% increase in the ductility with respect to the elongation in gauge length, and a 25%
increase in the ductility with respect to the reduction in the cross sectional area was also
observed.
3.2 Possible Errors
Throughout the course of testing, there were multiple sources for possible error to occur. For
instance, possible errors may have occurred due to approximation of data (rounding). For
example, when calculating the yield stress and ultimate stress, the values were limited to a
certain amount of significant digits.
Another possible error that may have occurred was interpretation of the graph. For example, the
elastic modulus (E) is calculated using the slope of the elastic deformation section of the stress

21
strain curve. To calculate E, data points are selected to calculate the slope, and the selected data
points may vary causing discrepancies in the calculated value of E for the same specimen.
As well, there was a large discrepancy between the two specimens of annealed aluminum with
respect to the elastic modulus and the resilience modulus values. This may have been caused by
the annealing process. If the recovery, recrystallization, or grain growth did not occur properly in
either one sample or the other, the properties of the samples would differ as well.

22
4.0 Conclusion Five samples of Steel 350W, three samples of Aluminum 6061, and two samples of annealed
Aluminum 6061 were tested to determine the following material properties: modulus of
elasticity, yield stress, ultimate stress, resilience, toughness, failure strain, percent elongation,
and percent area reduction.
The steel specimens had the greatest modulus of elasticity, yield stress, ultimate stress, and
toughness. This insinuates that steel resists deformation with a greater amount of force applied
compared to the aluminum and annealed aluminum.
Aluminum had the greatest modulus of resilience in comparison to the steel and annealed
aluminum specimens, which indicates that it was able to absorb the most amount of energy per
unit volume without plastically deforming.
The annealed aluminum specimens were more ductile compared to both the aluminum and the
steel specimens. Annealing of the aluminum had no effect on the elastic modulus of the material
but decreased the yield strength, the ultimate stress, the resilience modulus, and the toughness of
the material. Moreover, annealing aluminum caused the material to become more ductile than
untreated aluminum with respect to both percent elongation and percent reduction of the cross-
sectional area.
5.0 References
William D. Callister Jr. and David G. Rethwisch, “Materials Science and Engineering an Introduction: 9th Edition”, John Wiley and Sons Inc., 2014.
Lab Manual, “Lab #1—Tensile Testing of Metals”, 2014.
Walbridge S., “CivE 265 Structure and Properties of Materials—Course Notes Part 1”, 2014
23
6.0 Appendix
MATLAB Codes

24
% -- FORCE DISPLACEMENT GRAPHS
% Start of script -------------------------------------------------------- clc, close all, clear all, format long, clf % -- steel samples hold on figure(1) num1 = textread('S1.data.txt'); plot(num1(:,2),num1(:,1), 'o', 'markerfacecolor', 'k', 'markers', 5) grid on title('Force vs. Displacement of Steel: Sample 1') xlabel('Displacement (mm)'), ylabel('Force (kN)') figure(2) num2 = textread('S2.data.txt'); plot(num2(:,2),num2(:,1), 'o', 'markerfacecolor', 'k', 'markers', 5) grid on title('Force vs. Displacement of Steel: Sample 2') xlabel('Displacement (mm)'), ylabel('Force (kN)') figure(3) num2 = textread('S3.data.txt'); plot(num2(:,2),num2(:,1), 'o', 'markerfacecolor', 'k', 'markers', 5) grid on title('Force vs. Displacement of Steel: Sample 3') xlabel('Displacement (mm)'), ylabel('Force (kN)') figure(4) num2 = textread('S4.data.txt'); plot(num2(:,2),num2(:,1), 'o', 'markerfacecolor', 'k', 'markers', 5) grid on title('Force vs. Displacement of Steel: Sample 4') xlabel('Displacement (mm)'), ylabel('Force (kN)') figure(5) num2 = textread('S3.data.txt'); plot(num2(:,2),num2(:,1), 'o', 'markerfacecolor', 'k', 'markers', 5) grid on title('Force vs. Displacement of Steel: Sample 5') xlabel('Displacement (mm)'), ylabel('Force (kN)') % -- Aluminum samples figure(6) num2 = textread('Al1.data.txt'); plot(num2(:,2),num2(:,1), 'o', 'markerfacecolor', 'k', 'markers', 5) grid on title('Force vs. Displacement of Aluminum: Sample 1') xlabel('Displacement (mm)'), ylabel('Force (kN)') figure(7)

25
num2 = textread('Al2.data.txt'); plot(num2(:,2),num2(:,1), 'o', 'markerfacecolor', 'k', 'markers', 5) grid on title('Force vs. Displacement of Aluminum: Sample 2') xlabel('Displacement (mm)'), ylabel('Force (kN)') figure(8) num2 = textread('Al3.data.txt'); plot(num2(:,2),num2(:,1), 'o', 'markerfacecolor', 'k', 'markers', 5) grid on title('Force vs. Displacement of Aluminum: Sample 3') xlabel('Displacement (mm)'), ylabel('Force (kN)') % -- Annealed Aluminum samples figure(9) num2 = textread('AlAn1.data.txt'); plot(num2(:,2),num2(:,1), 'o', 'markerfacecolor', 'k', 'markers', 5) grid on title('Force vs. Displacement of Annealed Aluminum: Sample 1') xlabel('Displacement (mm)'), ylabel('Force (kN)') figure(10) num2 = textread('AlAn2.data.txt'); plot(num2(:,2),num2(:,1), 'o', 'markerfacecolor', 'k', 'markers', 5) grid on title('Force vs. Displacement of Annealed Aluminum: Sample 2') xlabel('Displacement (mm)'), ylabel('Force (kN)') % End of script ---------------------------------------------------------

26
% -- YIELD STRESS FOR STEEL SAMPLES % Start of script -------------------------------------------------------- clc, close all, clear all, format long g, x = linspace(0.002, 0.03, 500); gauge = 50.7; % -- Steel 1 sample num1 = textread('S1.data.txt'); area0_s1 = 12.75*9.64; stress_s1 = num1(:,1)/area0_s1; strain_s1 = num1(:,2)/gauge; m1 = (stress_s1(24) - stress_s1(1)) / (strain_s1(24) - strain_s1(1)); b1 = stress_s1(1) - strain_s1(1)*m1; y1 = x*m1 +b1; y1 = y1 - 405.501; plot( strain_s1, stress_s1, '-b', 'linewidth' , 2) hold on plot(x,y1, '--r', 'linewidth', 2) grid on, title('Yield Stress using 0.2% Rule for S1: Condensed Range') [xint1, yint1] = polyxpoly( strain_s1,stress_s1, x, y1) xlim([0,0.05]), ylim([0, 600]) % -- Steel 2 sample num2 = textread('S2.data.txt'); area0_s2 = 12.76*9.65; stress_s2 = num2(:,1)/area0_s2; strain_s2 = num2(:,2)/gauge; m2 = (stress_s2(80) - stress_s2(1)) / (strain_s2(80) - strain_s2(1)) b2 = stress_s2(1) - strain_s2(1)*m2; y2 = x*m2 +b2; y2 = y2 - 397.98; plot( strain_s2, stress_s2, '-b', 'linewidth' , 2) hold on plot(x,y2, '--r', 'linewidth', 2) ylim([0,600]) grid on [xint2, yint2] = polyxpoly( strain_s2,stress_s2, x, y2) % -- Steel 3 sample num3 = textread('S3.data.txt'); area0_s3 = 12.76*9.61; stress_s3 = num3(:,1)/area0_s3; strain_s3 = num3(:,2)/gauge; m3 = (stress_s3(80) - stress_s3(1)) / (strain_s3(80) - strain_s3(1)) b3 = stress_s3(1) - strain_s3(1)*m3; y3 = x*m3 +b3; y3 = y3 - 400.43; plot( strain_s3, stress_s3, '-b', 'linewidth' , 2) hold on

27
plot(x,y3, '--r', 'linewidth', 2) ylim([0,600]) grid on [xint3, yint3] = polyxpoly( strain_s3,stress_s3, x, y3) % -- Steel 4 sample num4 = textread('S4.data.txt'); area0_s4 = 12.8*9.56; stress_s4 = num4(:,1)/area0_s4; strain_s4 = num4(:,2)/gauge; m4 = (stress_s4(27) - stress_s4(1)) / (strain_s4(27) - strain_s4(1)) b4 = stress_s4(1) - strain_s4(1)*m4; y4 = x*m4 +b4; y4 = y4 - 414.14; plot( strain_s4, stress_s4, '-b', 'linewidth' , 2) hold on plot(x,y4, '--r', 'linewidth', 2) ylim([0,600]) grid on [xint4, yint4] = polyxpoly( strain_s4,stress_s4, x, y4) % -- Steel 5 sample num5 = textread('S5.data.txt'); area0_s5 = 12.8*9.56; stress_s5 = num5(:,1)/area0_s5; strain_s5 = num5(:,2)/gauge; m5 = (stress_s5(26) - stress_s5(1)) / (strain_s5(26) - strain_s5(1)) b5 = stress_s5(1) - strain_s5(1)*m5; y5 = x*m5 +b5; y5 = y5 - 407.14; plot( strain_s5, stress_s5, '-b', 'linewidth' , 2) hold on plot(x,y5, '--r', 'linewidth', 2) ylim([0,600]) grid on [xint5, yint5] = polyxpoly( strain_s5,stress_s5, x, y5) % End of script ---------------------------------------------------------
28
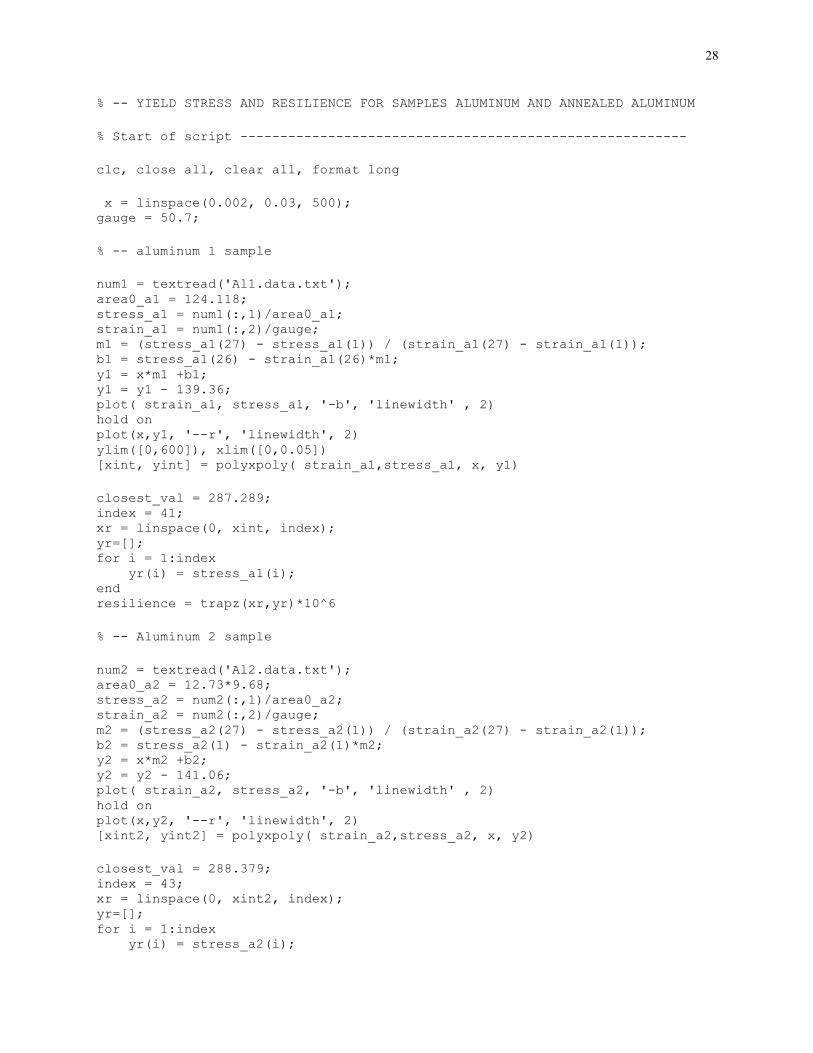
% -- YIELD STRESS AND RESILIENCE FOR SAMPLES ALUMINUM AND ANNEALED ALUMINUM % Start of script -------------------------------------------------------- clc, close all, clear all, format long x = linspace(0.002, 0.03, 500); gauge = 50.7; % -- aluminum 1 sample num1 = textread('Al1.data.txt'); area0_a1 = 124.118; stress_a1 = num1(:,1)/area0_a1; strain_a1 = num1(:,2)/gauge; m1 = (stress_a1(27) - stress_a1(1)) / (strain_a1(27) - strain_a1(1)); b1 = stress_a1(26) - strain_a1(26)*m1; y1 = x*m1 +b1; y1 = y1 - 139.36; plot( strain_a1, stress_a1, '-b', 'linewidth' , 2) hold on plot(x,y1, '--r', 'linewidth', 2) ylim([0,600]), xlim([0,0.05]) [xint, yint] = polyxpoly( strain_a1,stress_a1, x, y1) closest_val = 287.289; index = 41; xr = linspace(0, xint, index); yr=[]; for i = 1:index yr(i) = stress_a1(i); end resilience = trapz(xr,yr)*10^6 % -- Aluminum 2 sample num2 = textread('Al2.data.txt'); area0_a2 = 12.73*9.68; stress_a2 = num2(:,1)/area0_a2; strain_a2 = num2(:,2)/gauge; m2 = (stress_a2(27) - stress_a2(1)) / (strain_a2(27) - strain_a2(1)); b2 = stress_a2(1) - strain_a2(1)*m2; y2 = x*m2 +b2; y2 = y2 - 141.06; plot( strain_a2, stress_a2, '-b', 'linewidth' , 2) hold on plot(x,y2, '--r', 'linewidth', 2) [xint2, yint2] = polyxpoly( strain_a2,stress_a2, x, y2) closest_val = 288.379; index = 43; xr = linspace(0, xint2, index); yr=[]; for i = 1:index yr(i) = stress_a2(i);

29
end resilience = trapz(xr,yr)*10^6 % -- Aluminum 3 sample num3 = textread('Al3.data.txt'); area0_a3 = 12.72*9.78; stress_a3 = num3(:,1)/area0_a3; strain_a3 = num3(:,2)/gauge; m3 = (stress_a3(27) - stress_a3(1)) / (strain_a3(27) - strain_a3(1)); b3 = stress_a3(1) - strain_a3(1)*m3; y3 = x*m3 +b3; y3 = y3 - 139.31; plot( strain_a3, stress_a3, '-b', 'linewidth' , 2) hold on plot(x,y3, '--r', 'linewidth', 2) [xint3, yint3] = polyxpoly( strain_a3,stress_a3, x, y3) closest_val = 287.212; index = 42; xr = linspace(0, xint3, index); yr=[]; for i = 1:index yr(i) = stress_a3(i); end resilience = trapz(xr,yr)*10^6 % -- annealed aluminum 1 sample num4 = textread('AlAn1.data.txt'); area0_a4 = 12.72*9.76; stress_a4 = num4(:,1)/area0_a4; strain_a4 = num4(:,2)/gauge; m4 = (stress_a4(57) - stress_a4(53)) / (strain_a4(57) - strain_a4(53)); b4 = stress_a4(7) - strain_a4(7)*m4; y4 = x*m4 +b4; y4 = y4 - 105.333; plot( strain_a4, stress_a4, '-b', 'linewidth' , 2) hold on plot(x,y4, '--r', 'linewidth', 2) [xint4, yint4] = polyxpoly( strain_a4,stress_a4, x, y4) closest_val = 42.386; index = 3; xr = linspace(0, xint4, index); yr=[]; for i = 1:index yr(i) = stress_a4(i); end resilience = trapz(xr,yr)*10^6 % -- annealed aluminum 2 sample num5 = textread('AlAn2.data.txt'); area0_a5 = 12.71*9.75;

30
stress_a5 = num5(:,1)/area0_a5; strain_a5 = num5(:,2)/gauge; m5 = (stress_a5(5) - stress_a5(1)) / (strain_a5(5) - strain_a5(1)); b5 = stress_a5(1) - strain_a5(1)*m5; y5 = x*m5 + b5; y5 = y5 - 142.895646; plot( strain_a5, stress_a5, '-b', 'linewidth' , 2) hold on plot(x,y5, '--r', 'linewidth', 2) [xint5, yint5] = polyxpoly( strain_a5,stress_a5, x, y5) closest_val = 41.38461861; index = 8; xr = linspace(0, xint5, index); yr=[]; for i = 1:index yr(i) = stress_a5(i); end resilience = trapz(xr,yr)*10^6 % End of script ---------------------------------------------------------

31
% ENGINEERING AND TRUE STRESS VERSUS STRAIN GRAPHS % Start of Script --------------------------------------------------------- clc, clear, clf, close all gauge = 50.7; % ----- stress strain curve of S1 subplot(5,2,1) num1 = textread('S1.data.txt'); area0_s1 = 122.910; gauge_s1 = 50.7; stress_s1 = num1(:,1)/area0_s1; strain_s1 = num1(:,2)/gauge_s1; plot(strain_s1, stress_s1, 'k', 'linewidth',2) grid on area_final = 8.92*6.57; true_stress = num1(end,1)/area_final; hold on plot([0.164417909,num1(end,2)/gauge], [572.1254983, true_stress], '-r', 'linewidth', 2) num1(end,2)/gauge title('\bfEngineering and True Stress vs. Strain Curves of S1') xlabel('\bfStrain (mm/mm)') ylabel('\bfStress (N/mm^{2})') %----- stress strain curve of S2 subplot(5,2,2) num1 = textread('S2.data.txt'); area0_s2 = 123.134; gauge_s2 = 50.7; stress_s2 = num1(:,1)/area0_s2; strain_s2 = num1(:,2)/gauge_s2; plot(strain_s2, stress_s2, 'k', 'linewidth',2) grid on area_final = 8.93*6.46; true_stress = num1(end,1)/area_final; hold on plot([0.16736426,num1(end,2)/gauge], [570.5693959, true_stress], '-r', 'linewidth', 2) num1(end,2)/gauge title('\bfEngineering and True Stress vs. Strain Curves of S2') xlabel('\bfStrain (mm/mm)') ylabel('\bfStress (N/mm^{2})') % ----- stress strain curve of S3 subplot(5,2,3) num1 = textread('S3.data.txt'); area0_s3 = 122.624; gauge_s3 = 50.7; stress_s3 = num1(:,1)/area0_s3;

32
strain_s3 = num1(:,2)/gauge_s3; plot(strain_s3, stress_s3, 'k', 'linewidth',2) grid on area_final = 9.1*6.64; true_stress = num1(end,1)/area_final; hold on plot([0.157131844,num1(end,2)/gauge], [572.2293914, true_stress], '-r', 'linewidth', 2) num1(end,2)/gauge title('\bfEngineering and True Stress vs. Strain Curves of S3') xlabel('\bfStrain (mm/mm)') ylabel('\bfStress (N/mm^{2})') % ----- stress strain curve of S4 subplot(5,2,4) num1 = textread('S4.data.txt'); area0_s4 = 122.368; gauge_s4 = 50.7; stress_s4 = num1(:,1)/area0_s4; strain_s4 = num1(:,2)/gauge_s4; area_final = 8.53*6.36; true_stress = num1(end,1)/area_final; hold on plot([0.148772694,num1(end,2)/gauge], [572.2030596, true_stress], '-r', 'linewidth', 2) num1(end,2)/gauge plot(strain_s4, stress_s4, 'k', 'linewidth',2) grid on title('\bfEngineering and True Stress vs. Strain Curves of S4') xlabel('\bfStrain (mm/mm)') ylabel('\bfStress (N/mm^{2})') % ----- stress strain curve of S5 subplot(5,2,5) num1 = textread('S5.data.txt'); area0_s5 = 122.368; gauge_s5 = 50.7; stress_s5 = num1(:,1)/area0_s5; strain_s5 = num1(:,2)/gauge_s5; plot(strain_s5, stress_s5, 'k', 'linewidth',2) grid on area_final = 9.18*6.75; true_stress = num1(end,1)/area_final; hold on

33
plot([0.153975393,num1(end,2)/gauge], [585.2903459, true_stress], '-r', 'linewidth', 2) num1(end,2)/gauge title('\bfEngineering and True Stress vs. Strain Curves of S5') xlabel('\bfStrain (mm/mm)') ylabel('\bfStress (N/mm^{2})') % ----- stress strain curve of Al 1 subplot(5,2,6) num1 = textread('Al1.data.txt'); area0_Al1 = 124.118; gauge_Al1 = 50.7; stress_Al1 = num1(:,1)/area0_Al1; strain_Al1 = num1(:,2)/gauge_Al1; plot(strain_Al1, stress_Al1, 'k', 'linewidth',2) grid on area_final = 10.5*6.96; true_stress = num1(end,1)/area_final; hold on plot([0.086418355,num1(end,2)/gauge], [309.4597216, true_stress], '-r', 'linewidth', 2) num1(end,2)/gauge title('\bfEngineering and True Stress vs. Strain Curves of Al 1') xlabel('\bfStrain (mm/mm)') ylabel('\bfStress (N/mm^{2})') % ----- stress strain curve of Al 2 subplot(5,2,7) num1 = textread('Al2.data.txt'); area0_Al2 = 123.226; gauge_Al2 = 50.7; stress_Al2 = num1(:,1)/area0_Al2; strain_Al2 = num1(:,2)/gauge_Al2; hold on plot(strain_Al2, stress_Al2, 'k', 'linewidth',2) grid on area_final = 10.61*6.95; true_stress = num1(end,1)/area_final; hold on plot([0.083560633,num1(end,2)/gauge], [308.6448927, true_stress], '-r', 'linewidth', 2) num1(end,2)/gauge title('\bfEngineering and True Stress vs. Strain Curves of Al 2') xlabel('\bfStrain (mm/mm)') ylabel('\bfStress (N/mm^{2})')
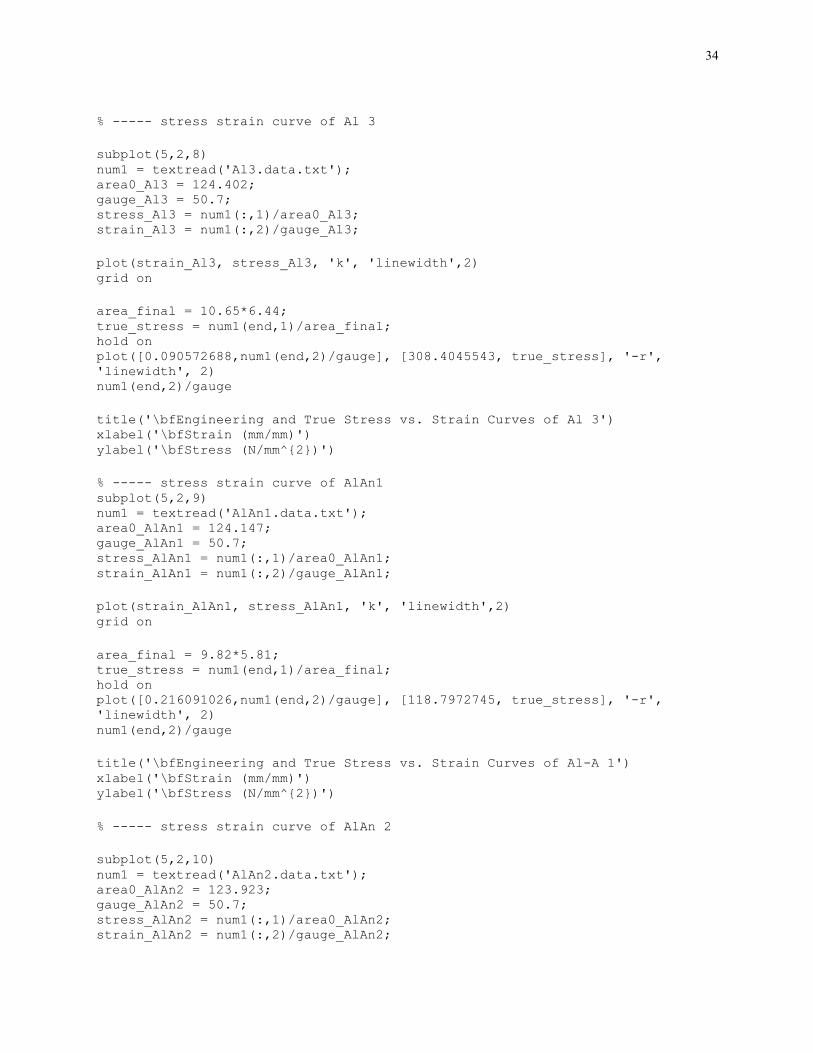
34
% ----- stress strain curve of Al 3 subplot(5,2,8) num1 = textread('Al3.data.txt'); area0_Al3 = 124.402; gauge_Al3 = 50.7; stress_Al3 = num1(:,1)/area0_Al3; strain_Al3 = num1(:,2)/gauge_Al3; plot(strain_Al3, stress_Al3, 'k', 'linewidth',2) grid on area_final = 10.65*6.44; true_stress = num1(end,1)/area_final; hold on plot([0.090572688,num1(end,2)/gauge], [308.4045543, true_stress], '-r', 'linewidth', 2) num1(end,2)/gauge title('\bfEngineering and True Stress vs. Strain Curves of Al 3') xlabel('\bfStrain (mm/mm)') ylabel('\bfStress (N/mm^{2})') % ----- stress strain curve of AlAn1 subplot(5,2,9) num1 = textread('AlAn1.data.txt'); area0_AlAn1 = 124.147; gauge_AlAn1 = 50.7; stress_AlAn1 = num1(:,1)/area0_AlAn1; strain_AlAn1 = num1(:,2)/gauge_AlAn1; plot(strain_AlAn1, stress_AlAn1, 'k', 'linewidth',2) grid on area_final = 9.82*5.81; true_stress = num1(end,1)/area_final; hold on plot([0.216091026,num1(end,2)/gauge], [118.7972745, true_stress], '-r', 'linewidth', 2) num1(end,2)/gauge title('\bfEngineering and True Stress vs. Strain Curves of Al-A 1') xlabel('\bfStrain (mm/mm)') ylabel('\bfStress (N/mm^{2})') % ----- stress strain curve of AlAn 2 subplot(5,2,10) num1 = textread('AlAn2.data.txt'); area0_AlAn2 = 123.923; gauge_AlAn2 = 50.7; stress_AlAn2 = num1(:,1)/area0_AlAn2; strain_AlAn2 = num1(:,2)/gauge_AlAn2;

35
hold on plot(strain_AlAn2, stress_AlAn2, 'k', 'linewidth',2) grid on area_final = 9.3*5.32; true_stress = num1(end,1)/area_final; hold on plot([0.202050828,num1(end,2)/gauge], [119.2947366, true_stress], '-r', 'linewidth', 2) num1(end,2)/gauge title('\bfEngineering and True Stress vs. Strain Curves of Al-A 2') xlabel('\bfStrain (mm/mm)') ylabel('\bfStress (N/mm^{2})') % End of Script -----------------------------------------------------------


