Lab on a Chip · PDF fileLab on a Chip PAPER Cite this: Lab Chip,2017,17,4059 Received 9th...
11
Lab on a Chip PAPER Cite this: Lab Chip, 2017, 17, 4059 Received 9th July 2017, Accepted 3rd October 2017 DOI: 10.1039/c7lc00715a rsc.li/loc Enhanced surface acoustic wave cell sorting by 3D microfluidic-chip design W. L. Ung, a K. Mutafopulos, a P. Spink, a R. W. Rambach, b T. Franke * b and D. A. Weitz ac We demonstrate an acoustic wave driven microfluidic cell sorter that combines advantages of multilayer device fabrication with planar surface acoustic wave excitation. We harness the strong vertical component of the refracted acoustic wave to enhance cell actuation by using an asymmetric flow field to increase cell deflection. Precise control of the 3-dimensional flow is realized by topographical structures implemented on the top of the microchannel. We experimentally quantify the effect of the structure dimensions and acoustic parameter. The design attains cell sorting rates and purities approaching those of state of the art fluorescence-activated cell sorters with all the advantages of microfluidic cell sorting. Introduction Fluorescence-activated cell sorting (FACS) is a method for extracting desired cells based on their biological characteris- tics. 1 These characteristics are distinguished using fluorescence-based assays. A sheath flow focuses cells to a narrow stream, accelerating cells to high velocity and separat- ing them along the direction of flow. This stream must be aligned with the optics of the instrument to make accurate measurements. To sort cells, the fluid stream is broken into droplets that contain single cells. Droplets containing target cells are selectively charged and subsequently deflected in an electric field. The entire process occurs rapidly enough for FACS instruments to operate at rates as high as tens of kHz, while still retaining high purity. 1,2 However, FACS also suffers from several limitations of the technique: the large volumes of sheath fluid required to reach high velocities make it diffi- cult to sort small numbers of cells; 3 moreover, the droplet aerosol produced during sorting poses a potential biohazard when using infectious cells. 1,4,5 One way to overcome these limitations is to use microfluidic devices composed of micro- scale flow channels that can handle minute volumes of fluid in a closed device without producing drops. 6,7 The small vol- ume of each microfluidic device reduces the dead volume of the system and minimizes the loss of sample. Alignment of microfluidic devices is simplified because the flow channels are embedded reproducibly within each device; moreover, cross contamination between different samples can be elimi- nated by replacing the device, rather than cleaning it. Further- more, microfluidic devices can sort cells without producing aerosols, alleviating the potential risks associated with sorting hazardous samples. 8–10 Microfluidic cell sorters implement a variety of actuation mechanisms, such as piezoelectric actua- tion, 11 dielectrophoresis of droplets, 10,12,13 optical manipula- tion such as pulsed laser induced cavitation, 9,14 and surface acoustic wave (SAW) deflection. 8,15,16 In spite of the benefits of microfluidic devices for cell sorting, they are not widely used because microfluidic devices cannot match the speed of FACS instruments; to become widely used, microfluidic de- vices must be able to sort at higher rates. 5 Surface acoustic waves have the potential to reach high rates, offering a robust and contactless microfluidic method for sorting cells by sound using high speed electronics. 17 Devices exciting stand- ing acoustic waves have been used to dynamically pattern the acoustic field within the microchannel to achieve fine control over each cell's spatial position, 15,16,18–21 but they have yet to reach rates comparable to FACS, when used to perform the sorting. In SAW devices using standing waves the acoustic wavelength determines the pressure node spacing that is used to separate the cells and that is therefore fixed for a desired node spacing. Traveling SAW devices can be operated at dif- ferent frequencies without changing the device design, en- abling the use of increasing frequencies to increase the acous- tic force exploited for sorting without changing the device design, 22 and therefore are promising and versatile candi- dates for high speed microfluidic sorting even though yet they do not reach FACS rates. However, if these devices could be improved by developing a more efficient way to exploit the Lab Chip, 2017, 17, 4059–4069 | 4059 This journal is © The Royal Society of Chemistry 2017 a School of Engineering and Applied Sciences, Harvard University, Cambridge, MA, 02138, USA b Biomedical Engineering, School of Engineering, University of Glasgow, Glasgow, G12 8QQ, UK. E-mail: [email protected] c Department of Physics, Harvard University, Cambridge, MA, 02138, USA Open Access Article. Published on 03 October 2017. Downloaded on 22/03/2018 23:22:39. This article is licensed under a Creative Commons Attribution 3.0 Unported Licence. View Article Online View Journal | View Issue
Transcript of Lab on a Chip · PDF fileLab on a Chip PAPER Cite this: Lab Chip,2017,17,4059 Received 9th...

Lab on a Chip
PAPER
Cite this: Lab Chip, 2017, 17, 4059
Received 9th July 2017,Accepted 3rd October 2017
DOI: 10.1039/c7lc00715a
rsc.li/loc
Enhanced surface acoustic wave cell sorting by 3Dmicrofluidic-chip design
W. L. Ung, a K. Mutafopulos, a P. Spink, a R. W. Rambach,b
T. Franke *b and D. A. Weitz ac
We demonstrate an acoustic wave driven microfluidic cell sorter that combines advantages of multilayer
device fabrication with planar surface acoustic wave excitation. We harness the strong vertical component
of the refracted acoustic wave to enhance cell actuation by using an asymmetric flow field to increase cell
deflection. Precise control of the 3-dimensional flow is realized by topographical structures implemented
on the top of the microchannel. We experimentally quantify the effect of the structure dimensions and
acoustic parameter. The design attains cell sorting rates and purities approaching those of state of the art
fluorescence-activated cell sorters with all the advantages of microfluidic cell sorting.
Introduction
Fluorescence-activated cell sorting (FACS) is a method forextracting desired cells based on their biological characteris-tics.1 These characteristics are distinguished usingfluorescence-based assays. A sheath flow focuses cells to anarrow stream, accelerating cells to high velocity and separat-ing them along the direction of flow. This stream must bealigned with the optics of the instrument to make accuratemeasurements. To sort cells, the fluid stream is broken intodroplets that contain single cells. Droplets containing targetcells are selectively charged and subsequently deflected in anelectric field. The entire process occurs rapidly enough forFACS instruments to operate at rates as high as tens of kHz,while still retaining high purity.1,2 However, FACS also suffersfrom several limitations of the technique: the large volumesof sheath fluid required to reach high velocities make it diffi-cult to sort small numbers of cells;3 moreover, the dropletaerosol produced during sorting poses a potential biohazardwhen using infectious cells.1,4,5 One way to overcome theselimitations is to use microfluidic devices composed of micro-scale flow channels that can handle minute volumes of fluidin a closed device without producing drops.6,7 The small vol-ume of each microfluidic device reduces the dead volume ofthe system and minimizes the loss of sample. Alignment ofmicrofluidic devices is simplified because the flow channels
are embedded reproducibly within each device; moreover,cross contamination between different samples can be elimi-nated by replacing the device, rather than cleaning it. Further-more, microfluidic devices can sort cells without producingaerosols, alleviating the potential risks associated with sortinghazardous samples.8–10 Microfluidic cell sorters implement avariety of actuation mechanisms, such as piezoelectric actua-tion,11 dielectrophoresis of droplets,10,12,13 optical manipula-tion such as pulsed laser induced cavitation,9,14 and surfaceacoustic wave (SAW) deflection.8,15,16 In spite of the benefitsof microfluidic devices for cell sorting, they are not widelyused because microfluidic devices cannot match the speed ofFACS instruments; to become widely used, microfluidic de-vices must be able to sort at higher rates.5 Surface acousticwaves have the potential to reach high rates, offering a robustand contactless microfluidic method for sorting cells bysound using high speed electronics.17 Devices exciting stand-ing acoustic waves have been used to dynamically pattern theacoustic field within the microchannel to achieve fine controlover each cell's spatial position,15,16,18–21 but they have yet toreach rates comparable to FACS, when used to perform thesorting. In SAW devices using standing waves the acousticwavelength determines the pressure node spacing that is usedto separate the cells and that is therefore fixed for a desirednode spacing. Traveling SAW devices can be operated at dif-ferent frequencies without changing the device design, en-abling the use of increasing frequencies to increase the acous-tic force exploited for sorting without changing the devicedesign,22 and therefore are promising and versatile candi-dates for high speed microfluidic sorting even though yet theydo not reach FACS rates. However, if these devices could beimproved by developing a more efficient way to exploit the
Lab Chip, 2017, 17, 4059–4069 | 4059This journal is © The Royal Society of Chemistry 2017
a School of Engineering and Applied Sciences, Harvard University, Cambridge, MA,
02138, USAb Biomedical Engineering, School of Engineering, University of Glasgow, Glasgow,
G12 8QQ, UK. E-mail: [email protected] Department of Physics, Harvard University, Cambridge, MA, 02138, USA
Ope
n A
cces
s A
rtic
le. P
ublis
hed
on 0
3 O
ctob
er 2
017.
Dow
nloa
ded
on 2
2/03
/201
8 23
:22:
39.
Thi
s ar
ticle
is li
cens
ed u
nder
a C
reat
ive
Com
mon
s A
ttrib
utio
n 3.
0 U
npor
ted
Lic
ence
.
View Article OnlineView Journal | View Issue

4060 | Lab Chip, 2017, 17, 4059–4069 This journal is © The Royal Society of Chemistry 2017
sound pulse for deflection, traveling SAW devices would bemore widely adopted for cell sorting applications.
Here, we demonstrate a microfluidic cell sorter based ontraveling SAW actuation that screens and sorts cells at ratesapproaching those of commercial FACS instruments. The de-vice contains multi-layer features that enhance the capabili-ties of a SAW sorter by harnessing the component of theacoustic wave oriented normal to the plane of the substrate.The multi-layer features consist of a three-dimensional flow-focusing nozzle and a slanted ceiling groove, which guidescells to the retention outlet following SAW deflection. Wefind operating conditions which yield efficient sorting in thisdevice, and sort fluorescently-labelled cells from mixed sam-ples. The device achieves sorting at a rate of 9000 events pers with 60% purity and yields of 92% purity, while operatingat 1000 events per s; this level of performance approachesthat of a FACS instrument operating in its high-purity mode.
Results and discussion
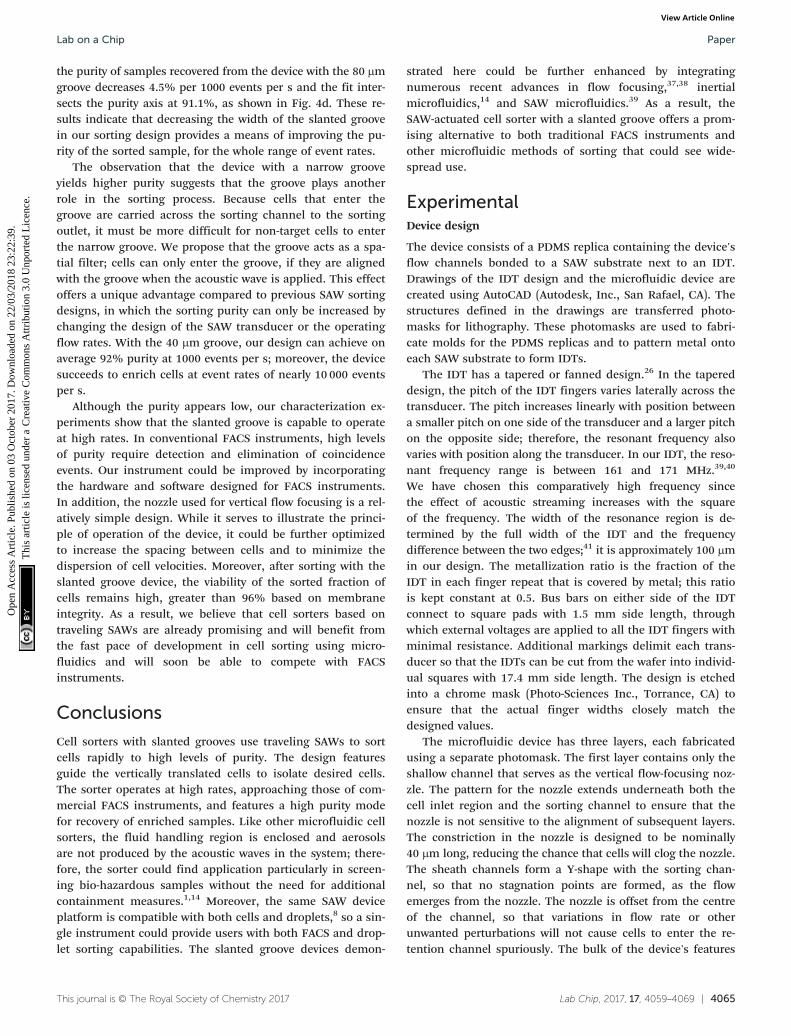
A SAW that impinge on the interface of a fluid in a micro-fluidic device, refracts and establishes longitudinal acousticwaves in the fluid, as shown in Fig. 1a.23 The angle of refrac-tion for SAWs is known as the Rayleigh angle, θR, and de-pends on the speed of sound in the liquid, vl, and the speedof the SAW on the substrate, vs, according to Snell's law, sinθR = vl/vs.
23,24 The refracted acoustic wave exerts forcesaligned with the direction of wave propagation on cellsflowing through the microfluidic device.7,17,22,24,25 Becausethe SAW travels along the lithium niobate surface severaltimes faster than the acoustic wave in the liquid,26 therefracted wave is largely aligned with the substrate's surfacenormal.27 The device is oriented such that the refracted wavepushes cells mainly upward in the vertical, or +z, direction.We present a device that sorts cells based on their vertical de-flection actuated by the refracted acoustic wave. We couldnot observe the formation of standing acoustic waves causedby the acoustic reflection at channel walls as has beenreported elsewhere,28–30 probably of the small impedancemismatch of the fluid and PDMS material and the channeldimensions. We also did not observe any near field effectsuch as streaming roll as has been reported in Devendranet al.,31 or acoustic interference patterns32 because of theshort pulse length and the comparatively large size of thecells. The proposed design enhances sorting performance,because it harnesses a larger proportion of the power carriedby the SAW. We achieve this by a 3-dimensional design of themicrofluidic channel.
In our design, the microfluidic device is bonded directlyonto a lithium niobate substrate adjacent to an interdigitaltransducer (IDT). When a RF signal is applied, the IDT gener-ates travelling SAWs. Acoustic waves are excited in the chan-nel adjacent to the IDT, in what is referred to as the sortingregion of the device. Cells enter the sorting region of the de-vice through the vertical flow-focusing nozzle. A slantedgroove extends above the sorting region and enhances the de-
flection of cells by acoustic waves. Immediately after thesorting region, the device's main channel bifurcates: each cell
Fig. 1 A multi-layer design for cell sorting with surface acoustic waves(a) a cross-section of the device is shown to illustrate the refraction ofsurface acoustic waves. The interdigital transducer (gold) generates asurface acoustic wave (purple). The surface acoustic wave travelsalong the substrate surface (white rectangle) in the +y direction. Thesurface acoustic wave refracts, upon contact with the fluid (light blue)within the microfluidic device, forming a longitudinal acoustic wave(red arrows) in the liquid. Refraction occurs at a small Rayleigh angle,θR. The refracted acoustic wave exerts an acoustic radiation pressureon the cells (white circle) as well as driving fluid flow by acousticstreaming (blue arrow). (b) The design developed for cell sorting usingsurface acoustic waves is illustrated. The flow channel of the micro-fluidic device (blue) is positioned next to the interdigital transducer(IDT). The flow channel has a cell inlet and two sheath inlets throughwhich the sample and sheath flows for flow focusing are injected re-spectively. The cell phase flow and sheath flows meet at the verticalflow-focusing nozzle; cells flow through the vertical flow-focusingnozzle into the sorting region of the device (red rectangle). Cells areprobed by the optical system and a sorting pulse is applied, when atarget cell is detected. Desired cells are sorted using acoustic wavesand are deflected to leave the sorting region through the sorting out-let, while the rest of the cells pass through the sorting regionunperturbed via the default outlet. (c) After the flow focusing nozzle,sheath flows (blue arrows) confine the flow from the cell inlet (greendashed line) into a narrow thread at the bottom of the channel. At thetop of the channel, the flow is pulled across the channel by the slantedgroove (red arrows). The fluid within the groove flows along thegroove's long axis, but the flow of liquid at the bottom of the channelis largely unperturbed. (d) Cells lacking the desired characteristics(white circles) are not sorted and exit the device through the wasteoutlet without interacting with the flow within the groove. (e) If a tar-get cell (green circles) is detected, surface acoustic waves are applied(purple arrows). They refract into the device and deflect the cell intothe groove, where it is carried by the flow within the groove across thechannel and out of the device through the retention outlet.
Lab on a ChipPaper
Ope
n A
cces
s A
rtic
le. P
ublis
hed
on 0
3 O
ctob
er 2
017.
Dow
nloa
ded
on 2
2/03
/201
8 23
:22:
39.
Thi
s ar
ticle
is li
cens
ed u
nder
a C
reat
ive
Com
mon
s A
ttrib
utio
n 3.
0 U
npor
ted
Lic
ence
.View Article Online

Lab Chip, 2017, 17, 4059–4069 | 4061This journal is © The Royal Society of Chemistry 2017
either flows directly into the default outlet or acoustic wavesactuate the cell into the sorting outlet. The positions of thedistinct features of the sorting device with respect to the IDTare shown in Fig. 1b.
The design uses multi-layer features to create flows withvertical components. The vertical flow-focusing nozzle is amulti-layer feature formed at the intersection of the cellphase inlet with the channels containing the sheath flow.The cell inlet channel has a vertical constriction just prior towhere it converges with the sheath channels, so the sheathflows focus the cell sample phase laterally and downwardinto a narrow thread at the bottom of the channel.33 This en-sures that all cells flow along the bottom of the channel andare confined into a small region initially. If cells manage toreach the top of the channel by acoustic deflection, theyinteract with a different multi-layer feature, the slanted ceil-ing groove. The slanted groove channels fluid along thegroove, setting up a flow that carries cells laterally across thesorting region of the device. The magnitude of the lateralflow decreases with distance from the groove,34 and it is neg-ligible at the bottom of the channel. The flows created by themulti-layer features of the device are illustrated in Fig. 1c.Cells can thus be sorted based on their vertical position, be-cause the flow in the groove directs cells at different heightsinto different outlets.
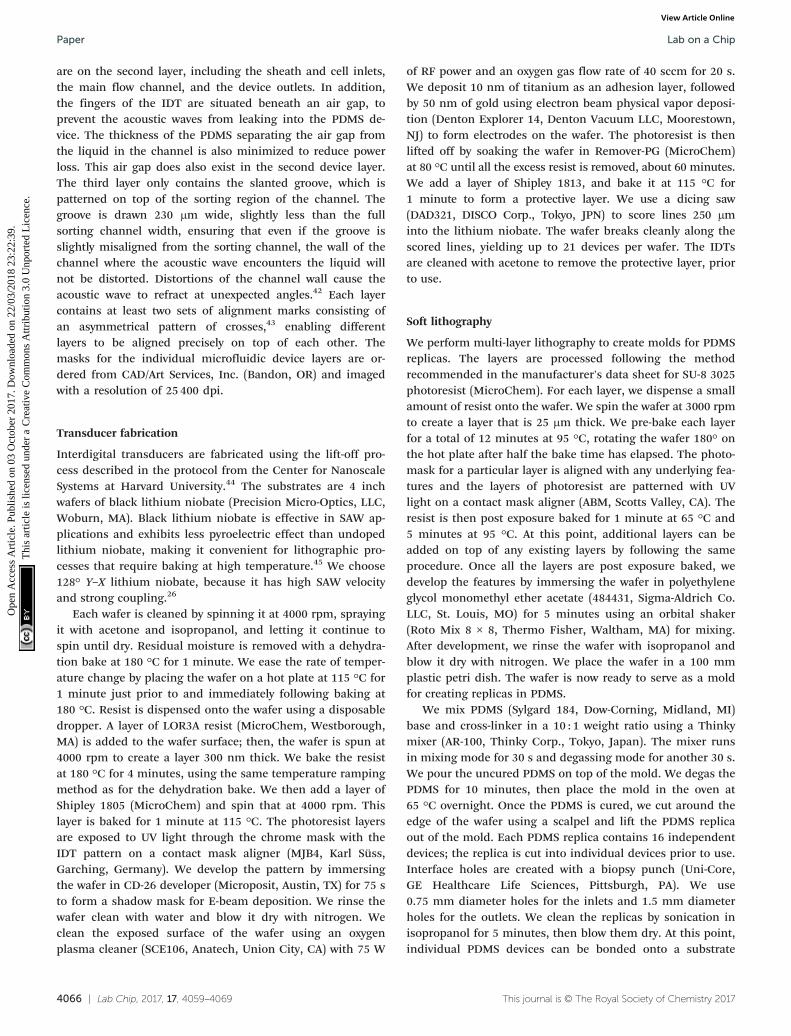
The vertical position of cells can be set by triggered acous-tic wave actuation. In the absence of acoustic waves, cellstransit directly through the sorting region of the device andleave through the default outlet without interacting with theslanted groove, as shown in Fig. 1d. However, an acousticwave pulse can deflect target cells, using the refracted waveto selectively push cells vertically to the top of the sortingchannel. At the top of the channel, the flow within theslanted groove guides these cells laterally across the sortingchannel and into the sorting outlet, as shown in Fig. 1e. Theexperimentally observed cell tracks captured during deviceoperation verify that cells follow these expected trajectorieswith and without acoustic wave actuation, as illustrated inFig. 2a and b respectively. Although cells are still deflectedwithout a slanted groove, the lateral displacement is muchsmaller as compared to deflection with the groove, asdepicted in the cell track shown in Fig. 2c. Thus, the slantedgroove only interacts with cells deflected by the refractedwave converting their vertical motion into lateral motion thatcan be used to segregate cells.
To quantify the sorting success and to optimize deviceswith slanted grooves, we measure the sorting performanceusing the tracks of moving cells. When a pulse of acousticwaves is applied to a cell, we use a high-speed camera to re-cord the corresponding cell track; we combine the resultsfrom several cell tracks to determine a sorting success rate. Ifwe increase the power carried by the acoustic wave, we canincrease the sorting success rate. For every condition we test,we measure how much power is required to exceed a 90%success rate and define this as the threshold power. More-over, if we operate in a regime where the power required is
Fig. 2 The slanted groove enhances cell deflection using surfaceacoustic waves. Fast camera movies are captured as cells flow throughthe sorting region of the slanted groove device. Multiple frames from asingle cell transit event are superimposed to create an image depictingthe trajectory of a cell passing through the device (flow direction fromtop to bottom). (a) When no pulse is applied, the cell follows straightalong the same trajectory as the bulk of the cell phase fluid. The cellpasses through the sorting region and underneath the slanted groovewithout deflection and exits the device through the default outlet(waste outlet). (b) When a cell is detected, a radio frequency signal of38.26 dBm is applied for 100 μs to generate a surface acoustic wavepulse. In the device with a slanted groove, the refracted acoustic wavedeflects the cell into the slanted groove, where it is carried across thesorting region of the channel by the flow of sheath fluid within thegroove. The sorted cell moves laterally more than 150 μm and exitsthe device through the sorting outlet. (c) For devices without a slantedgroove, the sorted cell is still deflected by the acoustic wave, but thecell is only displaced about 50 μm laterally under the same acousticconditions. In all cases, the cell phase fluid is visible as a dark thread inthe images, because of the index of refraction difference between thesheath fluid, phosphate-buffered saline, and the cell phase containingOptiprep. The cell tracks depicted here are projections of about20 frames measured with a high-speed camera at 11 267 fps. The scalebars correspond to 50 μm. (d) Cross sectional view of the micro-channels in (c).
Lab on a Chip Paper
Ope
n A
cces
s A
rtic
le. P
ublis
hed
on 0
3 O
ctob
er 2
017.
Dow
nloa
ded
on 2
2/03
/201
8 23
:22:
39.
Thi
s ar
ticle
is li
cens
ed u
nder
a C
reat
ive
Com
mon
s A
ttrib
utio
n 3.
0 U
npor
ted
Lic
ence
.View Article Online

4062 | Lab Chip, 2017, 17, 4059–4069 This journal is © The Royal Society of Chemistry 2017
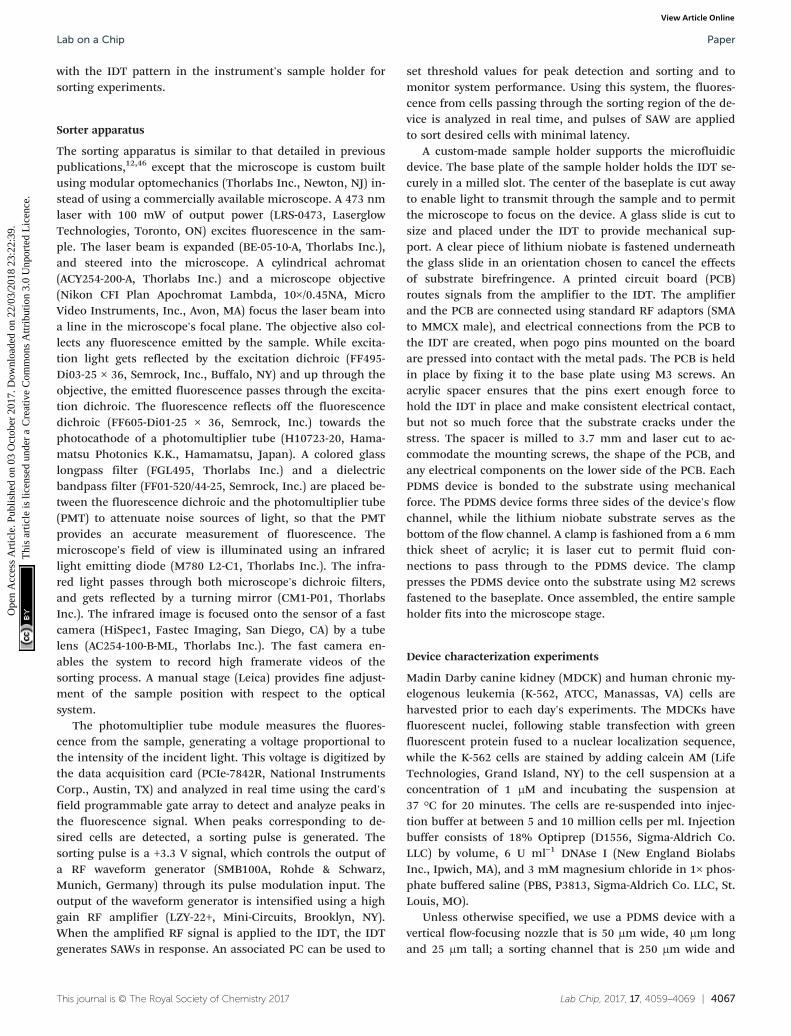
below the threshold power, we expect better sorting perfor-mance. We observe how cell velocity and acoustic wave pulselength affect the sorting performance to determine thescreening rate these devices can achieve. We also measurehow well different types of cells can be sorted. In addition,we want to understand how the geometry of the groove im-pacts sorting performance. For these devices, the parametersare coupled, so we vary one parameter at a time to under-stand the overall behaviour of the device. To ensure that re-sults are reproducible, the threshold power is determined onthree different days and with at least 48 individual experi-ments that are evaluated and averaged as shown in Fig. 2and 3. The threshold power was tested against flow rate,pulse length, groove width, and groove height as shown inFig. 3 to determine the ideal threshold power. We aim to findsettings that can yield sorting at high event rates by choosing
a high cell velocity and a low pulse length; however, we keepthe sorting success high using groove dimensions that enablesorting at low power levels and exceeding the thresholdpower.
Dependence on flow velocity
The velocity at which cells transit through the sorting regionof the device limits the screening rate of the device because iteffects the exposure time of the cell to the acoustics. More-over, if a cell is still in the sorting region of the device whenthe next cell enters the region of deflection, the two cells can-not be sorted independently. To prevent this, cells must tran-sit quickly through the sorting region of the device. We varythe total flow rate to control the average cell velocity and de-termine its effect on the sorting process. At low flow rates,
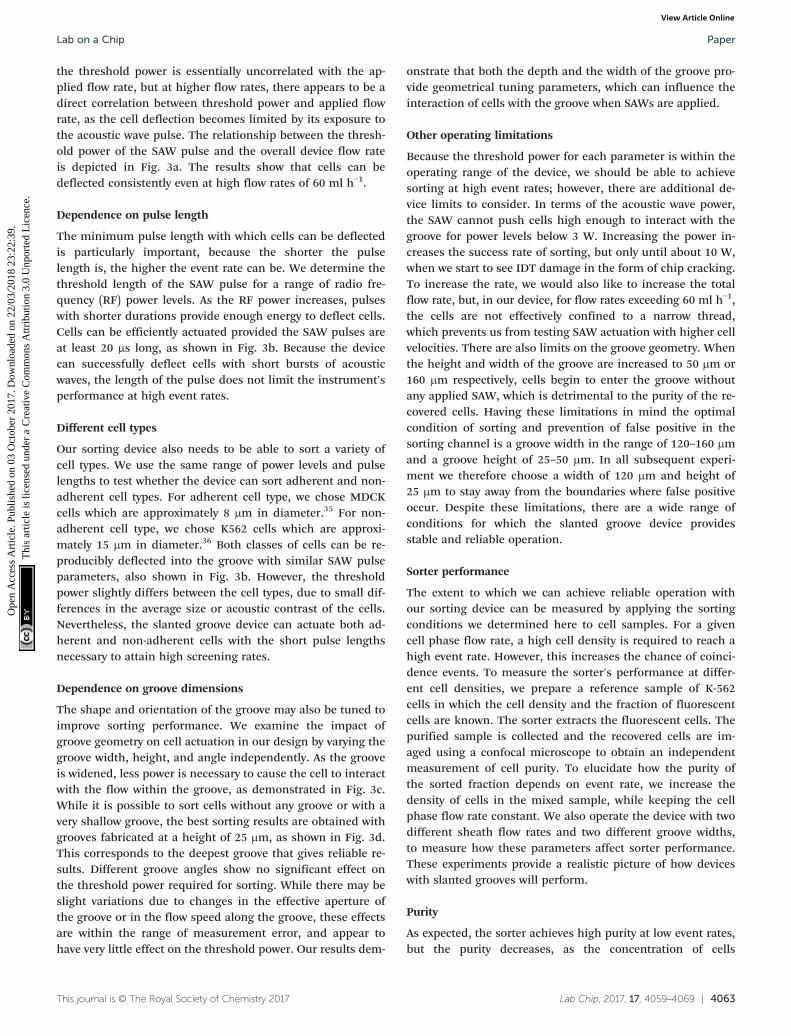
Fig. 3 Cell sorting performance of groove-enhanced devices. Sorting devices with slanted grooves reliably actuate cells for a wide range of oper-ating conditions. The symbols on each plot are centered on the mean of the three independent threshold values, while the error bars depict thefull range of threshold values. For points without visible error bars, the marker size exceeds the extent of the error bars. We only varied one param-eter at a time and kept the other parameters constant. We used a groove width of 120 μm, a height of 25 μm, flow rate of 45.5 ml h−1 and a pulselength of 50 μs. (a) As the flow rate is varied, the threshold power required for sorting increases, except at the lower range of flow rates, where itappears there is a minimum amount of power necessary for sorting. (b) As the applied radio frequency power is increased, the length of the pulsenecessary to deflect a given cell type decreases. The device actuates both, adherent Madin-Darby canine kidney cells (MDCK; open symbols, ○)and non-adherent chronic myelogenous leukemia cells (K-562; filled symbols, ●) with performance levels sufficient to achieve high speed cellsorting. (c) The threshold power decreases linearly as the groove is widened. (d) The threshold power changes non-monotonically as the grooveheight is increased, but sorting with the lowest required power is achieved for the deepest tested grooves.
Lab on a ChipPaper
Ope
n A
cces
s A
rtic
le. P
ublis
hed
on 0
3 O
ctob
er 2
017.
Dow
nloa
ded
on 2
2/03
/201
8 23
:22:
39.
Thi
s ar
ticle
is li
cens
ed u
nder
a C
reat
ive
Com
mon
s A
ttrib
utio
n 3.
0 U
npor
ted
Lic
ence
.View Article Online
Lab Chip, 2017, 17, 4059–4069 | 4063This journal is © The Royal Society of Chemistry 2017
the threshold power is essentially uncorrelated with the ap-plied flow rate, but at higher flow rates, there appears to be adirect correlation between threshold power and applied flowrate, as the cell deflection becomes limited by its exposure tothe acoustic wave pulse. The relationship between the thresh-old power of the SAW pulse and the overall device flow rateis depicted in Fig. 3a. The results show that cells can bedeflected consistently even at high flow rates of 60 ml h−1.
Dependence on pulse length
The minimum pulse length with which cells can be deflectedis particularly important, because the shorter the pulselength is, the higher the event rate can be. We determine thethreshold length of the SAW pulse for a range of radio fre-quency (RF) power levels. As the RF power increases, pulseswith shorter durations provide enough energy to deflect cells.Cells can be efficiently actuated provided the SAW pulses areat least 20 μs long, as shown in Fig. 3b. Because the devicecan successfully deflect cells with short bursts of acousticwaves, the length of the pulse does not limit the instrument'sperformance at high event rates.
Different cell types
Our sorting device also needs to be able to sort a variety ofcell types. We use the same range of power levels and pulselengths to test whether the device can sort adherent and non-adherent cell types. For adherent cell type, we chose MDCKcells which are approximately 8 μm in diameter.35 For non-adherent cell type, we chose K562 cells which are approxi-mately 15 μm in diameter.36 Both classes of cells can be re-producibly deflected into the groove with similar SAW pulseparameters, also shown in Fig. 3b. However, the thresholdpower slightly differs between the cell types, due to small dif-ferences in the average size or acoustic contrast of the cells.Nevertheless, the slanted groove device can actuate both ad-herent and non-adherent cells with the short pulse lengthsnecessary to attain high screening rates.
Dependence on groove dimensions
The shape and orientation of the groove may also be tuned toimprove sorting performance. We examine the impact ofgroove geometry on cell actuation in our design by varying thegroove width, height, and angle independently. As the grooveis widened, less power is necessary to cause the cell to interactwith the flow within the groove, as demonstrated in Fig. 3c.While it is possible to sort cells without any groove or with avery shallow groove, the best sorting results are obtained withgrooves fabricated at a height of 25 μm, as shown in Fig. 3d.This corresponds to the deepest groove that gives reliable re-sults. Different groove angles show no significant effect onthe threshold power required for sorting. While there may beslight variations due to changes in the effective aperture ofthe groove or in the flow speed along the groove, these effectsare within the range of measurement error, and appear tohave very little effect on the threshold power. Our results dem-
onstrate that both the depth and the width of the groove pro-vide geometrical tuning parameters, which can influence theinteraction of cells with the groove when SAWs are applied.
Other operating limitations
Because the threshold power for each parameter is within theoperating range of the device, we should be able to achievesorting at high event rates; however, there are additional de-vice limits to consider. In terms of the acoustic wave power,the SAW cannot push cells high enough to interact with thegroove for power levels below 3 W. Increasing the power in-creases the success rate of sorting, but only until about 10 W,when we start to see IDT damage in the form of chip cracking.To increase the rate, we would also like to increase the totalflow rate, but, in our device, for flow rates exceeding 60 ml h−1,the cells are not effectively confined to a narrow thread,which prevents us from testing SAW actuation with higher cellvelocities. There are also limits on the groove geometry. Whenthe height and width of the groove are increased to 50 μm or160 μm respectively, cells begin to enter the groove withoutany applied SAW, which is detrimental to the purity of the re-covered cells. Having these limitations in mind the optimalcondition of sorting and prevention of false positive in thesorting channel is a groove width in the range of 120–160 μmand a groove height of 25–50 μm. In all subsequent experi-ment we therefore choose a width of 120 μm and height of25 μm to stay away from the boundaries where false positiveoccur. Despite these limitations, there are a wide range ofconditions for which the slanted groove device providesstable and reliable operation.
Sorter performance
The extent to which we can achieve reliable operation withour sorting device can be measured by applying the sortingconditions we determined here to cell samples. For a givencell phase flow rate, a high cell density is required to reach ahigh event rate. However, this increases the chance of coinci-dence events. To measure the sorter's performance at differ-ent cell densities, we prepare a reference sample of K-562cells in which the cell density and the fraction of fluorescentcells are known. The sorter extracts the fluorescent cells. Thepurified sample is collected and the recovered cells are im-aged using a confocal microscope to obtain an independentmeasurement of cell purity. To elucidate how the purity ofthe sorted fraction depends on event rate, we increase thedensity of cells in the mixed sample, while keeping the cellphase flow rate constant. We also operate the device with twodifferent sheath flow rates and two different groove widths,to measure how these parameters affect sorter performance.These experiments provide a realistic picture of how deviceswith slanted grooves will perform.
Purity
As expected, the sorter achieves high purity at low event rates,but the purity decreases, as the concentration of cells
Lab on a Chip Paper
Ope
n A
cces
s A
rtic
le. P
ublis
hed
on 0
3 O
ctob
er 2
017.
Dow
nloa
ded
on 2
2/03
/201
8 23
:22:
39.
Thi
s ar
ticle
is li
cens
ed u
nder
a C
reat
ive
Com
mon
s A
ttrib
utio
n 3.
0 U
npor
ted
Lic
ence
.View Article Online

4064 | Lab Chip, 2017, 17, 4059–4069 This journal is © The Royal Society of Chemistry 2017
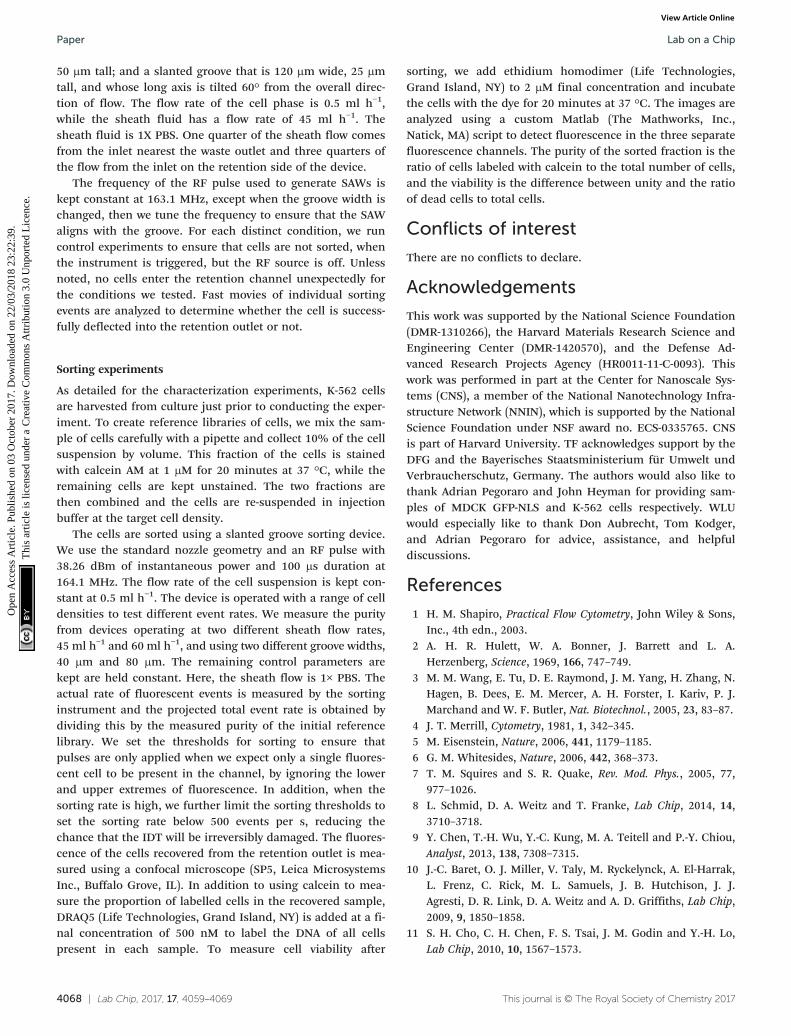
increases with a trend that appears linear, as shown inFig. 4a. The data fits to a line, which intersects the purity axisat 93% and whose slope represents a loss in purity of 4.3%each time the event rate increases by 1000 events per s. Thisy-intercept represents the theoretical maximum purity for theset of devices we tested. Although this fit describes the aver-age performance of these sorting devices, we examine the dis-tributions of the residuals for each parameter in more detail,to see if the operating flow rate or the slanted groove widthinfluence device performance. For different sheath flow rates,there is no clear difference between the purity of the recov-ered samples. However, when we test different groove widths,
we observe that the purity of samples isolated using deviceswith a 40 μm groove is higher than for devices with an 80 μmgroove. This difference was statistically significant with aprobability of only 0.28% indicating that these sets of resid-uals are drawn from the same distribution. Box plots showingthe distributions of residuals grouped by applied flow rateand groove width are plotted in Fig. 4b and c respectively.Because the width of the slanted groove has a clear effect ondevice performance, we fit the data from different groovewidths independently. The purity of samples recovered usingthe device with the 40 μm groove decreases 4.0% per1000 events per s with a theoretical maximum at 95.7%, while
Fig. 4 Sorting performance of sorting devices with slanted grooves. The purity of each recovered sample is plotted relative to the event rate atwhich the sample is sorted. (a) All the data points follow the same general trend. The entire data set fits to a line whose slope indicates a decreasein purity of 4.3% each time the event rate increases by 1000 events per s and whose intercept indicates that the theoretical maximum purity of thesorter is 93% (R2 = 0.817). We determine the residuals of the data with respect to this fit, and group them based on the total sheath flow rate thatwas applied in (b) and the slanted groove width in (c) for each experiment. The distributions of the residuals are plotted as box and whisker plotsfor each group. The horizontal lines contained within each of the boxes indicate the median values; the upper and lower edges of the boxesindicate the upper and lower quartiles respectively; and the whiskers show the full range of the data. Outliers are indicated using stars. When thedata are grouped according to the total sheath flow rate, the difference between the two populations is not significant (p = 0.90). However, whenthe data are binned according to the width of the slanted groove, the devices with the narrower groove produce samples that are about 5% morepure than the devices with the larger groove, and there is a statistically significant difference (p = 0.0029) between the distributions for the 40 μmand 80 μm grooves. We further measure the effect of groove width on performance by fitting the data from the different groove widthsindependently. The data and the fits for the different groove widths are shown in (d). Filled circles (●) are used for samples sorted with a 40 μmgroove device, while empty circles (○) represent samples sorted with the 80 μm groove. The device with the 40 μm groove has a slope of −4.0%per 1000 events per s and an intercept at 95.7% (R2 = 0.849), while the device with the 80 μm groove has a slope of −4.5% per 1000 events per sand an intercept at 91.1% (R2 = 0.879).
Lab on a ChipPaper
Ope
n A
cces
s A
rtic
le. P
ublis
hed
on 0
3 O
ctob
er 2
017.
Dow
nloa
ded
on 2
2/03
/201
8 23
:22:
39.
Thi
s ar
ticle
is li
cens
ed u
nder
a C
reat
ive
Com
mon
s A
ttrib
utio
n 3.
0 U
npor
ted
Lic
ence
.View Article Online
Lab Chip, 2017, 17, 4059–4069 | 4065This journal is © The Royal Society of Chemistry 2017
the purity of samples recovered from the device with the 80 μmgroove decreases 4.5% per 1000 events per s and the fit inter-sects the purity axis at 91.1%, as shown in Fig. 4d. These re-sults indicate that decreasing the width of the slanted groovein our sorting design provides a means of improving the pu-rity of the sorted sample, for the whole range of event rates.
The observation that the device with a narrow grooveyields higher purity suggests that the groove plays anotherrole in the sorting process. Because cells that enter thegroove are carried across the sorting channel to the sortingoutlet, it must be more difficult for non-target cells to enterthe narrow groove. We propose that the groove acts as a spa-tial filter; cells can only enter the groove, if they are alignedwith the groove when the acoustic wave is applied. This effectoffers a unique advantage compared to previous SAW sortingdesigns, in which the sorting purity can only be increased bychanging the design of the SAW transducer or the operatingflow rates. With the 40 μm groove, our design can achieve onaverage 92% purity at 1000 events per s; moreover, the devicesucceeds to enrich cells at event rates of nearly 10 000 eventsper s.
Although the purity appears low, our characterization ex-periments show that the slanted groove is capable to operateat high rates. In conventional FACS instruments, high levelsof purity require detection and elimination of coincidenceevents. Our instrument could be improved by incorporatingthe hardware and software designed for FACS instruments.In addition, the nozzle used for vertical flow focusing is a rel-atively simple design. While it serves to illustrate the princi-ple of operation of the device, it could be further optimizedto increase the spacing between cells and to minimize thedispersion of cell velocities. Moreover, after sorting with theslanted groove device, the viability of the sorted fraction ofcells remains high, greater than 96% based on membraneintegrity. As a result, we believe that cell sorters based ontraveling SAWs are already promising and will benefit fromthe fast pace of development in cell sorting using micro-fluidics and will soon be able to compete with FACSinstruments.
Conclusions
Cell sorters with slanted grooves use traveling SAWs to sortcells rapidly to high levels of purity. The design featuresguide the vertically translated cells to isolate desired cells.The sorter operates at high rates, approaching those of com-mercial FACS instruments, and features a high purity modefor recovery of enriched samples. Like other microfluidic cellsorters, the fluid handling region is enclosed and aerosolsare not produced by the acoustic waves in the system; there-fore, the sorter could find application particularly in screen-ing bio-hazardous samples without the need for additionalcontainment measures.1,14 Moreover, the same SAW deviceplatform is compatible with both cells and droplets,8 so a sin-gle instrument could provide users with both FACS and drop-let sorting capabilities. The slanted groove devices demon-
strated here could be further enhanced by integratingnumerous recent advances in flow focusing,37,38 inertialmicrofluidics,14 and SAW microfluidics.39 As a result, theSAW-actuated cell sorter with a slanted groove offers a prom-ising alternative to both traditional FACS instruments andother microfluidic methods of sorting that could see wide-spread use.
ExperimentalDevice design
The device consists of a PDMS replica containing the device'sflow channels bonded to a SAW substrate next to an IDT.Drawings of the IDT design and the microfluidic device arecreated using AutoCAD (Autodesk, Inc., San Rafael, CA). Thestructures defined in the drawings are transferred photo-masks for lithography. These photomasks are used to fabri-cate molds for the PDMS replicas and to pattern metal ontoeach SAW substrate to form IDTs.
The IDT has a tapered or fanned design.26 In the tapereddesign, the pitch of the IDT fingers varies laterally across thetransducer. The pitch increases linearly with position betweena smaller pitch on one side of the transducer and a larger pitchon the opposite side; therefore, the resonant frequency alsovaries with position along the transducer. In our IDT, the reso-nant frequency range is between 161 and 171 MHz.39,40
We have chosen this comparatively high frequency sincethe effect of acoustic streaming increases with the squareof the frequency. The width of the resonance region is de-termined by the full width of the IDT and the frequencydifference between the two edges;41 it is approximately 100 μmin our design. The metallization ratio is the fraction of theIDT in each finger repeat that is covered by metal; this ratiois kept constant at 0.5. Bus bars on either side of the IDTconnect to square pads with 1.5 mm side length, throughwhich external voltages are applied to all the IDT fingers withminimal resistance. Additional markings delimit each trans-ducer so that the IDTs can be cut from the wafer into individ-ual squares with 17.4 mm side length. The design is etchedinto a chrome mask (Photo-Sciences Inc., Torrance, CA) toensure that the actual finger widths closely match thedesigned values.
The microfluidic device has three layers, each fabricatedusing a separate photomask. The first layer contains only theshallow channel that serves as the vertical flow-focusing noz-zle. The pattern for the nozzle extends underneath both thecell inlet region and the sorting channel to ensure that thenozzle is not sensitive to the alignment of subsequent layers.The constriction in the nozzle is designed to be nominally40 μm long, reducing the chance that cells will clog the nozzle.The sheath channels form a Y-shape with the sorting chan-nel, so that no stagnation points are formed, as the flowemerges from the nozzle. The nozzle is offset from the centreof the channel, so that variations in flow rate or otherunwanted perturbations will not cause cells to enter the re-tention channel spuriously. The bulk of the device's features
Lab on a Chip Paper
Ope
n A
cces
s A
rtic
le. P
ublis
hed
on 0
3 O
ctob
er 2
017.
Dow
nloa
ded
on 2
2/03
/201
8 23
:22:
39.
Thi
s ar
ticle
is li
cens
ed u
nder
a C
reat
ive
Com
mon
s A
ttrib
utio
n 3.
0 U
npor
ted
Lic
ence
.View Article Online
4066 | Lab Chip, 2017, 17, 4059–4069 This journal is © The Royal Society of Chemistry 2017
are on the second layer, including the sheath and cell inlets,the main flow channel, and the device outlets. In addition,the fingers of the IDT are situated beneath an air gap, toprevent the acoustic waves from leaking into the PDMS de-vice. The thickness of the PDMS separating the air gap fromthe liquid in the channel is also minimized to reduce powerloss. This air gap does also exist in the second device layer.The third layer only contains the slanted groove, which ispatterned on top of the sorting region of the channel. Thegroove is drawn 230 μm wide, slightly less than the fullsorting channel width, ensuring that even if the groove isslightly misaligned from the sorting channel, the wall of thechannel where the acoustic wave encounters the liquid willnot be distorted. Distortions of the channel wall cause theacoustic wave to refract at unexpected angles.42 Each layercontains at least two sets of alignment marks consisting ofan asymmetrical pattern of crosses,43 enabling differentlayers to be aligned precisely on top of each other. Themasks for the individual microfluidic device layers are or-dered from CAD/Art Services, Inc. (Bandon, OR) and imagedwith a resolution of 25 400 dpi.
Transducer fabrication
Interdigital transducers are fabricated using the lift-off pro-cess described in the protocol from the Center for NanoscaleSystems at Harvard University.44 The substrates are 4 inchwafers of black lithium niobate (Precision Micro-Optics, LLC,Woburn, MA). Black lithium niobate is effective in SAW ap-plications and exhibits less pyroelectric effect than undopedlithium niobate, making it convenient for lithographic pro-cesses that require baking at high temperature.45 We choose128° Y–X lithium niobate, because it has high SAW velocityand strong coupling.26
Each wafer is cleaned by spinning it at 4000 rpm, sprayingit with acetone and isopropanol, and letting it continue tospin until dry. Residual moisture is removed with a dehydra-tion bake at 180 °C for 1 minute. We ease the rate of temper-ature change by placing the wafer on a hot plate at 115 °C for1 minute just prior to and immediately following baking at180 °C. Resist is dispensed onto the wafer using a disposabledropper. A layer of LOR3A resist (MicroChem, Westborough,MA) is added to the wafer surface; then, the wafer is spun at4000 rpm to create a layer 300 nm thick. We bake the resistat 180 °C for 4 minutes, using the same temperature rampingmethod as for the dehydration bake. We then add a layer ofShipley 1805 (MicroChem) and spin that at 4000 rpm. Thislayer is baked for 1 minute at 115 °C. The photoresist layersare exposed to UV light through the chrome mask with theIDT pattern on a contact mask aligner (MJB4, Karl Süss,Garching, Germany). We develop the pattern by immersingthe wafer in CD-26 developer (Microposit, Austin, TX) for 75 sto form a shadow mask for E-beam deposition. We rinse thewafer clean with water and blow it dry with nitrogen. Weclean the exposed surface of the wafer using an oxygenplasma cleaner (SCE106, Anatech, Union City, CA) with 75 W
of RF power and an oxygen gas flow rate of 40 sccm for 20 s.We deposit 10 nm of titanium as an adhesion layer, followedby 50 nm of gold using electron beam physical vapor deposi-tion (Denton Explorer 14, Denton Vacuum LLC, Moorestown,NJ) to form electrodes on the wafer. The photoresist is thenlifted off by soaking the wafer in Remover-PG (MicroChem)at 80 °C until all the excess resist is removed, about 60 minutes.We add a layer of Shipley 1813, and bake it at 115 °C for1 minute to form a protective layer. We use a dicing saw(DAD321, DISCO Corp., Tokyo, JPN) to score lines 250 μminto the lithium niobate. The wafer breaks cleanly along thescored lines, yielding up to 21 devices per wafer. The IDTsare cleaned with acetone to remove the protective layer, priorto use.
Soft lithography
We perform multi-layer lithography to create molds for PDMSreplicas. The layers are processed following the methodrecommended in the manufacturer's data sheet for SU-8 3025photoresist (MicroChem). For each layer, we dispense a smallamount of resist onto the wafer. We spin the wafer at 3000 rpmto create a layer that is 25 μm thick. We pre-bake each layerfor a total of 12 minutes at 95 °C, rotating the wafer 180° onthe hot plate after half the bake time has elapsed. The photo-mask for a particular layer is aligned with any underlying fea-tures and the layers of photoresist are patterned with UVlight on a contact mask aligner (ABM, Scotts Valley, CA). Theresist is then post exposure baked for 1 minute at 65 °C and5 minutes at 95 °C. At this point, additional layers can beadded on top of any existing layers by following the sameprocedure. Once all the layers are post exposure baked, wedevelop the features by immersing the wafer in polyethyleneglycol monomethyl ether acetate (484431, Sigma-Aldrich Co.LLC, St. Louis, MO) for 5 minutes using an orbital shaker(Roto Mix 8 × 8, Thermo Fisher, Waltham, MA) for mixing.After development, we rinse the wafer with isopropanol andblow it dry with nitrogen. We place the wafer in a 100 mmplastic petri dish. The wafer is now ready to serve as a moldfor creating replicas in PDMS.
We mix PDMS (Sylgard 184, Dow-Corning, Midland, MI)base and cross-linker in a 10 : 1 weight ratio using a Thinkymixer (AR-100, Thinky Corp., Tokyo, Japan). The mixer runsin mixing mode for 30 s and degassing mode for another 30 s.We pour the uncured PDMS on top of the mold. We degas thePDMS for 10 minutes, then place the mold in the oven at65 °C overnight. Once the PDMS is cured, we cut around theedge of the wafer using a scalpel and lift the PDMS replicaout of the mold. Each PDMS replica contains 16 independentdevices; the replica is cut into individual devices prior to use.Interface holes are created with a biopsy punch (Uni-Core,GE Healthcare Life Sciences, Pittsburgh, PA). We use0.75 mm diameter holes for the inlets and 1.5 mm diameterholes for the outlets. We clean the replicas by sonication inisopropanol for 5 minutes, then blow them dry. At this point,individual PDMS devices can be bonded onto a substrate
Lab on a ChipPaper
Ope
n A
cces
s A
rtic
le. P
ublis
hed
on 0
3 O
ctob
er 2
017.
Dow
nloa
ded
on 2
2/03
/201
8 23
:22:
39.
Thi
s ar
ticle
is li
cens
ed u
nder
a C
reat
ive
Com
mon
s A
ttrib
utio
n 3.
0 U
npor
ted
Lic
ence
.View Article Online
Lab Chip, 2017, 17, 4059–4069 | 4067This journal is © The Royal Society of Chemistry 2017
with the IDT pattern in the instrument's sample holder forsorting experiments.
Sorter apparatus
The sorting apparatus is similar to that detailed in previouspublications,12,46 except that the microscope is custom builtusing modular optomechanics (Thorlabs Inc., Newton, NJ) in-stead of using a commercially available microscope. A 473 nmlaser with 100 mW of output power (LRS-0473, LaserglowTechnologies, Toronto, ON) excites fluorescence in the sam-ple. The laser beam is expanded (BE-05-10-A, Thorlabs Inc.),and steered into the microscope. A cylindrical achromat(ACY254-200-A, Thorlabs Inc.) and a microscope objective(Nikon CFI Plan Apochromat Lambda, 10×/0.45NA, MicroVideo Instruments, Inc., Avon, MA) focus the laser beam intoa line in the microscope's focal plane. The objective also col-lects any fluorescence emitted by the sample. While excita-tion light gets reflected by the excitation dichroic (FF495-Di03-25 × 36, Semrock, Inc., Buffalo, NY) and up through theobjective, the emitted fluorescence passes through the excita-tion dichroic. The fluorescence reflects off the fluorescencedichroic (FF605-Di01-25 × 36, Semrock, Inc.) towards thephotocathode of a photomultiplier tube (H10723-20, Hama-matsu Photonics K.K., Hamamatsu, Japan). A colored glasslongpass filter (FGL495, Thorlabs Inc.) and a dielectricbandpass filter (FF01-520/44-25, Semrock, Inc.) are placed be-tween the fluorescence dichroic and the photomultiplier tube(PMT) to attenuate noise sources of light, so that the PMTprovides an accurate measurement of fluorescence. Themicroscope's field of view is illuminated using an infraredlight emitting diode (M780 L2-C1, Thorlabs Inc.). The infra-red light passes through both microscope's dichroic filters,and gets reflected by a turning mirror (CM1-P01, ThorlabsInc.). The infrared image is focused onto the sensor of a fastcamera (HiSpec1, Fastec Imaging, San Diego, CA) by a tubelens (AC254-100-B-ML, Thorlabs Inc.). The fast camera en-ables the system to record high framerate videos of thesorting process. A manual stage (Leica) provides fine adjust-ment of the sample position with respect to the opticalsystem.
The photomultiplier tube module measures the fluores-cence from the sample, generating a voltage proportional tothe intensity of the incident light. This voltage is digitized bythe data acquisition card (PCIe-7842R, National InstrumentsCorp., Austin, TX) and analyzed in real time using the card'sfield programmable gate array to detect and analyze peaks inthe fluorescence signal. When peaks corresponding to de-sired cells are detected, a sorting pulse is generated. Thesorting pulse is a +3.3 V signal, which controls the output ofa RF waveform generator (SMB100A, Rohde & Schwarz,Munich, Germany) through its pulse modulation input. Theoutput of the waveform generator is intensified using a highgain RF amplifier (LZY-22+, Mini-Circuits, Brooklyn, NY).When the amplified RF signal is applied to the IDT, the IDTgenerates SAWs in response. An associated PC can be used to
set threshold values for peak detection and sorting and tomonitor system performance. Using this system, the fluores-cence from cells passing through the sorting region of the de-vice is analyzed in real time, and pulses of SAW are appliedto sort desired cells with minimal latency.
A custom-made sample holder supports the microfluidicdevice. The base plate of the sample holder holds the IDT se-curely in a milled slot. The center of the baseplate is cut awayto enable light to transmit through the sample and to permitthe microscope to focus on the device. A glass slide is cut tosize and placed under the IDT to provide mechanical sup-port. A clear piece of lithium niobate is fastened underneaththe glass slide in an orientation chosen to cancel the effectsof substrate birefringence. A printed circuit board (PCB)routes signals from the amplifier to the IDT. The amplifierand the PCB are connected using standard RF adaptors (SMAto MMCX male), and electrical connections from the PCB tothe IDT are created, when pogo pins mounted on the boardare pressed into contact with the metal pads. The PCB is heldin place by fixing it to the base plate using M3 screws. Anacrylic spacer ensures that the pins exert enough force tohold the IDT in place and make consistent electrical contact,but not so much force that the substrate cracks under thestress. The spacer is milled to 3.7 mm and laser cut to ac-commodate the mounting screws, the shape of the PCB, andany electrical components on the lower side of the PCB. EachPDMS device is bonded to the substrate using mechanicalforce. The PDMS device forms three sides of the device's flowchannel, while the lithium niobate substrate serves as thebottom of the flow channel. A clamp is fashioned from a 6 mmthick sheet of acrylic; it is laser cut to permit fluid con-nections to pass through to the PDMS device. The clamppresses the PDMS device onto the substrate using M2 screwsfastened to the baseplate. Once assembled, the entire sampleholder fits into the microscope stage.
Device characterization experiments
Madin Darby canine kidney (MDCK) and human chronic my-elogenous leukemia (K-562, ATCC, Manassas, VA) cells areharvested prior to each day's experiments. The MDCKs havefluorescent nuclei, following stable transfection with greenfluorescent protein fused to a nuclear localization sequence,while the K-562 cells are stained by adding calcein AM (LifeTechnologies, Grand Island, NY) to the cell suspension at aconcentration of 1 μM and incubating the suspension at37 °C for 20 minutes. The cells are re-suspended into injec-tion buffer at between 5 and 10 million cells per ml. Injectionbuffer consists of 18% Optiprep (D1556, Sigma-Aldrich Co.LLC) by volume, 6 U ml−1 DNAse I (New England BiolabsInc., Ipwich, MA), and 3 mM magnesium chloride in 1× phos-phate buffered saline (PBS, P3813, Sigma-Aldrich Co. LLC, St.Louis, MO).
Unless otherwise specified, we use a PDMS device with avertical flow-focusing nozzle that is 50 μm wide, 40 μm longand 25 μm tall; a sorting channel that is 250 μm wide and
Lab on a Chip Paper
Ope
n A
cces
s A
rtic
le. P
ublis
hed
on 0
3 O
ctob
er 2
017.
Dow
nloa
ded
on 2
2/03
/201
8 23
:22:
39.
Thi
s ar
ticle
is li
cens
ed u
nder
a C
reat
ive
Com
mon
s A
ttrib
utio
n 3.
0 U
npor
ted
Lic
ence
.View Article Online
4068 | Lab Chip, 2017, 17, 4059–4069 This journal is © The Royal Society of Chemistry 2017
50 μm tall; and a slanted groove that is 120 μm wide, 25 μmtall, and whose long axis is tilted 60° from the overall direc-tion of flow. The flow rate of the cell phase is 0.5 ml h−1,while the sheath fluid has a flow rate of 45 ml h−1. Thesheath fluid is 1X PBS. One quarter of the sheath flow comesfrom the inlet nearest the waste outlet and three quarters ofthe flow from the inlet on the retention side of the device.
The frequency of the RF pulse used to generate SAWs iskept constant at 163.1 MHz, except when the groove width ischanged, then we tune the frequency to ensure that the SAWaligns with the groove. For each distinct condition, we runcontrol experiments to ensure that cells are not sorted, whenthe instrument is triggered, but the RF source is off. Unlessnoted, no cells enter the retention channel unexpectedly forthe conditions we tested. Fast movies of individual sortingevents are analyzed to determine whether the cell is success-fully deflected into the retention outlet or not.
Sorting experiments
As detailed for the characterization experiments, K-562 cellsare harvested from culture just prior to conducting the exper-iment. To create reference libraries of cells, we mix the sam-ple of cells carefully with a pipette and collect 10% of the cellsuspension by volume. This fraction of the cells is stainedwith calcein AM at 1 μM for 20 minutes at 37 °C, while theremaining cells are kept unstained. The two fractions arethen combined and the cells are re-suspended in injectionbuffer at the target cell density.
The cells are sorted using a slanted groove sorting device.We use the standard nozzle geometry and an RF pulse with38.26 dBm of instantaneous power and 100 μs duration at164.1 MHz. The flow rate of the cell suspension is kept con-stant at 0.5 ml h−1. The device is operated with a range of celldensities to test different event rates. We measure the purityfrom devices operating at two different sheath flow rates,45 ml h−1 and 60 ml h−1, and using two different groove widths,40 μm and 80 μm. The remaining control parameters arekept are held constant. Here, the sheath flow is 1× PBS. Theactual rate of fluorescent events is measured by the sortinginstrument and the projected total event rate is obtained bydividing this by the measured purity of the initial referencelibrary. We set the thresholds for sorting to ensure thatpulses are only applied when we expect only a single fluores-cent cell to be present in the channel, by ignoring the lowerand upper extremes of fluorescence. In addition, when thesorting rate is high, we further limit the sorting thresholds toset the sorting rate below 500 events per s, reducing thechance that the IDT will be irreversibly damaged. The fluores-cence of the cells recovered from the retention outlet is mea-sured using a confocal microscope (SP5, Leica MicrosystemsInc., Buffalo Grove, IL). In addition to using calcein to mea-sure the proportion of labelled cells in the recovered sample,DRAQ5 (Life Technologies, Grand Island, NY) is added at a fi-nal concentration of 500 nM to label the DNA of all cellspresent in each sample. To measure cell viability after
sorting, we add ethidium homodimer (Life Technologies,Grand Island, NY) to 2 μM final concentration and incubatethe cells with the dye for 20 minutes at 37 °C. The images areanalyzed using a custom Matlab (The Mathworks, Inc.,Natick, MA) script to detect fluorescence in the three separatefluorescence channels. The purity of the sorted fraction is theratio of cells labeled with calcein to the total number of cells,and the viability is the difference between unity and the ratioof dead cells to total cells.
Conflicts of interest
There are no conflicts to declare.
Acknowledgements
This work was supported by the National Science Foundation(DMR-1310266), the Harvard Materials Research Science andEngineering Center (DMR-1420570), and the Defense Ad-vanced Research Projects Agency (HR0011-11-C-0093). Thiswork was performed in part at the Center for Nanoscale Sys-tems (CNS), a member of the National Nanotechnology Infra-structure Network (NNIN), which is supported by the NationalScience Foundation under NSF award no. ECS-0335765. CNSis part of Harvard University. TF acknowledges support by theDFG and the Bayerisches Staatsministerium für Umwelt undVerbraucherschutz, Germany. The authors would also like tothank Adrian Pegoraro and John Heyman for providing sam-ples of MDCK GFP-NLS and K-562 cells respectively. WLUwould especially like to thank Don Aubrecht, Tom Kodger,and Adrian Pegoraro for advice, assistance, and helpfuldiscussions.
References
1 H. M. Shapiro, Practical Flow Cytometry, John Wiley & Sons,Inc., 4th edn., 2003.
2 A. H. R. Hulett, W. A. Bonner, J. Barrett and L. A.Herzenberg, Science, 1969, 166, 747–749.
3 M. M. Wang, E. Tu, D. E. Raymond, J. M. Yang, H. Zhang, N.Hagen, B. Dees, E. M. Mercer, A. H. Forster, I. Kariv, P. J.Marchand and W. F. Butler, Nat. Biotechnol., 2005, 23, 83–87.
4 J. T. Merrill, Cytometry, 1981, 1, 342–345.5 M. Eisenstein, Nature, 2006, 441, 1179–1185.6 G. M. Whitesides, Nature, 2006, 442, 368–373.7 T. M. Squires and S. R. Quake, Rev. Mod. Phys., 2005, 77,
977–1026.8 L. Schmid, D. A. Weitz and T. Franke, Lab Chip, 2014, 14,
3710–3718.9 Y. Chen, T.-H. Wu, Y.-C. Kung, M. A. Teitell and P.-Y. Chiou,
Analyst, 2013, 138, 7308–7315.10 J.-C. Baret, O. J. Miller, V. Taly, M. Ryckelynck, A. El-Harrak,
L. Frenz, C. Rick, M. L. Samuels, J. B. Hutchison, J. J.Agresti, D. R. Link, D. A. Weitz and A. D. Griffiths, Lab Chip,2009, 9, 1850–1858.
11 S. H. Cho, C. H. Chen, F. S. Tsai, J. M. Godin and Y.-H. Lo,Lab Chip, 2010, 10, 1567–1573.
Lab on a ChipPaper
Ope
n A
cces
s A
rtic
le. P
ublis
hed
on 0
3 O
ctob
er 2
017.
Dow
nloa
ded
on 2
2/03
/201
8 23
:22:
39.
Thi
s ar
ticle
is li
cens
ed u
nder
a C
reat
ive
Com
mon
s A
ttrib
utio
n 3.
0 U
npor
ted
Lic
ence
.View Article Online

Lab Chip, 2017, 17, 4059–4069 | 4069This journal is © The Royal Society of Chemistry 2017
12 J. J. Agresti, E. Antipov, A. R. Abate, K. Ahn, A. C. Rowat, J.-C.Baret, M. Marquez, A. M. Klibanov, A. D. Griffiths and D. A.Weitz, Proc. Natl. Acad. Sci. U. S. A., 2010, 107, 4004–4009.
13 A. Sciambi and A. R. Abate, Lab Chip, 2015, 15, 47–51.14 Y. Chen, A. J. Chung, T. H. Wu, M. A. Teitell, D. Di Carlo
and P. Y. Chiou, Small, 2014, 10, 1746–1751.15 A. A. Nawaz, Y. Chen, N. Nama, R. H. Nissly, L. Ren, A.
Ozcelik, L. Wang, J. P. McCoy, S. J. Levine and T. J. Huang,Anal. Chem., 2015, 150902104705000.
16 L. Ren, Y. Chen, P. Li, Z. Mao, P.-H. Huang, J. Rufo, F. Guo,L. Wang, J. P. McCoy, S. J. Levine and T. J. Huang, Lab Chip,2015, 15, 3870–3879.
17 J. Friend and L. Y. Yeo, Rev. Mod. Phys., 2011, 83, 647–704.18 J. Shi, X. Mao, D. Ahmed, A. Colletti and T. J. Huang, Lab
Chip, 2008, 8, 221–223.19 J. Shi, H. Huang, Z. Stratton, Y. Huang and T. J. Huang, Lab
Chip, 2009, 9, 3354–3359.20 J. Shi, S. Yazdi, S.-C. S. Lin, X. Ding, I.-K. Chiang, K. Sharp
and T. J. Huang, Lab Chip, 2011, 11, 2319–2324.21 X. Ding, S.-C. S. Lin, B. Kiraly, H. Yue, S. Li, I.-K. Chiang, J.
Shi, S. J. Benkovic and T. J. Huang, Proc. Natl. Acad. Sci.U. S. A., 2012, 109, 11105–11109.
22 T. Franke, S. Braunmüller, L. Schmid, A. Wixforth and D. A.Weitz, Lab Chip, 2010, 10, 789–794.
23 X. Ding, P. Li, S.-C. S. Lin, Z. S. Stratton, N. Nama, F. Guo,D. Slotcavage, X. Mao, J. Shi, F. Costanzo and T. J. Huang,Lab Chip, 2013, 13, 3626–3649.
24 L. Y. Yeo and J. R. Friend, Biomicrofluidics, 2009, 3, 1–23.25 G. Destgeer, K. H. Lee, J. H. Jung, A. Alazzam and H. J. Sung,
Lab Chip, 2013, 13, 4210.26 D. Morgan, Surface Acoustic Wave Filters, Elsevier Ltd., 2007.27 D. J. Collins, T. Alan and A. Neild, Appl. Phys. Lett.,
2014, 105, 193507.28 Z. Mao, Y. Xie, F. Guo, L. Ren, P. Huang, Y. Chen, J. Rufo, F.
Costanzo and T. J. Huang, Lab Chip, 2016, 515–524.
29 I. Leibacher, S. Schatzer and J. Dual, Lab Chip, 2014, 14,463–470.
30 R. W. Rambach, V. Skowronek and T. Franke, RSC Adv.,2014, 4, 60534–60542.
31 C. Devendran, D. J. Collins, Y. Ai and A. Neild, Phys. Rev.Lett., 2017, 118(118), 154501.
32 R. W. Ramback, J. Taiber, C. M. L. Scheck, C. Meyer, J.Reboud, J. M. Cooper and T. Franke, Sci. Rep., 2016, 6, 21980.
33 S. Chung, S. J. Park, J. K. Kim, C. Chung, D. C. Han and J. K.Chang, Microsyst. Technol., 2003, 9, 525–533.
34 C.-H. Hsu, D. Di Carlo, C. Chen, D. Irimia and M. Toner,Lab Chip, 2008, 8, 2128–2134.
35 J. C. W. Richardson, V. Scalera and N. L. Simmons, Biochim.Biophys. Acta, 1981, 673, 26–36.
36 G. Wang, C. Turbyfield, K. Crawford, A. Alexeev and T.Sulchek, Microfluid. Nanofluid., 2015, 19, 987–993.
37 X. Mao, J. R. Waldeisen and T. J. Huang, Lab Chip, 2007, 7,1260–1262.
38 A. A. Nawaz, X. Zhang, X. Mao, J. Rufo, S.-C. S. Lin, F. Guo,Y. Zhao, M. Lapsley, P. Li, J. P. McCoy, S. J. Levine and T. J.Huang, Lab Chip, 2014, 14, 415–423.
39 R. W. Rambach, V. Skowronek and T. Franke, RSC Adv.,2014, 4, 60534–60542.
40 L. Schmid and T. Franke, Lab Chip, 2013, 13, 1691–1694.41 X. Ding, J. Shi, S.-C. S. Lin, S. Yazdi, B. Kiraly and T. J.
Huang, Lab Chip, 2012, 12, 2491.42 I. Leibacher, P. Hahn and J. Dual, Microfluid. Nanofluid.,
2015, 19, 923–933.43 Stanford Microfluid. Foundry, 2015.44 S. Hickman, Harvard Center for Nanoscale Systems,
2011, 1–10.45 E. M. Standifer, D. H. Jundt, R. G. Norwood and P. F.
Bordui, Ieee Int. Freq. Control Symp., 1998, 470–472.46 L. Mazutis, J. Gilbert, W. L. Ung, D. A. Weitz, A. D. Griffiths
and J. A. Heyman, Nat. Protoc., 2013, 8, 870–891.
Lab on a Chip Paper
Ope
n A
cces
s A
rtic
le. P
ublis
hed
on 0
3 O
ctob
er 2
017.
Dow
nloa
ded
on 2
2/03
/201
8 23
:22:
39.
Thi
s ar
ticle
is li
cens
ed u
nder
a C
reat
ive
Com
mon
s A
ttrib
utio
n 3.
0 U
npor
ted
Lic
ence
.View Article Online