Lab LCA 1 7
48
EE Department Linear Circuit Analysis CEME (NUST), Rawalpindi 1 PRACTICAL WORK BOOK For The Course EE-111 Linear Circuit Analysis For B.E. Electrical Engineering Group Members Degree Syndicate Complied By: Checked By: Lab. Engineer Bahzad Zaib Assistant Professor Zubair Ahmad DEPARTMENT OF ELECTRICAL ENGINEERING College of Electrical & Mechanical Engineering (CEME), NUST-Pakistan
-
Upload
nust-stuff -
Category
Environment
-
view
11 -
download
0
Transcript of Lab LCA 1 7

EE Department Linear Circuit Analysis
CEME (NUST) Rawalpindi 1
PRACTICAL WORK BOOK
For The Course
EE-111 Linear Circuit Analysis
For
BE Electrical Engineering
Group Members
Degree Syndicate
Complied By Checked By
Lab Engineer Bahzad Zaib Assistant Professor Zubair Ahmad
DEPARTMENT OF ELECTRICAL ENGINEERING
College of Electrical amp Mechanical Engineering (CEME) NUST-Pakistan
EE Department Linear Circuit Analysis
CEME (NUST) Rawalpindi 2
LIST OF EXPERIMENTS
SNO TITLE OF EXPERIMENT Page
No
01 Introduction Basic Concepts and Lab Equipment 04
02 Experimental Verification of OHMrsquos Law 20
03 Verification of Current amp Voltage Divider Rule 25
04 Experimental Verification of Nodal Analysis 30
05 Experimental Verification of Mesh Analysis 35
06 Experimental Verification of Theveninrsquos Theorem 40
07 Study of Maximum Power Transfer Theorem amp its
Experimental Verification for a Network
44
Note PSICE solution for the task of each lab to be submitted with lab reports
EE Department Linear Circuit Analysis
CEME (NUST) Rawalpindi 3
LABORATORY WORK ESSENTIALS
COMPONENTS
Resistances ndashfixed (Ω) 50 x 280 x 2 100 x 2 120 x 2390 x 2430 x 2 1k x
6 22k x 5 25k x 3 5k x 2 10k x 2 100k x 4 20k x 4
Resistances ndashvariable (Ω) 1k x 2 2k x 2 5k x 2 10k x 2
Capacitor-fixed 1uF x 2
ICrsquos LM741 x 2
EQUIPMENTS
Digital Multi Meter
Oscilloscope
DC Power Supplies
Bread Board
Function Generator
SOFTWARES
Nil
EE Department Linear Circuit Analysis
CEME (NUST) Rawalpindi 4
EXPERIMENT NO ndash 01 INTRODUCTION BASIC CONCEPTS amp LAB EQUIPMENT
OBJECTIVE
- To know and understand basic function of laboratory equipment
- To become familiar with the correct ways of operating lab instruments
THEORY
A few tools are required for basic electronics work Most of these tools are inexpensive and easy
to obtain
Digital multi-meter First and foremost in your tool collection is a multi-meter This is an electrical instrument
designed to measure voltage current resistance and often other variables as well Multi-meters
are manufactured in both digital and analog form A digital multi-meter is preferred for precision
work but analog meters are also useful for gaining an intuitive understanding of instrument
sensitivity and range
Solder-less bread-board
Also essential is a solder-less breadboard sometimes called a prototyping board or proto-board
This device allows you to quickly join electronic components to one another without having to
solder component terminals and wires together
The internal structure layout of solder less bread-board can be depicted as
EE Department Linear Circuit Analysis
CEME (NUST) Rawalpindi 5
we can think of a breadboard as a board that can be divided in 2 functional areas
ndash the power strip(s) (in the drawing above A and D)
ndash the component grid(s) (in the drawing above B and C)
Most breadboards have at least 2 ldquocomponent gridsrdquo (B and C) separated at exactly the distance
between the two pin sides of a DIP IC package between B and C The pins of the component
grids (B and C) are connected vertically per column The grids B and C are not connected with
each other
Bench Top Power Supply
Bench Top Power Supplies are used for general design repair instructional or testing purposes
and includes both Fixed and Variable output supplies It is provided with 3 terminals for
connection purposes positive negative and ground The digital display shows the values of
voltage which is adjusted by coarse adjustment and fine adjustment knobs
Oscilloscope
The main purpose of an oscilloscope is to graph an electrical signal as it varies over time Most
scopes produce a two-dimensional graph with time on the x-axis and voltage on the y-axis
Controls surrounding the scopersquos screen allow you to adjust the scale of the graph both
vertically and horizontally ndash allowing you to zoom in and out on a signal There are also controls
to set the trigger on the scope which helps focus and stabilize the display
In addition to those fundamental features many scopes have measurement tools which help to
quickly quantify frequency amplitude and other waveform characteristics In general a scope
can measure both time-based and voltage-based characteristics
rsaquo Timing characteristics
Frequency and period ndash Frequency is defined as the number of times per second a waveform
repeats And the period is the reciprocal of that (number of seconds each repeating waveform
takes) The maximum frequency a scope can measure varies but itrsquos often in the 100rsquos of MHz
EE Department Linear Circuit Analysis
CEME (NUST) Rawalpindi 6
(1E6 Hz) range
Duty cycle ndash The percentage of a period that a wave is either positive or negative (there are both
positive and negative duty cycles) The duty cycle is a ratio that tells you how long a signal is
ldquoonrdquo versus how long itrsquos ldquooffrdquo each period
Rise and fall time ndash Signals canrsquot instantaneously go from 0V to 5V they have to smoothly rise
The duration of a wave going from a low point to a high point is called the rise time and fall
time measures the opposite These characteristics are important when considering how fast a
circuit can respond to signals
rsaquo Voltage characteristics
Amplitude ndash Amplitude is a measure of the magnitude of a signal There are a variety of
amplitude measurements including peak-to-peak amplitude which measures the absolute
difference between a high and low voltage point of a signal Peak amplitude on the other hand
only measures how high or low a signal is past 0V
Maximum and minimum voltages ndash The scope can tell you exactly how high and low the voltage
of your signal gets
Mean and average voltages ndash Oscilloscopes can calculate the average or mean of your signal and
it can also tell you the average of your signalrsquos minimum and maximum voltage
Oscilloscope Usage
Here are some of the important oscilloscope buzzwords you should be familiar with before
turning it on
Key Oscilloscope Specifications
Some scopes are better than others These characteristics help define how well you might expect
a scope to perform
rsaquo Bandwidth ndash Oscilloscopes are most commonly used to measure waveforms which have a
defined frequency No scope is perfect though they all have limits as to how fast they can see a
signal change The bandwidth of a scope specifies the range of frequencies it can reliably
measure
rsaquo Digital vs Analog ndash As with most everything electronic o-scopes can either be analog or
digital Analog scopes use an electron beam to directly map the input voltage to a display Digital
EE Department Linear Circuit Analysis
CEME (NUST) Rawalpindi 7
scopes incorporate microcontrollers which sample the input signal with an analog-to-digital
converter and map that reading to the display Generally analog scopes are older have a lower
bandwidth and less features but they may have a faster response (and look much cooler)
rsaquo Channel Amount ndash Many scopes can read more than one signal at a time displaying them all
on the screen simultaneously Each signal read by a scope is fed into a separate channel Two to
four channel scopes are very common
rsaquo Sampling Rate ndash This characteristic is unique to digital scopes it defines how many times per
second a signal is read For scopes that have more than one channel this value may decrease if
multiple channels are in use
rsaquo Rise Time ndash The specified rise time of a scope defines the fastest rising pulse it can measure
The rise time of a scope is very closely related to the bandwidth It can be calculated as Rise
Time = 035 Bandwidth
rsaquo Maximum Input Voltage ndash Every piece of electronics has its limits when it comes to high
voltage Scopes should all be rated with a maximum input voltage If your signal exceeds that
voltage therersquos a good chance the scope will be damaged
rsaquo Resolution ndash The resolution of a scope represents how precisely it can measure the input
voltage This value can change as the vertical scale is adjusted
rsaquo Vertical Sensitivity ndash This value represents the minimum and maximum values of your vertical
voltage scale This value is listed in volts per div
rsaquo Time Base ndash Time base usually indicates the range of sensitivities on the horizontal time axis
This value is listed in seconds per div
rsaquo Input Impedance ndash When signal frequencies get very high even a small impedance (resistance
capacitance or inductance) added to a circuit can affect the signal Every oscilloscope will add a
certain impedance to a circuit itrsquos reading called the input impedance Input impedances are
generally represented as a large resistive impedance (gt1 MΩ) in parallel (||) with small
capacitance (in the pF range) The impact of input impedance is more apparent when measuring
very high frequency signals and the probe you use may have to help compensate for it
Anatomy of An Oscilloscope
While no scopes are created exactly equal they should all share a few similarities that make
them function similarly On this page wersquoll discuss a few of the more common
systems of an oscilloscope the display horizontal vertical trigger and inputs
The Display
An oscilloscope isnrsquot any good unless it can display the information yoursquore trying to test which
makes the display one of the more important sections on the scope
EE Department Linear Circuit Analysis
CEME (NUST) Rawalpindi 8
Every oscilloscope display should be criss-crossed with horizontal and vertical lines
called divisions The scale of those divisions are modified with the horizontal and vertical
systems The vertical system is measured in ldquovolts per divisionrdquo and the horizontal is ldquoseconds
per divisionrdquo Generally scopes will feature around 8-10 vertical (voltage) divisions and 10-14
horizontal (seconds) divisions
Older scopes (especially those of the analog variety) usually feature a simple monochrome
display though the intensity of the wave may vary More modern scopes feature multicolor LCD
screens which are a great help in showing more than one waveform at a time
Many scope displays are situated next to a set of about five buttons ndash either to the side or below
the display These buttons can be used to navigate menus and control settings of the scope
Vertical System
The vertical section of the scope controls the voltage scale on the display There are traditionally
two knobs in this section which allow you to individually control the vertical position and
voltsdiv
The more critical volts per division knob allow you to set the vertical scale on the screen
Rotating the knob clockwise will decrease the scale and counter-clockwise will increase A
smaller scale ndash fewer volts per division on the screen ndash means yoursquore more ldquozoomed inrdquo to the
waveform
The display on the GA1102 for example has 8 vertical divisions and the voltsdiv knob can
select a scale between 2mVdiv and 5Vdiv So zoomed all the way in to 2mVdiv the display
can show waveform that is 16mV from top to bottom Fully ldquozoomed outrdquo the scope can show a
waveform ranging over 40V (The probe as wersquoll discuss below can further increase this range)
EE Department Linear Circuit Analysis
CEME (NUST) Rawalpindi 9
The position knob controls the vertical offset of the waveform on the screen Rotate the knob
clockwise and the wave will move down counter-clockwise will move it up the display You
can use the position knob to offset part of a waveform off the screen
Using both the position and voltsdiv knobs in conjunction you can zoom in on just a tiny part of
the waveform that you care about the most If you had a 5V square wave but only cared about
how much it was ringing on the edges you could zoom in on the rising edge using both knobs
Horizontal System
The horizontal section of the scope controls the time scale on the screen Like the vertical
system the horizontal control gives you two knobs position and secondsdiv
The seconds per division (sdiv) knob rotates to increase or decrease the horizontal scale If you
rotate the sdiv knob clockwise the number of seconds each division represents will decrease ndash
yoursquoll be ldquozooming inrdquo on the time scale Rotate counter-clockwise to increase the time scale
and show a longer amount of time on the screen
Using the GA1102 as an example again the display has 14 horizontal divisions and can
show anywhere between 2nS and 50s per division So zoomed all the way in on the horizontal
scale the scope can show 28nS of a waveform and zoomed way out it can show a signal as it
changes over 70 seconds
The position knob can move your waveform to the right or left of the display adjusting the
horizontal offset
EE Department Linear Circuit Analysis
CEME (NUST) Rawalpindi 10
Using the horizontal system you can adjust how many periods of a waveform you want to see
You can zoom out and show multiple peaks and troughs of a signal
Or you can zoom way in and use the position knob to show just a tiny part of a wave
Trigger System
The trigger section is devoted to stabilizing and focusing the oscilloscope The trigger tells the
scope what parts of the signal to ldquotriggerrdquo on and start measuring If your waveform is periodic
the trigger can be manipulated to keep the display static and unflinching A poorly triggered
wave will produce seizure-inducing sweeping waves like this
EE Department Linear Circuit Analysis
CEME (NUST) Rawalpindi 11
The trigger section of a scope is usually comprised of a level knob and a set of buttons to select
the source and type of the trigger The level knob can be twisted to set a trigger to a specific
voltage point
A series of buttons and screen menus make up the rest of the trigger system Their main purpose
is to select the trigger source and mode There are a variety of trigger types which manipulate
how the trigger is activated
rsaquo An edge trigger is the most basic form of the trigger It will key the oscilloscope to start
measuring when the signal voltage passes a certain level An edge trigger can be set to catch on a
rising or falling edge (or both)
rsaquo A pulse trigger tells the scope to key in on a specified ldquopulserdquo of voltage You can specify the
duration and direction of the pulse For example it can be a tiny blip of 0V -gt 5V -gt 0V or it
can be a seconds-long dip from 5V to 0V back to 5V
rsaquo A slope trigger can be set to trigger the scope on a positive or negative slope over a specified
amount of time
rsaquo More complicated triggers exist to focus on standardized waveforms that carry video data
like NTSC or PAL These waves use a unique synchronizing pattern at the beginning of every
frame
You can also usually select a triggering mode which in effect tells the scope how strongly you
feel about your trigger In automatic trigger mode the scope can attempt to draw your waveform
even if it doesnrsquot trigger Normal mode will only draw your wave if it sees the specified trigger
And single mode looks for your specified trigger when it sees it it will draw your wave then
stop
The Probes
An oscilloscope is only good if you can actually connect it to a signal and for that you need
probes Probes are single-input devices that route a signal from your circuit to the scope They
have a sharp tip which probes into a point on your circuit The tip can also be equipped with
hooks tweezers or clips to make latching onto a circuit easier Every probe also includes
a ground clip which should be secured safely to a common ground point on the circuit under
test
EE Department Linear Circuit Analysis
CEME (NUST) Rawalpindi 12
While probes may seem like simple devices that just latch onto your circuit and carry a signal to
the scope therersquos actually a lot that goes into probe design and selection
Optimally what a probe needs to be is invisible ndash it shouldnrsquot have any effect on
your signal under test Unfortunately long wires all have intrinsic inductance capacitance and
resistance so no matter what theyrsquoll affect scope readings (especially at high frequencies)
There are a variety of probe types out there the most common of which is
the passive probe included with most scopes Most of the ldquostockrdquo passive probes are attenuated
Attenuating probes have a large resistance intentionally built-in and shunted by a small capacitor
which helps to minimize the effect that a long cable might have on loading your circuit In series
with the input impedance of a scope this attenuated probe will create a voltage divider between
your signal and the scope input
Most probes have a 9MΩ resistor for attenuating which when combined with a standard 1MΩ
input impedance on a scope creates a 110 voltage divider These probes are commonly
called 10X attenuated probes Many probes include a switch to select between 10X and 1X (no
attenuation)
EE Department Linear Circuit Analysis
CEME (NUST) Rawalpindi 13
Attenuated probes are great for improving accuracy at high frequencies but they will also reduce
the amplitude of your signal If yoursquore trying to measure a very low-voltage signal you may
have to go with a 1X probe You may also need to select a setting on your scope to tell it yoursquore
using an attenuated probe although many scopes can automatically detect this
Beyond the passive attenuated probe there are a variety of other probes out here Active
probes are powered probes (they require a separate power source) which can amplify your signal
or even pre-process it before it get to your scope While most probes are designed to measure
voltage there are probes designed to measure AC or DC current Current probes are unique
because they often clamp around a wire never actually making contact with the circuit
Using an Oscilloscope
The infinite variety of signals out there means yoursquoll never operate an oscilloscope the same way
twice But there are some steps you can count on performing just about every time you test a
circuit Wersquoll show an example signal and the steps required to measure it
Probe Selection and Setup
First off yoursquoll need to select a probe For most signals the simple passive probe included with
your scope will work perfectly fine
Next before connecting it to your scope set the attenuation on your probe 10X ndash the most
common attenuation factor ndash is usually the most well-rounded choice If you are trying to
measure a very low-voltage signal though you may need to use 1X
Connect the Probe and Turn the Scope On
Connect your probe to the first channel on your scope and turn it on Have some patience here
some scopes take as long to boot up as an old PC
When the scope boots up you should see the divisions scale and a noisy flat line of a
waveform
EE Department Linear Circuit Analysis
CEME (NUST) Rawalpindi 14
The screen should also show previously set values for time and volts per div Ignoring those
scales for now make these adjustments to put your scope into a standard setup
rsaquo Turn channel 1 on and channel 2 off
rsaquo Set channel 1 to DC coupling
rsaquo Set the trigger source to channel 1 ndash no external source or alternate channel triggering
rsaquo Set the trigger type to rising edge and the trigger mode to auto (as opposed to single)
rsaquo Make sure the scope probe attenuation on your scope matches the setting on your probe (eg
1X 10X)
For help making these adjustments you can consult scopersquos userrsquos manual
Testing the Probe
Letrsquos connect that channel up to a meaningful signal Most scopes will have a built-in frequency
generator that emits a reliable set-frequency wave ndash on the GA1102CAL there is a 1kHz square
wave output at the bottom-right of the front panel The frequency generator output has two
separate conductors ndash one for the signal and one for ground Connect your probersquos ground clip to
the ground and the probe tip to the signal output
As soon as you connect both parts of the probe you should see a signal begin to dance around
your screen Try fiddling with the horizontal and vertical system knobs to maneuver the
waveform around the screen Rotating the scale knobs clockwise will ldquozoom intordquo your
EE Department Linear Circuit Analysis
CEME (NUST) Rawalpindi 15
waveform and counter-clockwise zooms out You can also use the position knob to further
locate your waveform
If your wave is still unstable try rotating the trigger position knob Make sure the trigger isnrsquot
higher than the tallest peak of your waveform By default the trigger type should be set to edge
which is usually a good choice for square waves like this
Try fiddling with those knobs enough to display a single period of your wave on the screen
Or try zooming way out on the time scale to show dozens of squares
Compensating an Attenuated Probe
If your probe is set to 10X and you donrsquot have a perfectly square waveform as shown above you
may need to compensate your probe Most probes have a recessed screw head which you can
rotate to adjust the shunt capacitance of the probe
Try using a small screwdriver to rotate this trimmer and look at what happens to the waveform
EE Department Linear Circuit Analysis
CEME (NUST) Rawalpindi 16
Adjust the trimming cap on the probe handle until you have a straight-edged square wave
Compensation is only necessary if your probe is attenuated (eg 10X) in which case itrsquos critical
Probing Triggering and Scaling Tips
Once yoursquove compensated your probe itrsquos time to measure a real signal Go find a signal source
eg frequency generator and start
The first key to probing a signal is finding a solid reliable grounding point Clasp your ground
clip to a known ground sometimes you may have to use a small wire to intermediate between the
ground clip and your circuitrsquos ground point Then connect your probe tip to the signal under test
Probe tips exist in a variety of form factors ndash the spring-loaded clip fine point hooks etc ndash try
to find one that doesnrsquot require you to hold it in place all the time
Once your signal is on the screen you may want to begin by adjusting the horizontal and vertical
scales into at least the ldquoballparkrdquo of your signal If yoursquore probing a 5V 1kHz square wave
yoursquoll probably want the voltsdiv somewhere around 05-1V and set the secondsdiv to around
100micros (14 divisions would show about one and a half periods)
If part of your wave is rising or falling of the screen you can adjust the vertical
position to move it up or down If your signal is purely DC you may want to adjust the 0V level
near the bottom of your display
Once you have the scales ball parked your waveform may need some
triggering Edge triggering ndash where the scope tries to begin its scan when it sees voltage rise (or
fall) past a set point ndash is the easiest type to use Using an edge trigger try to set the trigger level
to a point on your waveform that only sees a rising edge once per period
Now just scale position trigger and repeat until yoursquore looking at exactly what you need
Measure Twice Cut Once
With a signal scoped triggered and scaled it comes time to measure transients periods and
other waveform properties Some scopes have more measurement tools than others but theyrsquoll
all at least have divisions from which you should be able to at least estimate the amplitude and
frequency
Many scopes support a variety of automatic measurement tools they may even constantly
display the most relevant information like frequency To get the most out of your scope yoursquoll
want to explore all of the measure functions it supports Most scopes will calculate frequency
EE Department Linear Circuit Analysis
CEME (NUST) Rawalpindi 17
amplitude duty cycle mean voltage and a variety of other wave characteristics for you
automatically
Using the scopersquos measure tools to find VPP VMax frequency period and duty cycle
A third measuring tool many scopes provide is cursors Cursors are on-screen
movable markers which can be placed on either the time or voltage axis Cursors usually come in
pairs so you can measure the difference between one and the other
Measuring the ringing of a square wave with cursors
Once yoursquove measured the quantity you were looking for you can begin to make adjustments to
your circuit and measure some more Some scopes also
support saving printing or storing a waveform so you can recall it and remember those good
old times when you scoped that signal
To find out more about what your scope can do consult its userrsquos manual
Voltmeter Usage
A multi-meter is an electrical instrument capable of measuring voltage current and resistance
Digital multi-meters have numerical displays like digital clocks for indicating the quantity of
voltage current or resistance Analog multi-meters indicate these quantities by means of a
moving pointer over a printed scale
Some digital multi-meters are auto-ranging An auto-ranging meter has only a few
EE Department Linear Circuit Analysis
CEME (NUST) Rawalpindi 18
selector switch (dial) positions Manual-ranging meters have several different selector positions
for each basic quantity several for voltage several for current and several for resistance
In order to measure voltage of a battery set your multi-meterrsquos selector switch to the
highest-value lsquoDC voltrsquo position available Auto-ranging multi-meters may only have a single
position for DC voltage in which case you need to set the switch to that one position Touch the
red test probe to the positive (+) side of a battery and the black test probe to the negative (-) side
of the same battery The meter should now provide you with some sort of indication Reverse the
test probe connections to the battery if the meterrsquos indication is negative (on an analog meter a
negative value is indicated by the pointer deflecting left instead of right)
If your meter is a manual-range type and the selector switch has been set to a high-
range position the indication will be small Move the selector switch to the next lower DC
voltage range setting and reconnect to the battery The indication should be stronger now as
indicated by a greater deflection of the analog meter pointer (needle) or more active digits on the
digital meter display For the best results move the selector switch to the lowest-range setting
that does not lsquoover-rangersquo the meter An over-ranged analog meter is said to be lsquopeggedrsquo as the
needle will be forced all the way to the right-hand side of the scale past the full-range scale
value An over-ranged digital meter sometimes displays the letters lsquoOLrsquo or a series of dashed
lines This indication is manufacturer-specific
Ohmmeter Usage
Be sure to never measure the resistance of any electrically lsquoliversquo object or circuit In other words
do not attempt to measure the resistance of a battery or any other source of substantial voltage
using a multi-meter set to the resistance (ohms) function failing to heed this warning will likely
result in meter damage and even personal injury
Connect the meterrsquos test probes across the resistor as such and note its indication on the
resistance scale
EE Department Linear Circuit Analysis
CEME (NUST) Rawalpindi 19
If the needle points very close to zero you need to select a lower resistance range on the Meter
If you are using a digital multi-meter you should see a numerical figure close to 10 shown on the
display with a small rdquokrdquo symbol on the right-hand side denoting the metric prefix for rdquokilordquo
(thousand) Some digital meters are manually-ranged and require appropriate range selection
just as the analog meter If yours is like this experiment with different range switch positions
and see which one gives you the best indication
Ammeter Usage
Current is the measure of the rate of electron lsquoflowrsquo in a circuit It is measured in the unit of the
Ampere simply called lsquoAmprsquo (A)
The most common way to measure current in a circuit is to break the circuit open and insert an
lsquoammeterrsquo in series (in-line) with the circuit so that all electrons flowing through the circuit also
have to go through the meter Because measuring current in this manner requires the meter be
made part of the circuit it is a more difficult type of measurement to make than either voltage or
resistance
Some digital meters like the unit shown in the illustration have a separate jack to insert the red
test lead plug when measuring current Other meters like most inexpensive analog meters use
the same jacks for measuring voltage resistance and current
EE Department Linear Circuit Analysis
CEME (NUST) Rawalpindi 20
EXPERIMENT NO ndash 02 OHMrsquoS LAW
(EXPERIMENTAL VERIFICATION OF OHMrsquoS LAW)
OBJECTIVE
- To verify ohmrsquos law experimentally
APPARATUS
1 DC power supply
2 Three resistances of different values
3 Connecting wires
4 Digital multi meter (DMM) Voltmeter Ammeter
THEORY
Ohmrsquos Law
When current I flows through a resistor then the potential difference V (often simply called
voltage) between its terminals is proportional to I as in equation (1) where R is the resistance
Basic Equation V = R I (1)
Combinations of Resistors
When two or more resistors ( R1 R2 R3hellip) are connected in series (Fig 1) then this
combination is equivalent to a single resisto of resistance Req given by (2)
Basic Formula Req = R1 + R2 + R3+ (2)
When two or more resistors are connected in parallel (Fig 2) then the equivalent resistance Req
is given by (3)
Basic Formula Req = 1 + 1 + 1 + 1
R1 R2 R3
(2)
EE Department Linear Circuit Analysis
CEME (NUST) Rawalpindi 21
PROCEDURE amp OBSERVATIONS
Part I Ohmrsquos Law
rsaquo Make sure that the DC power supply is off and unplugged Make sure that the regulating
knobs are in minimum positions Your instructor will explain to you the operation of DC power
supply the ammeter and the voltmeter
rsaquo Construct the circuit as in Fig 3a using the resistor marked R1 in your sample Use the dc
ammeter scale and make sure that + and ndash markings are exactly as in Fig 3a
rsaquo Set the voltmeter scale to dc volts scale Attach connectors to your voltmeter (or DMM as
voltmeter suggestion use a red connector for the + terminal and a black one for -) Connect the
+ terminal to point B (where the current enters the resistor) and the other one to point A
rsaquo Make sure all connections are tight If you have a faulty connector immediately hand it to your
instructor Note Call your instructor to check your circuit Do not proceed without his or her permission rsaquo After your instructorrsquos approval prepare on your data sheet your first table as shown Plug in
the power supply With the regulating knob(s) in Min position turn the power ldquoONrdquo
Turn slowly the regulating knob(s) and watch both the ammeter and the voltmeter readings to
increase (if not turn off the power at once and call your instructor)Keep doing this until the
ammeter reaches 50mA or the voltmeter reaches 5 volts whichever comes first Record the
current I and the voltage V to three significant digits by estimating fractions of smallest
divisions on the scales
Resistor R1 Resistor R2 Resistor R3
I (mA) V (volts) I (mA) V (volts) I (mA) V (volts)
EE Department Linear Circuit Analysis
CEME (NUST) Rawalpindi 22
rsaquo Decreasing the current record I and V four more times (a total of 5 readings) in roughly equal
intervals The lowest current should be 5 to 10 mA
rsaquo Repeat the last two steps for your resistors R2 and R3 with maximum current close to 50 mA
but using the finest voltmeter scale possible for each given resistor
rsaquo Turn the power ldquoOFFrdquo and record
- The uncertainties in your readings on all scales of ammeter and voltmeter which you have
used
- The zero readings of your ammeter these are their readings when they are completely
disconnected from any circuits They should be close to zero but not necessarily exactly so
Procedure Part II Combinations of Resistors
rsaquo Connect all three resistors R1 R2 R3 in series and use the DC volt scale on the voltmeter
Record 5 runs as before (Note your maximum current may be less than 50 ma because the
voltage must not exceed 10mvolts)
rsaquo Connect all these resistors in parallel Again use the DC voltmeter scale with the maximum
current close to 50 mA Record 5 runs as before
rsaquo Estimate (from your data in Part I) the values of R1 R2 R3 Take the two higher
resistances (record which ones you are using) and connect them in parallel Connect this
combination in series with the remaining resistor Record 5 runs as usual
R1 R2 R3
in Series
R1 R2 R3
in Parallel
R1 R2 R3
2 Parallel in Series
with 3rd
I (mA) V (volts) I (mA) V (volts) I (mA) V (volts)
Graphical Results
rsaquo Using graph paper plot V vs I for each of your resistors R1 R2 R3 Draw the line of best fit
in each case and (from the slope) determine the resistance in ohms 3 significant digits Display
all calculations on the graph sheet
EE Department Linear Circuit Analysis
CEME (NUST) Rawalpindi 23
R1= R2= R3=
rsaquo Using graph paper plot V vs I for each of the three combinations Determine Req for each
case as in (1) above
rsaquo From your results in (1) calculate the predicted (= theoretical) values of Req for each of the
three combinations Display the calculations clearly
rsaquo Summarize your results in the table shown For discrepancies use the predicted values as
more reliable (that is refer to them as if they were exact)
COMBINATION PREDICTED R MEASURED R
DISCR
ALL IN SERIES
ALL IN PARALLEL
SERIES amp
PARALLEL
EE Department Linear Circuit Analysis
CEME (NUST) Rawalpindi 24
EE Department Linear Circuit Analysis
CEME (NUST) Rawalpindi 25
EXPERIMENT NO ndash 03 DIVIDER RULES
(VERIFICATION OF CURRENT DIVIDER RULE amp VOLTAGE DIVIDER RULE)
OBJECTIVE
- Verify the divider rules for voltage (VDR) and current (CDR)
THEORY The Voltage Divider Rule (VDR) states that the voltage across an element or across a series
combination of elements in a series circuit is equal to the resistance of the element or series
combination of elements divided by the total resistance of the series circuit and multiplied by the
total impressed voltage
The Current Divider Rule (CDR) states that the current through one of two parallel branches is
equal to the resistance of the other branch divided by the sum of the resistances of the two
parallel branches and multiplied by the total current entering the two parallel branches That is
APPARATUS
1 Power Supply 2 Resistances 3 Digital Multi-Meter (DMM)
4 Connecting Wires 5 Bread Board
PROCEDURE
Part 1 Voltage Divider Rule (VDR)
Construct the circuit
rsaquo Without making any calculations what value would you expect for the voltage across each
resistor Explain your reasoning
EE Department Linear Circuit Analysis
CEME (NUST) Rawalpindi 26
rsaquo Calculate V1 using the VDR with the measured resistor values Measure V1 and determine the
percent difference between the theoretical and experimental results How do they compare
rsaquo If R2 = R3 then the VDR states the V2 = V3 and V1 = V2 + V3 Measure voltages V2 and V3
and comment on the validity of these statements
rsaquo Using VDR calculate the voltage Vab Measure Vab and determine the percent difference
between the theoretical and experimental results How do they compare
EE Department Linear Circuit Analysis
CEME (NUST) Rawalpindi 27
rsaquo Remove resistor R2 to construct the following open circuit
rsaquo Using the measured resistor values calculate the voltages V1 V2 and Vopen using VDR
Measure voltages V1 V2 and Vopen with the DMM and calculate the percent differences
Explain the reasoning
Part 2 Current Divider Rule (CDR)
Construct the circuit
EE Department Linear Circuit Analysis
CEME (NUST) Rawalpindi 28
rsaquo Without making any calculations what value would you expect for the current through each of
the resistors Explain your reasoning
rsaquo Calculate the currents I1 I2 and I3 using the CDR from the measured value of Is Measure the
currents I1 I2 and I3
rsaquo Based on these measurements are your conclusions of earlier part verified Use a percent
difference to compare the theoretical and experimental results
rsaquo Set the maximum current coming from the power supply at 200 mA via a short Place a short
circuit across the 10kΩ-resistor to construct the following circuit
EE Department Linear Circuit Analysis
CEME (NUST) Rawalpindi 29
Part 3 Challenge Circuit
Construct the circuit below
rsaquo Calculate the voltages V1 V2 V3 and V4 using the VDR with measured resistor values
Measure the voltages V1 V2 V3 and V4 and use a percent difference to compare the calculated
and measured results How do they compare
rsaquo Using the results of earlier part calculate the voltage Vab using KVL
rsaquo Measure the voltage Vab and use a percent difference to compare the calculated and measured
results How do they compare Is the voltage Vab equal to V1 ndash V3 Equal to V2 ndash V4 Explain
your reasoning
rsaquo Suppose now that a short is placed across the terminal points ab Calculate the current Iab
through the short Measure the current Iab and use a percent difference to compare the theoretical
and experimental results How do they compare
Note Use separate sheet for the findings of above part
EE Department Linear Circuit Analysis
CEME (NUST) Rawalpindi 30
EXPERIMENT NO ndash 04 NODAL ANALYSIS
(EXPERIMENTAL VERIFICATION OF NODAL ANALYSIS)
OBJECTIVE
- To analyze a circuit and to determine the unknown parameters of the circuit
THEORY
Under this method the following procedure is adopted
Assume the voltage of different independent nodes
rsaquo Write the equations for each node as per Kirchhoffrsquos Current Law
rsaquo Solve the above equations to get the node voltages
rsaquo Calculate the branch current from the values of node voltages
Let us consider the circuit shown in the figure below L and M are two
independent nodes M can be taken as a reference node Let the voltage of node L (with respect
to M) be VL
Using Kirchofflsquos Law we get
I1+I2=I3
Ohmrsquos law gives
I1= V1 R1= (E1-VL) R1
I2=V2R2 = (E2-VL) R2
I3 =VL R3
(E1-VL)R1 + (E2-VL)R2= VLR3
Rearranging the terms we get
VL (1R1+1R2+1R3)-E1R1-E2R2=0
EE Department Linear Circuit Analysis
CEME (NUST) Rawalpindi 31
It may be noted that the above nodal equation contains the following terms
rsaquo The node voltage multiplied by the sum of all the conductances connected to that node This
term is positive
rsaquo The node voltage at the other end of each branch (connected to this node) multiplied by the
conductance of the branch These terms are negative
rsaquo In this method of solving a network the no of equations required for the solution is one less
than the no of independent nodes in the network
In general the nodal analysis yields similar solutions
APPARATUS
1 Two DC power supplies
2 Five resistances of different values
3 Connecting wires
4 Digital multi meter (DMM)
PROCEDURE
rsaquo Construct the circuit shown in Figure below
Figure
rsaquo Pick the resistances Also verify their resistance by meter and record it in table
rsaquo Solve given circuit for the unknowns before moving to the circuit for measured values
rsaquo Set the DC supply E1=10V and E2=5V
rsaquo Measure the currents through resistances R1 R2 R3 R4 amp R5 and record it in table
rsaquo Also measure voltages across each resistor
rsaquo Now set the DC supply E1=5V and E2=7V
rsaquo Repeat all steps and record the values
Note Use measured values of resistances for all calculations Make these calculations on the space provided
EE Department Linear Circuit Analysis
CEME (NUST) Rawalpindi 32
OBSERVATIONS amp CALCULATIONS
EE Department Linear Circuit Analysis
CEME (NUST) Rawalpindi 33
Resistors R1 R2 R3 R4 R5
Rated
Values
Measured
Values
For E1=10V and E2=5V
Voltages VR1 VR2 VR3 VR4 VR5
Calculated
Values
Measured
Values
Percentage
Difference
Currents IR1 IR2 IR3 IR4 IR5
Calculated
Values
Measured
Values
Percentage
Difference
E1=5V and E2=7V
Voltages VR1 VR2 VR3 VR4 VR5
Calculated
Values
Measured
Values
Percentage
Difference
Currents IR1 IR2 IR3 IR4 IR5
Calculated
Values
Measured
Values
Percentage
Difference
Challenge Swap the resistors R1 with R4 R5 with R2 and repeat all above steps to determine
unknown voltages and currents both theoretically and practically
Note Use separate sheets for analysis of above problem
EE Department Linear Circuit Analysis
CEME (NUST) Rawalpindi 34
ANSWER THE FOLLOWING QUESTIONS
(a) What is a node
(b) Calculate the equivalent resistance
(c) Solve the following circuit for power dissipation (P=VI) across R1 R2 and R3
(d) What do you meant by a super node
Note Use separate sheets for answering above questions
EE Department Linear Circuit Analysis
CEME (NUST) Rawalpindi 35
EXPERIMENT NO ndash 05 MESH ANALYSIS
(EXPERIMENTAL VERIFICATION OF MESH ANALYSIS)
OBJECTIVE
- To analyze a two Mesh circuit and to determine the current in each branch of the circuit
THEORY
The mesh analysis is a systematic way of applying KVL around each mesh of a circuit and
describes the branch voltages in terms of the mesh currents This will give us a set of equations
that we solve together to find the mesh currents Once we find the mesh currents we can use
them to calculate any other currents or voltages of interest
We know from KVL the algebraic sum of voltages around a close loop is zero so considering the
circuit shown below and applying KVL in each loop (mesh)
While writing equations for
Applying KVL to mesh 1
- E1 + I1R1 + (I1 - I2) R2 = 0
I1 (R1 + R2) - I2R2 = E1 (1)
Applying KVL to mesh 2
- E2 + (I2 - I1) R2 + I2R3 = 0
I2 (R2 + R3) - I1R2 = E2 (2)
Solving above two equations values of unknowns can easily be calculated
=
EE Department Linear Circuit Analysis
CEME (NUST) Rawalpindi 36
APPARATUS
1 Two DC power supplies
2 Three resistances of different values
3 Connecting wires
4 Digital multi meter (DMM)
PROCEDURE
rsaquo Construct the circuit shown in Figure below
rsaquo Pick the resistances Also verify their resistance by meter and record it in table
rsaquo Solve given circuit for the unknowns before moving to the circuit for measured values
rsaquo Set the DC supply E1=12V and E2=5V
rsaquo Measure the currents through resistances R1 R2 amp R3 and record it in table
rsaquo Also measure voltages across each resistor
rsaquo Now set the DC supply E1=5V and E2=12V
rsaquo Repeat all steps and record the values
Note Use measured values of resistances for all calculations Make these calculations on the space provided
OBSERVATIONS amp CALCULATIONS
EE Department Linear Circuit Analysis
CEME (NUST) Rawalpindi 37
Resistors R1 R2 R3
Rated Values
Measured Values
For E1=12V and E2=5V
Voltages VR1 VR2 VR3
Calculated Values
Measured Values
Percentage
Difference
Currents IR1 IR2 IR3
Calculated Values
Measured Values
EE Department Linear Circuit Analysis
CEME (NUST) Rawalpindi 38
Percentage
Difference
E1=5V and E2=12V
Voltages VR1 VR2 VR3
Calculated Values
Measured Values
Percentage
Difference
Currents IR1 IR2 IR3
Calculated Values
Measured Values
Percentage
Difference
Challenge Swap the resistors R1 with R3 and repeat all above steps to determine unknown
voltages and currents both theoretically and practically
Note Use separate sheets for analysis of above problem
EE Department Linear Circuit Analysis
CEME (NUST) Rawalpindi 39
ANSWER THE FOLLOWING QUESTIONS
(a) What is the difference between a loop and a mesh
(b) What is an ideal voltage source How is it different from real voltage source
(c) What is an ideal current source How is it different from real current source
(d) Solve the following circuit for power dissipation across R1 R2 and R3
(e) What do you meant by a super mesh
Note Use separate sheets for answering above questions
EE Department Linear Circuit Analysis
CEME (NUST) Rawalpindi 40
EXPERIMENT NO ndash 06 THEVENINS THEOREM
(EXPERIMENTAL VERIFICATION OF THEVENINS THEOREM)
OBJECTIVE
- To Verify Thevenin Theorem by finding its Theveninrsquos Equivalent Circuit
THEORY
Any linear circuit is equivalent to a single voltage source (Thevenins Voltage) in series with
single equivalent resistance (Theveninrsquos Equivalent Resistances)
Applying Theveninrsquos Theorem
rsaquo Step 1 Remove the load and find voltage across the open-circuit terminals Vth All the circuit
analysis techniques presented can be used to compute this voltage
rsaquo Step 2 Determine the Thevenin equivalent resistance of the network at the open terminals with
the load removed Three different types of circuits may be encountered in determining the
resistance Rth
- If the circuit contains only independent sources they are made zero by replacing the voltage
sources with short circuits and the current sources with open circuits Rth is then found by
computing the resistance of purely resistive network at the open terminals
- If the circuit contains only dependent sources an independent voltage or current source is
applied at the open terminals and the corresponding current or voltage at these terminals is
measured The VoltageCurrent ratio at the terminals is the Thevenin equivalent resistance Since
there is no energy source the open circuit voltage is zero in this case
- If the circuit contains both the independent and dependent sources the open circuit terminals
are shorted and the short-circuit current between these terminals is determined The ratio of the
open circuit voltage to short circuit current is the resistance Rth
rsaquo Step 3 If the load is now connected to the Thevenin equivalent circuit consisting of Vth in
series with Rth the desired solution can be obtained
APPARATUS
1 DMM
2 Power Supply
3 Resistances (120Ω 1k Ω 390Ω)
PROCEDURE
rsaquo Calculate measured values of resistances
rsaquo Reduce the circuit by calculating the Thevenin equivalent resistance across the terminals A amp
B
rsaquo Calculate the Thevenin equivalent voltage across terminals ldquoArdquo and ldquoBrdquo for 5V 10V 15V
rsaquo Pertaining to circuit in figure III calculate values of IL for different values of RL
rsaquo Now construct circuit in figure I measure the value of Vth by removing RL
EE Department Linear Circuit Analysis
CEME (NUST) Rawalpindi 41
rsaquo Construct circuit in figure II to have measured value of Rth
rsaquo Construct circuit in figure III to determine measured values of IL for different values of RL
Figure-I
Figure-II
Figure-III
OBSERVATIONS amp CALCULATIONS
R1 R2 R3
Vs Vth Rth RL IL
5V 1kΩ
22kΩ
10V 1kΩ
22kΩ
15V 1kΩ
22kΩ
Table Calculated Values
EE Department Linear Circuit Analysis
CEME (NUST) Rawalpindi 42
Vs Vth Rth RL IL
5V 1kΩ
22kΩ
10V 1kΩ
22kΩ
15V 1kΩ
22kΩ
Table Measured Values
Challenge Replacing 1kΩ resistances by 22kΩ and keeping all other things same redo the
above analysis
Note Use separate sheets for analysis of above problem
EE Department Linear Circuit Analysis
CEME (NUST) Rawalpindi 43
ANSWER THE FOLLOWING QUESTIONS
(a) Use Theveninrsquos Theorem to find the current through the 5Ω resistance in the circuit diagram
shown below
(b)What is the importance of Theveninrsquos Theorem in circuit analysis
(c) Discuss the limitations of Theveninrsquos Theorem
(d) A light bulb draws 05A current at the input voltage of 230V Determine the resistance of the
filament and also the power dissipated
Note Use separate sheets for answering above questions
EE Department Linear Circuit Analysis
CEME (NUST) Rawalpindi 44
EXPERIMENT NO ndash 07 MAXIMUM POWER TRANSFER THEOREM
(EXPERIMENTAL VERIFICATION OF MAXIMUM POWER TRANSFER THEOREM FOR A NETWORK)
OBJECTIVE
- To prove maximum power transfer theorem practically
THEORY
The power transferred from a source supply source to load is at its maximum when the resistance
of the load is equal to the internal resistance of the source In other words ldquoA resistive will be
consuming maximum power from the supply when the load resistance is equal to the equivalent
(Thevenin) resistancerdquo
A graph of RL against P is shown in figure below the maximum value of power occurs at RL=
Rth
EE Department Linear Circuit Analysis
CEME (NUST) Rawalpindi 45
APPARATUS
1 DMM
2 Power Supply
3 Resistances fixed (22kΩ 1kΩ) variable (5kΩ)
PROCEDURE
rsaquo Connect the circuit shown in the figure below
rsaquo From the circuit it can be noted that Rth is fixed resistance of value 22kΩ but RL is variable
of value 5kΩ
rsaquo Set the value of Vth = 10 V
rsaquo Change the value of RL in steps as shown in table
rsaquo Measure the voltage VL and current IL and record it in table
rsaquo Plot the graph of power vs load resistance (RL)
rsaquo Using graph estimate P max (practical)
rsaquo Use P max = Vthsup2 4Rth to have the value of P max (theoratical)
rsaquo Repeat above steps by using Rth = 1kΩ
OBSERVATIONS amp CALCULATIONS
PART (I)
For Vth = 10 V Rth = 22kΩ
RL IL VL Power = IL x VL
03kΩ
06kΩ
09kΩ
15kΩ
22kΩ
25kΩ
30kΩ
EE Department Linear Circuit Analysis
CEME (NUST) Rawalpindi 46
33kΩ
36kΩ
40kΩ
P max (theoratical)
P max (practical)
Difference
PART (II)
For Vth = 10V Rth = 1kΩ
RL IL VL Power = IL x VL
03kΩ
06kΩ
09kΩ
15kΩ
22kΩ
25kΩ
30kΩ
33kΩ
36kΩ
40kΩ
EE Department Linear Circuit Analysis
CEME (NUST) Rawalpindi 47
P max (theoratical)
P max (practical)
Difference
Challenge For Rth = 1kΩ +22kΩ estimate maximum power transferred to the circuit
practically Also compare it with theoretical value
Note Use separate sheets for analysis of above problem
EE Department Linear Circuit Analysis
CEME (NUST) Rawalpindi 48
ANSWER THE FOLLOWING QUESTIONS
(a) What is meant by load matching
(b) Find the value of RL for maximum power transfer in the network shown below Also
calculate the maximum power that can be transferred to this load
Note Use separate sheets for answering above questions

EE Department Linear Circuit Analysis
CEME (NUST) Rawalpindi 12
While probes may seem like simple devices that just latch onto your circuit and carry a signal to
the scope therersquos actually a lot that goes into probe design and selection
Optimally what a probe needs to be is invisible ndash it shouldnrsquot have any effect on
your signal under test Unfortunately long wires all have intrinsic inductance capacitance and
resistance so no matter what theyrsquoll affect scope readings (especially at high frequencies)
There are a variety of probe types out there the most common of which is
the passive probe included with most scopes Most of the ldquostockrdquo passive probes are attenuated
Attenuating probes have a large resistance intentionally built-in and shunted by a small capacitor
which helps to minimize the effect that a long cable might have on loading your circuit In series
with the input impedance of a scope this attenuated probe will create a voltage divider between
your signal and the scope input
Most probes have a 9MΩ resistor for attenuating which when combined with a standard 1MΩ
input impedance on a scope creates a 110 voltage divider These probes are commonly
called 10X attenuated probes Many probes include a switch to select between 10X and 1X (no
attenuation)
EE Department Linear Circuit Analysis
CEME (NUST) Rawalpindi 13
Attenuated probes are great for improving accuracy at high frequencies but they will also reduce
the amplitude of your signal If yoursquore trying to measure a very low-voltage signal you may
have to go with a 1X probe You may also need to select a setting on your scope to tell it yoursquore
using an attenuated probe although many scopes can automatically detect this
Beyond the passive attenuated probe there are a variety of other probes out here Active
probes are powered probes (they require a separate power source) which can amplify your signal
or even pre-process it before it get to your scope While most probes are designed to measure
voltage there are probes designed to measure AC or DC current Current probes are unique
because they often clamp around a wire never actually making contact with the circuit
Using an Oscilloscope
The infinite variety of signals out there means yoursquoll never operate an oscilloscope the same way
twice But there are some steps you can count on performing just about every time you test a
circuit Wersquoll show an example signal and the steps required to measure it
Probe Selection and Setup
First off yoursquoll need to select a probe For most signals the simple passive probe included with
your scope will work perfectly fine
Next before connecting it to your scope set the attenuation on your probe 10X ndash the most
common attenuation factor ndash is usually the most well-rounded choice If you are trying to
measure a very low-voltage signal though you may need to use 1X
Connect the Probe and Turn the Scope On
Connect your probe to the first channel on your scope and turn it on Have some patience here
some scopes take as long to boot up as an old PC
When the scope boots up you should see the divisions scale and a noisy flat line of a
waveform
EE Department Linear Circuit Analysis
CEME (NUST) Rawalpindi 14
The screen should also show previously set values for time and volts per div Ignoring those
scales for now make these adjustments to put your scope into a standard setup
rsaquo Turn channel 1 on and channel 2 off
rsaquo Set channel 1 to DC coupling
rsaquo Set the trigger source to channel 1 ndash no external source or alternate channel triggering
rsaquo Set the trigger type to rising edge and the trigger mode to auto (as opposed to single)
rsaquo Make sure the scope probe attenuation on your scope matches the setting on your probe (eg
1X 10X)
For help making these adjustments you can consult scopersquos userrsquos manual
Testing the Probe
Letrsquos connect that channel up to a meaningful signal Most scopes will have a built-in frequency
generator that emits a reliable set-frequency wave ndash on the GA1102CAL there is a 1kHz square
wave output at the bottom-right of the front panel The frequency generator output has two
separate conductors ndash one for the signal and one for ground Connect your probersquos ground clip to
the ground and the probe tip to the signal output
As soon as you connect both parts of the probe you should see a signal begin to dance around
your screen Try fiddling with the horizontal and vertical system knobs to maneuver the
waveform around the screen Rotating the scale knobs clockwise will ldquozoom intordquo your
EE Department Linear Circuit Analysis
CEME (NUST) Rawalpindi 15
waveform and counter-clockwise zooms out You can also use the position knob to further
locate your waveform
If your wave is still unstable try rotating the trigger position knob Make sure the trigger isnrsquot
higher than the tallest peak of your waveform By default the trigger type should be set to edge
which is usually a good choice for square waves like this
Try fiddling with those knobs enough to display a single period of your wave on the screen
Or try zooming way out on the time scale to show dozens of squares
Compensating an Attenuated Probe
If your probe is set to 10X and you donrsquot have a perfectly square waveform as shown above you
may need to compensate your probe Most probes have a recessed screw head which you can
rotate to adjust the shunt capacitance of the probe
Try using a small screwdriver to rotate this trimmer and look at what happens to the waveform
EE Department Linear Circuit Analysis
CEME (NUST) Rawalpindi 16
Adjust the trimming cap on the probe handle until you have a straight-edged square wave
Compensation is only necessary if your probe is attenuated (eg 10X) in which case itrsquos critical
Probing Triggering and Scaling Tips
Once yoursquove compensated your probe itrsquos time to measure a real signal Go find a signal source
eg frequency generator and start
The first key to probing a signal is finding a solid reliable grounding point Clasp your ground
clip to a known ground sometimes you may have to use a small wire to intermediate between the
ground clip and your circuitrsquos ground point Then connect your probe tip to the signal under test
Probe tips exist in a variety of form factors ndash the spring-loaded clip fine point hooks etc ndash try
to find one that doesnrsquot require you to hold it in place all the time
Once your signal is on the screen you may want to begin by adjusting the horizontal and vertical
scales into at least the ldquoballparkrdquo of your signal If yoursquore probing a 5V 1kHz square wave
yoursquoll probably want the voltsdiv somewhere around 05-1V and set the secondsdiv to around
100micros (14 divisions would show about one and a half periods)
If part of your wave is rising or falling of the screen you can adjust the vertical
position to move it up or down If your signal is purely DC you may want to adjust the 0V level
near the bottom of your display
Once you have the scales ball parked your waveform may need some
triggering Edge triggering ndash where the scope tries to begin its scan when it sees voltage rise (or
fall) past a set point ndash is the easiest type to use Using an edge trigger try to set the trigger level
to a point on your waveform that only sees a rising edge once per period
Now just scale position trigger and repeat until yoursquore looking at exactly what you need
Measure Twice Cut Once
With a signal scoped triggered and scaled it comes time to measure transients periods and
other waveform properties Some scopes have more measurement tools than others but theyrsquoll
all at least have divisions from which you should be able to at least estimate the amplitude and
frequency
Many scopes support a variety of automatic measurement tools they may even constantly
display the most relevant information like frequency To get the most out of your scope yoursquoll
want to explore all of the measure functions it supports Most scopes will calculate frequency
EE Department Linear Circuit Analysis
CEME (NUST) Rawalpindi 17
amplitude duty cycle mean voltage and a variety of other wave characteristics for you
automatically
Using the scopersquos measure tools to find VPP VMax frequency period and duty cycle
A third measuring tool many scopes provide is cursors Cursors are on-screen
movable markers which can be placed on either the time or voltage axis Cursors usually come in
pairs so you can measure the difference between one and the other
Measuring the ringing of a square wave with cursors
Once yoursquove measured the quantity you were looking for you can begin to make adjustments to
your circuit and measure some more Some scopes also
support saving printing or storing a waveform so you can recall it and remember those good
old times when you scoped that signal
To find out more about what your scope can do consult its userrsquos manual
Voltmeter Usage
A multi-meter is an electrical instrument capable of measuring voltage current and resistance
Digital multi-meters have numerical displays like digital clocks for indicating the quantity of
voltage current or resistance Analog multi-meters indicate these quantities by means of a
moving pointer over a printed scale
Some digital multi-meters are auto-ranging An auto-ranging meter has only a few
EE Department Linear Circuit Analysis
CEME (NUST) Rawalpindi 18
selector switch (dial) positions Manual-ranging meters have several different selector positions
for each basic quantity several for voltage several for current and several for resistance
In order to measure voltage of a battery set your multi-meterrsquos selector switch to the
highest-value lsquoDC voltrsquo position available Auto-ranging multi-meters may only have a single
position for DC voltage in which case you need to set the switch to that one position Touch the
red test probe to the positive (+) side of a battery and the black test probe to the negative (-) side
of the same battery The meter should now provide you with some sort of indication Reverse the
test probe connections to the battery if the meterrsquos indication is negative (on an analog meter a
negative value is indicated by the pointer deflecting left instead of right)
If your meter is a manual-range type and the selector switch has been set to a high-
range position the indication will be small Move the selector switch to the next lower DC
voltage range setting and reconnect to the battery The indication should be stronger now as
indicated by a greater deflection of the analog meter pointer (needle) or more active digits on the
digital meter display For the best results move the selector switch to the lowest-range setting
that does not lsquoover-rangersquo the meter An over-ranged analog meter is said to be lsquopeggedrsquo as the
needle will be forced all the way to the right-hand side of the scale past the full-range scale
value An over-ranged digital meter sometimes displays the letters lsquoOLrsquo or a series of dashed
lines This indication is manufacturer-specific
Ohmmeter Usage
Be sure to never measure the resistance of any electrically lsquoliversquo object or circuit In other words
do not attempt to measure the resistance of a battery or any other source of substantial voltage
using a multi-meter set to the resistance (ohms) function failing to heed this warning will likely
result in meter damage and even personal injury
Connect the meterrsquos test probes across the resistor as such and note its indication on the
resistance scale
EE Department Linear Circuit Analysis
CEME (NUST) Rawalpindi 19
If the needle points very close to zero you need to select a lower resistance range on the Meter
If you are using a digital multi-meter you should see a numerical figure close to 10 shown on the
display with a small rdquokrdquo symbol on the right-hand side denoting the metric prefix for rdquokilordquo
(thousand) Some digital meters are manually-ranged and require appropriate range selection
just as the analog meter If yours is like this experiment with different range switch positions
and see which one gives you the best indication
Ammeter Usage
Current is the measure of the rate of electron lsquoflowrsquo in a circuit It is measured in the unit of the
Ampere simply called lsquoAmprsquo (A)
The most common way to measure current in a circuit is to break the circuit open and insert an
lsquoammeterrsquo in series (in-line) with the circuit so that all electrons flowing through the circuit also
have to go through the meter Because measuring current in this manner requires the meter be
made part of the circuit it is a more difficult type of measurement to make than either voltage or
resistance
Some digital meters like the unit shown in the illustration have a separate jack to insert the red
test lead plug when measuring current Other meters like most inexpensive analog meters use
the same jacks for measuring voltage resistance and current
EE Department Linear Circuit Analysis
CEME (NUST) Rawalpindi 20
EXPERIMENT NO ndash 02 OHMrsquoS LAW
(EXPERIMENTAL VERIFICATION OF OHMrsquoS LAW)
OBJECTIVE
- To verify ohmrsquos law experimentally
APPARATUS
1 DC power supply
2 Three resistances of different values
3 Connecting wires
4 Digital multi meter (DMM) Voltmeter Ammeter
THEORY
Ohmrsquos Law
When current I flows through a resistor then the potential difference V (often simply called
voltage) between its terminals is proportional to I as in equation (1) where R is the resistance
Basic Equation V = R I (1)
Combinations of Resistors
When two or more resistors ( R1 R2 R3hellip) are connected in series (Fig 1) then this
combination is equivalent to a single resisto of resistance Req given by (2)
Basic Formula Req = R1 + R2 + R3+ (2)
When two or more resistors are connected in parallel (Fig 2) then the equivalent resistance Req
is given by (3)
Basic Formula Req = 1 + 1 + 1 + 1
R1 R2 R3
(2)
EE Department Linear Circuit Analysis
CEME (NUST) Rawalpindi 21
PROCEDURE amp OBSERVATIONS
Part I Ohmrsquos Law
rsaquo Make sure that the DC power supply is off and unplugged Make sure that the regulating
knobs are in minimum positions Your instructor will explain to you the operation of DC power
supply the ammeter and the voltmeter
rsaquo Construct the circuit as in Fig 3a using the resistor marked R1 in your sample Use the dc
ammeter scale and make sure that + and ndash markings are exactly as in Fig 3a
rsaquo Set the voltmeter scale to dc volts scale Attach connectors to your voltmeter (or DMM as
voltmeter suggestion use a red connector for the + terminal and a black one for -) Connect the
+ terminal to point B (where the current enters the resistor) and the other one to point A
rsaquo Make sure all connections are tight If you have a faulty connector immediately hand it to your
instructor Note Call your instructor to check your circuit Do not proceed without his or her permission rsaquo After your instructorrsquos approval prepare on your data sheet your first table as shown Plug in
the power supply With the regulating knob(s) in Min position turn the power ldquoONrdquo
Turn slowly the regulating knob(s) and watch both the ammeter and the voltmeter readings to
increase (if not turn off the power at once and call your instructor)Keep doing this until the
ammeter reaches 50mA or the voltmeter reaches 5 volts whichever comes first Record the
current I and the voltage V to three significant digits by estimating fractions of smallest
divisions on the scales
Resistor R1 Resistor R2 Resistor R3
I (mA) V (volts) I (mA) V (volts) I (mA) V (volts)
EE Department Linear Circuit Analysis
CEME (NUST) Rawalpindi 22
rsaquo Decreasing the current record I and V four more times (a total of 5 readings) in roughly equal
intervals The lowest current should be 5 to 10 mA
rsaquo Repeat the last two steps for your resistors R2 and R3 with maximum current close to 50 mA
but using the finest voltmeter scale possible for each given resistor
rsaquo Turn the power ldquoOFFrdquo and record
- The uncertainties in your readings on all scales of ammeter and voltmeter which you have
used
- The zero readings of your ammeter these are their readings when they are completely
disconnected from any circuits They should be close to zero but not necessarily exactly so
Procedure Part II Combinations of Resistors
rsaquo Connect all three resistors R1 R2 R3 in series and use the DC volt scale on the voltmeter
Record 5 runs as before (Note your maximum current may be less than 50 ma because the
voltage must not exceed 10mvolts)
rsaquo Connect all these resistors in parallel Again use the DC voltmeter scale with the maximum
current close to 50 mA Record 5 runs as before
rsaquo Estimate (from your data in Part I) the values of R1 R2 R3 Take the two higher
resistances (record which ones you are using) and connect them in parallel Connect this
combination in series with the remaining resistor Record 5 runs as usual
R1 R2 R3
in Series
R1 R2 R3
in Parallel
R1 R2 R3
2 Parallel in Series
with 3rd
I (mA) V (volts) I (mA) V (volts) I (mA) V (volts)
Graphical Results
rsaquo Using graph paper plot V vs I for each of your resistors R1 R2 R3 Draw the line of best fit
in each case and (from the slope) determine the resistance in ohms 3 significant digits Display
all calculations on the graph sheet
EE Department Linear Circuit Analysis
CEME (NUST) Rawalpindi 23
R1= R2= R3=
rsaquo Using graph paper plot V vs I for each of the three combinations Determine Req for each
case as in (1) above
rsaquo From your results in (1) calculate the predicted (= theoretical) values of Req for each of the
three combinations Display the calculations clearly
rsaquo Summarize your results in the table shown For discrepancies use the predicted values as
more reliable (that is refer to them as if they were exact)
COMBINATION PREDICTED R MEASURED R
DISCR
ALL IN SERIES
ALL IN PARALLEL
SERIES amp
PARALLEL
EE Department Linear Circuit Analysis
CEME (NUST) Rawalpindi 24
EE Department Linear Circuit Analysis
CEME (NUST) Rawalpindi 25
EXPERIMENT NO ndash 03 DIVIDER RULES
(VERIFICATION OF CURRENT DIVIDER RULE amp VOLTAGE DIVIDER RULE)
OBJECTIVE
- Verify the divider rules for voltage (VDR) and current (CDR)
THEORY The Voltage Divider Rule (VDR) states that the voltage across an element or across a series
combination of elements in a series circuit is equal to the resistance of the element or series
combination of elements divided by the total resistance of the series circuit and multiplied by the
total impressed voltage
The Current Divider Rule (CDR) states that the current through one of two parallel branches is
equal to the resistance of the other branch divided by the sum of the resistances of the two
parallel branches and multiplied by the total current entering the two parallel branches That is
APPARATUS
1 Power Supply 2 Resistances 3 Digital Multi-Meter (DMM)
4 Connecting Wires 5 Bread Board
PROCEDURE
Part 1 Voltage Divider Rule (VDR)
Construct the circuit
rsaquo Without making any calculations what value would you expect for the voltage across each
resistor Explain your reasoning
EE Department Linear Circuit Analysis
CEME (NUST) Rawalpindi 26
rsaquo Calculate V1 using the VDR with the measured resistor values Measure V1 and determine the
percent difference between the theoretical and experimental results How do they compare
rsaquo If R2 = R3 then the VDR states the V2 = V3 and V1 = V2 + V3 Measure voltages V2 and V3
and comment on the validity of these statements
rsaquo Using VDR calculate the voltage Vab Measure Vab and determine the percent difference
between the theoretical and experimental results How do they compare
EE Department Linear Circuit Analysis
CEME (NUST) Rawalpindi 27
rsaquo Remove resistor R2 to construct the following open circuit
rsaquo Using the measured resistor values calculate the voltages V1 V2 and Vopen using VDR
Measure voltages V1 V2 and Vopen with the DMM and calculate the percent differences
Explain the reasoning
Part 2 Current Divider Rule (CDR)
Construct the circuit
EE Department Linear Circuit Analysis
CEME (NUST) Rawalpindi 28
rsaquo Without making any calculations what value would you expect for the current through each of
the resistors Explain your reasoning
rsaquo Calculate the currents I1 I2 and I3 using the CDR from the measured value of Is Measure the
currents I1 I2 and I3
rsaquo Based on these measurements are your conclusions of earlier part verified Use a percent
difference to compare the theoretical and experimental results
rsaquo Set the maximum current coming from the power supply at 200 mA via a short Place a short
circuit across the 10kΩ-resistor to construct the following circuit
EE Department Linear Circuit Analysis
CEME (NUST) Rawalpindi 29
Part 3 Challenge Circuit
Construct the circuit below
rsaquo Calculate the voltages V1 V2 V3 and V4 using the VDR with measured resistor values
Measure the voltages V1 V2 V3 and V4 and use a percent difference to compare the calculated
and measured results How do they compare
rsaquo Using the results of earlier part calculate the voltage Vab using KVL
rsaquo Measure the voltage Vab and use a percent difference to compare the calculated and measured
results How do they compare Is the voltage Vab equal to V1 ndash V3 Equal to V2 ndash V4 Explain
your reasoning
rsaquo Suppose now that a short is placed across the terminal points ab Calculate the current Iab
through the short Measure the current Iab and use a percent difference to compare the theoretical
and experimental results How do they compare
Note Use separate sheet for the findings of above part
EE Department Linear Circuit Analysis
CEME (NUST) Rawalpindi 30
EXPERIMENT NO ndash 04 NODAL ANALYSIS
(EXPERIMENTAL VERIFICATION OF NODAL ANALYSIS)
OBJECTIVE
- To analyze a circuit and to determine the unknown parameters of the circuit
THEORY
Under this method the following procedure is adopted
Assume the voltage of different independent nodes
rsaquo Write the equations for each node as per Kirchhoffrsquos Current Law
rsaquo Solve the above equations to get the node voltages
rsaquo Calculate the branch current from the values of node voltages
Let us consider the circuit shown in the figure below L and M are two
independent nodes M can be taken as a reference node Let the voltage of node L (with respect
to M) be VL
Using Kirchofflsquos Law we get
I1+I2=I3
Ohmrsquos law gives
I1= V1 R1= (E1-VL) R1
I2=V2R2 = (E2-VL) R2
I3 =VL R3
(E1-VL)R1 + (E2-VL)R2= VLR3
Rearranging the terms we get
VL (1R1+1R2+1R3)-E1R1-E2R2=0
EE Department Linear Circuit Analysis
CEME (NUST) Rawalpindi 31
It may be noted that the above nodal equation contains the following terms
rsaquo The node voltage multiplied by the sum of all the conductances connected to that node This
term is positive
rsaquo The node voltage at the other end of each branch (connected to this node) multiplied by the
conductance of the branch These terms are negative
rsaquo In this method of solving a network the no of equations required for the solution is one less
than the no of independent nodes in the network
In general the nodal analysis yields similar solutions
APPARATUS
1 Two DC power supplies
2 Five resistances of different values
3 Connecting wires
4 Digital multi meter (DMM)
PROCEDURE
rsaquo Construct the circuit shown in Figure below
Figure
rsaquo Pick the resistances Also verify their resistance by meter and record it in table
rsaquo Solve given circuit for the unknowns before moving to the circuit for measured values
rsaquo Set the DC supply E1=10V and E2=5V
rsaquo Measure the currents through resistances R1 R2 R3 R4 amp R5 and record it in table
rsaquo Also measure voltages across each resistor
rsaquo Now set the DC supply E1=5V and E2=7V
rsaquo Repeat all steps and record the values
Note Use measured values of resistances for all calculations Make these calculations on the space provided
EE Department Linear Circuit Analysis
CEME (NUST) Rawalpindi 32
OBSERVATIONS amp CALCULATIONS
EE Department Linear Circuit Analysis
CEME (NUST) Rawalpindi 33
Resistors R1 R2 R3 R4 R5
Rated
Values
Measured
Values
For E1=10V and E2=5V
Voltages VR1 VR2 VR3 VR4 VR5
Calculated
Values
Measured
Values
Percentage
Difference
Currents IR1 IR2 IR3 IR4 IR5
Calculated
Values
Measured
Values
Percentage
Difference
E1=5V and E2=7V
Voltages VR1 VR2 VR3 VR4 VR5
Calculated
Values
Measured
Values
Percentage
Difference
Currents IR1 IR2 IR3 IR4 IR5
Calculated
Values
Measured
Values
Percentage
Difference
Challenge Swap the resistors R1 with R4 R5 with R2 and repeat all above steps to determine
unknown voltages and currents both theoretically and practically
Note Use separate sheets for analysis of above problem
EE Department Linear Circuit Analysis
CEME (NUST) Rawalpindi 34
ANSWER THE FOLLOWING QUESTIONS
(a) What is a node
(b) Calculate the equivalent resistance
(c) Solve the following circuit for power dissipation (P=VI) across R1 R2 and R3
(d) What do you meant by a super node
Note Use separate sheets for answering above questions
EE Department Linear Circuit Analysis
CEME (NUST) Rawalpindi 35
EXPERIMENT NO ndash 05 MESH ANALYSIS
(EXPERIMENTAL VERIFICATION OF MESH ANALYSIS)
OBJECTIVE
- To analyze a two Mesh circuit and to determine the current in each branch of the circuit
THEORY
The mesh analysis is a systematic way of applying KVL around each mesh of a circuit and
describes the branch voltages in terms of the mesh currents This will give us a set of equations
that we solve together to find the mesh currents Once we find the mesh currents we can use
them to calculate any other currents or voltages of interest
We know from KVL the algebraic sum of voltages around a close loop is zero so considering the
circuit shown below and applying KVL in each loop (mesh)
While writing equations for
Applying KVL to mesh 1
- E1 + I1R1 + (I1 - I2) R2 = 0
I1 (R1 + R2) - I2R2 = E1 (1)
Applying KVL to mesh 2
- E2 + (I2 - I1) R2 + I2R3 = 0
I2 (R2 + R3) - I1R2 = E2 (2)
Solving above two equations values of unknowns can easily be calculated
=
EE Department Linear Circuit Analysis
CEME (NUST) Rawalpindi 36
APPARATUS
1 Two DC power supplies
2 Three resistances of different values
3 Connecting wires
4 Digital multi meter (DMM)
PROCEDURE
rsaquo Construct the circuit shown in Figure below
rsaquo Pick the resistances Also verify their resistance by meter and record it in table
rsaquo Solve given circuit for the unknowns before moving to the circuit for measured values
rsaquo Set the DC supply E1=12V and E2=5V
rsaquo Measure the currents through resistances R1 R2 amp R3 and record it in table
rsaquo Also measure voltages across each resistor
rsaquo Now set the DC supply E1=5V and E2=12V
rsaquo Repeat all steps and record the values
Note Use measured values of resistances for all calculations Make these calculations on the space provided
OBSERVATIONS amp CALCULATIONS
EE Department Linear Circuit Analysis
CEME (NUST) Rawalpindi 37
Resistors R1 R2 R3
Rated Values
Measured Values
For E1=12V and E2=5V
Voltages VR1 VR2 VR3
Calculated Values
Measured Values
Percentage
Difference
Currents IR1 IR2 IR3
Calculated Values
Measured Values
EE Department Linear Circuit Analysis
CEME (NUST) Rawalpindi 38
Percentage
Difference
E1=5V and E2=12V
Voltages VR1 VR2 VR3
Calculated Values
Measured Values
Percentage
Difference
Currents IR1 IR2 IR3
Calculated Values
Measured Values
Percentage
Difference
Challenge Swap the resistors R1 with R3 and repeat all above steps to determine unknown
voltages and currents both theoretically and practically
Note Use separate sheets for analysis of above problem
EE Department Linear Circuit Analysis
CEME (NUST) Rawalpindi 39
ANSWER THE FOLLOWING QUESTIONS
(a) What is the difference between a loop and a mesh
(b) What is an ideal voltage source How is it different from real voltage source
(c) What is an ideal current source How is it different from real current source
(d) Solve the following circuit for power dissipation across R1 R2 and R3
(e) What do you meant by a super mesh
Note Use separate sheets for answering above questions
EE Department Linear Circuit Analysis
CEME (NUST) Rawalpindi 40
EXPERIMENT NO ndash 06 THEVENINS THEOREM
(EXPERIMENTAL VERIFICATION OF THEVENINS THEOREM)
OBJECTIVE
- To Verify Thevenin Theorem by finding its Theveninrsquos Equivalent Circuit
THEORY
Any linear circuit is equivalent to a single voltage source (Thevenins Voltage) in series with
single equivalent resistance (Theveninrsquos Equivalent Resistances)
Applying Theveninrsquos Theorem
rsaquo Step 1 Remove the load and find voltage across the open-circuit terminals Vth All the circuit
analysis techniques presented can be used to compute this voltage
rsaquo Step 2 Determine the Thevenin equivalent resistance of the network at the open terminals with
the load removed Three different types of circuits may be encountered in determining the
resistance Rth
- If the circuit contains only independent sources they are made zero by replacing the voltage
sources with short circuits and the current sources with open circuits Rth is then found by
computing the resistance of purely resistive network at the open terminals
- If the circuit contains only dependent sources an independent voltage or current source is
applied at the open terminals and the corresponding current or voltage at these terminals is
measured The VoltageCurrent ratio at the terminals is the Thevenin equivalent resistance Since
there is no energy source the open circuit voltage is zero in this case
- If the circuit contains both the independent and dependent sources the open circuit terminals
are shorted and the short-circuit current between these terminals is determined The ratio of the
open circuit voltage to short circuit current is the resistance Rth
rsaquo Step 3 If the load is now connected to the Thevenin equivalent circuit consisting of Vth in
series with Rth the desired solution can be obtained
APPARATUS
1 DMM
2 Power Supply
3 Resistances (120Ω 1k Ω 390Ω)
PROCEDURE
rsaquo Calculate measured values of resistances
rsaquo Reduce the circuit by calculating the Thevenin equivalent resistance across the terminals A amp
B
rsaquo Calculate the Thevenin equivalent voltage across terminals ldquoArdquo and ldquoBrdquo for 5V 10V 15V
rsaquo Pertaining to circuit in figure III calculate values of IL for different values of RL
rsaquo Now construct circuit in figure I measure the value of Vth by removing RL
EE Department Linear Circuit Analysis
CEME (NUST) Rawalpindi 41
rsaquo Construct circuit in figure II to have measured value of Rth
rsaquo Construct circuit in figure III to determine measured values of IL for different values of RL
Figure-I
Figure-II
Figure-III
OBSERVATIONS amp CALCULATIONS
R1 R2 R3
Vs Vth Rth RL IL
5V 1kΩ
22kΩ
10V 1kΩ
22kΩ
15V 1kΩ
22kΩ
Table Calculated Values
EE Department Linear Circuit Analysis
CEME (NUST) Rawalpindi 42
Vs Vth Rth RL IL
5V 1kΩ
22kΩ
10V 1kΩ
22kΩ
15V 1kΩ
22kΩ
Table Measured Values
Challenge Replacing 1kΩ resistances by 22kΩ and keeping all other things same redo the
above analysis
Note Use separate sheets for analysis of above problem
EE Department Linear Circuit Analysis
CEME (NUST) Rawalpindi 43
ANSWER THE FOLLOWING QUESTIONS
(a) Use Theveninrsquos Theorem to find the current through the 5Ω resistance in the circuit diagram
shown below
(b)What is the importance of Theveninrsquos Theorem in circuit analysis
(c) Discuss the limitations of Theveninrsquos Theorem
(d) A light bulb draws 05A current at the input voltage of 230V Determine the resistance of the
filament and also the power dissipated
Note Use separate sheets for answering above questions
EE Department Linear Circuit Analysis
CEME (NUST) Rawalpindi 44
EXPERIMENT NO ndash 07 MAXIMUM POWER TRANSFER THEOREM
(EXPERIMENTAL VERIFICATION OF MAXIMUM POWER TRANSFER THEOREM FOR A NETWORK)
OBJECTIVE
- To prove maximum power transfer theorem practically
THEORY
The power transferred from a source supply source to load is at its maximum when the resistance
of the load is equal to the internal resistance of the source In other words ldquoA resistive will be
consuming maximum power from the supply when the load resistance is equal to the equivalent
(Thevenin) resistancerdquo
A graph of RL against P is shown in figure below the maximum value of power occurs at RL=
Rth
EE Department Linear Circuit Analysis
CEME (NUST) Rawalpindi 45
APPARATUS
1 DMM
2 Power Supply
3 Resistances fixed (22kΩ 1kΩ) variable (5kΩ)
PROCEDURE
rsaquo Connect the circuit shown in the figure below
rsaquo From the circuit it can be noted that Rth is fixed resistance of value 22kΩ but RL is variable
of value 5kΩ
rsaquo Set the value of Vth = 10 V
rsaquo Change the value of RL in steps as shown in table
rsaquo Measure the voltage VL and current IL and record it in table
rsaquo Plot the graph of power vs load resistance (RL)
rsaquo Using graph estimate P max (practical)
rsaquo Use P max = Vthsup2 4Rth to have the value of P max (theoratical)
rsaquo Repeat above steps by using Rth = 1kΩ
OBSERVATIONS amp CALCULATIONS
PART (I)
For Vth = 10 V Rth = 22kΩ
RL IL VL Power = IL x VL
03kΩ
06kΩ
09kΩ
15kΩ
22kΩ
25kΩ
30kΩ
EE Department Linear Circuit Analysis
CEME (NUST) Rawalpindi 46
33kΩ
36kΩ
40kΩ
P max (theoratical)
P max (practical)
Difference
PART (II)
For Vth = 10V Rth = 1kΩ
RL IL VL Power = IL x VL
03kΩ
06kΩ
09kΩ
15kΩ
22kΩ
25kΩ
30kΩ
33kΩ
36kΩ
40kΩ
EE Department Linear Circuit Analysis
CEME (NUST) Rawalpindi 47
P max (theoratical)
P max (practical)
Difference
Challenge For Rth = 1kΩ +22kΩ estimate maximum power transferred to the circuit
practically Also compare it with theoretical value
Note Use separate sheets for analysis of above problem
EE Department Linear Circuit Analysis
CEME (NUST) Rawalpindi 48
ANSWER THE FOLLOWING QUESTIONS
(a) What is meant by load matching
(b) Find the value of RL for maximum power transfer in the network shown below Also
calculate the maximum power that can be transferred to this load
Note Use separate sheets for answering above questions
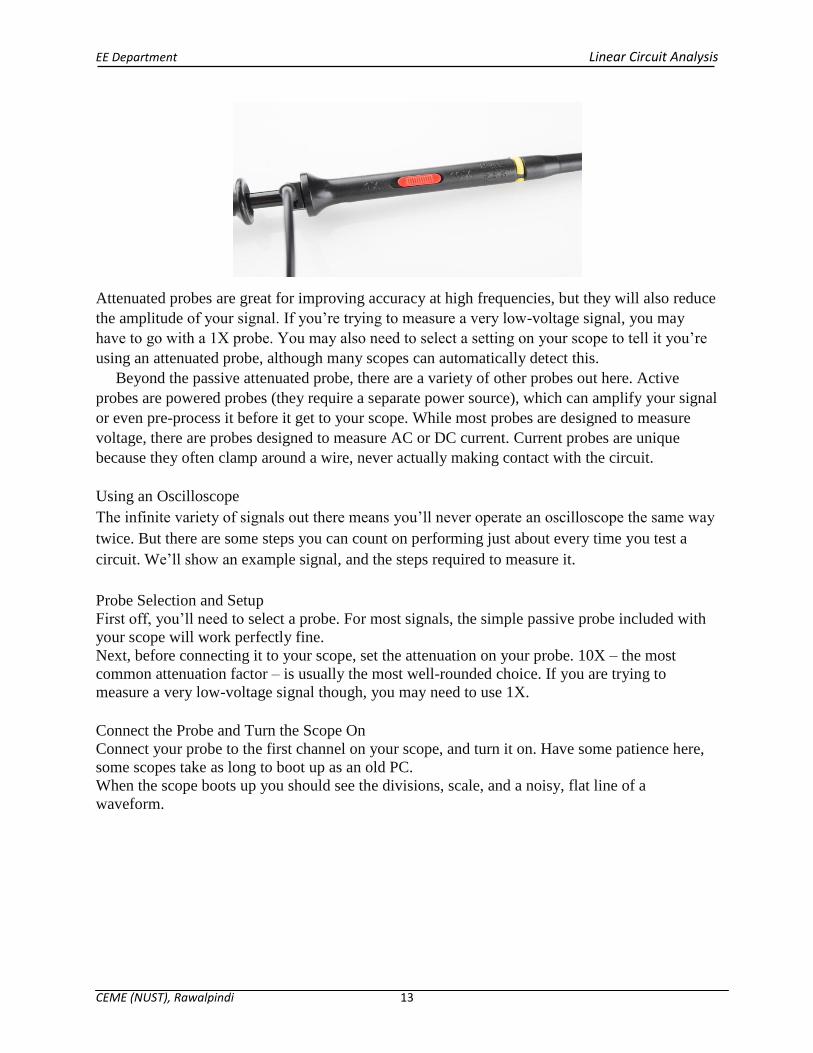
EE Department Linear Circuit Analysis
CEME (NUST) Rawalpindi 16
Adjust the trimming cap on the probe handle until you have a straight-edged square wave
Compensation is only necessary if your probe is attenuated (eg 10X) in which case itrsquos critical
Probing Triggering and Scaling Tips
Once yoursquove compensated your probe itrsquos time to measure a real signal Go find a signal source
eg frequency generator and start
The first key to probing a signal is finding a solid reliable grounding point Clasp your ground
clip to a known ground sometimes you may have to use a small wire to intermediate between the
ground clip and your circuitrsquos ground point Then connect your probe tip to the signal under test
Probe tips exist in a variety of form factors ndash the spring-loaded clip fine point hooks etc ndash try
to find one that doesnrsquot require you to hold it in place all the time
Once your signal is on the screen you may want to begin by adjusting the horizontal and vertical
scales into at least the ldquoballparkrdquo of your signal If yoursquore probing a 5V 1kHz square wave
yoursquoll probably want the voltsdiv somewhere around 05-1V and set the secondsdiv to around
100micros (14 divisions would show about one and a half periods)
If part of your wave is rising or falling of the screen you can adjust the vertical
position to move it up or down If your signal is purely DC you may want to adjust the 0V level
near the bottom of your display
Once you have the scales ball parked your waveform may need some
triggering Edge triggering ndash where the scope tries to begin its scan when it sees voltage rise (or
fall) past a set point ndash is the easiest type to use Using an edge trigger try to set the trigger level
to a point on your waveform that only sees a rising edge once per period
Now just scale position trigger and repeat until yoursquore looking at exactly what you need
Measure Twice Cut Once
With a signal scoped triggered and scaled it comes time to measure transients periods and
other waveform properties Some scopes have more measurement tools than others but theyrsquoll
all at least have divisions from which you should be able to at least estimate the amplitude and
frequency
Many scopes support a variety of automatic measurement tools they may even constantly
display the most relevant information like frequency To get the most out of your scope yoursquoll
want to explore all of the measure functions it supports Most scopes will calculate frequency
EE Department Linear Circuit Analysis
CEME (NUST) Rawalpindi 17
amplitude duty cycle mean voltage and a variety of other wave characteristics for you
automatically
Using the scopersquos measure tools to find VPP VMax frequency period and duty cycle
A third measuring tool many scopes provide is cursors Cursors are on-screen
movable markers which can be placed on either the time or voltage axis Cursors usually come in
pairs so you can measure the difference between one and the other
Measuring the ringing of a square wave with cursors
Once yoursquove measured the quantity you were looking for you can begin to make adjustments to
your circuit and measure some more Some scopes also
support saving printing or storing a waveform so you can recall it and remember those good
old times when you scoped that signal
To find out more about what your scope can do consult its userrsquos manual
Voltmeter Usage
A multi-meter is an electrical instrument capable of measuring voltage current and resistance
Digital multi-meters have numerical displays like digital clocks for indicating the quantity of
voltage current or resistance Analog multi-meters indicate these quantities by means of a
moving pointer over a printed scale
Some digital multi-meters are auto-ranging An auto-ranging meter has only a few
EE Department Linear Circuit Analysis
CEME (NUST) Rawalpindi 18
selector switch (dial) positions Manual-ranging meters have several different selector positions
for each basic quantity several for voltage several for current and several for resistance
In order to measure voltage of a battery set your multi-meterrsquos selector switch to the
highest-value lsquoDC voltrsquo position available Auto-ranging multi-meters may only have a single
position for DC voltage in which case you need to set the switch to that one position Touch the
red test probe to the positive (+) side of a battery and the black test probe to the negative (-) side
of the same battery The meter should now provide you with some sort of indication Reverse the
test probe connections to the battery if the meterrsquos indication is negative (on an analog meter a
negative value is indicated by the pointer deflecting left instead of right)
If your meter is a manual-range type and the selector switch has been set to a high-
range position the indication will be small Move the selector switch to the next lower DC
voltage range setting and reconnect to the battery The indication should be stronger now as
indicated by a greater deflection of the analog meter pointer (needle) or more active digits on the
digital meter display For the best results move the selector switch to the lowest-range setting
that does not lsquoover-rangersquo the meter An over-ranged analog meter is said to be lsquopeggedrsquo as the
needle will be forced all the way to the right-hand side of the scale past the full-range scale
value An over-ranged digital meter sometimes displays the letters lsquoOLrsquo or a series of dashed
lines This indication is manufacturer-specific
Ohmmeter Usage
Be sure to never measure the resistance of any electrically lsquoliversquo object or circuit In other words
do not attempt to measure the resistance of a battery or any other source of substantial voltage
using a multi-meter set to the resistance (ohms) function failing to heed this warning will likely
result in meter damage and even personal injury
Connect the meterrsquos test probes across the resistor as such and note its indication on the
resistance scale
EE Department Linear Circuit Analysis
CEME (NUST) Rawalpindi 19
If the needle points very close to zero you need to select a lower resistance range on the Meter
If you are using a digital multi-meter you should see a numerical figure close to 10 shown on the
display with a small rdquokrdquo symbol on the right-hand side denoting the metric prefix for rdquokilordquo
(thousand) Some digital meters are manually-ranged and require appropriate range selection
just as the analog meter If yours is like this experiment with different range switch positions
and see which one gives you the best indication
Ammeter Usage
Current is the measure of the rate of electron lsquoflowrsquo in a circuit It is measured in the unit of the
Ampere simply called lsquoAmprsquo (A)
The most common way to measure current in a circuit is to break the circuit open and insert an
lsquoammeterrsquo in series (in-line) with the circuit so that all electrons flowing through the circuit also
have to go through the meter Because measuring current in this manner requires the meter be
made part of the circuit it is a more difficult type of measurement to make than either voltage or
resistance
Some digital meters like the unit shown in the illustration have a separate jack to insert the red
test lead plug when measuring current Other meters like most inexpensive analog meters use
the same jacks for measuring voltage resistance and current
EE Department Linear Circuit Analysis
CEME (NUST) Rawalpindi 20
EXPERIMENT NO ndash 02 OHMrsquoS LAW
(EXPERIMENTAL VERIFICATION OF OHMrsquoS LAW)
OBJECTIVE
- To verify ohmrsquos law experimentally
APPARATUS
1 DC power supply
2 Three resistances of different values
3 Connecting wires
4 Digital multi meter (DMM) Voltmeter Ammeter
THEORY
Ohmrsquos Law
When current I flows through a resistor then the potential difference V (often simply called
voltage) between its terminals is proportional to I as in equation (1) where R is the resistance
Basic Equation V = R I (1)
Combinations of Resistors
When two or more resistors ( R1 R2 R3hellip) are connected in series (Fig 1) then this
combination is equivalent to a single resisto of resistance Req given by (2)
Basic Formula Req = R1 + R2 + R3+ (2)
When two or more resistors are connected in parallel (Fig 2) then the equivalent resistance Req
is given by (3)
Basic Formula Req = 1 + 1 + 1 + 1
R1 R2 R3
(2)
EE Department Linear Circuit Analysis
CEME (NUST) Rawalpindi 21
PROCEDURE amp OBSERVATIONS
Part I Ohmrsquos Law
rsaquo Make sure that the DC power supply is off and unplugged Make sure that the regulating
knobs are in minimum positions Your instructor will explain to you the operation of DC power
supply the ammeter and the voltmeter
rsaquo Construct the circuit as in Fig 3a using the resistor marked R1 in your sample Use the dc
ammeter scale and make sure that + and ndash markings are exactly as in Fig 3a
rsaquo Set the voltmeter scale to dc volts scale Attach connectors to your voltmeter (or DMM as
voltmeter suggestion use a red connector for the + terminal and a black one for -) Connect the
+ terminal to point B (where the current enters the resistor) and the other one to point A
rsaquo Make sure all connections are tight If you have a faulty connector immediately hand it to your
instructor Note Call your instructor to check your circuit Do not proceed without his or her permission rsaquo After your instructorrsquos approval prepare on your data sheet your first table as shown Plug in
the power supply With the regulating knob(s) in Min position turn the power ldquoONrdquo
Turn slowly the regulating knob(s) and watch both the ammeter and the voltmeter readings to
increase (if not turn off the power at once and call your instructor)Keep doing this until the
ammeter reaches 50mA or the voltmeter reaches 5 volts whichever comes first Record the
current I and the voltage V to three significant digits by estimating fractions of smallest
divisions on the scales
Resistor R1 Resistor R2 Resistor R3
I (mA) V (volts) I (mA) V (volts) I (mA) V (volts)
EE Department Linear Circuit Analysis
CEME (NUST) Rawalpindi 22
rsaquo Decreasing the current record I and V four more times (a total of 5 readings) in roughly equal
intervals The lowest current should be 5 to 10 mA
rsaquo Repeat the last two steps for your resistors R2 and R3 with maximum current close to 50 mA
but using the finest voltmeter scale possible for each given resistor
rsaquo Turn the power ldquoOFFrdquo and record
- The uncertainties in your readings on all scales of ammeter and voltmeter which you have
used
- The zero readings of your ammeter these are their readings when they are completely
disconnected from any circuits They should be close to zero but not necessarily exactly so
Procedure Part II Combinations of Resistors
rsaquo Connect all three resistors R1 R2 R3 in series and use the DC volt scale on the voltmeter
Record 5 runs as before (Note your maximum current may be less than 50 ma because the
voltage must not exceed 10mvolts)
rsaquo Connect all these resistors in parallel Again use the DC voltmeter scale with the maximum
current close to 50 mA Record 5 runs as before
rsaquo Estimate (from your data in Part I) the values of R1 R2 R3 Take the two higher
resistances (record which ones you are using) and connect them in parallel Connect this
combination in series with the remaining resistor Record 5 runs as usual
R1 R2 R3
in Series
R1 R2 R3
in Parallel
R1 R2 R3
2 Parallel in Series
with 3rd
I (mA) V (volts) I (mA) V (volts) I (mA) V (volts)
Graphical Results
rsaquo Using graph paper plot V vs I for each of your resistors R1 R2 R3 Draw the line of best fit
in each case and (from the slope) determine the resistance in ohms 3 significant digits Display
all calculations on the graph sheet
EE Department Linear Circuit Analysis
CEME (NUST) Rawalpindi 23
R1= R2= R3=
rsaquo Using graph paper plot V vs I for each of the three combinations Determine Req for each
case as in (1) above
rsaquo From your results in (1) calculate the predicted (= theoretical) values of Req for each of the
three combinations Display the calculations clearly
rsaquo Summarize your results in the table shown For discrepancies use the predicted values as
more reliable (that is refer to them as if they were exact)
COMBINATION PREDICTED R MEASURED R
DISCR
ALL IN SERIES
ALL IN PARALLEL
SERIES amp
PARALLEL
EE Department Linear Circuit Analysis
CEME (NUST) Rawalpindi 24
EE Department Linear Circuit Analysis
CEME (NUST) Rawalpindi 25
EXPERIMENT NO ndash 03 DIVIDER RULES
(VERIFICATION OF CURRENT DIVIDER RULE amp VOLTAGE DIVIDER RULE)
OBJECTIVE
- Verify the divider rules for voltage (VDR) and current (CDR)
THEORY The Voltage Divider Rule (VDR) states that the voltage across an element or across a series
combination of elements in a series circuit is equal to the resistance of the element or series
combination of elements divided by the total resistance of the series circuit and multiplied by the
total impressed voltage
The Current Divider Rule (CDR) states that the current through one of two parallel branches is
equal to the resistance of the other branch divided by the sum of the resistances of the two
parallel branches and multiplied by the total current entering the two parallel branches That is
APPARATUS
1 Power Supply 2 Resistances 3 Digital Multi-Meter (DMM)
4 Connecting Wires 5 Bread Board
PROCEDURE
Part 1 Voltage Divider Rule (VDR)
Construct the circuit
rsaquo Without making any calculations what value would you expect for the voltage across each
resistor Explain your reasoning
EE Department Linear Circuit Analysis
CEME (NUST) Rawalpindi 26
rsaquo Calculate V1 using the VDR with the measured resistor values Measure V1 and determine the
percent difference between the theoretical and experimental results How do they compare
rsaquo If R2 = R3 then the VDR states the V2 = V3 and V1 = V2 + V3 Measure voltages V2 and V3
and comment on the validity of these statements
rsaquo Using VDR calculate the voltage Vab Measure Vab and determine the percent difference
between the theoretical and experimental results How do they compare
EE Department Linear Circuit Analysis
CEME (NUST) Rawalpindi 27
rsaquo Remove resistor R2 to construct the following open circuit
rsaquo Using the measured resistor values calculate the voltages V1 V2 and Vopen using VDR
Measure voltages V1 V2 and Vopen with the DMM and calculate the percent differences
Explain the reasoning
Part 2 Current Divider Rule (CDR)
Construct the circuit
EE Department Linear Circuit Analysis
CEME (NUST) Rawalpindi 28
rsaquo Without making any calculations what value would you expect for the current through each of
the resistors Explain your reasoning
rsaquo Calculate the currents I1 I2 and I3 using the CDR from the measured value of Is Measure the
currents I1 I2 and I3
rsaquo Based on these measurements are your conclusions of earlier part verified Use a percent
difference to compare the theoretical and experimental results
rsaquo Set the maximum current coming from the power supply at 200 mA via a short Place a short
circuit across the 10kΩ-resistor to construct the following circuit
EE Department Linear Circuit Analysis
CEME (NUST) Rawalpindi 29
Part 3 Challenge Circuit
Construct the circuit below
rsaquo Calculate the voltages V1 V2 V3 and V4 using the VDR with measured resistor values
Measure the voltages V1 V2 V3 and V4 and use a percent difference to compare the calculated
and measured results How do they compare
rsaquo Using the results of earlier part calculate the voltage Vab using KVL
rsaquo Measure the voltage Vab and use a percent difference to compare the calculated and measured
results How do they compare Is the voltage Vab equal to V1 ndash V3 Equal to V2 ndash V4 Explain
your reasoning
rsaquo Suppose now that a short is placed across the terminal points ab Calculate the current Iab
through the short Measure the current Iab and use a percent difference to compare the theoretical
and experimental results How do they compare
Note Use separate sheet for the findings of above part
EE Department Linear Circuit Analysis
CEME (NUST) Rawalpindi 30
EXPERIMENT NO ndash 04 NODAL ANALYSIS
(EXPERIMENTAL VERIFICATION OF NODAL ANALYSIS)
OBJECTIVE
- To analyze a circuit and to determine the unknown parameters of the circuit
THEORY
Under this method the following procedure is adopted
Assume the voltage of different independent nodes
rsaquo Write the equations for each node as per Kirchhoffrsquos Current Law
rsaquo Solve the above equations to get the node voltages
rsaquo Calculate the branch current from the values of node voltages
Let us consider the circuit shown in the figure below L and M are two
independent nodes M can be taken as a reference node Let the voltage of node L (with respect
to M) be VL
Using Kirchofflsquos Law we get
I1+I2=I3
Ohmrsquos law gives
I1= V1 R1= (E1-VL) R1
I2=V2R2 = (E2-VL) R2
I3 =VL R3
(E1-VL)R1 + (E2-VL)R2= VLR3
Rearranging the terms we get
VL (1R1+1R2+1R3)-E1R1-E2R2=0
EE Department Linear Circuit Analysis
CEME (NUST) Rawalpindi 31
It may be noted that the above nodal equation contains the following terms
rsaquo The node voltage multiplied by the sum of all the conductances connected to that node This
term is positive
rsaquo The node voltage at the other end of each branch (connected to this node) multiplied by the
conductance of the branch These terms are negative
rsaquo In this method of solving a network the no of equations required for the solution is one less
than the no of independent nodes in the network
In general the nodal analysis yields similar solutions
APPARATUS
1 Two DC power supplies
2 Five resistances of different values
3 Connecting wires
4 Digital multi meter (DMM)
PROCEDURE
rsaquo Construct the circuit shown in Figure below
Figure
rsaquo Pick the resistances Also verify their resistance by meter and record it in table
rsaquo Solve given circuit for the unknowns before moving to the circuit for measured values
rsaquo Set the DC supply E1=10V and E2=5V
rsaquo Measure the currents through resistances R1 R2 R3 R4 amp R5 and record it in table
rsaquo Also measure voltages across each resistor
rsaquo Now set the DC supply E1=5V and E2=7V
rsaquo Repeat all steps and record the values
Note Use measured values of resistances for all calculations Make these calculations on the space provided
EE Department Linear Circuit Analysis
CEME (NUST) Rawalpindi 32
OBSERVATIONS amp CALCULATIONS
EE Department Linear Circuit Analysis
CEME (NUST) Rawalpindi 33
Resistors R1 R2 R3 R4 R5
Rated
Values
Measured
Values
For E1=10V and E2=5V
Voltages VR1 VR2 VR3 VR4 VR5
Calculated
Values
Measured
Values
Percentage
Difference
Currents IR1 IR2 IR3 IR4 IR5
Calculated
Values
Measured
Values
Percentage
Difference
E1=5V and E2=7V
Voltages VR1 VR2 VR3 VR4 VR5
Calculated
Values
Measured
Values
Percentage
Difference
Currents IR1 IR2 IR3 IR4 IR5
Calculated
Values
Measured
Values
Percentage
Difference
Challenge Swap the resistors R1 with R4 R5 with R2 and repeat all above steps to determine
unknown voltages and currents both theoretically and practically
Note Use separate sheets for analysis of above problem
EE Department Linear Circuit Analysis
CEME (NUST) Rawalpindi 34
ANSWER THE FOLLOWING QUESTIONS
(a) What is a node
(b) Calculate the equivalent resistance
(c) Solve the following circuit for power dissipation (P=VI) across R1 R2 and R3
(d) What do you meant by a super node
Note Use separate sheets for answering above questions
EE Department Linear Circuit Analysis
CEME (NUST) Rawalpindi 35
EXPERIMENT NO ndash 05 MESH ANALYSIS
(EXPERIMENTAL VERIFICATION OF MESH ANALYSIS)
OBJECTIVE
- To analyze a two Mesh circuit and to determine the current in each branch of the circuit
THEORY
The mesh analysis is a systematic way of applying KVL around each mesh of a circuit and
describes the branch voltages in terms of the mesh currents This will give us a set of equations
that we solve together to find the mesh currents Once we find the mesh currents we can use
them to calculate any other currents or voltages of interest
We know from KVL the algebraic sum of voltages around a close loop is zero so considering the
circuit shown below and applying KVL in each loop (mesh)
While writing equations for
Applying KVL to mesh 1
- E1 + I1R1 + (I1 - I2) R2 = 0
I1 (R1 + R2) - I2R2 = E1 (1)
Applying KVL to mesh 2
- E2 + (I2 - I1) R2 + I2R3 = 0
I2 (R2 + R3) - I1R2 = E2 (2)
Solving above two equations values of unknowns can easily be calculated
=
EE Department Linear Circuit Analysis
CEME (NUST) Rawalpindi 36
APPARATUS
1 Two DC power supplies
2 Three resistances of different values
3 Connecting wires
4 Digital multi meter (DMM)
PROCEDURE
rsaquo Construct the circuit shown in Figure below
rsaquo Pick the resistances Also verify their resistance by meter and record it in table
rsaquo Solve given circuit for the unknowns before moving to the circuit for measured values
rsaquo Set the DC supply E1=12V and E2=5V
rsaquo Measure the currents through resistances R1 R2 amp R3 and record it in table
rsaquo Also measure voltages across each resistor
rsaquo Now set the DC supply E1=5V and E2=12V
rsaquo Repeat all steps and record the values
Note Use measured values of resistances for all calculations Make these calculations on the space provided
OBSERVATIONS amp CALCULATIONS
EE Department Linear Circuit Analysis
CEME (NUST) Rawalpindi 37
Resistors R1 R2 R3
Rated Values
Measured Values
For E1=12V and E2=5V
Voltages VR1 VR2 VR3
Calculated Values
Measured Values
Percentage
Difference
Currents IR1 IR2 IR3
Calculated Values
Measured Values
EE Department Linear Circuit Analysis
CEME (NUST) Rawalpindi 38
Percentage
Difference
E1=5V and E2=12V
Voltages VR1 VR2 VR3
Calculated Values
Measured Values
Percentage
Difference
Currents IR1 IR2 IR3
Calculated Values
Measured Values
Percentage
Difference
Challenge Swap the resistors R1 with R3 and repeat all above steps to determine unknown
voltages and currents both theoretically and practically
Note Use separate sheets for analysis of above problem
EE Department Linear Circuit Analysis
CEME (NUST) Rawalpindi 39
ANSWER THE FOLLOWING QUESTIONS
(a) What is the difference between a loop and a mesh
(b) What is an ideal voltage source How is it different from real voltage source
(c) What is an ideal current source How is it different from real current source
(d) Solve the following circuit for power dissipation across R1 R2 and R3
(e) What do you meant by a super mesh
Note Use separate sheets for answering above questions
EE Department Linear Circuit Analysis
CEME (NUST) Rawalpindi 40
EXPERIMENT NO ndash 06 THEVENINS THEOREM
(EXPERIMENTAL VERIFICATION OF THEVENINS THEOREM)
OBJECTIVE
- To Verify Thevenin Theorem by finding its Theveninrsquos Equivalent Circuit
THEORY
Any linear circuit is equivalent to a single voltage source (Thevenins Voltage) in series with
single equivalent resistance (Theveninrsquos Equivalent Resistances)
Applying Theveninrsquos Theorem
rsaquo Step 1 Remove the load and find voltage across the open-circuit terminals Vth All the circuit
analysis techniques presented can be used to compute this voltage
rsaquo Step 2 Determine the Thevenin equivalent resistance of the network at the open terminals with
the load removed Three different types of circuits may be encountered in determining the
resistance Rth
- If the circuit contains only independent sources they are made zero by replacing the voltage
sources with short circuits and the current sources with open circuits Rth is then found by
computing the resistance of purely resistive network at the open terminals
- If the circuit contains only dependent sources an independent voltage or current source is
applied at the open terminals and the corresponding current or voltage at these terminals is
measured The VoltageCurrent ratio at the terminals is the Thevenin equivalent resistance Since
there is no energy source the open circuit voltage is zero in this case
- If the circuit contains both the independent and dependent sources the open circuit terminals
are shorted and the short-circuit current between these terminals is determined The ratio of the
open circuit voltage to short circuit current is the resistance Rth
rsaquo Step 3 If the load is now connected to the Thevenin equivalent circuit consisting of Vth in
series with Rth the desired solution can be obtained
APPARATUS
1 DMM
2 Power Supply
3 Resistances (120Ω 1k Ω 390Ω)
PROCEDURE
rsaquo Calculate measured values of resistances
rsaquo Reduce the circuit by calculating the Thevenin equivalent resistance across the terminals A amp
B
rsaquo Calculate the Thevenin equivalent voltage across terminals ldquoArdquo and ldquoBrdquo for 5V 10V 15V
rsaquo Pertaining to circuit in figure III calculate values of IL for different values of RL
rsaquo Now construct circuit in figure I measure the value of Vth by removing RL
EE Department Linear Circuit Analysis
CEME (NUST) Rawalpindi 41
rsaquo Construct circuit in figure II to have measured value of Rth
rsaquo Construct circuit in figure III to determine measured values of IL for different values of RL
Figure-I
Figure-II
Figure-III
OBSERVATIONS amp CALCULATIONS
R1 R2 R3
Vs Vth Rth RL IL
5V 1kΩ
22kΩ
10V 1kΩ
22kΩ
15V 1kΩ
22kΩ
Table Calculated Values
EE Department Linear Circuit Analysis
CEME (NUST) Rawalpindi 42
Vs Vth Rth RL IL
5V 1kΩ
22kΩ
10V 1kΩ
22kΩ
15V 1kΩ
22kΩ
Table Measured Values
Challenge Replacing 1kΩ resistances by 22kΩ and keeping all other things same redo the
above analysis
Note Use separate sheets for analysis of above problem
EE Department Linear Circuit Analysis
CEME (NUST) Rawalpindi 43
ANSWER THE FOLLOWING QUESTIONS
(a) Use Theveninrsquos Theorem to find the current through the 5Ω resistance in the circuit diagram
shown below
(b)What is the importance of Theveninrsquos Theorem in circuit analysis
(c) Discuss the limitations of Theveninrsquos Theorem
(d) A light bulb draws 05A current at the input voltage of 230V Determine the resistance of the
filament and also the power dissipated
Note Use separate sheets for answering above questions
EE Department Linear Circuit Analysis
CEME (NUST) Rawalpindi 44
EXPERIMENT NO ndash 07 MAXIMUM POWER TRANSFER THEOREM
(EXPERIMENTAL VERIFICATION OF MAXIMUM POWER TRANSFER THEOREM FOR A NETWORK)
OBJECTIVE
- To prove maximum power transfer theorem practically
THEORY
The power transferred from a source supply source to load is at its maximum when the resistance
of the load is equal to the internal resistance of the source In other words ldquoA resistive will be
consuming maximum power from the supply when the load resistance is equal to the equivalent
(Thevenin) resistancerdquo
A graph of RL against P is shown in figure below the maximum value of power occurs at RL=
Rth
EE Department Linear Circuit Analysis
CEME (NUST) Rawalpindi 45
APPARATUS
1 DMM
2 Power Supply
3 Resistances fixed (22kΩ 1kΩ) variable (5kΩ)
PROCEDURE
rsaquo Connect the circuit shown in the figure below
rsaquo From the circuit it can be noted that Rth is fixed resistance of value 22kΩ but RL is variable
of value 5kΩ
rsaquo Set the value of Vth = 10 V
rsaquo Change the value of RL in steps as shown in table
rsaquo Measure the voltage VL and current IL and record it in table
rsaquo Plot the graph of power vs load resistance (RL)
rsaquo Using graph estimate P max (practical)
rsaquo Use P max = Vthsup2 4Rth to have the value of P max (theoratical)
rsaquo Repeat above steps by using Rth = 1kΩ
OBSERVATIONS amp CALCULATIONS
PART (I)
For Vth = 10 V Rth = 22kΩ
RL IL VL Power = IL x VL
03kΩ
06kΩ
09kΩ
15kΩ
22kΩ
25kΩ
30kΩ
EE Department Linear Circuit Analysis
CEME (NUST) Rawalpindi 46
33kΩ
36kΩ
40kΩ
P max (theoratical)
P max (practical)
Difference
PART (II)
For Vth = 10V Rth = 1kΩ
RL IL VL Power = IL x VL
03kΩ
06kΩ
09kΩ
15kΩ
22kΩ
25kΩ
30kΩ
33kΩ
36kΩ
40kΩ
EE Department Linear Circuit Analysis
CEME (NUST) Rawalpindi 47
P max (theoratical)
P max (practical)
Difference
Challenge For Rth = 1kΩ +22kΩ estimate maximum power transferred to the circuit
practically Also compare it with theoretical value
Note Use separate sheets for analysis of above problem
EE Department Linear Circuit Analysis
CEME (NUST) Rawalpindi 48
ANSWER THE FOLLOWING QUESTIONS
(a) What is meant by load matching
(b) Find the value of RL for maximum power transfer in the network shown below Also
calculate the maximum power that can be transferred to this load
Note Use separate sheets for answering above questions
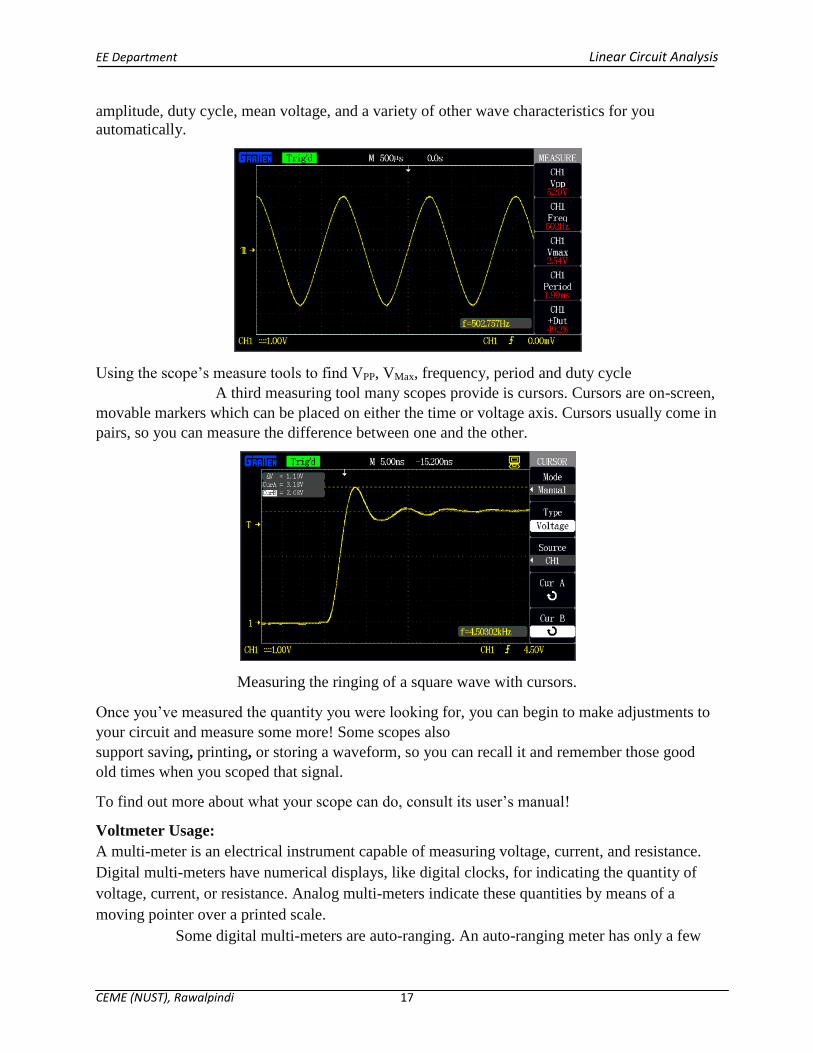
EE Department Linear Circuit Analysis
CEME (NUST) Rawalpindi 18
selector switch (dial) positions Manual-ranging meters have several different selector positions
for each basic quantity several for voltage several for current and several for resistance
In order to measure voltage of a battery set your multi-meterrsquos selector switch to the
highest-value lsquoDC voltrsquo position available Auto-ranging multi-meters may only have a single
position for DC voltage in which case you need to set the switch to that one position Touch the
red test probe to the positive (+) side of a battery and the black test probe to the negative (-) side
of the same battery The meter should now provide you with some sort of indication Reverse the
test probe connections to the battery if the meterrsquos indication is negative (on an analog meter a
negative value is indicated by the pointer deflecting left instead of right)
If your meter is a manual-range type and the selector switch has been set to a high-
range position the indication will be small Move the selector switch to the next lower DC
voltage range setting and reconnect to the battery The indication should be stronger now as
indicated by a greater deflection of the analog meter pointer (needle) or more active digits on the
digital meter display For the best results move the selector switch to the lowest-range setting
that does not lsquoover-rangersquo the meter An over-ranged analog meter is said to be lsquopeggedrsquo as the
needle will be forced all the way to the right-hand side of the scale past the full-range scale
value An over-ranged digital meter sometimes displays the letters lsquoOLrsquo or a series of dashed
lines This indication is manufacturer-specific
Ohmmeter Usage
Be sure to never measure the resistance of any electrically lsquoliversquo object or circuit In other words
do not attempt to measure the resistance of a battery or any other source of substantial voltage
using a multi-meter set to the resistance (ohms) function failing to heed this warning will likely
result in meter damage and even personal injury
Connect the meterrsquos test probes across the resistor as such and note its indication on the
resistance scale
EE Department Linear Circuit Analysis
CEME (NUST) Rawalpindi 19
If the needle points very close to zero you need to select a lower resistance range on the Meter
If you are using a digital multi-meter you should see a numerical figure close to 10 shown on the
display with a small rdquokrdquo symbol on the right-hand side denoting the metric prefix for rdquokilordquo
(thousand) Some digital meters are manually-ranged and require appropriate range selection
just as the analog meter If yours is like this experiment with different range switch positions
and see which one gives you the best indication
Ammeter Usage
Current is the measure of the rate of electron lsquoflowrsquo in a circuit It is measured in the unit of the
Ampere simply called lsquoAmprsquo (A)
The most common way to measure current in a circuit is to break the circuit open and insert an
lsquoammeterrsquo in series (in-line) with the circuit so that all electrons flowing through the circuit also
have to go through the meter Because measuring current in this manner requires the meter be
made part of the circuit it is a more difficult type of measurement to make than either voltage or
resistance
Some digital meters like the unit shown in the illustration have a separate jack to insert the red
test lead plug when measuring current Other meters like most inexpensive analog meters use
the same jacks for measuring voltage resistance and current
EE Department Linear Circuit Analysis
CEME (NUST) Rawalpindi 20
EXPERIMENT NO ndash 02 OHMrsquoS LAW
(EXPERIMENTAL VERIFICATION OF OHMrsquoS LAW)
OBJECTIVE
- To verify ohmrsquos law experimentally
APPARATUS
1 DC power supply
2 Three resistances of different values
3 Connecting wires
4 Digital multi meter (DMM) Voltmeter Ammeter
THEORY
Ohmrsquos Law
When current I flows through a resistor then the potential difference V (often simply called
voltage) between its terminals is proportional to I as in equation (1) where R is the resistance
Basic Equation V = R I (1)
Combinations of Resistors
When two or more resistors ( R1 R2 R3hellip) are connected in series (Fig 1) then this
combination is equivalent to a single resisto of resistance Req given by (2)
Basic Formula Req = R1 + R2 + R3+ (2)
When two or more resistors are connected in parallel (Fig 2) then the equivalent resistance Req
is given by (3)
Basic Formula Req = 1 + 1 + 1 + 1
R1 R2 R3
(2)
EE Department Linear Circuit Analysis
CEME (NUST) Rawalpindi 21
PROCEDURE amp OBSERVATIONS
Part I Ohmrsquos Law
rsaquo Make sure that the DC power supply is off and unplugged Make sure that the regulating
knobs are in minimum positions Your instructor will explain to you the operation of DC power
supply the ammeter and the voltmeter
rsaquo Construct the circuit as in Fig 3a using the resistor marked R1 in your sample Use the dc
ammeter scale and make sure that + and ndash markings are exactly as in Fig 3a
rsaquo Set the voltmeter scale to dc volts scale Attach connectors to your voltmeter (or DMM as
voltmeter suggestion use a red connector for the + terminal and a black one for -) Connect the
+ terminal to point B (where the current enters the resistor) and the other one to point A
rsaquo Make sure all connections are tight If you have a faulty connector immediately hand it to your
instructor Note Call your instructor to check your circuit Do not proceed without his or her permission rsaquo After your instructorrsquos approval prepare on your data sheet your first table as shown Plug in
the power supply With the regulating knob(s) in Min position turn the power ldquoONrdquo
Turn slowly the regulating knob(s) and watch both the ammeter and the voltmeter readings to
increase (if not turn off the power at once and call your instructor)Keep doing this until the
ammeter reaches 50mA or the voltmeter reaches 5 volts whichever comes first Record the
current I and the voltage V to three significant digits by estimating fractions of smallest
divisions on the scales
Resistor R1 Resistor R2 Resistor R3
I (mA) V (volts) I (mA) V (volts) I (mA) V (volts)
EE Department Linear Circuit Analysis
CEME (NUST) Rawalpindi 22
rsaquo Decreasing the current record I and V four more times (a total of 5 readings) in roughly equal
intervals The lowest current should be 5 to 10 mA
rsaquo Repeat the last two steps for your resistors R2 and R3 with maximum current close to 50 mA
but using the finest voltmeter scale possible for each given resistor
rsaquo Turn the power ldquoOFFrdquo and record
- The uncertainties in your readings on all scales of ammeter and voltmeter which you have
used
- The zero readings of your ammeter these are their readings when they are completely
disconnected from any circuits They should be close to zero but not necessarily exactly so
Procedure Part II Combinations of Resistors
rsaquo Connect all three resistors R1 R2 R3 in series and use the DC volt scale on the voltmeter
Record 5 runs as before (Note your maximum current may be less than 50 ma because the
voltage must not exceed 10mvolts)
rsaquo Connect all these resistors in parallel Again use the DC voltmeter scale with the maximum
current close to 50 mA Record 5 runs as before
rsaquo Estimate (from your data in Part I) the values of R1 R2 R3 Take the two higher
resistances (record which ones you are using) and connect them in parallel Connect this
combination in series with the remaining resistor Record 5 runs as usual
R1 R2 R3
in Series
R1 R2 R3
in Parallel
R1 R2 R3
2 Parallel in Series
with 3rd
I (mA) V (volts) I (mA) V (volts) I (mA) V (volts)
Graphical Results
rsaquo Using graph paper plot V vs I for each of your resistors R1 R2 R3 Draw the line of best fit
in each case and (from the slope) determine the resistance in ohms 3 significant digits Display
all calculations on the graph sheet
EE Department Linear Circuit Analysis
CEME (NUST) Rawalpindi 23
R1= R2= R3=
rsaquo Using graph paper plot V vs I for each of the three combinations Determine Req for each
case as in (1) above
rsaquo From your results in (1) calculate the predicted (= theoretical) values of Req for each of the
three combinations Display the calculations clearly
rsaquo Summarize your results in the table shown For discrepancies use the predicted values as
more reliable (that is refer to them as if they were exact)
COMBINATION PREDICTED R MEASURED R
DISCR
ALL IN SERIES
ALL IN PARALLEL
SERIES amp
PARALLEL
EE Department Linear Circuit Analysis
CEME (NUST) Rawalpindi 24
EE Department Linear Circuit Analysis
CEME (NUST) Rawalpindi 25
EXPERIMENT NO ndash 03 DIVIDER RULES
(VERIFICATION OF CURRENT DIVIDER RULE amp VOLTAGE DIVIDER RULE)
OBJECTIVE
- Verify the divider rules for voltage (VDR) and current (CDR)
THEORY The Voltage Divider Rule (VDR) states that the voltage across an element or across a series
combination of elements in a series circuit is equal to the resistance of the element or series
combination of elements divided by the total resistance of the series circuit and multiplied by the
total impressed voltage
The Current Divider Rule (CDR) states that the current through one of two parallel branches is
equal to the resistance of the other branch divided by the sum of the resistances of the two
parallel branches and multiplied by the total current entering the two parallel branches That is
APPARATUS
1 Power Supply 2 Resistances 3 Digital Multi-Meter (DMM)
4 Connecting Wires 5 Bread Board
PROCEDURE
Part 1 Voltage Divider Rule (VDR)
Construct the circuit
rsaquo Without making any calculations what value would you expect for the voltage across each
resistor Explain your reasoning
EE Department Linear Circuit Analysis
CEME (NUST) Rawalpindi 26
rsaquo Calculate V1 using the VDR with the measured resistor values Measure V1 and determine the
percent difference between the theoretical and experimental results How do they compare
rsaquo If R2 = R3 then the VDR states the V2 = V3 and V1 = V2 + V3 Measure voltages V2 and V3
and comment on the validity of these statements
rsaquo Using VDR calculate the voltage Vab Measure Vab and determine the percent difference
between the theoretical and experimental results How do they compare
EE Department Linear Circuit Analysis
CEME (NUST) Rawalpindi 27
rsaquo Remove resistor R2 to construct the following open circuit
rsaquo Using the measured resistor values calculate the voltages V1 V2 and Vopen using VDR
Measure voltages V1 V2 and Vopen with the DMM and calculate the percent differences
Explain the reasoning
Part 2 Current Divider Rule (CDR)
Construct the circuit
EE Department Linear Circuit Analysis
CEME (NUST) Rawalpindi 28
rsaquo Without making any calculations what value would you expect for the current through each of
the resistors Explain your reasoning
rsaquo Calculate the currents I1 I2 and I3 using the CDR from the measured value of Is Measure the
currents I1 I2 and I3
rsaquo Based on these measurements are your conclusions of earlier part verified Use a percent
difference to compare the theoretical and experimental results
rsaquo Set the maximum current coming from the power supply at 200 mA via a short Place a short
circuit across the 10kΩ-resistor to construct the following circuit
EE Department Linear Circuit Analysis
CEME (NUST) Rawalpindi 29
Part 3 Challenge Circuit
Construct the circuit below
rsaquo Calculate the voltages V1 V2 V3 and V4 using the VDR with measured resistor values
Measure the voltages V1 V2 V3 and V4 and use a percent difference to compare the calculated
and measured results How do they compare
rsaquo Using the results of earlier part calculate the voltage Vab using KVL
rsaquo Measure the voltage Vab and use a percent difference to compare the calculated and measured
results How do they compare Is the voltage Vab equal to V1 ndash V3 Equal to V2 ndash V4 Explain
your reasoning
rsaquo Suppose now that a short is placed across the terminal points ab Calculate the current Iab
through the short Measure the current Iab and use a percent difference to compare the theoretical
and experimental results How do they compare
Note Use separate sheet for the findings of above part
EE Department Linear Circuit Analysis
CEME (NUST) Rawalpindi 30
EXPERIMENT NO ndash 04 NODAL ANALYSIS
(EXPERIMENTAL VERIFICATION OF NODAL ANALYSIS)
OBJECTIVE
- To analyze a circuit and to determine the unknown parameters of the circuit
THEORY
Under this method the following procedure is adopted
Assume the voltage of different independent nodes
rsaquo Write the equations for each node as per Kirchhoffrsquos Current Law
rsaquo Solve the above equations to get the node voltages
rsaquo Calculate the branch current from the values of node voltages
Let us consider the circuit shown in the figure below L and M are two
independent nodes M can be taken as a reference node Let the voltage of node L (with respect
to M) be VL
Using Kirchofflsquos Law we get
I1+I2=I3
Ohmrsquos law gives
I1= V1 R1= (E1-VL) R1
I2=V2R2 = (E2-VL) R2
I3 =VL R3
(E1-VL)R1 + (E2-VL)R2= VLR3
Rearranging the terms we get
VL (1R1+1R2+1R3)-E1R1-E2R2=0
EE Department Linear Circuit Analysis
CEME (NUST) Rawalpindi 31
It may be noted that the above nodal equation contains the following terms
rsaquo The node voltage multiplied by the sum of all the conductances connected to that node This
term is positive
rsaquo The node voltage at the other end of each branch (connected to this node) multiplied by the
conductance of the branch These terms are negative
rsaquo In this method of solving a network the no of equations required for the solution is one less
than the no of independent nodes in the network
In general the nodal analysis yields similar solutions
APPARATUS
1 Two DC power supplies
2 Five resistances of different values
3 Connecting wires
4 Digital multi meter (DMM)
PROCEDURE
rsaquo Construct the circuit shown in Figure below
Figure
rsaquo Pick the resistances Also verify their resistance by meter and record it in table
rsaquo Solve given circuit for the unknowns before moving to the circuit for measured values
rsaquo Set the DC supply E1=10V and E2=5V
rsaquo Measure the currents through resistances R1 R2 R3 R4 amp R5 and record it in table
rsaquo Also measure voltages across each resistor
rsaquo Now set the DC supply E1=5V and E2=7V
rsaquo Repeat all steps and record the values
Note Use measured values of resistances for all calculations Make these calculations on the space provided
EE Department Linear Circuit Analysis
CEME (NUST) Rawalpindi 32
OBSERVATIONS amp CALCULATIONS
EE Department Linear Circuit Analysis
CEME (NUST) Rawalpindi 33
Resistors R1 R2 R3 R4 R5
Rated
Values
Measured
Values
For E1=10V and E2=5V
Voltages VR1 VR2 VR3 VR4 VR5
Calculated
Values
Measured
Values
Percentage
Difference
Currents IR1 IR2 IR3 IR4 IR5
Calculated
Values
Measured
Values
Percentage
Difference
E1=5V and E2=7V
Voltages VR1 VR2 VR3 VR4 VR5
Calculated
Values
Measured
Values
Percentage
Difference
Currents IR1 IR2 IR3 IR4 IR5
Calculated
Values
Measured
Values
Percentage
Difference
Challenge Swap the resistors R1 with R4 R5 with R2 and repeat all above steps to determine
unknown voltages and currents both theoretically and practically
Note Use separate sheets for analysis of above problem
EE Department Linear Circuit Analysis
CEME (NUST) Rawalpindi 34
ANSWER THE FOLLOWING QUESTIONS
(a) What is a node
(b) Calculate the equivalent resistance
(c) Solve the following circuit for power dissipation (P=VI) across R1 R2 and R3
(d) What do you meant by a super node
Note Use separate sheets for answering above questions
EE Department Linear Circuit Analysis
CEME (NUST) Rawalpindi 35
EXPERIMENT NO ndash 05 MESH ANALYSIS
(EXPERIMENTAL VERIFICATION OF MESH ANALYSIS)
OBJECTIVE
- To analyze a two Mesh circuit and to determine the current in each branch of the circuit
THEORY
The mesh analysis is a systematic way of applying KVL around each mesh of a circuit and
describes the branch voltages in terms of the mesh currents This will give us a set of equations
that we solve together to find the mesh currents Once we find the mesh currents we can use
them to calculate any other currents or voltages of interest
We know from KVL the algebraic sum of voltages around a close loop is zero so considering the
circuit shown below and applying KVL in each loop (mesh)
While writing equations for
Applying KVL to mesh 1
- E1 + I1R1 + (I1 - I2) R2 = 0
I1 (R1 + R2) - I2R2 = E1 (1)
Applying KVL to mesh 2
- E2 + (I2 - I1) R2 + I2R3 = 0
I2 (R2 + R3) - I1R2 = E2 (2)
Solving above two equations values of unknowns can easily be calculated
=
EE Department Linear Circuit Analysis
CEME (NUST) Rawalpindi 36
APPARATUS
1 Two DC power supplies
2 Three resistances of different values
3 Connecting wires
4 Digital multi meter (DMM)
PROCEDURE
rsaquo Construct the circuit shown in Figure below
rsaquo Pick the resistances Also verify their resistance by meter and record it in table
rsaquo Solve given circuit for the unknowns before moving to the circuit for measured values
rsaquo Set the DC supply E1=12V and E2=5V
rsaquo Measure the currents through resistances R1 R2 amp R3 and record it in table
rsaquo Also measure voltages across each resistor
rsaquo Now set the DC supply E1=5V and E2=12V
rsaquo Repeat all steps and record the values
Note Use measured values of resistances for all calculations Make these calculations on the space provided
OBSERVATIONS amp CALCULATIONS
EE Department Linear Circuit Analysis
CEME (NUST) Rawalpindi 37
Resistors R1 R2 R3
Rated Values
Measured Values
For E1=12V and E2=5V
Voltages VR1 VR2 VR3
Calculated Values
Measured Values
Percentage
Difference
Currents IR1 IR2 IR3
Calculated Values
Measured Values
EE Department Linear Circuit Analysis
CEME (NUST) Rawalpindi 38
Percentage
Difference
E1=5V and E2=12V
Voltages VR1 VR2 VR3
Calculated Values
Measured Values
Percentage
Difference
Currents IR1 IR2 IR3
Calculated Values
Measured Values
Percentage
Difference
Challenge Swap the resistors R1 with R3 and repeat all above steps to determine unknown
voltages and currents both theoretically and practically
Note Use separate sheets for analysis of above problem
EE Department Linear Circuit Analysis
CEME (NUST) Rawalpindi 39
ANSWER THE FOLLOWING QUESTIONS
(a) What is the difference between a loop and a mesh
(b) What is an ideal voltage source How is it different from real voltage source
(c) What is an ideal current source How is it different from real current source
(d) Solve the following circuit for power dissipation across R1 R2 and R3
(e) What do you meant by a super mesh
Note Use separate sheets for answering above questions
EE Department Linear Circuit Analysis
CEME (NUST) Rawalpindi 40
EXPERIMENT NO ndash 06 THEVENINS THEOREM
(EXPERIMENTAL VERIFICATION OF THEVENINS THEOREM)
OBJECTIVE
- To Verify Thevenin Theorem by finding its Theveninrsquos Equivalent Circuit
THEORY
Any linear circuit is equivalent to a single voltage source (Thevenins Voltage) in series with
single equivalent resistance (Theveninrsquos Equivalent Resistances)
Applying Theveninrsquos Theorem
rsaquo Step 1 Remove the load and find voltage across the open-circuit terminals Vth All the circuit
analysis techniques presented can be used to compute this voltage
rsaquo Step 2 Determine the Thevenin equivalent resistance of the network at the open terminals with
the load removed Three different types of circuits may be encountered in determining the
resistance Rth
- If the circuit contains only independent sources they are made zero by replacing the voltage
sources with short circuits and the current sources with open circuits Rth is then found by
computing the resistance of purely resistive network at the open terminals
- If the circuit contains only dependent sources an independent voltage or current source is
applied at the open terminals and the corresponding current or voltage at these terminals is
measured The VoltageCurrent ratio at the terminals is the Thevenin equivalent resistance Since
there is no energy source the open circuit voltage is zero in this case
- If the circuit contains both the independent and dependent sources the open circuit terminals
are shorted and the short-circuit current between these terminals is determined The ratio of the
open circuit voltage to short circuit current is the resistance Rth
rsaquo Step 3 If the load is now connected to the Thevenin equivalent circuit consisting of Vth in
series with Rth the desired solution can be obtained
APPARATUS
1 DMM
2 Power Supply
3 Resistances (120Ω 1k Ω 390Ω)
PROCEDURE
rsaquo Calculate measured values of resistances
rsaquo Reduce the circuit by calculating the Thevenin equivalent resistance across the terminals A amp
B
rsaquo Calculate the Thevenin equivalent voltage across terminals ldquoArdquo and ldquoBrdquo for 5V 10V 15V
rsaquo Pertaining to circuit in figure III calculate values of IL for different values of RL
rsaquo Now construct circuit in figure I measure the value of Vth by removing RL
EE Department Linear Circuit Analysis
CEME (NUST) Rawalpindi 41
rsaquo Construct circuit in figure II to have measured value of Rth
rsaquo Construct circuit in figure III to determine measured values of IL for different values of RL
Figure-I
Figure-II
Figure-III
OBSERVATIONS amp CALCULATIONS
R1 R2 R3
Vs Vth Rth RL IL
5V 1kΩ
22kΩ
10V 1kΩ
22kΩ
15V 1kΩ
22kΩ
Table Calculated Values
EE Department Linear Circuit Analysis
CEME (NUST) Rawalpindi 42
Vs Vth Rth RL IL
5V 1kΩ
22kΩ
10V 1kΩ
22kΩ
15V 1kΩ
22kΩ
Table Measured Values
Challenge Replacing 1kΩ resistances by 22kΩ and keeping all other things same redo the
above analysis
Note Use separate sheets for analysis of above problem
EE Department Linear Circuit Analysis
CEME (NUST) Rawalpindi 43
ANSWER THE FOLLOWING QUESTIONS
(a) Use Theveninrsquos Theorem to find the current through the 5Ω resistance in the circuit diagram
shown below
(b)What is the importance of Theveninrsquos Theorem in circuit analysis
(c) Discuss the limitations of Theveninrsquos Theorem
(d) A light bulb draws 05A current at the input voltage of 230V Determine the resistance of the
filament and also the power dissipated
Note Use separate sheets for answering above questions
EE Department Linear Circuit Analysis
CEME (NUST) Rawalpindi 44
EXPERIMENT NO ndash 07 MAXIMUM POWER TRANSFER THEOREM
(EXPERIMENTAL VERIFICATION OF MAXIMUM POWER TRANSFER THEOREM FOR A NETWORK)
OBJECTIVE
- To prove maximum power transfer theorem practically
THEORY
The power transferred from a source supply source to load is at its maximum when the resistance
of the load is equal to the internal resistance of the source In other words ldquoA resistive will be
consuming maximum power from the supply when the load resistance is equal to the equivalent
(Thevenin) resistancerdquo
A graph of RL against P is shown in figure below the maximum value of power occurs at RL=
Rth
EE Department Linear Circuit Analysis
CEME (NUST) Rawalpindi 45
APPARATUS
1 DMM
2 Power Supply
3 Resistances fixed (22kΩ 1kΩ) variable (5kΩ)
PROCEDURE
rsaquo Connect the circuit shown in the figure below
rsaquo From the circuit it can be noted that Rth is fixed resistance of value 22kΩ but RL is variable
of value 5kΩ
rsaquo Set the value of Vth = 10 V
rsaquo Change the value of RL in steps as shown in table
rsaquo Measure the voltage VL and current IL and record it in table
rsaquo Plot the graph of power vs load resistance (RL)
rsaquo Using graph estimate P max (practical)
rsaquo Use P max = Vthsup2 4Rth to have the value of P max (theoratical)
rsaquo Repeat above steps by using Rth = 1kΩ
OBSERVATIONS amp CALCULATIONS
PART (I)
For Vth = 10 V Rth = 22kΩ
RL IL VL Power = IL x VL
03kΩ
06kΩ
09kΩ
15kΩ
22kΩ
25kΩ
30kΩ
EE Department Linear Circuit Analysis
CEME (NUST) Rawalpindi 46
33kΩ
36kΩ
40kΩ
P max (theoratical)
P max (practical)
Difference
PART (II)
For Vth = 10V Rth = 1kΩ
RL IL VL Power = IL x VL
03kΩ
06kΩ
09kΩ
15kΩ
22kΩ
25kΩ
30kΩ
33kΩ
36kΩ
40kΩ
EE Department Linear Circuit Analysis
CEME (NUST) Rawalpindi 47
P max (theoratical)
P max (practical)
Difference
Challenge For Rth = 1kΩ +22kΩ estimate maximum power transferred to the circuit
practically Also compare it with theoretical value
Note Use separate sheets for analysis of above problem
EE Department Linear Circuit Analysis
CEME (NUST) Rawalpindi 48
ANSWER THE FOLLOWING QUESTIONS
(a) What is meant by load matching
(b) Find the value of RL for maximum power transfer in the network shown below Also
calculate the maximum power that can be transferred to this load
Note Use separate sheets for answering above questions
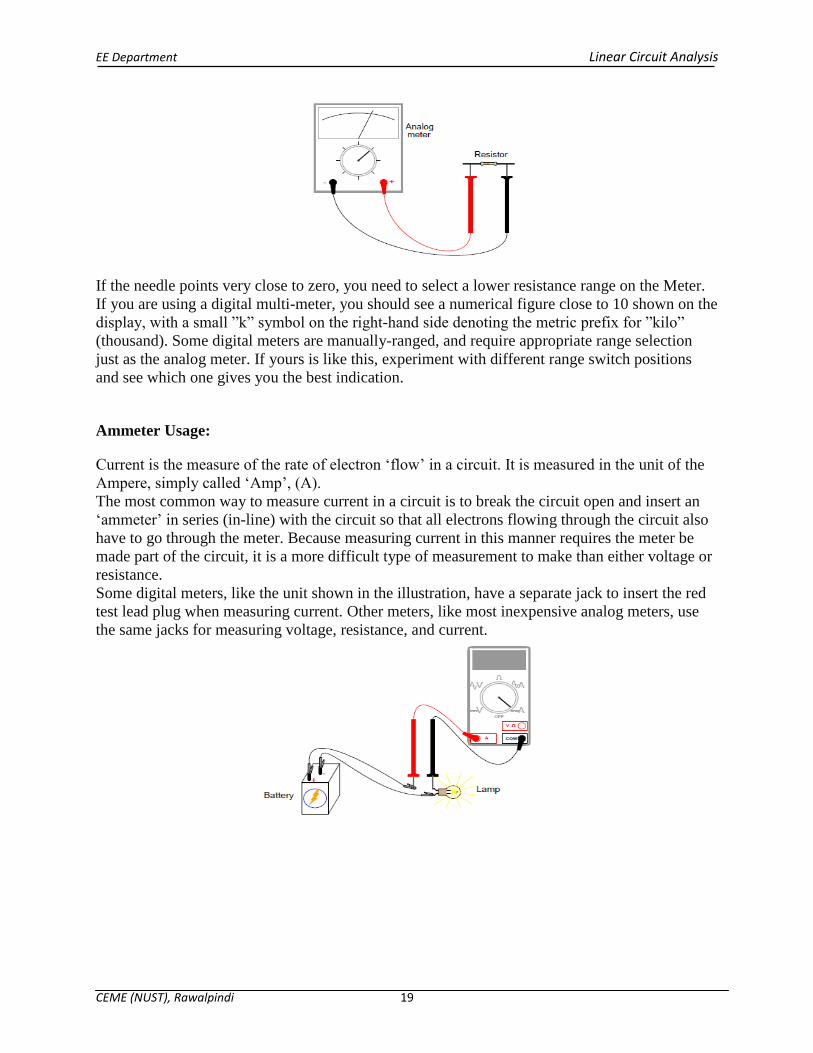
EE Department Linear Circuit Analysis
CEME (NUST) Rawalpindi 23
R1= R2= R3=
rsaquo Using graph paper plot V vs I for each of the three combinations Determine Req for each
case as in (1) above
rsaquo From your results in (1) calculate the predicted (= theoretical) values of Req for each of the
three combinations Display the calculations clearly
rsaquo Summarize your results in the table shown For discrepancies use the predicted values as
more reliable (that is refer to them as if they were exact)
COMBINATION PREDICTED R MEASURED R
DISCR
ALL IN SERIES
ALL IN PARALLEL
SERIES amp
PARALLEL
EE Department Linear Circuit Analysis
CEME (NUST) Rawalpindi 24
EE Department Linear Circuit Analysis
CEME (NUST) Rawalpindi 25
EXPERIMENT NO ndash 03 DIVIDER RULES
(VERIFICATION OF CURRENT DIVIDER RULE amp VOLTAGE DIVIDER RULE)
OBJECTIVE
- Verify the divider rules for voltage (VDR) and current (CDR)
THEORY The Voltage Divider Rule (VDR) states that the voltage across an element or across a series
combination of elements in a series circuit is equal to the resistance of the element or series
combination of elements divided by the total resistance of the series circuit and multiplied by the
total impressed voltage
The Current Divider Rule (CDR) states that the current through one of two parallel branches is
equal to the resistance of the other branch divided by the sum of the resistances of the two
parallel branches and multiplied by the total current entering the two parallel branches That is
APPARATUS
1 Power Supply 2 Resistances 3 Digital Multi-Meter (DMM)
4 Connecting Wires 5 Bread Board
PROCEDURE
Part 1 Voltage Divider Rule (VDR)
Construct the circuit
rsaquo Without making any calculations what value would you expect for the voltage across each
resistor Explain your reasoning
EE Department Linear Circuit Analysis
CEME (NUST) Rawalpindi 26
rsaquo Calculate V1 using the VDR with the measured resistor values Measure V1 and determine the
percent difference between the theoretical and experimental results How do they compare
rsaquo If R2 = R3 then the VDR states the V2 = V3 and V1 = V2 + V3 Measure voltages V2 and V3
and comment on the validity of these statements
rsaquo Using VDR calculate the voltage Vab Measure Vab and determine the percent difference
between the theoretical and experimental results How do they compare
EE Department Linear Circuit Analysis
CEME (NUST) Rawalpindi 27
rsaquo Remove resistor R2 to construct the following open circuit
rsaquo Using the measured resistor values calculate the voltages V1 V2 and Vopen using VDR
Measure voltages V1 V2 and Vopen with the DMM and calculate the percent differences
Explain the reasoning
Part 2 Current Divider Rule (CDR)
Construct the circuit
EE Department Linear Circuit Analysis
CEME (NUST) Rawalpindi 28
rsaquo Without making any calculations what value would you expect for the current through each of
the resistors Explain your reasoning
rsaquo Calculate the currents I1 I2 and I3 using the CDR from the measured value of Is Measure the
currents I1 I2 and I3
rsaquo Based on these measurements are your conclusions of earlier part verified Use a percent
difference to compare the theoretical and experimental results
rsaquo Set the maximum current coming from the power supply at 200 mA via a short Place a short
circuit across the 10kΩ-resistor to construct the following circuit
EE Department Linear Circuit Analysis
CEME (NUST) Rawalpindi 29
Part 3 Challenge Circuit
Construct the circuit below
rsaquo Calculate the voltages V1 V2 V3 and V4 using the VDR with measured resistor values
Measure the voltages V1 V2 V3 and V4 and use a percent difference to compare the calculated
and measured results How do they compare
rsaquo Using the results of earlier part calculate the voltage Vab using KVL
rsaquo Measure the voltage Vab and use a percent difference to compare the calculated and measured
results How do they compare Is the voltage Vab equal to V1 ndash V3 Equal to V2 ndash V4 Explain
your reasoning
rsaquo Suppose now that a short is placed across the terminal points ab Calculate the current Iab
through the short Measure the current Iab and use a percent difference to compare the theoretical
and experimental results How do they compare
Note Use separate sheet for the findings of above part
EE Department Linear Circuit Analysis
CEME (NUST) Rawalpindi 30
EXPERIMENT NO ndash 04 NODAL ANALYSIS
(EXPERIMENTAL VERIFICATION OF NODAL ANALYSIS)
OBJECTIVE
- To analyze a circuit and to determine the unknown parameters of the circuit
THEORY
Under this method the following procedure is adopted
Assume the voltage of different independent nodes
rsaquo Write the equations for each node as per Kirchhoffrsquos Current Law
rsaquo Solve the above equations to get the node voltages
rsaquo Calculate the branch current from the values of node voltages
Let us consider the circuit shown in the figure below L and M are two
independent nodes M can be taken as a reference node Let the voltage of node L (with respect
to M) be VL
Using Kirchofflsquos Law we get
I1+I2=I3
Ohmrsquos law gives
I1= V1 R1= (E1-VL) R1
I2=V2R2 = (E2-VL) R2
I3 =VL R3
(E1-VL)R1 + (E2-VL)R2= VLR3
Rearranging the terms we get
VL (1R1+1R2+1R3)-E1R1-E2R2=0
EE Department Linear Circuit Analysis
CEME (NUST) Rawalpindi 31
It may be noted that the above nodal equation contains the following terms
rsaquo The node voltage multiplied by the sum of all the conductances connected to that node This
term is positive
rsaquo The node voltage at the other end of each branch (connected to this node) multiplied by the
conductance of the branch These terms are negative
rsaquo In this method of solving a network the no of equations required for the solution is one less
than the no of independent nodes in the network
In general the nodal analysis yields similar solutions
APPARATUS
1 Two DC power supplies
2 Five resistances of different values
3 Connecting wires
4 Digital multi meter (DMM)
PROCEDURE
rsaquo Construct the circuit shown in Figure below
Figure
rsaquo Pick the resistances Also verify their resistance by meter and record it in table
rsaquo Solve given circuit for the unknowns before moving to the circuit for measured values
rsaquo Set the DC supply E1=10V and E2=5V
rsaquo Measure the currents through resistances R1 R2 R3 R4 amp R5 and record it in table
rsaquo Also measure voltages across each resistor
rsaquo Now set the DC supply E1=5V and E2=7V
rsaquo Repeat all steps and record the values
Note Use measured values of resistances for all calculations Make these calculations on the space provided
EE Department Linear Circuit Analysis
CEME (NUST) Rawalpindi 32
OBSERVATIONS amp CALCULATIONS
EE Department Linear Circuit Analysis
CEME (NUST) Rawalpindi 33
Resistors R1 R2 R3 R4 R5
Rated
Values
Measured
Values
For E1=10V and E2=5V
Voltages VR1 VR2 VR3 VR4 VR5
Calculated
Values
Measured
Values
Percentage
Difference
Currents IR1 IR2 IR3 IR4 IR5
Calculated
Values
Measured
Values
Percentage
Difference
E1=5V and E2=7V
Voltages VR1 VR2 VR3 VR4 VR5
Calculated
Values
Measured
Values
Percentage
Difference
Currents IR1 IR2 IR3 IR4 IR5
Calculated
Values
Measured
Values
Percentage
Difference
Challenge Swap the resistors R1 with R4 R5 with R2 and repeat all above steps to determine
unknown voltages and currents both theoretically and practically
Note Use separate sheets for analysis of above problem
EE Department Linear Circuit Analysis
CEME (NUST) Rawalpindi 34
ANSWER THE FOLLOWING QUESTIONS
(a) What is a node
(b) Calculate the equivalent resistance
(c) Solve the following circuit for power dissipation (P=VI) across R1 R2 and R3
(d) What do you meant by a super node
Note Use separate sheets for answering above questions
EE Department Linear Circuit Analysis
CEME (NUST) Rawalpindi 35
EXPERIMENT NO ndash 05 MESH ANALYSIS
(EXPERIMENTAL VERIFICATION OF MESH ANALYSIS)
OBJECTIVE
- To analyze a two Mesh circuit and to determine the current in each branch of the circuit
THEORY
The mesh analysis is a systematic way of applying KVL around each mesh of a circuit and
describes the branch voltages in terms of the mesh currents This will give us a set of equations
that we solve together to find the mesh currents Once we find the mesh currents we can use
them to calculate any other currents or voltages of interest
We know from KVL the algebraic sum of voltages around a close loop is zero so considering the
circuit shown below and applying KVL in each loop (mesh)
While writing equations for
Applying KVL to mesh 1
- E1 + I1R1 + (I1 - I2) R2 = 0
I1 (R1 + R2) - I2R2 = E1 (1)
Applying KVL to mesh 2
- E2 + (I2 - I1) R2 + I2R3 = 0
I2 (R2 + R3) - I1R2 = E2 (2)
Solving above two equations values of unknowns can easily be calculated
=
EE Department Linear Circuit Analysis
CEME (NUST) Rawalpindi 36
APPARATUS
1 Two DC power supplies
2 Three resistances of different values
3 Connecting wires
4 Digital multi meter (DMM)
PROCEDURE
rsaquo Construct the circuit shown in Figure below
rsaquo Pick the resistances Also verify their resistance by meter and record it in table
rsaquo Solve given circuit for the unknowns before moving to the circuit for measured values
rsaquo Set the DC supply E1=12V and E2=5V
rsaquo Measure the currents through resistances R1 R2 amp R3 and record it in table
rsaquo Also measure voltages across each resistor
rsaquo Now set the DC supply E1=5V and E2=12V
rsaquo Repeat all steps and record the values
Note Use measured values of resistances for all calculations Make these calculations on the space provided
OBSERVATIONS amp CALCULATIONS
EE Department Linear Circuit Analysis
CEME (NUST) Rawalpindi 37
Resistors R1 R2 R3
Rated Values
Measured Values
For E1=12V and E2=5V
Voltages VR1 VR2 VR3
Calculated Values
Measured Values
Percentage
Difference
Currents IR1 IR2 IR3
Calculated Values
Measured Values
EE Department Linear Circuit Analysis
CEME (NUST) Rawalpindi 38
Percentage
Difference
E1=5V and E2=12V
Voltages VR1 VR2 VR3
Calculated Values
Measured Values
Percentage
Difference
Currents IR1 IR2 IR3
Calculated Values
Measured Values
Percentage
Difference
Challenge Swap the resistors R1 with R3 and repeat all above steps to determine unknown
voltages and currents both theoretically and practically
Note Use separate sheets for analysis of above problem
EE Department Linear Circuit Analysis
CEME (NUST) Rawalpindi 39
ANSWER THE FOLLOWING QUESTIONS
(a) What is the difference between a loop and a mesh
(b) What is an ideal voltage source How is it different from real voltage source
(c) What is an ideal current source How is it different from real current source
(d) Solve the following circuit for power dissipation across R1 R2 and R3
(e) What do you meant by a super mesh
Note Use separate sheets for answering above questions
EE Department Linear Circuit Analysis
CEME (NUST) Rawalpindi 40
EXPERIMENT NO ndash 06 THEVENINS THEOREM
(EXPERIMENTAL VERIFICATION OF THEVENINS THEOREM)
OBJECTIVE
- To Verify Thevenin Theorem by finding its Theveninrsquos Equivalent Circuit
THEORY
Any linear circuit is equivalent to a single voltage source (Thevenins Voltage) in series with
single equivalent resistance (Theveninrsquos Equivalent Resistances)
Applying Theveninrsquos Theorem
rsaquo Step 1 Remove the load and find voltage across the open-circuit terminals Vth All the circuit
analysis techniques presented can be used to compute this voltage
rsaquo Step 2 Determine the Thevenin equivalent resistance of the network at the open terminals with
the load removed Three different types of circuits may be encountered in determining the
resistance Rth
- If the circuit contains only independent sources they are made zero by replacing the voltage
sources with short circuits and the current sources with open circuits Rth is then found by
computing the resistance of purely resistive network at the open terminals
- If the circuit contains only dependent sources an independent voltage or current source is
applied at the open terminals and the corresponding current or voltage at these terminals is
measured The VoltageCurrent ratio at the terminals is the Thevenin equivalent resistance Since
there is no energy source the open circuit voltage is zero in this case
- If the circuit contains both the independent and dependent sources the open circuit terminals
are shorted and the short-circuit current between these terminals is determined The ratio of the
open circuit voltage to short circuit current is the resistance Rth
rsaquo Step 3 If the load is now connected to the Thevenin equivalent circuit consisting of Vth in
series with Rth the desired solution can be obtained
APPARATUS
1 DMM
2 Power Supply
3 Resistances (120Ω 1k Ω 390Ω)
PROCEDURE
rsaquo Calculate measured values of resistances
rsaquo Reduce the circuit by calculating the Thevenin equivalent resistance across the terminals A amp
B
rsaquo Calculate the Thevenin equivalent voltage across terminals ldquoArdquo and ldquoBrdquo for 5V 10V 15V
rsaquo Pertaining to circuit in figure III calculate values of IL for different values of RL
rsaquo Now construct circuit in figure I measure the value of Vth by removing RL
EE Department Linear Circuit Analysis
CEME (NUST) Rawalpindi 41
rsaquo Construct circuit in figure II to have measured value of Rth
rsaquo Construct circuit in figure III to determine measured values of IL for different values of RL
Figure-I
Figure-II
Figure-III
OBSERVATIONS amp CALCULATIONS
R1 R2 R3
Vs Vth Rth RL IL
5V 1kΩ
22kΩ
10V 1kΩ
22kΩ
15V 1kΩ
22kΩ
Table Calculated Values
EE Department Linear Circuit Analysis
CEME (NUST) Rawalpindi 42
Vs Vth Rth RL IL
5V 1kΩ
22kΩ
10V 1kΩ
22kΩ
15V 1kΩ
22kΩ
Table Measured Values
Challenge Replacing 1kΩ resistances by 22kΩ and keeping all other things same redo the
above analysis
Note Use separate sheets for analysis of above problem
EE Department Linear Circuit Analysis
CEME (NUST) Rawalpindi 43
ANSWER THE FOLLOWING QUESTIONS
(a) Use Theveninrsquos Theorem to find the current through the 5Ω resistance in the circuit diagram
shown below
(b)What is the importance of Theveninrsquos Theorem in circuit analysis
(c) Discuss the limitations of Theveninrsquos Theorem
(d) A light bulb draws 05A current at the input voltage of 230V Determine the resistance of the
filament and also the power dissipated
Note Use separate sheets for answering above questions
EE Department Linear Circuit Analysis
CEME (NUST) Rawalpindi 44
EXPERIMENT NO ndash 07 MAXIMUM POWER TRANSFER THEOREM
(EXPERIMENTAL VERIFICATION OF MAXIMUM POWER TRANSFER THEOREM FOR A NETWORK)
OBJECTIVE
- To prove maximum power transfer theorem practically
THEORY
The power transferred from a source supply source to load is at its maximum when the resistance
of the load is equal to the internal resistance of the source In other words ldquoA resistive will be
consuming maximum power from the supply when the load resistance is equal to the equivalent
(Thevenin) resistancerdquo
A graph of RL against P is shown in figure below the maximum value of power occurs at RL=
Rth
EE Department Linear Circuit Analysis
CEME (NUST) Rawalpindi 45
APPARATUS
1 DMM
2 Power Supply
3 Resistances fixed (22kΩ 1kΩ) variable (5kΩ)
PROCEDURE
rsaquo Connect the circuit shown in the figure below
rsaquo From the circuit it can be noted that Rth is fixed resistance of value 22kΩ but RL is variable
of value 5kΩ
rsaquo Set the value of Vth = 10 V
rsaquo Change the value of RL in steps as shown in table
rsaquo Measure the voltage VL and current IL and record it in table
rsaquo Plot the graph of power vs load resistance (RL)
rsaquo Using graph estimate P max (practical)
rsaquo Use P max = Vthsup2 4Rth to have the value of P max (theoratical)
rsaquo Repeat above steps by using Rth = 1kΩ
OBSERVATIONS amp CALCULATIONS
PART (I)
For Vth = 10 V Rth = 22kΩ
RL IL VL Power = IL x VL
03kΩ
06kΩ
09kΩ
15kΩ
22kΩ
25kΩ
30kΩ
EE Department Linear Circuit Analysis
CEME (NUST) Rawalpindi 46
33kΩ
36kΩ
40kΩ
P max (theoratical)
P max (practical)
Difference
PART (II)
For Vth = 10V Rth = 1kΩ
RL IL VL Power = IL x VL
03kΩ
06kΩ
09kΩ
15kΩ
22kΩ
25kΩ
30kΩ
33kΩ
36kΩ
40kΩ
EE Department Linear Circuit Analysis
CEME (NUST) Rawalpindi 47
P max (theoratical)
P max (practical)
Difference
Challenge For Rth = 1kΩ +22kΩ estimate maximum power transferred to the circuit
practically Also compare it with theoretical value
Note Use separate sheets for analysis of above problem
EE Department Linear Circuit Analysis
CEME (NUST) Rawalpindi 48
ANSWER THE FOLLOWING QUESTIONS
(a) What is meant by load matching
(b) Find the value of RL for maximum power transfer in the network shown below Also
calculate the maximum power that can be transferred to this load
Note Use separate sheets for answering above questions
EE Department Linear Circuit Analysis
CEME (NUST) Rawalpindi 24
EE Department Linear Circuit Analysis
CEME (NUST) Rawalpindi 25
EXPERIMENT NO ndash 03 DIVIDER RULES
(VERIFICATION OF CURRENT DIVIDER RULE amp VOLTAGE DIVIDER RULE)
OBJECTIVE
- Verify the divider rules for voltage (VDR) and current (CDR)
THEORY The Voltage Divider Rule (VDR) states that the voltage across an element or across a series
combination of elements in a series circuit is equal to the resistance of the element or series
combination of elements divided by the total resistance of the series circuit and multiplied by the
total impressed voltage
The Current Divider Rule (CDR) states that the current through one of two parallel branches is
equal to the resistance of the other branch divided by the sum of the resistances of the two
parallel branches and multiplied by the total current entering the two parallel branches That is
APPARATUS
1 Power Supply 2 Resistances 3 Digital Multi-Meter (DMM)
4 Connecting Wires 5 Bread Board
PROCEDURE
Part 1 Voltage Divider Rule (VDR)
Construct the circuit
rsaquo Without making any calculations what value would you expect for the voltage across each
resistor Explain your reasoning
EE Department Linear Circuit Analysis
CEME (NUST) Rawalpindi 26
rsaquo Calculate V1 using the VDR with the measured resistor values Measure V1 and determine the
percent difference between the theoretical and experimental results How do they compare
rsaquo If R2 = R3 then the VDR states the V2 = V3 and V1 = V2 + V3 Measure voltages V2 and V3
and comment on the validity of these statements
rsaquo Using VDR calculate the voltage Vab Measure Vab and determine the percent difference
between the theoretical and experimental results How do they compare
EE Department Linear Circuit Analysis
CEME (NUST) Rawalpindi 27
rsaquo Remove resistor R2 to construct the following open circuit
rsaquo Using the measured resistor values calculate the voltages V1 V2 and Vopen using VDR
Measure voltages V1 V2 and Vopen with the DMM and calculate the percent differences
Explain the reasoning
Part 2 Current Divider Rule (CDR)
Construct the circuit
EE Department Linear Circuit Analysis
CEME (NUST) Rawalpindi 28
rsaquo Without making any calculations what value would you expect for the current through each of
the resistors Explain your reasoning
rsaquo Calculate the currents I1 I2 and I3 using the CDR from the measured value of Is Measure the
currents I1 I2 and I3
rsaquo Based on these measurements are your conclusions of earlier part verified Use a percent
difference to compare the theoretical and experimental results
rsaquo Set the maximum current coming from the power supply at 200 mA via a short Place a short
circuit across the 10kΩ-resistor to construct the following circuit
EE Department Linear Circuit Analysis
CEME (NUST) Rawalpindi 29
Part 3 Challenge Circuit
Construct the circuit below
rsaquo Calculate the voltages V1 V2 V3 and V4 using the VDR with measured resistor values
Measure the voltages V1 V2 V3 and V4 and use a percent difference to compare the calculated
and measured results How do they compare
rsaquo Using the results of earlier part calculate the voltage Vab using KVL
rsaquo Measure the voltage Vab and use a percent difference to compare the calculated and measured
results How do they compare Is the voltage Vab equal to V1 ndash V3 Equal to V2 ndash V4 Explain
your reasoning
rsaquo Suppose now that a short is placed across the terminal points ab Calculate the current Iab
through the short Measure the current Iab and use a percent difference to compare the theoretical
and experimental results How do they compare
Note Use separate sheet for the findings of above part
EE Department Linear Circuit Analysis
CEME (NUST) Rawalpindi 30
EXPERIMENT NO ndash 04 NODAL ANALYSIS
(EXPERIMENTAL VERIFICATION OF NODAL ANALYSIS)
OBJECTIVE
- To analyze a circuit and to determine the unknown parameters of the circuit
THEORY
Under this method the following procedure is adopted
Assume the voltage of different independent nodes
rsaquo Write the equations for each node as per Kirchhoffrsquos Current Law
rsaquo Solve the above equations to get the node voltages
rsaquo Calculate the branch current from the values of node voltages
Let us consider the circuit shown in the figure below L and M are two
independent nodes M can be taken as a reference node Let the voltage of node L (with respect
to M) be VL
Using Kirchofflsquos Law we get
I1+I2=I3
Ohmrsquos law gives
I1= V1 R1= (E1-VL) R1
I2=V2R2 = (E2-VL) R2
I3 =VL R3
(E1-VL)R1 + (E2-VL)R2= VLR3
Rearranging the terms we get
VL (1R1+1R2+1R3)-E1R1-E2R2=0
EE Department Linear Circuit Analysis
CEME (NUST) Rawalpindi 31
It may be noted that the above nodal equation contains the following terms
rsaquo The node voltage multiplied by the sum of all the conductances connected to that node This
term is positive
rsaquo The node voltage at the other end of each branch (connected to this node) multiplied by the
conductance of the branch These terms are negative
rsaquo In this method of solving a network the no of equations required for the solution is one less
than the no of independent nodes in the network
In general the nodal analysis yields similar solutions
APPARATUS
1 Two DC power supplies
2 Five resistances of different values
3 Connecting wires
4 Digital multi meter (DMM)
PROCEDURE
rsaquo Construct the circuit shown in Figure below
Figure
rsaquo Pick the resistances Also verify their resistance by meter and record it in table
rsaquo Solve given circuit for the unknowns before moving to the circuit for measured values
rsaquo Set the DC supply E1=10V and E2=5V
rsaquo Measure the currents through resistances R1 R2 R3 R4 amp R5 and record it in table
rsaquo Also measure voltages across each resistor
rsaquo Now set the DC supply E1=5V and E2=7V
rsaquo Repeat all steps and record the values
Note Use measured values of resistances for all calculations Make these calculations on the space provided
EE Department Linear Circuit Analysis
CEME (NUST) Rawalpindi 32
OBSERVATIONS amp CALCULATIONS
EE Department Linear Circuit Analysis
CEME (NUST) Rawalpindi 33
Resistors R1 R2 R3 R4 R5
Rated
Values
Measured
Values
For E1=10V and E2=5V
Voltages VR1 VR2 VR3 VR4 VR5
Calculated
Values
Measured
Values
Percentage
Difference
Currents IR1 IR2 IR3 IR4 IR5
Calculated
Values
Measured
Values
Percentage
Difference
E1=5V and E2=7V
Voltages VR1 VR2 VR3 VR4 VR5
Calculated
Values
Measured
Values
Percentage
Difference
Currents IR1 IR2 IR3 IR4 IR5
Calculated
Values
Measured
Values
Percentage
Difference
Challenge Swap the resistors R1 with R4 R5 with R2 and repeat all above steps to determine
unknown voltages and currents both theoretically and practically
Note Use separate sheets for analysis of above problem
EE Department Linear Circuit Analysis
CEME (NUST) Rawalpindi 34
ANSWER THE FOLLOWING QUESTIONS
(a) What is a node
(b) Calculate the equivalent resistance
(c) Solve the following circuit for power dissipation (P=VI) across R1 R2 and R3
(d) What do you meant by a super node
Note Use separate sheets for answering above questions
EE Department Linear Circuit Analysis
CEME (NUST) Rawalpindi 35
EXPERIMENT NO ndash 05 MESH ANALYSIS
(EXPERIMENTAL VERIFICATION OF MESH ANALYSIS)
OBJECTIVE
- To analyze a two Mesh circuit and to determine the current in each branch of the circuit
THEORY
The mesh analysis is a systematic way of applying KVL around each mesh of a circuit and
describes the branch voltages in terms of the mesh currents This will give us a set of equations
that we solve together to find the mesh currents Once we find the mesh currents we can use
them to calculate any other currents or voltages of interest
We know from KVL the algebraic sum of voltages around a close loop is zero so considering the
circuit shown below and applying KVL in each loop (mesh)
While writing equations for
Applying KVL to mesh 1
- E1 + I1R1 + (I1 - I2) R2 = 0
I1 (R1 + R2) - I2R2 = E1 (1)
Applying KVL to mesh 2
- E2 + (I2 - I1) R2 + I2R3 = 0
I2 (R2 + R3) - I1R2 = E2 (2)
Solving above two equations values of unknowns can easily be calculated
=
EE Department Linear Circuit Analysis
CEME (NUST) Rawalpindi 36
APPARATUS
1 Two DC power supplies
2 Three resistances of different values
3 Connecting wires
4 Digital multi meter (DMM)
PROCEDURE
rsaquo Construct the circuit shown in Figure below
rsaquo Pick the resistances Also verify their resistance by meter and record it in table
rsaquo Solve given circuit for the unknowns before moving to the circuit for measured values
rsaquo Set the DC supply E1=12V and E2=5V
rsaquo Measure the currents through resistances R1 R2 amp R3 and record it in table
rsaquo Also measure voltages across each resistor
rsaquo Now set the DC supply E1=5V and E2=12V
rsaquo Repeat all steps and record the values
Note Use measured values of resistances for all calculations Make these calculations on the space provided
OBSERVATIONS amp CALCULATIONS
EE Department Linear Circuit Analysis
CEME (NUST) Rawalpindi 37
Resistors R1 R2 R3
Rated Values
Measured Values
For E1=12V and E2=5V
Voltages VR1 VR2 VR3
Calculated Values
Measured Values
Percentage
Difference
Currents IR1 IR2 IR3
Calculated Values
Measured Values
EE Department Linear Circuit Analysis
CEME (NUST) Rawalpindi 38
Percentage
Difference
E1=5V and E2=12V
Voltages VR1 VR2 VR3
Calculated Values
Measured Values
Percentage
Difference
Currents IR1 IR2 IR3
Calculated Values
Measured Values
Percentage
Difference
Challenge Swap the resistors R1 with R3 and repeat all above steps to determine unknown
voltages and currents both theoretically and practically
Note Use separate sheets for analysis of above problem
EE Department Linear Circuit Analysis
CEME (NUST) Rawalpindi 39
ANSWER THE FOLLOWING QUESTIONS
(a) What is the difference between a loop and a mesh
(b) What is an ideal voltage source How is it different from real voltage source
(c) What is an ideal current source How is it different from real current source
(d) Solve the following circuit for power dissipation across R1 R2 and R3
(e) What do you meant by a super mesh
Note Use separate sheets for answering above questions
EE Department Linear Circuit Analysis
CEME (NUST) Rawalpindi 40
EXPERIMENT NO ndash 06 THEVENINS THEOREM
(EXPERIMENTAL VERIFICATION OF THEVENINS THEOREM)
OBJECTIVE
- To Verify Thevenin Theorem by finding its Theveninrsquos Equivalent Circuit
THEORY
Any linear circuit is equivalent to a single voltage source (Thevenins Voltage) in series with
single equivalent resistance (Theveninrsquos Equivalent Resistances)
Applying Theveninrsquos Theorem
rsaquo Step 1 Remove the load and find voltage across the open-circuit terminals Vth All the circuit
analysis techniques presented can be used to compute this voltage
rsaquo Step 2 Determine the Thevenin equivalent resistance of the network at the open terminals with
the load removed Three different types of circuits may be encountered in determining the
resistance Rth
- If the circuit contains only independent sources they are made zero by replacing the voltage
sources with short circuits and the current sources with open circuits Rth is then found by
computing the resistance of purely resistive network at the open terminals
- If the circuit contains only dependent sources an independent voltage or current source is
applied at the open terminals and the corresponding current or voltage at these terminals is
measured The VoltageCurrent ratio at the terminals is the Thevenin equivalent resistance Since
there is no energy source the open circuit voltage is zero in this case
- If the circuit contains both the independent and dependent sources the open circuit terminals
are shorted and the short-circuit current between these terminals is determined The ratio of the
open circuit voltage to short circuit current is the resistance Rth
rsaquo Step 3 If the load is now connected to the Thevenin equivalent circuit consisting of Vth in
series with Rth the desired solution can be obtained
APPARATUS
1 DMM
2 Power Supply
3 Resistances (120Ω 1k Ω 390Ω)
PROCEDURE
rsaquo Calculate measured values of resistances
rsaquo Reduce the circuit by calculating the Thevenin equivalent resistance across the terminals A amp
B
rsaquo Calculate the Thevenin equivalent voltage across terminals ldquoArdquo and ldquoBrdquo for 5V 10V 15V
rsaquo Pertaining to circuit in figure III calculate values of IL for different values of RL
rsaquo Now construct circuit in figure I measure the value of Vth by removing RL
EE Department Linear Circuit Analysis
CEME (NUST) Rawalpindi 41
rsaquo Construct circuit in figure II to have measured value of Rth
rsaquo Construct circuit in figure III to determine measured values of IL for different values of RL
Figure-I
Figure-II
Figure-III
OBSERVATIONS amp CALCULATIONS
R1 R2 R3
Vs Vth Rth RL IL
5V 1kΩ
22kΩ
10V 1kΩ
22kΩ
15V 1kΩ
22kΩ
Table Calculated Values
EE Department Linear Circuit Analysis
CEME (NUST) Rawalpindi 42
Vs Vth Rth RL IL
5V 1kΩ
22kΩ
10V 1kΩ
22kΩ
15V 1kΩ
22kΩ
Table Measured Values
Challenge Replacing 1kΩ resistances by 22kΩ and keeping all other things same redo the
above analysis
Note Use separate sheets for analysis of above problem
EE Department Linear Circuit Analysis
CEME (NUST) Rawalpindi 43
ANSWER THE FOLLOWING QUESTIONS
(a) Use Theveninrsquos Theorem to find the current through the 5Ω resistance in the circuit diagram
shown below
(b)What is the importance of Theveninrsquos Theorem in circuit analysis
(c) Discuss the limitations of Theveninrsquos Theorem
(d) A light bulb draws 05A current at the input voltage of 230V Determine the resistance of the
filament and also the power dissipated
Note Use separate sheets for answering above questions
EE Department Linear Circuit Analysis
CEME (NUST) Rawalpindi 44
EXPERIMENT NO ndash 07 MAXIMUM POWER TRANSFER THEOREM
(EXPERIMENTAL VERIFICATION OF MAXIMUM POWER TRANSFER THEOREM FOR A NETWORK)
OBJECTIVE
- To prove maximum power transfer theorem practically
THEORY
The power transferred from a source supply source to load is at its maximum when the resistance
of the load is equal to the internal resistance of the source In other words ldquoA resistive will be
consuming maximum power from the supply when the load resistance is equal to the equivalent
(Thevenin) resistancerdquo
A graph of RL against P is shown in figure below the maximum value of power occurs at RL=
Rth
EE Department Linear Circuit Analysis
CEME (NUST) Rawalpindi 45
APPARATUS
1 DMM
2 Power Supply
3 Resistances fixed (22kΩ 1kΩ) variable (5kΩ)
PROCEDURE
rsaquo Connect the circuit shown in the figure below
rsaquo From the circuit it can be noted that Rth is fixed resistance of value 22kΩ but RL is variable
of value 5kΩ
rsaquo Set the value of Vth = 10 V
rsaquo Change the value of RL in steps as shown in table
rsaquo Measure the voltage VL and current IL and record it in table
rsaquo Plot the graph of power vs load resistance (RL)
rsaquo Using graph estimate P max (practical)
rsaquo Use P max = Vthsup2 4Rth to have the value of P max (theoratical)
rsaquo Repeat above steps by using Rth = 1kΩ
OBSERVATIONS amp CALCULATIONS
PART (I)
For Vth = 10 V Rth = 22kΩ
RL IL VL Power = IL x VL
03kΩ
06kΩ
09kΩ
15kΩ
22kΩ
25kΩ
30kΩ
EE Department Linear Circuit Analysis
CEME (NUST) Rawalpindi 46
33kΩ
36kΩ
40kΩ
P max (theoratical)
P max (practical)
Difference
PART (II)
For Vth = 10V Rth = 1kΩ
RL IL VL Power = IL x VL
03kΩ
06kΩ
09kΩ
15kΩ
22kΩ
25kΩ
30kΩ
33kΩ
36kΩ
40kΩ
EE Department Linear Circuit Analysis
CEME (NUST) Rawalpindi 47
P max (theoratical)
P max (practical)
Difference
Challenge For Rth = 1kΩ +22kΩ estimate maximum power transferred to the circuit
practically Also compare it with theoretical value
Note Use separate sheets for analysis of above problem
EE Department Linear Circuit Analysis
CEME (NUST) Rawalpindi 48
ANSWER THE FOLLOWING QUESTIONS
(a) What is meant by load matching
(b) Find the value of RL for maximum power transfer in the network shown below Also
calculate the maximum power that can be transferred to this load
Note Use separate sheets for answering above questions

EE Department Linear Circuit Analysis
CEME (NUST) Rawalpindi 27
rsaquo Remove resistor R2 to construct the following open circuit
rsaquo Using the measured resistor values calculate the voltages V1 V2 and Vopen using VDR
Measure voltages V1 V2 and Vopen with the DMM and calculate the percent differences
Explain the reasoning
Part 2 Current Divider Rule (CDR)
Construct the circuit
EE Department Linear Circuit Analysis
CEME (NUST) Rawalpindi 28
rsaquo Without making any calculations what value would you expect for the current through each of
the resistors Explain your reasoning
rsaquo Calculate the currents I1 I2 and I3 using the CDR from the measured value of Is Measure the
currents I1 I2 and I3
rsaquo Based on these measurements are your conclusions of earlier part verified Use a percent
difference to compare the theoretical and experimental results
rsaquo Set the maximum current coming from the power supply at 200 mA via a short Place a short
circuit across the 10kΩ-resistor to construct the following circuit
EE Department Linear Circuit Analysis
CEME (NUST) Rawalpindi 29
Part 3 Challenge Circuit
Construct the circuit below
rsaquo Calculate the voltages V1 V2 V3 and V4 using the VDR with measured resistor values
Measure the voltages V1 V2 V3 and V4 and use a percent difference to compare the calculated
and measured results How do they compare
rsaquo Using the results of earlier part calculate the voltage Vab using KVL
rsaquo Measure the voltage Vab and use a percent difference to compare the calculated and measured
results How do they compare Is the voltage Vab equal to V1 ndash V3 Equal to V2 ndash V4 Explain
your reasoning
rsaquo Suppose now that a short is placed across the terminal points ab Calculate the current Iab
through the short Measure the current Iab and use a percent difference to compare the theoretical
and experimental results How do they compare
Note Use separate sheet for the findings of above part
EE Department Linear Circuit Analysis
CEME (NUST) Rawalpindi 30
EXPERIMENT NO ndash 04 NODAL ANALYSIS
(EXPERIMENTAL VERIFICATION OF NODAL ANALYSIS)
OBJECTIVE
- To analyze a circuit and to determine the unknown parameters of the circuit
THEORY
Under this method the following procedure is adopted
Assume the voltage of different independent nodes
rsaquo Write the equations for each node as per Kirchhoffrsquos Current Law
rsaquo Solve the above equations to get the node voltages
rsaquo Calculate the branch current from the values of node voltages
Let us consider the circuit shown in the figure below L and M are two
independent nodes M can be taken as a reference node Let the voltage of node L (with respect
to M) be VL
Using Kirchofflsquos Law we get
I1+I2=I3
Ohmrsquos law gives
I1= V1 R1= (E1-VL) R1
I2=V2R2 = (E2-VL) R2
I3 =VL R3
(E1-VL)R1 + (E2-VL)R2= VLR3
Rearranging the terms we get
VL (1R1+1R2+1R3)-E1R1-E2R2=0
EE Department Linear Circuit Analysis
CEME (NUST) Rawalpindi 31
It may be noted that the above nodal equation contains the following terms
rsaquo The node voltage multiplied by the sum of all the conductances connected to that node This
term is positive
rsaquo The node voltage at the other end of each branch (connected to this node) multiplied by the
conductance of the branch These terms are negative
rsaquo In this method of solving a network the no of equations required for the solution is one less
than the no of independent nodes in the network
In general the nodal analysis yields similar solutions
APPARATUS
1 Two DC power supplies
2 Five resistances of different values
3 Connecting wires
4 Digital multi meter (DMM)
PROCEDURE
rsaquo Construct the circuit shown in Figure below
Figure
rsaquo Pick the resistances Also verify their resistance by meter and record it in table
rsaquo Solve given circuit for the unknowns before moving to the circuit for measured values
rsaquo Set the DC supply E1=10V and E2=5V
rsaquo Measure the currents through resistances R1 R2 R3 R4 amp R5 and record it in table
rsaquo Also measure voltages across each resistor
rsaquo Now set the DC supply E1=5V and E2=7V
rsaquo Repeat all steps and record the values
Note Use measured values of resistances for all calculations Make these calculations on the space provided
EE Department Linear Circuit Analysis
CEME (NUST) Rawalpindi 32
OBSERVATIONS amp CALCULATIONS
EE Department Linear Circuit Analysis
CEME (NUST) Rawalpindi 33
Resistors R1 R2 R3 R4 R5
Rated
Values
Measured
Values
For E1=10V and E2=5V
Voltages VR1 VR2 VR3 VR4 VR5
Calculated
Values
Measured
Values
Percentage
Difference
Currents IR1 IR2 IR3 IR4 IR5
Calculated
Values
Measured
Values
Percentage
Difference
E1=5V and E2=7V
Voltages VR1 VR2 VR3 VR4 VR5
Calculated
Values
Measured
Values
Percentage
Difference
Currents IR1 IR2 IR3 IR4 IR5
Calculated
Values
Measured
Values
Percentage
Difference
Challenge Swap the resistors R1 with R4 R5 with R2 and repeat all above steps to determine
unknown voltages and currents both theoretically and practically
Note Use separate sheets for analysis of above problem
EE Department Linear Circuit Analysis
CEME (NUST) Rawalpindi 34
ANSWER THE FOLLOWING QUESTIONS
(a) What is a node
(b) Calculate the equivalent resistance
(c) Solve the following circuit for power dissipation (P=VI) across R1 R2 and R3
(d) What do you meant by a super node
Note Use separate sheets for answering above questions
EE Department Linear Circuit Analysis
CEME (NUST) Rawalpindi 35
EXPERIMENT NO ndash 05 MESH ANALYSIS
(EXPERIMENTAL VERIFICATION OF MESH ANALYSIS)
OBJECTIVE
- To analyze a two Mesh circuit and to determine the current in each branch of the circuit
THEORY
The mesh analysis is a systematic way of applying KVL around each mesh of a circuit and
describes the branch voltages in terms of the mesh currents This will give us a set of equations
that we solve together to find the mesh currents Once we find the mesh currents we can use
them to calculate any other currents or voltages of interest
We know from KVL the algebraic sum of voltages around a close loop is zero so considering the
circuit shown below and applying KVL in each loop (mesh)
While writing equations for
Applying KVL to mesh 1
- E1 + I1R1 + (I1 - I2) R2 = 0
I1 (R1 + R2) - I2R2 = E1 (1)
Applying KVL to mesh 2
- E2 + (I2 - I1) R2 + I2R3 = 0
I2 (R2 + R3) - I1R2 = E2 (2)
Solving above two equations values of unknowns can easily be calculated
=
EE Department Linear Circuit Analysis
CEME (NUST) Rawalpindi 36
APPARATUS
1 Two DC power supplies
2 Three resistances of different values
3 Connecting wires
4 Digital multi meter (DMM)
PROCEDURE
rsaquo Construct the circuit shown in Figure below
rsaquo Pick the resistances Also verify their resistance by meter and record it in table
rsaquo Solve given circuit for the unknowns before moving to the circuit for measured values
rsaquo Set the DC supply E1=12V and E2=5V
rsaquo Measure the currents through resistances R1 R2 amp R3 and record it in table
rsaquo Also measure voltages across each resistor
rsaquo Now set the DC supply E1=5V and E2=12V
rsaquo Repeat all steps and record the values
Note Use measured values of resistances for all calculations Make these calculations on the space provided
OBSERVATIONS amp CALCULATIONS
EE Department Linear Circuit Analysis
CEME (NUST) Rawalpindi 37
Resistors R1 R2 R3
Rated Values
Measured Values
For E1=12V and E2=5V
Voltages VR1 VR2 VR3
Calculated Values
Measured Values
Percentage
Difference
Currents IR1 IR2 IR3
Calculated Values
Measured Values
EE Department Linear Circuit Analysis
CEME (NUST) Rawalpindi 38
Percentage
Difference
E1=5V and E2=12V
Voltages VR1 VR2 VR3
Calculated Values
Measured Values
Percentage
Difference
Currents IR1 IR2 IR3
Calculated Values
Measured Values
Percentage
Difference
Challenge Swap the resistors R1 with R3 and repeat all above steps to determine unknown
voltages and currents both theoretically and practically
Note Use separate sheets for analysis of above problem
EE Department Linear Circuit Analysis
CEME (NUST) Rawalpindi 39
ANSWER THE FOLLOWING QUESTIONS
(a) What is the difference between a loop and a mesh
(b) What is an ideal voltage source How is it different from real voltage source
(c) What is an ideal current source How is it different from real current source
(d) Solve the following circuit for power dissipation across R1 R2 and R3
(e) What do you meant by a super mesh
Note Use separate sheets for answering above questions
EE Department Linear Circuit Analysis
CEME (NUST) Rawalpindi 40
EXPERIMENT NO ndash 06 THEVENINS THEOREM
(EXPERIMENTAL VERIFICATION OF THEVENINS THEOREM)
OBJECTIVE
- To Verify Thevenin Theorem by finding its Theveninrsquos Equivalent Circuit
THEORY
Any linear circuit is equivalent to a single voltage source (Thevenins Voltage) in series with
single equivalent resistance (Theveninrsquos Equivalent Resistances)
Applying Theveninrsquos Theorem
rsaquo Step 1 Remove the load and find voltage across the open-circuit terminals Vth All the circuit
analysis techniques presented can be used to compute this voltage
rsaquo Step 2 Determine the Thevenin equivalent resistance of the network at the open terminals with
the load removed Three different types of circuits may be encountered in determining the
resistance Rth
- If the circuit contains only independent sources they are made zero by replacing the voltage
sources with short circuits and the current sources with open circuits Rth is then found by
computing the resistance of purely resistive network at the open terminals
- If the circuit contains only dependent sources an independent voltage or current source is
applied at the open terminals and the corresponding current or voltage at these terminals is
measured The VoltageCurrent ratio at the terminals is the Thevenin equivalent resistance Since
there is no energy source the open circuit voltage is zero in this case
- If the circuit contains both the independent and dependent sources the open circuit terminals
are shorted and the short-circuit current between these terminals is determined The ratio of the
open circuit voltage to short circuit current is the resistance Rth
rsaquo Step 3 If the load is now connected to the Thevenin equivalent circuit consisting of Vth in
series with Rth the desired solution can be obtained
APPARATUS
1 DMM
2 Power Supply
3 Resistances (120Ω 1k Ω 390Ω)
PROCEDURE
rsaquo Calculate measured values of resistances
rsaquo Reduce the circuit by calculating the Thevenin equivalent resistance across the terminals A amp
B
rsaquo Calculate the Thevenin equivalent voltage across terminals ldquoArdquo and ldquoBrdquo for 5V 10V 15V
rsaquo Pertaining to circuit in figure III calculate values of IL for different values of RL
rsaquo Now construct circuit in figure I measure the value of Vth by removing RL
EE Department Linear Circuit Analysis
CEME (NUST) Rawalpindi 41
rsaquo Construct circuit in figure II to have measured value of Rth
rsaquo Construct circuit in figure III to determine measured values of IL for different values of RL
Figure-I
Figure-II
Figure-III
OBSERVATIONS amp CALCULATIONS
R1 R2 R3
Vs Vth Rth RL IL
5V 1kΩ
22kΩ
10V 1kΩ
22kΩ
15V 1kΩ
22kΩ
Table Calculated Values
EE Department Linear Circuit Analysis
CEME (NUST) Rawalpindi 42
Vs Vth Rth RL IL
5V 1kΩ
22kΩ
10V 1kΩ
22kΩ
15V 1kΩ
22kΩ
Table Measured Values
Challenge Replacing 1kΩ resistances by 22kΩ and keeping all other things same redo the
above analysis
Note Use separate sheets for analysis of above problem
EE Department Linear Circuit Analysis
CEME (NUST) Rawalpindi 43
ANSWER THE FOLLOWING QUESTIONS
(a) Use Theveninrsquos Theorem to find the current through the 5Ω resistance in the circuit diagram
shown below
(b)What is the importance of Theveninrsquos Theorem in circuit analysis
(c) Discuss the limitations of Theveninrsquos Theorem
(d) A light bulb draws 05A current at the input voltage of 230V Determine the resistance of the
filament and also the power dissipated
Note Use separate sheets for answering above questions
EE Department Linear Circuit Analysis
CEME (NUST) Rawalpindi 44
EXPERIMENT NO ndash 07 MAXIMUM POWER TRANSFER THEOREM
(EXPERIMENTAL VERIFICATION OF MAXIMUM POWER TRANSFER THEOREM FOR A NETWORK)
OBJECTIVE
- To prove maximum power transfer theorem practically
THEORY
The power transferred from a source supply source to load is at its maximum when the resistance
of the load is equal to the internal resistance of the source In other words ldquoA resistive will be
consuming maximum power from the supply when the load resistance is equal to the equivalent
(Thevenin) resistancerdquo
A graph of RL against P is shown in figure below the maximum value of power occurs at RL=
Rth
EE Department Linear Circuit Analysis
CEME (NUST) Rawalpindi 45
APPARATUS
1 DMM
2 Power Supply
3 Resistances fixed (22kΩ 1kΩ) variable (5kΩ)
PROCEDURE
rsaquo Connect the circuit shown in the figure below
rsaquo From the circuit it can be noted that Rth is fixed resistance of value 22kΩ but RL is variable
of value 5kΩ
rsaquo Set the value of Vth = 10 V
rsaquo Change the value of RL in steps as shown in table
rsaquo Measure the voltage VL and current IL and record it in table
rsaquo Plot the graph of power vs load resistance (RL)
rsaquo Using graph estimate P max (practical)
rsaquo Use P max = Vthsup2 4Rth to have the value of P max (theoratical)
rsaquo Repeat above steps by using Rth = 1kΩ
OBSERVATIONS amp CALCULATIONS
PART (I)
For Vth = 10 V Rth = 22kΩ
RL IL VL Power = IL x VL
03kΩ
06kΩ
09kΩ
15kΩ
22kΩ
25kΩ
30kΩ
EE Department Linear Circuit Analysis
CEME (NUST) Rawalpindi 46
33kΩ
36kΩ
40kΩ
P max (theoratical)
P max (practical)
Difference
PART (II)
For Vth = 10V Rth = 1kΩ
RL IL VL Power = IL x VL
03kΩ
06kΩ
09kΩ
15kΩ
22kΩ
25kΩ
30kΩ
33kΩ
36kΩ
40kΩ
EE Department Linear Circuit Analysis
CEME (NUST) Rawalpindi 47
P max (theoratical)
P max (practical)
Difference
Challenge For Rth = 1kΩ +22kΩ estimate maximum power transferred to the circuit
practically Also compare it with theoretical value
Note Use separate sheets for analysis of above problem
EE Department Linear Circuit Analysis
CEME (NUST) Rawalpindi 48
ANSWER THE FOLLOWING QUESTIONS
(a) What is meant by load matching
(b) Find the value of RL for maximum power transfer in the network shown below Also
calculate the maximum power that can be transferred to this load
Note Use separate sheets for answering above questions
EE Department Linear Circuit Analysis
CEME (NUST) Rawalpindi 28
rsaquo Without making any calculations what value would you expect for the current through each of
the resistors Explain your reasoning
rsaquo Calculate the currents I1 I2 and I3 using the CDR from the measured value of Is Measure the
currents I1 I2 and I3
rsaquo Based on these measurements are your conclusions of earlier part verified Use a percent
difference to compare the theoretical and experimental results
rsaquo Set the maximum current coming from the power supply at 200 mA via a short Place a short
circuit across the 10kΩ-resistor to construct the following circuit
EE Department Linear Circuit Analysis
CEME (NUST) Rawalpindi 29
Part 3 Challenge Circuit
Construct the circuit below
rsaquo Calculate the voltages V1 V2 V3 and V4 using the VDR with measured resistor values
Measure the voltages V1 V2 V3 and V4 and use a percent difference to compare the calculated
and measured results How do they compare
rsaquo Using the results of earlier part calculate the voltage Vab using KVL
rsaquo Measure the voltage Vab and use a percent difference to compare the calculated and measured
results How do they compare Is the voltage Vab equal to V1 ndash V3 Equal to V2 ndash V4 Explain
your reasoning
rsaquo Suppose now that a short is placed across the terminal points ab Calculate the current Iab
through the short Measure the current Iab and use a percent difference to compare the theoretical
and experimental results How do they compare
Note Use separate sheet for the findings of above part
EE Department Linear Circuit Analysis
CEME (NUST) Rawalpindi 30
EXPERIMENT NO ndash 04 NODAL ANALYSIS
(EXPERIMENTAL VERIFICATION OF NODAL ANALYSIS)
OBJECTIVE
- To analyze a circuit and to determine the unknown parameters of the circuit
THEORY
Under this method the following procedure is adopted
Assume the voltage of different independent nodes
rsaquo Write the equations for each node as per Kirchhoffrsquos Current Law
rsaquo Solve the above equations to get the node voltages
rsaquo Calculate the branch current from the values of node voltages
Let us consider the circuit shown in the figure below L and M are two
independent nodes M can be taken as a reference node Let the voltage of node L (with respect
to M) be VL
Using Kirchofflsquos Law we get
I1+I2=I3
Ohmrsquos law gives
I1= V1 R1= (E1-VL) R1
I2=V2R2 = (E2-VL) R2
I3 =VL R3
(E1-VL)R1 + (E2-VL)R2= VLR3
Rearranging the terms we get
VL (1R1+1R2+1R3)-E1R1-E2R2=0
EE Department Linear Circuit Analysis
CEME (NUST) Rawalpindi 31
It may be noted that the above nodal equation contains the following terms
rsaquo The node voltage multiplied by the sum of all the conductances connected to that node This
term is positive
rsaquo The node voltage at the other end of each branch (connected to this node) multiplied by the
conductance of the branch These terms are negative
rsaquo In this method of solving a network the no of equations required for the solution is one less
than the no of independent nodes in the network
In general the nodal analysis yields similar solutions
APPARATUS
1 Two DC power supplies
2 Five resistances of different values
3 Connecting wires
4 Digital multi meter (DMM)
PROCEDURE
rsaquo Construct the circuit shown in Figure below
Figure
rsaquo Pick the resistances Also verify their resistance by meter and record it in table
rsaquo Solve given circuit for the unknowns before moving to the circuit for measured values
rsaquo Set the DC supply E1=10V and E2=5V
rsaquo Measure the currents through resistances R1 R2 R3 R4 amp R5 and record it in table
rsaquo Also measure voltages across each resistor
rsaquo Now set the DC supply E1=5V and E2=7V
rsaquo Repeat all steps and record the values
Note Use measured values of resistances for all calculations Make these calculations on the space provided
EE Department Linear Circuit Analysis
CEME (NUST) Rawalpindi 32
OBSERVATIONS amp CALCULATIONS
EE Department Linear Circuit Analysis
CEME (NUST) Rawalpindi 33
Resistors R1 R2 R3 R4 R5
Rated
Values
Measured
Values
For E1=10V and E2=5V
Voltages VR1 VR2 VR3 VR4 VR5
Calculated
Values
Measured
Values
Percentage
Difference
Currents IR1 IR2 IR3 IR4 IR5
Calculated
Values
Measured
Values
Percentage
Difference
E1=5V and E2=7V
Voltages VR1 VR2 VR3 VR4 VR5
Calculated
Values
Measured
Values
Percentage
Difference
Currents IR1 IR2 IR3 IR4 IR5
Calculated
Values
Measured
Values
Percentage
Difference
Challenge Swap the resistors R1 with R4 R5 with R2 and repeat all above steps to determine
unknown voltages and currents both theoretically and practically
Note Use separate sheets for analysis of above problem
EE Department Linear Circuit Analysis
CEME (NUST) Rawalpindi 34
ANSWER THE FOLLOWING QUESTIONS
(a) What is a node
(b) Calculate the equivalent resistance
(c) Solve the following circuit for power dissipation (P=VI) across R1 R2 and R3
(d) What do you meant by a super node
Note Use separate sheets for answering above questions
EE Department Linear Circuit Analysis
CEME (NUST) Rawalpindi 35
EXPERIMENT NO ndash 05 MESH ANALYSIS
(EXPERIMENTAL VERIFICATION OF MESH ANALYSIS)
OBJECTIVE
- To analyze a two Mesh circuit and to determine the current in each branch of the circuit
THEORY
The mesh analysis is a systematic way of applying KVL around each mesh of a circuit and
describes the branch voltages in terms of the mesh currents This will give us a set of equations
that we solve together to find the mesh currents Once we find the mesh currents we can use
them to calculate any other currents or voltages of interest
We know from KVL the algebraic sum of voltages around a close loop is zero so considering the
circuit shown below and applying KVL in each loop (mesh)
While writing equations for
Applying KVL to mesh 1
- E1 + I1R1 + (I1 - I2) R2 = 0
I1 (R1 + R2) - I2R2 = E1 (1)
Applying KVL to mesh 2
- E2 + (I2 - I1) R2 + I2R3 = 0
I2 (R2 + R3) - I1R2 = E2 (2)
Solving above two equations values of unknowns can easily be calculated
=
EE Department Linear Circuit Analysis
CEME (NUST) Rawalpindi 36
APPARATUS
1 Two DC power supplies
2 Three resistances of different values
3 Connecting wires
4 Digital multi meter (DMM)
PROCEDURE
rsaquo Construct the circuit shown in Figure below
rsaquo Pick the resistances Also verify their resistance by meter and record it in table
rsaquo Solve given circuit for the unknowns before moving to the circuit for measured values
rsaquo Set the DC supply E1=12V and E2=5V
rsaquo Measure the currents through resistances R1 R2 amp R3 and record it in table
rsaquo Also measure voltages across each resistor
rsaquo Now set the DC supply E1=5V and E2=12V
rsaquo Repeat all steps and record the values
Note Use measured values of resistances for all calculations Make these calculations on the space provided
OBSERVATIONS amp CALCULATIONS
EE Department Linear Circuit Analysis
CEME (NUST) Rawalpindi 37
Resistors R1 R2 R3
Rated Values
Measured Values
For E1=12V and E2=5V
Voltages VR1 VR2 VR3
Calculated Values
Measured Values
Percentage
Difference
Currents IR1 IR2 IR3
Calculated Values
Measured Values
EE Department Linear Circuit Analysis
CEME (NUST) Rawalpindi 38
Percentage
Difference
E1=5V and E2=12V
Voltages VR1 VR2 VR3
Calculated Values
Measured Values
Percentage
Difference
Currents IR1 IR2 IR3
Calculated Values
Measured Values
Percentage
Difference
Challenge Swap the resistors R1 with R3 and repeat all above steps to determine unknown
voltages and currents both theoretically and practically
Note Use separate sheets for analysis of above problem
EE Department Linear Circuit Analysis
CEME (NUST) Rawalpindi 39
ANSWER THE FOLLOWING QUESTIONS
(a) What is the difference between a loop and a mesh
(b) What is an ideal voltage source How is it different from real voltage source
(c) What is an ideal current source How is it different from real current source
(d) Solve the following circuit for power dissipation across R1 R2 and R3
(e) What do you meant by a super mesh
Note Use separate sheets for answering above questions
EE Department Linear Circuit Analysis
CEME (NUST) Rawalpindi 40
EXPERIMENT NO ndash 06 THEVENINS THEOREM
(EXPERIMENTAL VERIFICATION OF THEVENINS THEOREM)
OBJECTIVE
- To Verify Thevenin Theorem by finding its Theveninrsquos Equivalent Circuit
THEORY
Any linear circuit is equivalent to a single voltage source (Thevenins Voltage) in series with
single equivalent resistance (Theveninrsquos Equivalent Resistances)
Applying Theveninrsquos Theorem
rsaquo Step 1 Remove the load and find voltage across the open-circuit terminals Vth All the circuit
analysis techniques presented can be used to compute this voltage
rsaquo Step 2 Determine the Thevenin equivalent resistance of the network at the open terminals with
the load removed Three different types of circuits may be encountered in determining the
resistance Rth
- If the circuit contains only independent sources they are made zero by replacing the voltage
sources with short circuits and the current sources with open circuits Rth is then found by
computing the resistance of purely resistive network at the open terminals
- If the circuit contains only dependent sources an independent voltage or current source is
applied at the open terminals and the corresponding current or voltage at these terminals is
measured The VoltageCurrent ratio at the terminals is the Thevenin equivalent resistance Since
there is no energy source the open circuit voltage is zero in this case
- If the circuit contains both the independent and dependent sources the open circuit terminals
are shorted and the short-circuit current between these terminals is determined The ratio of the
open circuit voltage to short circuit current is the resistance Rth
rsaquo Step 3 If the load is now connected to the Thevenin equivalent circuit consisting of Vth in
series with Rth the desired solution can be obtained
APPARATUS
1 DMM
2 Power Supply
3 Resistances (120Ω 1k Ω 390Ω)
PROCEDURE
rsaquo Calculate measured values of resistances
rsaquo Reduce the circuit by calculating the Thevenin equivalent resistance across the terminals A amp
B
rsaquo Calculate the Thevenin equivalent voltage across terminals ldquoArdquo and ldquoBrdquo for 5V 10V 15V
rsaquo Pertaining to circuit in figure III calculate values of IL for different values of RL
rsaquo Now construct circuit in figure I measure the value of Vth by removing RL
EE Department Linear Circuit Analysis
CEME (NUST) Rawalpindi 41
rsaquo Construct circuit in figure II to have measured value of Rth
rsaquo Construct circuit in figure III to determine measured values of IL for different values of RL
Figure-I
Figure-II
Figure-III
OBSERVATIONS amp CALCULATIONS
R1 R2 R3
Vs Vth Rth RL IL
5V 1kΩ
22kΩ
10V 1kΩ
22kΩ
15V 1kΩ
22kΩ
Table Calculated Values
EE Department Linear Circuit Analysis
CEME (NUST) Rawalpindi 42
Vs Vth Rth RL IL
5V 1kΩ
22kΩ
10V 1kΩ
22kΩ
15V 1kΩ
22kΩ
Table Measured Values
Challenge Replacing 1kΩ resistances by 22kΩ and keeping all other things same redo the
above analysis
Note Use separate sheets for analysis of above problem
EE Department Linear Circuit Analysis
CEME (NUST) Rawalpindi 43
ANSWER THE FOLLOWING QUESTIONS
(a) Use Theveninrsquos Theorem to find the current through the 5Ω resistance in the circuit diagram
shown below
(b)What is the importance of Theveninrsquos Theorem in circuit analysis
(c) Discuss the limitations of Theveninrsquos Theorem
(d) A light bulb draws 05A current at the input voltage of 230V Determine the resistance of the
filament and also the power dissipated
Note Use separate sheets for answering above questions
EE Department Linear Circuit Analysis
CEME (NUST) Rawalpindi 44
EXPERIMENT NO ndash 07 MAXIMUM POWER TRANSFER THEOREM
(EXPERIMENTAL VERIFICATION OF MAXIMUM POWER TRANSFER THEOREM FOR A NETWORK)
OBJECTIVE
- To prove maximum power transfer theorem practically
THEORY
The power transferred from a source supply source to load is at its maximum when the resistance
of the load is equal to the internal resistance of the source In other words ldquoA resistive will be
consuming maximum power from the supply when the load resistance is equal to the equivalent
(Thevenin) resistancerdquo
A graph of RL against P is shown in figure below the maximum value of power occurs at RL=
Rth
EE Department Linear Circuit Analysis
CEME (NUST) Rawalpindi 45
APPARATUS
1 DMM
2 Power Supply
3 Resistances fixed (22kΩ 1kΩ) variable (5kΩ)
PROCEDURE
rsaquo Connect the circuit shown in the figure below
rsaquo From the circuit it can be noted that Rth is fixed resistance of value 22kΩ but RL is variable
of value 5kΩ
rsaquo Set the value of Vth = 10 V
rsaquo Change the value of RL in steps as shown in table
rsaquo Measure the voltage VL and current IL and record it in table
rsaquo Plot the graph of power vs load resistance (RL)
rsaquo Using graph estimate P max (practical)
rsaquo Use P max = Vthsup2 4Rth to have the value of P max (theoratical)
rsaquo Repeat above steps by using Rth = 1kΩ
OBSERVATIONS amp CALCULATIONS
PART (I)
For Vth = 10 V Rth = 22kΩ
RL IL VL Power = IL x VL
03kΩ
06kΩ
09kΩ
15kΩ
22kΩ
25kΩ
30kΩ
EE Department Linear Circuit Analysis
CEME (NUST) Rawalpindi 46
33kΩ
36kΩ
40kΩ
P max (theoratical)
P max (practical)
Difference
PART (II)
For Vth = 10V Rth = 1kΩ
RL IL VL Power = IL x VL
03kΩ
06kΩ
09kΩ
15kΩ
22kΩ
25kΩ
30kΩ
33kΩ
36kΩ
40kΩ
EE Department Linear Circuit Analysis
CEME (NUST) Rawalpindi 47
P max (theoratical)
P max (practical)
Difference
Challenge For Rth = 1kΩ +22kΩ estimate maximum power transferred to the circuit
practically Also compare it with theoretical value
Note Use separate sheets for analysis of above problem
EE Department Linear Circuit Analysis
CEME (NUST) Rawalpindi 48
ANSWER THE FOLLOWING QUESTIONS
(a) What is meant by load matching
(b) Find the value of RL for maximum power transfer in the network shown below Also
calculate the maximum power that can be transferred to this load
Note Use separate sheets for answering above questions

EE Department Linear Circuit Analysis
CEME (NUST) Rawalpindi 30
EXPERIMENT NO ndash 04 NODAL ANALYSIS
(EXPERIMENTAL VERIFICATION OF NODAL ANALYSIS)
OBJECTIVE
- To analyze a circuit and to determine the unknown parameters of the circuit
THEORY
Under this method the following procedure is adopted
Assume the voltage of different independent nodes
rsaquo Write the equations for each node as per Kirchhoffrsquos Current Law
rsaquo Solve the above equations to get the node voltages
rsaquo Calculate the branch current from the values of node voltages
Let us consider the circuit shown in the figure below L and M are two
independent nodes M can be taken as a reference node Let the voltage of node L (with respect
to M) be VL
Using Kirchofflsquos Law we get
I1+I2=I3
Ohmrsquos law gives
I1= V1 R1= (E1-VL) R1
I2=V2R2 = (E2-VL) R2
I3 =VL R3
(E1-VL)R1 + (E2-VL)R2= VLR3
Rearranging the terms we get
VL (1R1+1R2+1R3)-E1R1-E2R2=0
EE Department Linear Circuit Analysis
CEME (NUST) Rawalpindi 31
It may be noted that the above nodal equation contains the following terms
rsaquo The node voltage multiplied by the sum of all the conductances connected to that node This
term is positive
rsaquo The node voltage at the other end of each branch (connected to this node) multiplied by the
conductance of the branch These terms are negative
rsaquo In this method of solving a network the no of equations required for the solution is one less
than the no of independent nodes in the network
In general the nodal analysis yields similar solutions
APPARATUS
1 Two DC power supplies
2 Five resistances of different values
3 Connecting wires
4 Digital multi meter (DMM)
PROCEDURE
rsaquo Construct the circuit shown in Figure below
Figure
rsaquo Pick the resistances Also verify their resistance by meter and record it in table
rsaquo Solve given circuit for the unknowns before moving to the circuit for measured values
rsaquo Set the DC supply E1=10V and E2=5V
rsaquo Measure the currents through resistances R1 R2 R3 R4 amp R5 and record it in table
rsaquo Also measure voltages across each resistor
rsaquo Now set the DC supply E1=5V and E2=7V
rsaquo Repeat all steps and record the values
Note Use measured values of resistances for all calculations Make these calculations on the space provided
EE Department Linear Circuit Analysis
CEME (NUST) Rawalpindi 32
OBSERVATIONS amp CALCULATIONS
EE Department Linear Circuit Analysis
CEME (NUST) Rawalpindi 33
Resistors R1 R2 R3 R4 R5
Rated
Values
Measured
Values
For E1=10V and E2=5V
Voltages VR1 VR2 VR3 VR4 VR5
Calculated
Values
Measured
Values
Percentage
Difference
Currents IR1 IR2 IR3 IR4 IR5
Calculated
Values
Measured
Values
Percentage
Difference
E1=5V and E2=7V
Voltages VR1 VR2 VR3 VR4 VR5
Calculated
Values
Measured
Values
Percentage
Difference
Currents IR1 IR2 IR3 IR4 IR5
Calculated
Values
Measured
Values
Percentage
Difference
Challenge Swap the resistors R1 with R4 R5 with R2 and repeat all above steps to determine
unknown voltages and currents both theoretically and practically
Note Use separate sheets for analysis of above problem
EE Department Linear Circuit Analysis
CEME (NUST) Rawalpindi 34
ANSWER THE FOLLOWING QUESTIONS
(a) What is a node
(b) Calculate the equivalent resistance
(c) Solve the following circuit for power dissipation (P=VI) across R1 R2 and R3
(d) What do you meant by a super node
Note Use separate sheets for answering above questions
EE Department Linear Circuit Analysis
CEME (NUST) Rawalpindi 35
EXPERIMENT NO ndash 05 MESH ANALYSIS
(EXPERIMENTAL VERIFICATION OF MESH ANALYSIS)
OBJECTIVE
- To analyze a two Mesh circuit and to determine the current in each branch of the circuit
THEORY
The mesh analysis is a systematic way of applying KVL around each mesh of a circuit and
describes the branch voltages in terms of the mesh currents This will give us a set of equations
that we solve together to find the mesh currents Once we find the mesh currents we can use
them to calculate any other currents or voltages of interest
We know from KVL the algebraic sum of voltages around a close loop is zero so considering the
circuit shown below and applying KVL in each loop (mesh)
While writing equations for
Applying KVL to mesh 1
- E1 + I1R1 + (I1 - I2) R2 = 0
I1 (R1 + R2) - I2R2 = E1 (1)
Applying KVL to mesh 2
- E2 + (I2 - I1) R2 + I2R3 = 0
I2 (R2 + R3) - I1R2 = E2 (2)
Solving above two equations values of unknowns can easily be calculated
=
EE Department Linear Circuit Analysis
CEME (NUST) Rawalpindi 36
APPARATUS
1 Two DC power supplies
2 Three resistances of different values
3 Connecting wires
4 Digital multi meter (DMM)
PROCEDURE
rsaquo Construct the circuit shown in Figure below
rsaquo Pick the resistances Also verify their resistance by meter and record it in table
rsaquo Solve given circuit for the unknowns before moving to the circuit for measured values
rsaquo Set the DC supply E1=12V and E2=5V
rsaquo Measure the currents through resistances R1 R2 amp R3 and record it in table
rsaquo Also measure voltages across each resistor
rsaquo Now set the DC supply E1=5V and E2=12V
rsaquo Repeat all steps and record the values
Note Use measured values of resistances for all calculations Make these calculations on the space provided
OBSERVATIONS amp CALCULATIONS
EE Department Linear Circuit Analysis
CEME (NUST) Rawalpindi 37
Resistors R1 R2 R3
Rated Values
Measured Values
For E1=12V and E2=5V
Voltages VR1 VR2 VR3
Calculated Values
Measured Values
Percentage
Difference
Currents IR1 IR2 IR3
Calculated Values
Measured Values
EE Department Linear Circuit Analysis
CEME (NUST) Rawalpindi 38
Percentage
Difference
E1=5V and E2=12V
Voltages VR1 VR2 VR3
Calculated Values
Measured Values
Percentage
Difference
Currents IR1 IR2 IR3
Calculated Values
Measured Values
Percentage
Difference
Challenge Swap the resistors R1 with R3 and repeat all above steps to determine unknown
voltages and currents both theoretically and practically
Note Use separate sheets for analysis of above problem
EE Department Linear Circuit Analysis
CEME (NUST) Rawalpindi 39
ANSWER THE FOLLOWING QUESTIONS
(a) What is the difference between a loop and a mesh
(b) What is an ideal voltage source How is it different from real voltage source
(c) What is an ideal current source How is it different from real current source
(d) Solve the following circuit for power dissipation across R1 R2 and R3
(e) What do you meant by a super mesh
Note Use separate sheets for answering above questions
EE Department Linear Circuit Analysis
CEME (NUST) Rawalpindi 40
EXPERIMENT NO ndash 06 THEVENINS THEOREM
(EXPERIMENTAL VERIFICATION OF THEVENINS THEOREM)
OBJECTIVE
- To Verify Thevenin Theorem by finding its Theveninrsquos Equivalent Circuit
THEORY
Any linear circuit is equivalent to a single voltage source (Thevenins Voltage) in series with
single equivalent resistance (Theveninrsquos Equivalent Resistances)
Applying Theveninrsquos Theorem
rsaquo Step 1 Remove the load and find voltage across the open-circuit terminals Vth All the circuit
analysis techniques presented can be used to compute this voltage
rsaquo Step 2 Determine the Thevenin equivalent resistance of the network at the open terminals with
the load removed Three different types of circuits may be encountered in determining the
resistance Rth
- If the circuit contains only independent sources they are made zero by replacing the voltage
sources with short circuits and the current sources with open circuits Rth is then found by
computing the resistance of purely resistive network at the open terminals
- If the circuit contains only dependent sources an independent voltage or current source is
applied at the open terminals and the corresponding current or voltage at these terminals is
measured The VoltageCurrent ratio at the terminals is the Thevenin equivalent resistance Since
there is no energy source the open circuit voltage is zero in this case
- If the circuit contains both the independent and dependent sources the open circuit terminals
are shorted and the short-circuit current between these terminals is determined The ratio of the
open circuit voltage to short circuit current is the resistance Rth
rsaquo Step 3 If the load is now connected to the Thevenin equivalent circuit consisting of Vth in
series with Rth the desired solution can be obtained
APPARATUS
1 DMM
2 Power Supply
3 Resistances (120Ω 1k Ω 390Ω)
PROCEDURE
rsaquo Calculate measured values of resistances
rsaquo Reduce the circuit by calculating the Thevenin equivalent resistance across the terminals A amp
B
rsaquo Calculate the Thevenin equivalent voltage across terminals ldquoArdquo and ldquoBrdquo for 5V 10V 15V
rsaquo Pertaining to circuit in figure III calculate values of IL for different values of RL
rsaquo Now construct circuit in figure I measure the value of Vth by removing RL
EE Department Linear Circuit Analysis
CEME (NUST) Rawalpindi 41
rsaquo Construct circuit in figure II to have measured value of Rth
rsaquo Construct circuit in figure III to determine measured values of IL for different values of RL
Figure-I
Figure-II
Figure-III
OBSERVATIONS amp CALCULATIONS
R1 R2 R3
Vs Vth Rth RL IL
5V 1kΩ
22kΩ
10V 1kΩ
22kΩ
15V 1kΩ
22kΩ
Table Calculated Values
EE Department Linear Circuit Analysis
CEME (NUST) Rawalpindi 42
Vs Vth Rth RL IL
5V 1kΩ
22kΩ
10V 1kΩ
22kΩ
15V 1kΩ
22kΩ
Table Measured Values
Challenge Replacing 1kΩ resistances by 22kΩ and keeping all other things same redo the
above analysis
Note Use separate sheets for analysis of above problem
EE Department Linear Circuit Analysis
CEME (NUST) Rawalpindi 43
ANSWER THE FOLLOWING QUESTIONS
(a) Use Theveninrsquos Theorem to find the current through the 5Ω resistance in the circuit diagram
shown below
(b)What is the importance of Theveninrsquos Theorem in circuit analysis
(c) Discuss the limitations of Theveninrsquos Theorem
(d) A light bulb draws 05A current at the input voltage of 230V Determine the resistance of the
filament and also the power dissipated
Note Use separate sheets for answering above questions
EE Department Linear Circuit Analysis
CEME (NUST) Rawalpindi 44
EXPERIMENT NO ndash 07 MAXIMUM POWER TRANSFER THEOREM
(EXPERIMENTAL VERIFICATION OF MAXIMUM POWER TRANSFER THEOREM FOR A NETWORK)
OBJECTIVE
- To prove maximum power transfer theorem practically
THEORY
The power transferred from a source supply source to load is at its maximum when the resistance
of the load is equal to the internal resistance of the source In other words ldquoA resistive will be
consuming maximum power from the supply when the load resistance is equal to the equivalent
(Thevenin) resistancerdquo
A graph of RL against P is shown in figure below the maximum value of power occurs at RL=
Rth
EE Department Linear Circuit Analysis
CEME (NUST) Rawalpindi 45
APPARATUS
1 DMM
2 Power Supply
3 Resistances fixed (22kΩ 1kΩ) variable (5kΩ)
PROCEDURE
rsaquo Connect the circuit shown in the figure below
rsaquo From the circuit it can be noted that Rth is fixed resistance of value 22kΩ but RL is variable
of value 5kΩ
rsaquo Set the value of Vth = 10 V
rsaquo Change the value of RL in steps as shown in table
rsaquo Measure the voltage VL and current IL and record it in table
rsaquo Plot the graph of power vs load resistance (RL)
rsaquo Using graph estimate P max (practical)
rsaquo Use P max = Vthsup2 4Rth to have the value of P max (theoratical)
rsaquo Repeat above steps by using Rth = 1kΩ
OBSERVATIONS amp CALCULATIONS
PART (I)
For Vth = 10 V Rth = 22kΩ
RL IL VL Power = IL x VL
03kΩ
06kΩ
09kΩ
15kΩ
22kΩ
25kΩ
30kΩ
EE Department Linear Circuit Analysis
CEME (NUST) Rawalpindi 46
33kΩ
36kΩ
40kΩ
P max (theoratical)
P max (practical)
Difference
PART (II)
For Vth = 10V Rth = 1kΩ
RL IL VL Power = IL x VL
03kΩ
06kΩ
09kΩ
15kΩ
22kΩ
25kΩ
30kΩ
33kΩ
36kΩ
40kΩ
EE Department Linear Circuit Analysis
CEME (NUST) Rawalpindi 47
P max (theoratical)
P max (practical)
Difference
Challenge For Rth = 1kΩ +22kΩ estimate maximum power transferred to the circuit
practically Also compare it with theoretical value
Note Use separate sheets for analysis of above problem
EE Department Linear Circuit Analysis
CEME (NUST) Rawalpindi 48
ANSWER THE FOLLOWING QUESTIONS
(a) What is meant by load matching
(b) Find the value of RL for maximum power transfer in the network shown below Also
calculate the maximum power that can be transferred to this load
Note Use separate sheets for answering above questions
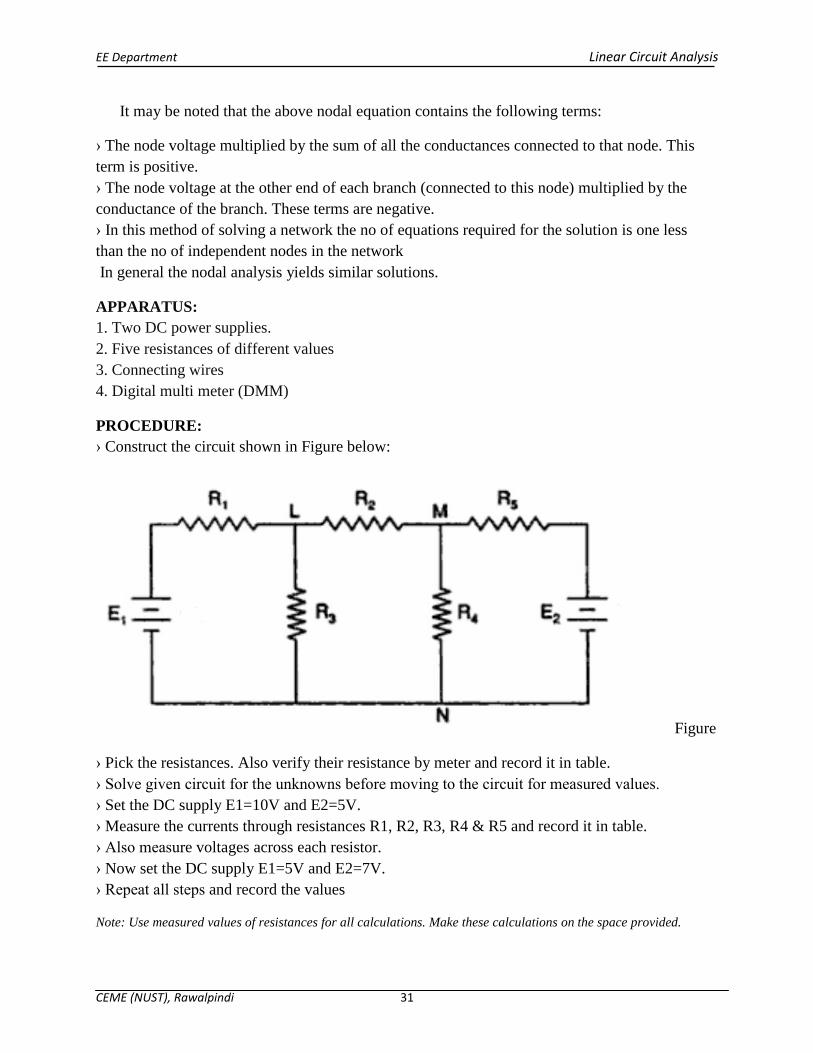
EE Department Linear Circuit Analysis
CEME (NUST) Rawalpindi 34
ANSWER THE FOLLOWING QUESTIONS
(a) What is a node
(b) Calculate the equivalent resistance
(c) Solve the following circuit for power dissipation (P=VI) across R1 R2 and R3
(d) What do you meant by a super node
Note Use separate sheets for answering above questions
EE Department Linear Circuit Analysis
CEME (NUST) Rawalpindi 35
EXPERIMENT NO ndash 05 MESH ANALYSIS
(EXPERIMENTAL VERIFICATION OF MESH ANALYSIS)
OBJECTIVE
- To analyze a two Mesh circuit and to determine the current in each branch of the circuit
THEORY
The mesh analysis is a systematic way of applying KVL around each mesh of a circuit and
describes the branch voltages in terms of the mesh currents This will give us a set of equations
that we solve together to find the mesh currents Once we find the mesh currents we can use
them to calculate any other currents or voltages of interest
We know from KVL the algebraic sum of voltages around a close loop is zero so considering the
circuit shown below and applying KVL in each loop (mesh)
While writing equations for
Applying KVL to mesh 1
- E1 + I1R1 + (I1 - I2) R2 = 0
I1 (R1 + R2) - I2R2 = E1 (1)
Applying KVL to mesh 2
- E2 + (I2 - I1) R2 + I2R3 = 0
I2 (R2 + R3) - I1R2 = E2 (2)
Solving above two equations values of unknowns can easily be calculated
=
EE Department Linear Circuit Analysis
CEME (NUST) Rawalpindi 36
APPARATUS
1 Two DC power supplies
2 Three resistances of different values
3 Connecting wires
4 Digital multi meter (DMM)
PROCEDURE
rsaquo Construct the circuit shown in Figure below
rsaquo Pick the resistances Also verify their resistance by meter and record it in table
rsaquo Solve given circuit for the unknowns before moving to the circuit for measured values
rsaquo Set the DC supply E1=12V and E2=5V
rsaquo Measure the currents through resistances R1 R2 amp R3 and record it in table
rsaquo Also measure voltages across each resistor
rsaquo Now set the DC supply E1=5V and E2=12V
rsaquo Repeat all steps and record the values
Note Use measured values of resistances for all calculations Make these calculations on the space provided
OBSERVATIONS amp CALCULATIONS
EE Department Linear Circuit Analysis
CEME (NUST) Rawalpindi 37
Resistors R1 R2 R3
Rated Values
Measured Values
For E1=12V and E2=5V
Voltages VR1 VR2 VR3
Calculated Values
Measured Values
Percentage
Difference
Currents IR1 IR2 IR3
Calculated Values
Measured Values
EE Department Linear Circuit Analysis
CEME (NUST) Rawalpindi 38
Percentage
Difference
E1=5V and E2=12V
Voltages VR1 VR2 VR3
Calculated Values
Measured Values
Percentage
Difference
Currents IR1 IR2 IR3
Calculated Values
Measured Values
Percentage
Difference
Challenge Swap the resistors R1 with R3 and repeat all above steps to determine unknown
voltages and currents both theoretically and practically
Note Use separate sheets for analysis of above problem
EE Department Linear Circuit Analysis
CEME (NUST) Rawalpindi 39
ANSWER THE FOLLOWING QUESTIONS
(a) What is the difference between a loop and a mesh
(b) What is an ideal voltage source How is it different from real voltage source
(c) What is an ideal current source How is it different from real current source
(d) Solve the following circuit for power dissipation across R1 R2 and R3
(e) What do you meant by a super mesh
Note Use separate sheets for answering above questions
EE Department Linear Circuit Analysis
CEME (NUST) Rawalpindi 40
EXPERIMENT NO ndash 06 THEVENINS THEOREM
(EXPERIMENTAL VERIFICATION OF THEVENINS THEOREM)
OBJECTIVE
- To Verify Thevenin Theorem by finding its Theveninrsquos Equivalent Circuit
THEORY
Any linear circuit is equivalent to a single voltage source (Thevenins Voltage) in series with
single equivalent resistance (Theveninrsquos Equivalent Resistances)
Applying Theveninrsquos Theorem
rsaquo Step 1 Remove the load and find voltage across the open-circuit terminals Vth All the circuit
analysis techniques presented can be used to compute this voltage
rsaquo Step 2 Determine the Thevenin equivalent resistance of the network at the open terminals with
the load removed Three different types of circuits may be encountered in determining the
resistance Rth
- If the circuit contains only independent sources they are made zero by replacing the voltage
sources with short circuits and the current sources with open circuits Rth is then found by
computing the resistance of purely resistive network at the open terminals
- If the circuit contains only dependent sources an independent voltage or current source is
applied at the open terminals and the corresponding current or voltage at these terminals is
measured The VoltageCurrent ratio at the terminals is the Thevenin equivalent resistance Since
there is no energy source the open circuit voltage is zero in this case
- If the circuit contains both the independent and dependent sources the open circuit terminals
are shorted and the short-circuit current between these terminals is determined The ratio of the
open circuit voltage to short circuit current is the resistance Rth
rsaquo Step 3 If the load is now connected to the Thevenin equivalent circuit consisting of Vth in
series with Rth the desired solution can be obtained
APPARATUS
1 DMM
2 Power Supply
3 Resistances (120Ω 1k Ω 390Ω)
PROCEDURE
rsaquo Calculate measured values of resistances
rsaquo Reduce the circuit by calculating the Thevenin equivalent resistance across the terminals A amp
B
rsaquo Calculate the Thevenin equivalent voltage across terminals ldquoArdquo and ldquoBrdquo for 5V 10V 15V
rsaquo Pertaining to circuit in figure III calculate values of IL for different values of RL
rsaquo Now construct circuit in figure I measure the value of Vth by removing RL
EE Department Linear Circuit Analysis
CEME (NUST) Rawalpindi 41
rsaquo Construct circuit in figure II to have measured value of Rth
rsaquo Construct circuit in figure III to determine measured values of IL for different values of RL
Figure-I
Figure-II
Figure-III
OBSERVATIONS amp CALCULATIONS
R1 R2 R3
Vs Vth Rth RL IL
5V 1kΩ
22kΩ
10V 1kΩ
22kΩ
15V 1kΩ
22kΩ
Table Calculated Values
EE Department Linear Circuit Analysis
CEME (NUST) Rawalpindi 42
Vs Vth Rth RL IL
5V 1kΩ
22kΩ
10V 1kΩ
22kΩ
15V 1kΩ
22kΩ
Table Measured Values
Challenge Replacing 1kΩ resistances by 22kΩ and keeping all other things same redo the
above analysis
Note Use separate sheets for analysis of above problem
EE Department Linear Circuit Analysis
CEME (NUST) Rawalpindi 43
ANSWER THE FOLLOWING QUESTIONS
(a) Use Theveninrsquos Theorem to find the current through the 5Ω resistance in the circuit diagram
shown below
(b)What is the importance of Theveninrsquos Theorem in circuit analysis
(c) Discuss the limitations of Theveninrsquos Theorem
(d) A light bulb draws 05A current at the input voltage of 230V Determine the resistance of the
filament and also the power dissipated
Note Use separate sheets for answering above questions
EE Department Linear Circuit Analysis
CEME (NUST) Rawalpindi 44
EXPERIMENT NO ndash 07 MAXIMUM POWER TRANSFER THEOREM
(EXPERIMENTAL VERIFICATION OF MAXIMUM POWER TRANSFER THEOREM FOR A NETWORK)
OBJECTIVE
- To prove maximum power transfer theorem practically
THEORY
The power transferred from a source supply source to load is at its maximum when the resistance
of the load is equal to the internal resistance of the source In other words ldquoA resistive will be
consuming maximum power from the supply when the load resistance is equal to the equivalent
(Thevenin) resistancerdquo
A graph of RL against P is shown in figure below the maximum value of power occurs at RL=
Rth
EE Department Linear Circuit Analysis
CEME (NUST) Rawalpindi 45
APPARATUS
1 DMM
2 Power Supply
3 Resistances fixed (22kΩ 1kΩ) variable (5kΩ)
PROCEDURE
rsaquo Connect the circuit shown in the figure below
rsaquo From the circuit it can be noted that Rth is fixed resistance of value 22kΩ but RL is variable
of value 5kΩ
rsaquo Set the value of Vth = 10 V
rsaquo Change the value of RL in steps as shown in table
rsaquo Measure the voltage VL and current IL and record it in table
rsaquo Plot the graph of power vs load resistance (RL)
rsaquo Using graph estimate P max (practical)
rsaquo Use P max = Vthsup2 4Rth to have the value of P max (theoratical)
rsaquo Repeat above steps by using Rth = 1kΩ
OBSERVATIONS amp CALCULATIONS
PART (I)
For Vth = 10 V Rth = 22kΩ
RL IL VL Power = IL x VL
03kΩ
06kΩ
09kΩ
15kΩ
22kΩ
25kΩ
30kΩ
EE Department Linear Circuit Analysis
CEME (NUST) Rawalpindi 46
33kΩ
36kΩ
40kΩ
P max (theoratical)
P max (practical)
Difference
PART (II)
For Vth = 10V Rth = 1kΩ
RL IL VL Power = IL x VL
03kΩ
06kΩ
09kΩ
15kΩ
22kΩ
25kΩ
30kΩ
33kΩ
36kΩ
40kΩ
EE Department Linear Circuit Analysis
CEME (NUST) Rawalpindi 47
P max (theoratical)
P max (practical)
Difference
Challenge For Rth = 1kΩ +22kΩ estimate maximum power transferred to the circuit
practically Also compare it with theoretical value
Note Use separate sheets for analysis of above problem
EE Department Linear Circuit Analysis
CEME (NUST) Rawalpindi 48
ANSWER THE FOLLOWING QUESTIONS
(a) What is meant by load matching
(b) Find the value of RL for maximum power transfer in the network shown below Also
calculate the maximum power that can be transferred to this load
Note Use separate sheets for answering above questions
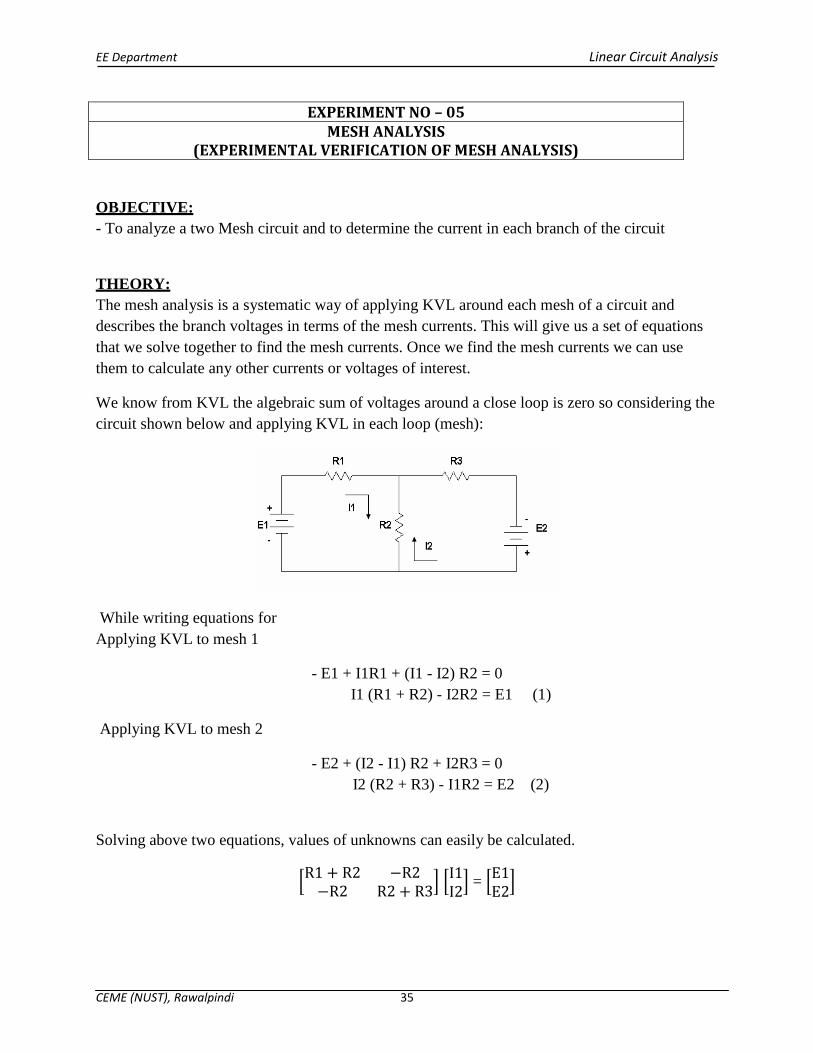
EE Department Linear Circuit Analysis
CEME (NUST) Rawalpindi 36
APPARATUS
1 Two DC power supplies
2 Three resistances of different values
3 Connecting wires
4 Digital multi meter (DMM)
PROCEDURE
rsaquo Construct the circuit shown in Figure below
rsaquo Pick the resistances Also verify their resistance by meter and record it in table
rsaquo Solve given circuit for the unknowns before moving to the circuit for measured values
rsaquo Set the DC supply E1=12V and E2=5V
rsaquo Measure the currents through resistances R1 R2 amp R3 and record it in table
rsaquo Also measure voltages across each resistor
rsaquo Now set the DC supply E1=5V and E2=12V
rsaquo Repeat all steps and record the values
Note Use measured values of resistances for all calculations Make these calculations on the space provided
OBSERVATIONS amp CALCULATIONS
EE Department Linear Circuit Analysis
CEME (NUST) Rawalpindi 37
Resistors R1 R2 R3
Rated Values
Measured Values
For E1=12V and E2=5V
Voltages VR1 VR2 VR3
Calculated Values
Measured Values
Percentage
Difference
Currents IR1 IR2 IR3
Calculated Values
Measured Values
EE Department Linear Circuit Analysis
CEME (NUST) Rawalpindi 38
Percentage
Difference
E1=5V and E2=12V
Voltages VR1 VR2 VR3
Calculated Values
Measured Values
Percentage
Difference
Currents IR1 IR2 IR3
Calculated Values
Measured Values
Percentage
Difference
Challenge Swap the resistors R1 with R3 and repeat all above steps to determine unknown
voltages and currents both theoretically and practically
Note Use separate sheets for analysis of above problem
EE Department Linear Circuit Analysis
CEME (NUST) Rawalpindi 39
ANSWER THE FOLLOWING QUESTIONS
(a) What is the difference between a loop and a mesh
(b) What is an ideal voltage source How is it different from real voltage source
(c) What is an ideal current source How is it different from real current source
(d) Solve the following circuit for power dissipation across R1 R2 and R3
(e) What do you meant by a super mesh
Note Use separate sheets for answering above questions
EE Department Linear Circuit Analysis
CEME (NUST) Rawalpindi 40
EXPERIMENT NO ndash 06 THEVENINS THEOREM
(EXPERIMENTAL VERIFICATION OF THEVENINS THEOREM)
OBJECTIVE
- To Verify Thevenin Theorem by finding its Theveninrsquos Equivalent Circuit
THEORY
Any linear circuit is equivalent to a single voltage source (Thevenins Voltage) in series with
single equivalent resistance (Theveninrsquos Equivalent Resistances)
Applying Theveninrsquos Theorem
rsaquo Step 1 Remove the load and find voltage across the open-circuit terminals Vth All the circuit
analysis techniques presented can be used to compute this voltage
rsaquo Step 2 Determine the Thevenin equivalent resistance of the network at the open terminals with
the load removed Three different types of circuits may be encountered in determining the
resistance Rth
- If the circuit contains only independent sources they are made zero by replacing the voltage
sources with short circuits and the current sources with open circuits Rth is then found by
computing the resistance of purely resistive network at the open terminals
- If the circuit contains only dependent sources an independent voltage or current source is
applied at the open terminals and the corresponding current or voltage at these terminals is
measured The VoltageCurrent ratio at the terminals is the Thevenin equivalent resistance Since
there is no energy source the open circuit voltage is zero in this case
- If the circuit contains both the independent and dependent sources the open circuit terminals
are shorted and the short-circuit current between these terminals is determined The ratio of the
open circuit voltage to short circuit current is the resistance Rth
rsaquo Step 3 If the load is now connected to the Thevenin equivalent circuit consisting of Vth in
series with Rth the desired solution can be obtained
APPARATUS
1 DMM
2 Power Supply
3 Resistances (120Ω 1k Ω 390Ω)
PROCEDURE
rsaquo Calculate measured values of resistances
rsaquo Reduce the circuit by calculating the Thevenin equivalent resistance across the terminals A amp
B
rsaquo Calculate the Thevenin equivalent voltage across terminals ldquoArdquo and ldquoBrdquo for 5V 10V 15V
rsaquo Pertaining to circuit in figure III calculate values of IL for different values of RL
rsaquo Now construct circuit in figure I measure the value of Vth by removing RL
EE Department Linear Circuit Analysis
CEME (NUST) Rawalpindi 41
rsaquo Construct circuit in figure II to have measured value of Rth
rsaquo Construct circuit in figure III to determine measured values of IL for different values of RL
Figure-I
Figure-II
Figure-III
OBSERVATIONS amp CALCULATIONS
R1 R2 R3
Vs Vth Rth RL IL
5V 1kΩ
22kΩ
10V 1kΩ
22kΩ
15V 1kΩ
22kΩ
Table Calculated Values
EE Department Linear Circuit Analysis
CEME (NUST) Rawalpindi 42
Vs Vth Rth RL IL
5V 1kΩ
22kΩ
10V 1kΩ
22kΩ
15V 1kΩ
22kΩ
Table Measured Values
Challenge Replacing 1kΩ resistances by 22kΩ and keeping all other things same redo the
above analysis
Note Use separate sheets for analysis of above problem
EE Department Linear Circuit Analysis
CEME (NUST) Rawalpindi 43
ANSWER THE FOLLOWING QUESTIONS
(a) Use Theveninrsquos Theorem to find the current through the 5Ω resistance in the circuit diagram
shown below
(b)What is the importance of Theveninrsquos Theorem in circuit analysis
(c) Discuss the limitations of Theveninrsquos Theorem
(d) A light bulb draws 05A current at the input voltage of 230V Determine the resistance of the
filament and also the power dissipated
Note Use separate sheets for answering above questions
EE Department Linear Circuit Analysis
CEME (NUST) Rawalpindi 44
EXPERIMENT NO ndash 07 MAXIMUM POWER TRANSFER THEOREM
(EXPERIMENTAL VERIFICATION OF MAXIMUM POWER TRANSFER THEOREM FOR A NETWORK)
OBJECTIVE
- To prove maximum power transfer theorem practically
THEORY
The power transferred from a source supply source to load is at its maximum when the resistance
of the load is equal to the internal resistance of the source In other words ldquoA resistive will be
consuming maximum power from the supply when the load resistance is equal to the equivalent
(Thevenin) resistancerdquo
A graph of RL against P is shown in figure below the maximum value of power occurs at RL=
Rth
EE Department Linear Circuit Analysis
CEME (NUST) Rawalpindi 45
APPARATUS
1 DMM
2 Power Supply
3 Resistances fixed (22kΩ 1kΩ) variable (5kΩ)
PROCEDURE
rsaquo Connect the circuit shown in the figure below
rsaquo From the circuit it can be noted that Rth is fixed resistance of value 22kΩ but RL is variable
of value 5kΩ
rsaquo Set the value of Vth = 10 V
rsaquo Change the value of RL in steps as shown in table
rsaquo Measure the voltage VL and current IL and record it in table
rsaquo Plot the graph of power vs load resistance (RL)
rsaquo Using graph estimate P max (practical)
rsaquo Use P max = Vthsup2 4Rth to have the value of P max (theoratical)
rsaquo Repeat above steps by using Rth = 1kΩ
OBSERVATIONS amp CALCULATIONS
PART (I)
For Vth = 10 V Rth = 22kΩ
RL IL VL Power = IL x VL
03kΩ
06kΩ
09kΩ
15kΩ
22kΩ
25kΩ
30kΩ
EE Department Linear Circuit Analysis
CEME (NUST) Rawalpindi 46
33kΩ
36kΩ
40kΩ
P max (theoratical)
P max (practical)
Difference
PART (II)
For Vth = 10V Rth = 1kΩ
RL IL VL Power = IL x VL
03kΩ
06kΩ
09kΩ
15kΩ
22kΩ
25kΩ
30kΩ
33kΩ
36kΩ
40kΩ
EE Department Linear Circuit Analysis
CEME (NUST) Rawalpindi 47
P max (theoratical)
P max (practical)
Difference
Challenge For Rth = 1kΩ +22kΩ estimate maximum power transferred to the circuit
practically Also compare it with theoretical value
Note Use separate sheets for analysis of above problem
EE Department Linear Circuit Analysis
CEME (NUST) Rawalpindi 48
ANSWER THE FOLLOWING QUESTIONS
(a) What is meant by load matching
(b) Find the value of RL for maximum power transfer in the network shown below Also
calculate the maximum power that can be transferred to this load
Note Use separate sheets for answering above questions
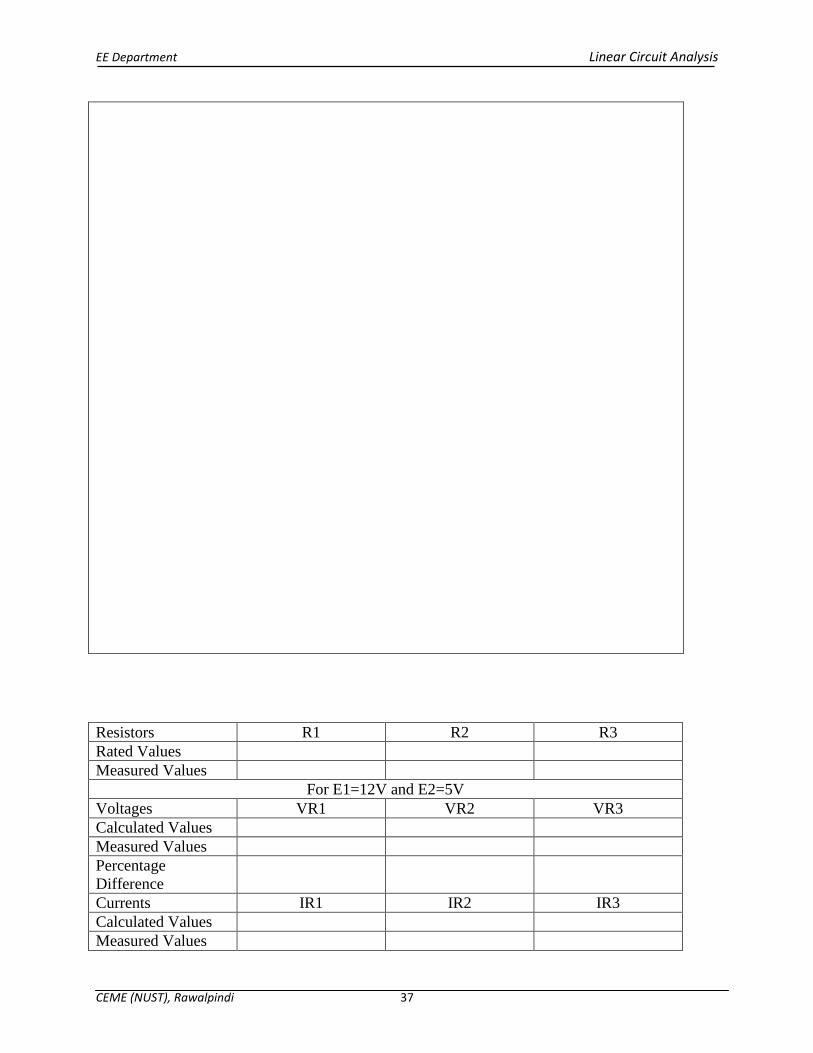
EE Department Linear Circuit Analysis
CEME (NUST) Rawalpindi 47
P max (theoratical)
P max (practical)
Difference
Challenge For Rth = 1kΩ +22kΩ estimate maximum power transferred to the circuit
practically Also compare it with theoretical value
Note Use separate sheets for analysis of above problem
EE Department Linear Circuit Analysis
CEME (NUST) Rawalpindi 48
ANSWER THE FOLLOWING QUESTIONS
(a) What is meant by load matching
(b) Find the value of RL for maximum power transfer in the network shown below Also
calculate the maximum power that can be transferred to this load
Note Use separate sheets for answering above questions
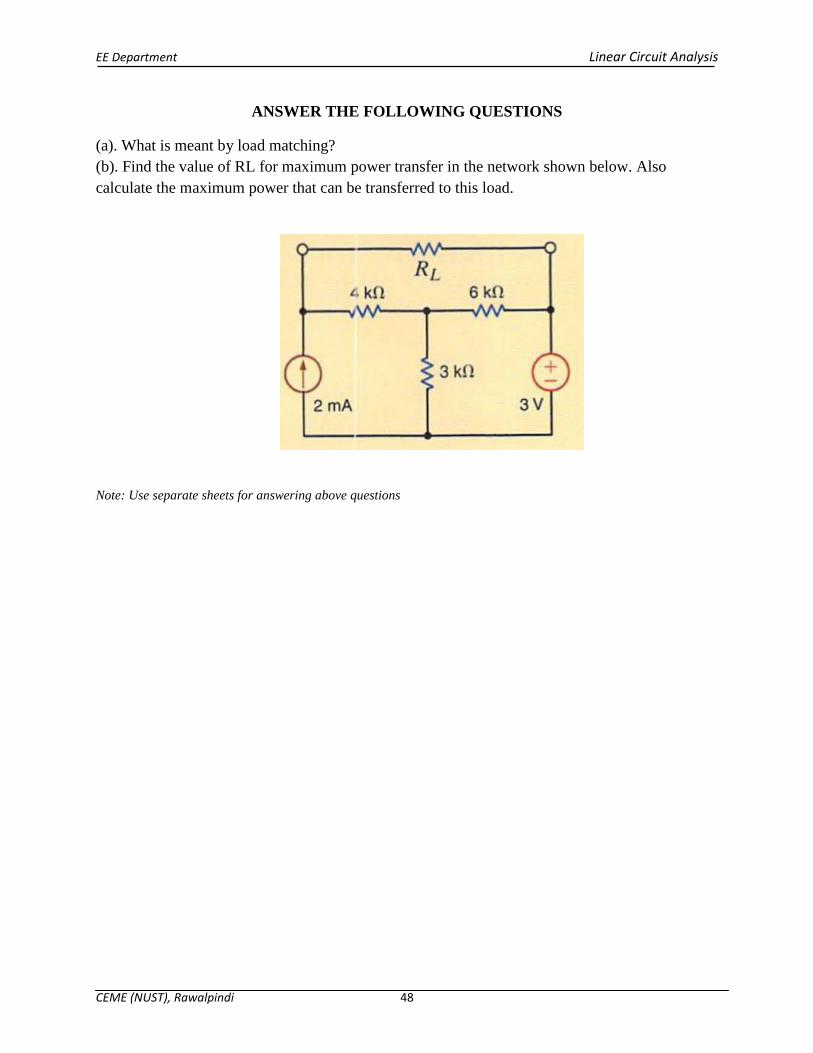
EE Department Linear Circuit Analysis
CEME (NUST) Rawalpindi 48
ANSWER THE FOLLOWING QUESTIONS
(a) What is meant by load matching
(b) Find the value of RL for maximum power transfer in the network shown below Also
calculate the maximum power that can be transferred to this load
Note Use separate sheets for answering above questions