CDMA Technology OverviewFebruary, 2001 - Page 1-1 CDMA Technology Overview Lesson 1 – CDMA Basics.
ADS Fundamentals – 2009
LAB 9: Final System and Circuit Simulations
Overview–Thislastlabexercisebringstogetherallthecircuitsbuiltduringthecourse:theamplifierandfilters.Theyreplacethebehavioralsystemmodelsusedintheearlierexercise.
OBJECTIVES • Createasub‐circuitforthe1900MHzamplifierforuseinthesystem.
• UsetheSmartSimulationWizard.
• SetupandrunaCEsimulationusingaCDMAsource.
• SimulateACPRandpowerspecsusinganexampledatadisplay.
• ProgramMarkersliderstocustomizedatadisplays.
• OPTIONAL‐Co‐simulationswithminimalinstructions.
©CopyrightAgilentTechnologies2009

Lab 9: Final System and Circuit Simulation
9‐2©CopyrightAgilentTechnologies2009
TABLE OF CONTENTS
1. Create the final AMP_1900 sub-circuit for the library...........................................3
2. Simulate AMP_1900 with the Smart Simulation Wizard. .....................................4
3. Create the final HB swept LO schematic and equations......................................6
4. Final HB simulation: 2 tones with swept LO power and noise. ............................8
5. Plot the data: NF, Conv Gain, dbm_out, and IF_gain. .......................................10
6. Final Envelope simulation: CDMA source. .........................................................11
7. Use an Example DDS to plot ACPR and Power for your circuit.........................13
8. Plot the spectrum using a programmed marker slider. ......................................14
9. CDMA Envelope Simulation with Frequency Sweep .........................................17
10. OPTIONAL - Co-simulation of the behavioral RF system..................................22

Lab 9: Final System and Circuit Simulation
9‐3©CopyrightAgilentTechnologies
2009
PROCEDURE
1. CreatethefinalAMP_1900subcircuitforthelibrary.
a. Savethelastamplifiercircuitenvelopedesign(ckt_env_gsm)as:AMP_1900.Thisschematicwillbecomethefinalamplifierdesigntobeusedinyoursystemprojectyoucreatedearlierinthecourse.
b. Asshownhere,deleteallsimulationcomponents,variables,source,etc.SetVdc=5V.SetFile>DesignParametersforComponentInstanceName:AMP_1900andSymbolName:SYM_Amplifier.Also,putportconnectors1and2ontheinputandoutput.CheckthecircuitandthensaveandclosetheAMP_1900design.
c. GototheADSMainwindowandopen/changetothesystem_prj.Thisiswhereyouhavetherf_sysdesignandthefilters.
d. Insystem_prjopenanewschematicwindow.ThenclickFile>CopyDesign.AsshownforFromDesign,clickBrowseandclicktotheamp_1900project/networksandselectAMP_1900.IntheToPath,clickWorkingDirectoryandclickOK‐thefileanditshierarchy(bjt_pkg)willbecopiedintoyoursystemproject.
Copyingfromadifferentproject.
File>DesignParameters/GeneralTab
Lab 9: Final System and Circuit Simulation
9‐4©CopyrightAgilentTechnologies2009
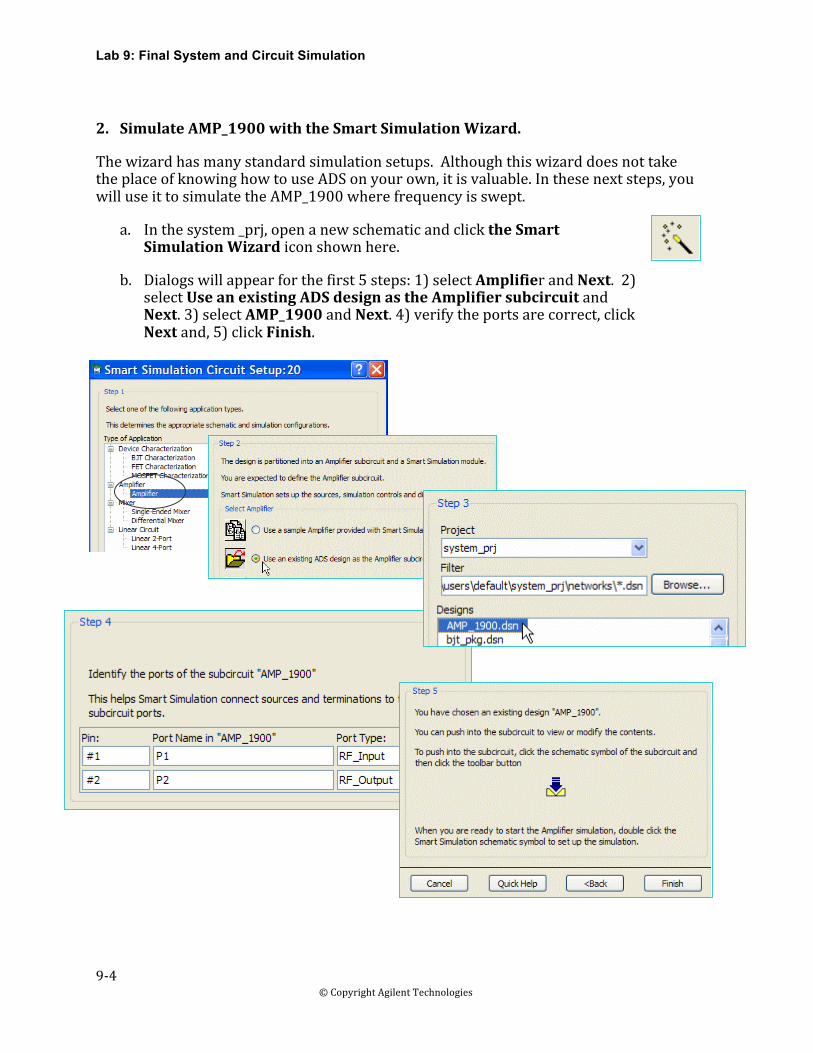
2. SimulateAMP_1900withtheSmartSimulationWizard.
Thewizardhasmanystandardsimulationsetups.AlthoughthiswizarddoesnottaketheplaceofknowinghowtouseADSonyourown,itisvaluable.Inthesenextsteps,youwilluseittosimulatetheAMP_1900wherefrequencyisswept.
a. Inthesystem_prj,openanewschematicandclicktheSmartSimulationWizardiconshownhere.
b. Dialogswillappearforthefirst5steps:1)selectAmplifierandNext.2)selectUseanexistingADSdesignastheAmplifiersubcircuitandNext.3)selectAMP_1900andNext.4)verifytheportsarecorrect,clickNextand,5)clickFinish.

Lab 9: Final System and Circuit Simulation
9‐5©CopyrightAgilentTechnologies
2009
c. Intheschematic,doubleclickthesimulationsetupdrawingthatlookslikeaNWAshownhere.
d. Whenthedialogappears,intheSimulationSelectiontab,selecttheNonlinear1‐ToneSpectrum,Gain,HarmonicDistortionvsFreqandclickthearrowtoadditasshownhere.
e. IntheSimulationSettingstab,settheRFfrequencyto1.9GHzandthesweepfrom1to3GHzin0.1GHzstepsasshown.Also,clicktheRFInputPowerandsetitto–40dBm‐andthebiassourcesto0V.
f. ClicktheSimulatebuttonandwhenwhenfinished,clickDisplayResults.Results.
Lab 9: Final System and Circuit Simulation
9‐6©CopyrightAgilentTechnologies2009
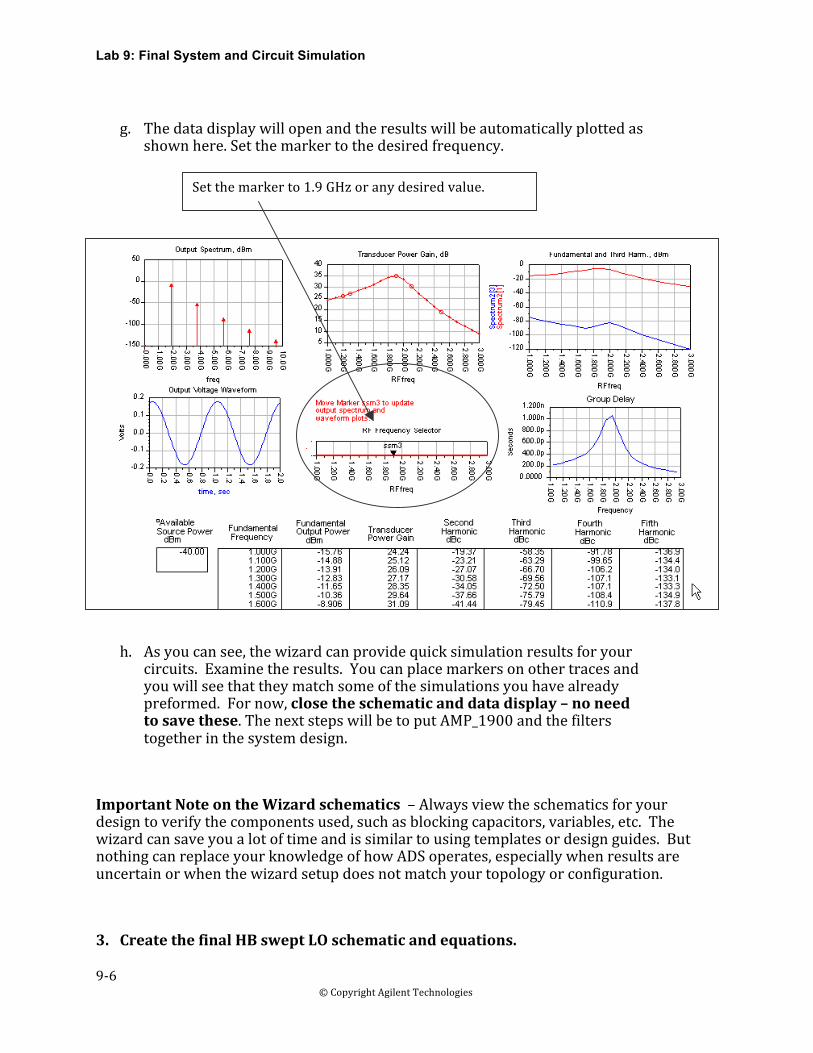
g. Thedatadisplaywillopenandtheresultswillbeautomaticallyplottedasshownhere.Setthemarkertothedesiredfrequency.
h. Asyoucansee,thewizardcanprovidequicksimulationresultsforyourcircuits.Examinetheresults.Youcanplacemarkersonothertracesandyouwillseethattheymatchsomeofthesimulationsyouhavealreadypreformed.Fornow,closetheschematicanddatadisplay–noneedtosavethese.ThenextstepswillbetoputAMP_1900andthefilterstogetherinthesystemdesign.
ImportantNoteontheWizardschematics–Alwaysviewtheschematicsforyourdesigntoverifythecomponentsused,suchasblockingcapacitors,variables,etc.Thewizardcansaveyoualotoftimeandissimilartousingtemplatesordesignguides.ButnothingcanreplaceyourknowledgeofhowADSoperates,especiallywhenresultsareuncertainorwhenthewizardsetupdoesnotmatchyourtopologyorconfiguration.
3. CreatethefinalHBsweptLOschematicandequations.
Setthemarkerto1.9GHzoranydesiredvalue.

Lab 9: Final System and Circuit Simulation
9‐7©CopyrightAgilentTechnologies
2009
a. Opentheexistingsystem_prjdesign:rf_sys.dsn.Now,saveitwithanewname:final_hb_lo_swp.Modifythedesignbyreplacingtheexistingfiltersandamplifierwithyourdesignsasshownhere.Step‐by‐stepinstructionsfollow,ortrysettingitupbyreferringtothisdrawing:
b. Fromthelibrary,replacethebehavioralfilterbehavioralfilterwith:filter_1900.ThenThenreplacetheLPF_BesselwiththeDesignDesignGuidefilter:DA_LCLowpass.PushintoPushintothemtoverifythecircuits.
NOTEonDTcomponenttext–Theparameters(Fp,Fs,etc.)mayappearasdefaultvalues.ThisisOK–donotchangethem.
c. Alsofromthelibrary,replacethesystemampwithyourAMP_1900andpushintoittocheckitalso.
d. SetuptwoP_1TonesourcesfortheRFandLOasshownhere.BesureNum=,P=,andFreq=aresetwithvariablesasshown.
e. OntheMixer,setthePminspec:PminLO=5forastarvationeffect(mixerdiodesnotresponding).Conversiongainis3dBandS11,22,33areallsettozerosasshown.Nootherparametersarenecessary.
f. SetupVARsforRFandLOFreqandPwrasshownhere.Also,setVinandVoutnodelabels.
Lab 9: Final System and Circuit Simulation
9‐8©CopyrightAgilentTechnologies2009
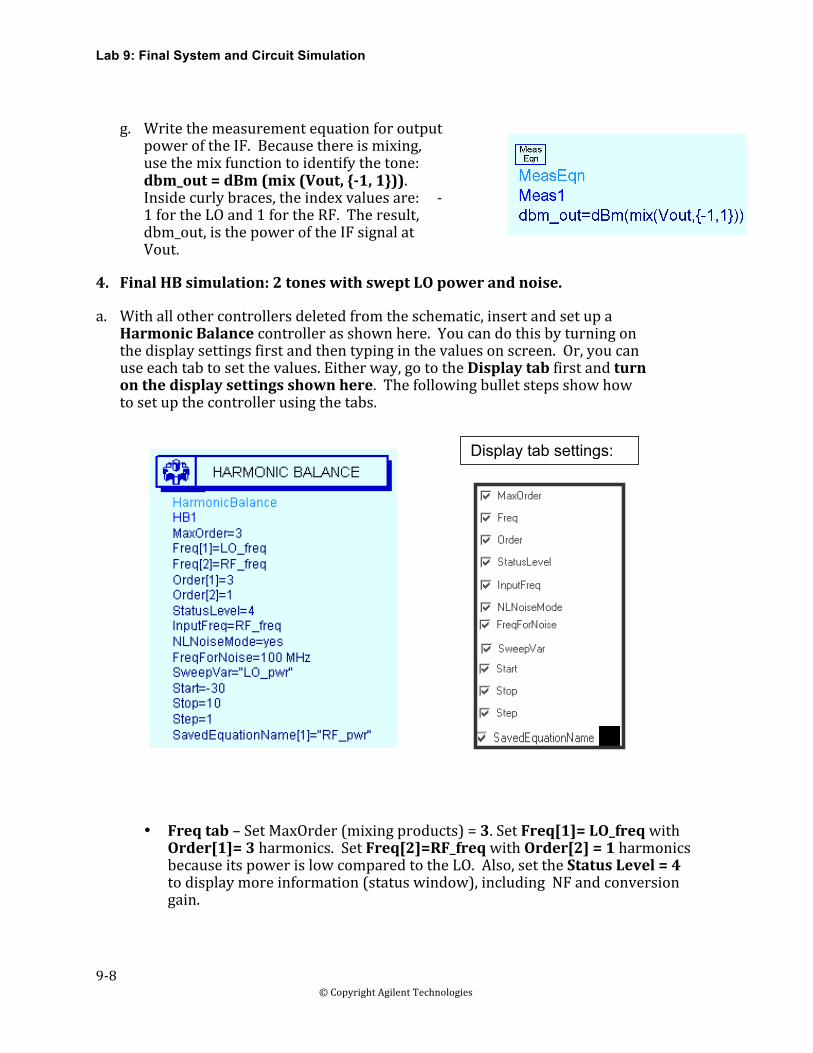
g. WritethemeasurementequationforoutputpoweroftheIF.Becausethereismixing,usethemixfunctiontoidentifythetone:dbm_out=dBm(mix(Vout,{1,1})).Insidecurlybraces,theindexvaluesare:‐1fortheLOand1fortheRF.Theresult,dbm_out,isthepoweroftheIFsignalatVout.
4. FinalHBsimulation:2toneswithsweptLOpowerandnoise.
a. Withallothercontrollersdeletedfromtheschematic,insertandsetupaHarmonicBalancecontrollerasshownhere.Youcandothisbyturningonthedisplaysettingsfirstandthentypinginthevaluesonscreen.Or,youcanuseeachtabtosetthevalues.Eitherway,gototheDisplaytabfirstandturnonthedisplaysettingsshownhere.Thefollowingbulletstepsshowhowtosetupthecontrollerusingthetabs.
• Freqtab–SetMaxOrder(mixingproducts)=3.SetFreq[1]=LO_freqwithOrder[1]=3harmonics.SetFreq[2]=RF_freqwithOrder[2]=1harmonicsbecauseitspowerislowcomparedtotheLO.Also,settheStatusLevel=4todisplaymoreinformation(statuswindow),includingNFandconversiongain.
Display tab settings:
Lab 9: Final System and Circuit Simulation
9‐9©CopyrightAgilentTechnologies
2009
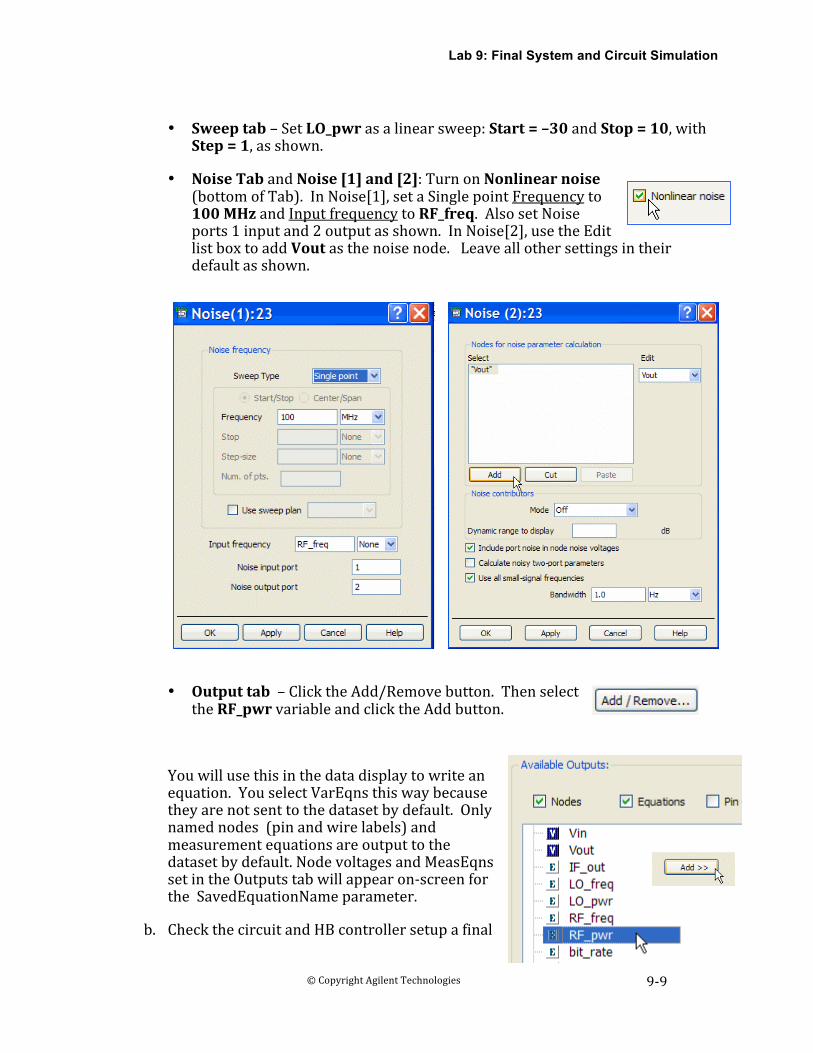
• Sweeptab–SetLO_pwrasalinearsweep:Start=–30andStop=10,withStep=1,asshown.
• NoiseTabandNoise[1]and[2]:TurnonNonlinearnoise(bottomofTab).InNoise[1],setaSinglepointFrequencyto100MHzandInputfrequencytoRF_freq.AlsosetNoiseports1inputand2outputasshown.InNoise[2],usetheEditlistboxtoaddVoutasthenoisenode.Leaveallothersettingsintheirdefaultasshown.
• Outputtab–ClicktheAdd/Removebutton.ThenselecttheRF_pwrvariableandclicktheAddbutton.
Youwillusethisinthedatadisplaytowriteanequation.YouselectVarEqnsthiswaybecausetheyarenotsenttothedatasetbydefault.Onlynamednodes(pinandwirelabels)andmeasurementequationsareoutputtothedatasetbydefault.NodevoltagesandMeasEqnssetintheOutputstabwillappearon‐screenfortheSavedEquationNameparameter.
b. CheckthecircuitandHBcontrollersetupafinal

Lab 9: Final System and Circuit Simulation
9‐10©CopyrightAgilentTechnologies2009
setupafinaltimetobesuretheyarecorrect(asshown)andthenSimulate,watchingthestatuswindowasthepowerisswept.Thesimulatorinformation(statuslevel4)iswrittenintothewindow–thisdoestakelongerthanlowerstatussettings.Butinthiscase,youwantthemixerconversiongainandnoisefigure.
5. Plotthedata:NF,ConvGain,dbm_out,andIF_gain.
a. Whenthesimulationcompletes,scrollinthestatuswindowtoseethecalculatedconversiongainandthenoisefiguresNFasshownhere.NOTEonwarnings:metallossmessage–youcanignorethismessage.
b. Plotthedbm_outequationandyouwillseetheeffectsofthesweptLOpower.Noticethatnear‐10dBmthemixergoesintostarvation.
c. WriteanequationforIF_gainasshownhere.BysubtractingRFinputpowerfromtheoutputpower,theresultisthegainatallvaluesofthesweptLO.Puttheequationinalistandscrolltoseetheresults.
d. Savetheschematicanddatadisplays.
Lab 9: Final System and Circuit Simulation
9‐11©CopyrightAgilentTechnologies
2009
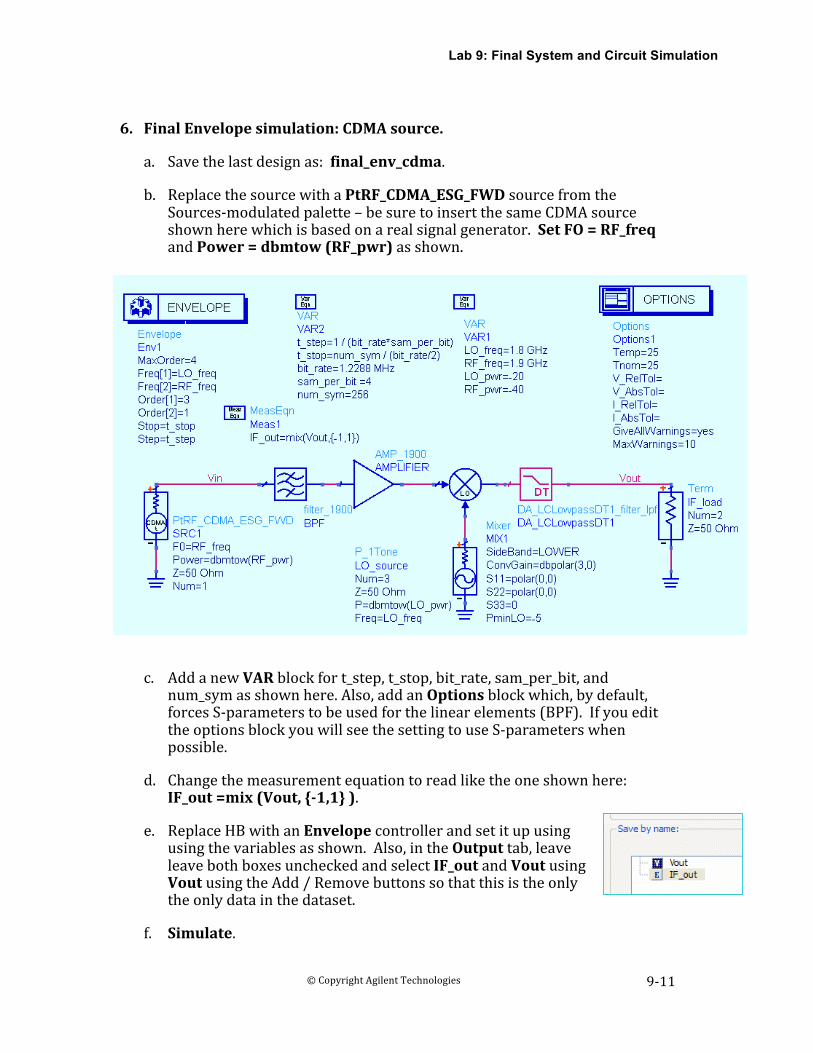
6. FinalEnvelopesimulation:CDMAsource.
a. Savethelastdesignas:final_env_cdma.
b. ReplacethesourcewithaPtRF_CDMA_ESG_FWDsourcefromtheSources‐modulatedpalette–besuretoinsertthesameCDMAsourceshownherewhichisbasedonarealsignalgenerator.SetFO=RF_freqandPower=dbmtow(RF_pwr)asshown.
c. AddanewVARblockfort_step,t_stop,bit_rate,sam_per_bit,andnum_symasshownhere.Also,addanOptionsblockwhich,bydefault,forcesS‐parameterstobeusedforthelinearelements(BPF).IfyouedittheoptionsblockyouwillseethesettingtouseS‐parameterswhenpossible.
d. Changethemeasurementequationtoreadliketheoneshownhere:IF_out=mix(Vout,{1,1}).
e. ReplaceHBwithanEnvelopecontrollerandsetitupusingusingthevariablesasshown.Also,intheOutputtab,leaveleavebothboxesuncheckedandselectIF_outandVoutusingVoutusingtheAdd/Removebuttonssothatthisistheonlytheonlydatainthedataset.
f. Simulate.

Lab 9: Final System and Circuit Simulation
9‐12©CopyrightAgilentTechnologies2009

Lab 9: Final System and Circuit Simulation
9‐13©CopyrightAgilentTechnologies
2009
7. UseanExampleDDStoplotACPRandPowerforyourcircuit.
a. Whenthedatadisplaywindowopens,click:File>OpenandusethedialogtogototheADSinstallationdirectorytofind:examples/Tutorial/ModSources_prj/IS95_FwdLinkSrc.dds
b. OpenthisDDSandthenclicktheDDScommandFile>File>SaveAsandsaveitinyoursystem_prj(scroll(scrollusingthearrowbuttons).SaveitwiththesamesameexampleDDSname.
c. Noticethevalueswillberedorinvalidwithouttheexampledata.Changethedefaultdatasettoyourfinal_env_cdmadataset.ThenchangetheEqnVfundtoyourIFoutputequation:Vfund=IF_out.
d. Theresultistheexamplecalculationsarenowusedforyourdataset.Examinebothpagesinthedatadisplay(ACPRandPwr).Youcanuseanyexampledatadisplayforyoudatainthiswaylikeatemplate.
e. ExaminethedataandthenSaveandclosethedatadisplaywindow.
DDSpages:1)ACPRandTrajectoryand2)PowerCalcs

Lab 9: Final System and Circuit Simulation
9‐14©CopyrightAgilentTechnologies2009
8. Plotthespectrumusingaprogrammedmarkerslider.
Thenextseveralstepswillshowyouhowtousepowerfulexpressionstopassamarkervaluetoafunctionandplotthedatawheneverthemarkerismoved.
a. Openanewdatadisplayandnameit:Marker_Slider.Marker_Slider.
b. Insertanequation.ClicktheVariableInformationbutton.Youwillseethatfreqisdependentupontime.time.Closethedialog.
c. Writetheequationmarker_freqshownhere.Thiswillaccessallfrequenciesatonepointintime.Youcanuseanytimepointbecausethenumberofcalculatedfrequenciesarethesameatanytimepoint,accordingtotheorderandmaxorderyousetintheenvelopesimulationcontroller.Usezeroasshown.
d. Insertaplotofthemarker_freqequationwhichisplottedagainsttheindependentvariable:freq.Next,youwillmakeitlooklikeaslider.
e. Edittheplot.RemovetheAutoScalefortheY‐axis.SettheY‐axisMin,MaxandStepto:6e12,6e12,and6e12asshown.ThenclicktheMorebuttonandsettheYaxisfontsize=0(typeitin).Thickenthetraceifyouwant.ClickOKandthenputamarkeron1900MHz.Besuretosizeitsothatitlooksliketheslidershownhere.

Lab 9: Final System and Circuit Simulation
9‐15©CopyrightAgilentTechnologies
2009
f. Writetheequationfreq_indexusingthefind_indexfunction.Themarkervalueandmarker_freqarepassedintotheargumenttoreturntheindexvalueofthemarkerposition.Thisequationwillbethelook‐upvaluefortheVoutdatayouwanttoplot.
g. Writetheequationmarker_spectrumtoplotthespectrumaroundthemarkerfrequencyvalue.Thefsfunctiontransformstheenvelopetimedataintofrequency‐thetwocolons(::)representalltimepointsandfreq_indexistheindexvalueofthemarkerfrequency.Use5commasafterthebracketandtypeinthe“Kaiser”windowfunction.InallADSfunctions,youcandisregardanyargumentbyusingcommas.
h. Plotthemarker_spectrumequationandchangetheTraceType(TraceOptions)tolinear.Thenmovethesliderto100MHz.Puttwomarkersonthespectrumasshownandwriteanequation,BW,usingindeptogettheindependentvariableofthemarkers(x‐axis).InsertalistofBWasshown,changingtoEngineeringformatwith4significantdigitsandremovingtheindependentdata(PlotOptions).
i. Movethemarker‐BWremainsthesame.Examineyourwork,savethedatadisplayandtheschematic.Yourcircuitshavenowbeensimulatedinthesystemandyouhavecompletedthecourse!

Lab 9: Final System and Circuit Simulation
9‐16©CopyrightAgilentTechnologies2009

Lab 9: Final System and Circuit Simulation
9‐17©CopyrightAgilentTechnologies
2009
9. CDMAEnvelopeSimulationwithFrequencySweep
Dothisonlyifyouhavetime…
ThissimulationshowshowtosweeptheRFfrequencyandadjusttheLOvariableforfrequencysothatisalwaysproducingthesameIFoutputfrequency.Afterward,theIFoutputspectrumcanbeplottedtoshowtheresultsforavaryingRFinputfrequencysweep.Todothis,youneedtosetupaparametersweepoftheRF,redefinetheLOvariable,andthenplottheIFoutputforeachoftheRFfrequencies.
a. Savethecurrentdesign(final_env_cdma)withanewname:final_env_cdma_swp.
b. Insertaparametersweepfromfromanysimulationpaletteandpaletteandsetitupasshownshownhere.Thequoteswillappearifyouappearifyoueditthecontrollerandenterandenterthevaluesthere–ifnot,besurebesuretotypethemontotheschematic.schematic.
SweepVar=RF_freq
SimInstanceName=Env1
Start=1700MHz
Stop=2100MHz
Step=200MHz
ThiswillsweeptheRFsignalwith3frequencies:1700MHzwillcoverthelowendand2100MHzthehighendwhicharebothjustoutsideoftheBPFresponse.Ofcourse,youcouldsweepitmorefinelybutthatwouldtakemoretime.
c. ChangetheLO_freqvariabletotrackthetracktheRFsignalsweepbysettingitassettingitasshown:LO_freq=RF_freq–RF_freq–100MHz.ThiswillmaketheLOtheLOalwaysbe100MHzlessthantheRFtheRFforanynumberofstepsinthetheparametersweep.
d. Savethedesign‐nootherschematicschematicchangesarerequired.

Lab 9: Final System and Circuit Simulation
9‐18©CopyrightAgilentTechnologies2009

Lab 9: Final System and Circuit Simulation
9‐19©CopyrightAgilentTechnologies
2009
e. Yourdesignshouldlookliketheoneshownhere.Ifitdoes,thenSimulate.
f. Afterthesimulationisfinished,insertarectangularplotandaddVoutastheSpectrumofthecarrierindBmdBmwithwindowingasshownhere.here.ClickOKandtheplotwillappear.
g. Editthetrace(doubleclick)anduseTraceOptionstochangethetracetoLineartobetterseetheoutputtraces.
NoticethatthespectrumisforVout[1]which100MHzIFtone.HowevertherearethreeresultingIFtonesfromthesweep.Now,youneedbeabletoseewhichtraceresultsfromwhichRF–youwilldothisinthenextstep.

Lab 9: Final System and Circuit Simulation
9‐20©CopyrightAgilentTechnologies2009
h. EdittheplotonemoretimeanduseanduseTraceOptionandtheTraceTraceExpression.GototheLinearLineartabandturnonLineColorandColorandDisplayLabelasshownshownhereandclickOK.
i. Yourplotshouldlookliketheoneoneshownhere.Buttoidentifytheidentifythetracesevenbetter,useusethecommand:Insert>PlotPlotLegend.
Finally,youcanseethethreeIFspectraltracesthatresultfromeachonoftheRFtones.Thisshowshowtosweepfrequencyforacircuitenvelopesimulationandhowtheresponseofthecircuitcanbeanalyzed.

Lab 9: Final System and Circuit Simulation
9‐21©CopyrightAgilentTechnologies
2009
Thiscompletesthelabexercise‐theremainingstepsareoptional.DothemonlyifyouhavetimeandhaveaccesstothePtolemysimulator.
Lab 9: Final System and Circuit Simulation
9‐22©CopyrightAgilentTechnologies2009
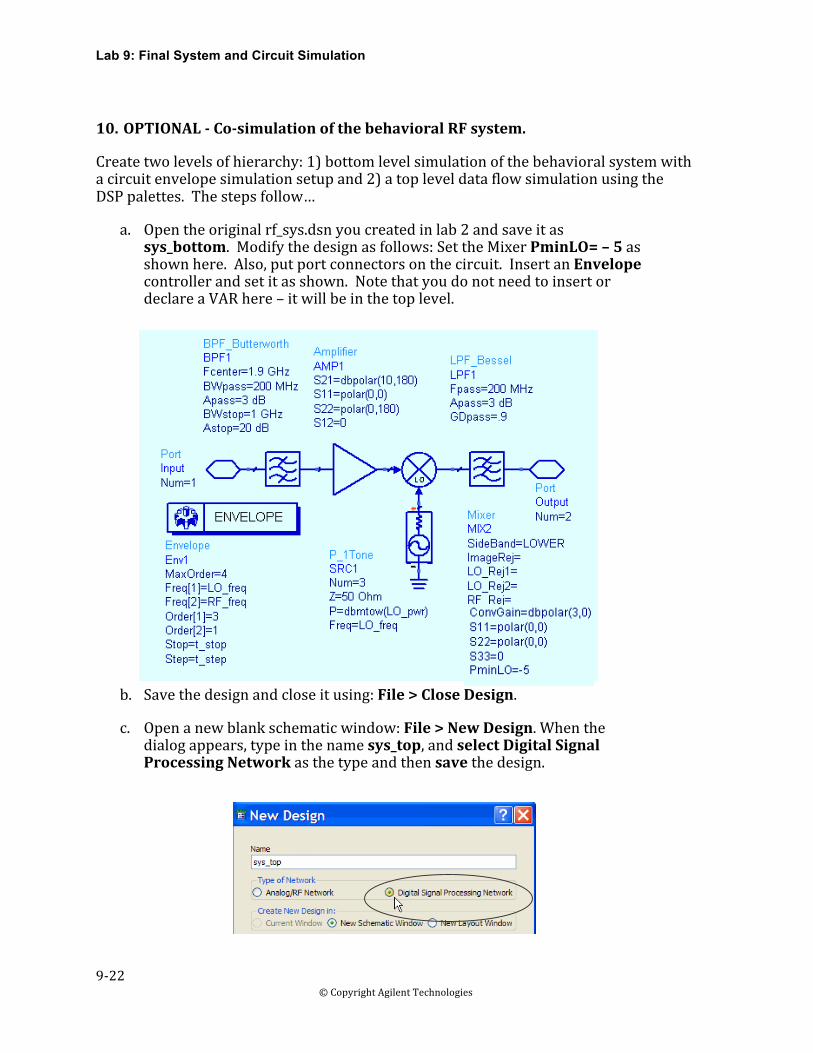
10. OPTIONALCosimulationofthebehavioralRFsystem.
Createtwolevelsofhierarchy:1)bottomlevelsimulationofthebehavioralsystemwithacircuitenvelopesimulationsetupand2)atopleveldataflowsimulationusingtheDSPpalettes.Thestepsfollow…
a. Opentheoriginalrf_sys.dsnyoucreatedinlab2andsaveitassys_bottom.Modifythedesignasfollows:SettheMixerPminLO=–5asshownhere.Also,putportconnectorsonthecircuit.InsertanEnvelopecontrollerandsetitasshown.NotethatyoudonotneedtoinsertordeclareaVARhere–itwillbeinthetoplevel.
b. Savethedesignandcloseitusing:File>CloseDesign.
c. Openanewblankschematicwindow:File>NewDesign.Whenthedialogappears,typeinthenamesys_top,andselectDigitalSignalProcessingNetworkasthetypeandthensavethedesign.
Lab 9: Final System and Circuit Simulation
9‐23©CopyrightAgilentTechnologies
2009
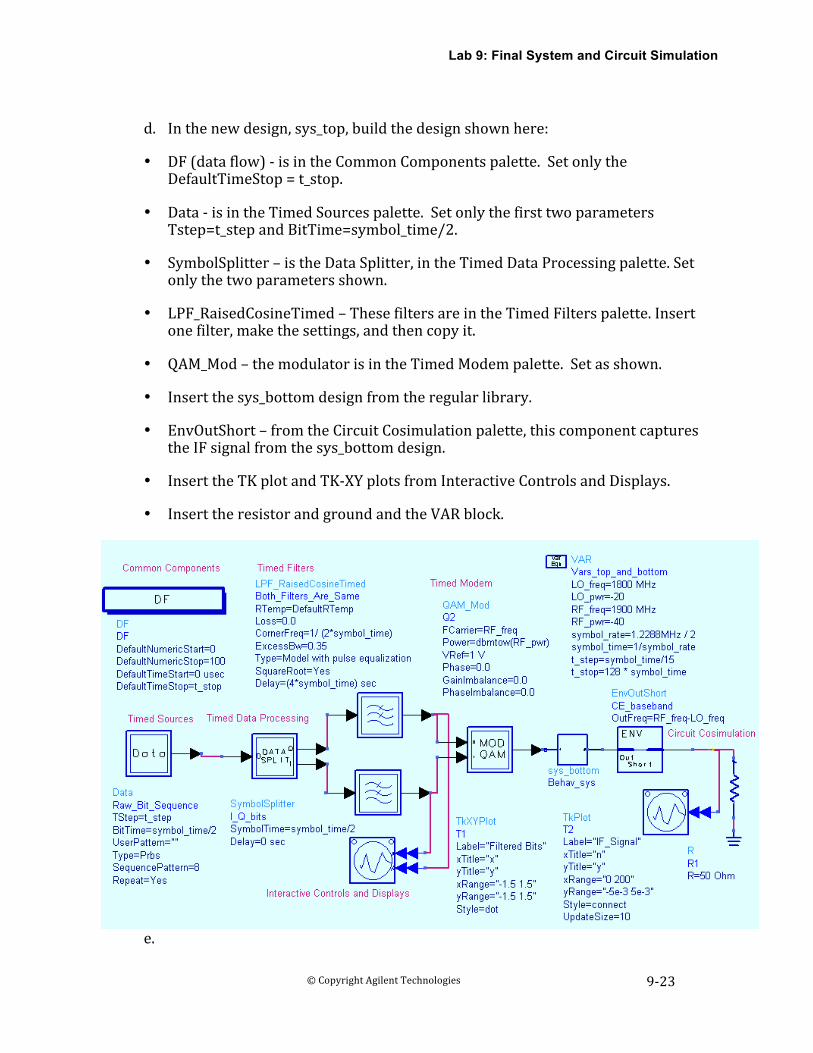
d. Inthenewdesign,sys_top,buildthedesignshownhere:
• DF(dataflow)‐isintheCommonComponentspalette.SetonlytheDefaultTimeStop=t_stop.
• Data‐isintheTimedSourcespalette.SetonlythefirsttwoparametersTstep=t_stepandBitTime=symbol_time/2.
• SymbolSplitter–istheDataSplitter,intheTimedDataProcessingpalette.Setonlythetwoparametersshown.
• LPF_RaisedCosineTimed–ThesefiltersareintheTimedFilterspalette.Insertonefilter,makethesettings,andthencopyit.
• QAM_Mod–themodulatorisintheTimedModempalette.Setasshown.
• Insertthesys_bottomdesignfromtheregularlibrary.
• EnvOutShort–fromtheCircuitCosimulationpalette,thiscomponentcapturestheIFsignalfromthesys_bottomdesign.
• InserttheTKplotandTK‐XYplotsfromInteractiveControlsandDisplays.
• InserttheresistorandgroundandtheVARblock.
e.

Lab 9: Final System and Circuit Simulation
9‐24©CopyrightAgilentTechnologies2009
CheckallthevaluesandvariablestobesuretheyarecorrectandSimulate.Whenyoudo,youwillsetthetwoplotsinaction.UseView>ViewAlltorescaletheplotsifneeded.
f. QuitthesimulationusingthecontrolandinsertaSpectrumAnalyzercomponentfromtheSinkpalette.ConnectittotheoutputandeditittoselectthewindowtypeasKaisershownhere.Besuretosettheothervaluesasshown.
g. Whenthestatuswindowshowsthedatacollectioniscompleteforthesink(SpectrumAnalyzer),Quit.
h. OpenthedatadisplayandadddBm(CDMA_spectrum)toarectangularplot.
SUMMARY‐Thisdataistheresultofaco‐simulationbetweenPtolemyandtheEnvelopesimulator.ItmarkstheendoftheADSFundamentalslabexercises.
ENDofLABEXERCISE.