![Fragility and hysteretic creep in frictional granular jamming · 1MPA-10, Los Alamos National Laboratory, Los Alamos, New Mexico 87545, USA 2T-CNLS, ... [26,27].Thesedivergentopinions](https://static.fdocuments.us/doc/165x107/5fe770d9f65d9a52c46ac3c9/fragility-and-hysteretic-creep-in-frictional-granular-jamming-1mpa-10-los-alamos.jpg)
LA-UR- 95-405 - Digital Library/67531/metadc665663/m2/1/high... · Los Alamos National Lab Los...
13
.. .- LA-UR- 95-405 Title: Author(s): Submitted to: NONLINEAR OFTICAL MICROSCOPY FOR IMAGING THIN FILMS AND SURFACES Laura B. Smilowitz, CST-6 Duncan W. McBranch, CST-6 Jeanne M. Robinson, CST-6 SPIE Conference San Jose, CA February 7, 1995 r Los Alamos National Laboratory, an affirmative action/equal opportunity empldyer. is operated by the Universityof California for the U.S. Department of Energy under contract W-7405-ENG-36. By acceptance of this article, the publisher recognizes that the U.S. Government retains a nonexclusive. royalty-free license to publish or reproduce the publishedform of this contribution, or to allow others to do so, for U.S. Government purposes. The Los Alamos National Laboratory requests that the publisher identify this article as work performed under the auspices of the U.S. Department of Energy. ,d 14 Form No. 836 R5 Si2629 10B1
Transcript of LA-UR- 95-405 - Digital Library/67531/metadc665663/m2/1/high... · Los Alamos National Lab Los...

.. . -
LA-UR- 95-405
Title:
Author(s):
Submitted to:
NONLINEAR OFTICAL MICROSCOPY FOR IMAGING THIN FILMS AND SURFACES
Laura B. Smilowitz, CST-6 Duncan W. McBranch, CST-6 Jeanne M. Robinson, CST-6
SPIE Conference San Jose, CA February 7, 1995
r
Los Alamos National Laboratory, an affirmative action/equal opportunity empldyer. is operated by the University of California for the U.S. Department of Energy under contract W-7405-ENG-36. By acceptance of this article, the publisher recognizes that the U.S. Government retains a nonexclusive. royalty-free license to publish or reproduce the published form of this contribution, or to allow others to do so, for U.S. Government purposes. The Los Alamos National Laboratory requests that the publisher identify this article as work performed under the auspices of the U.S. Department of Energy.
,d 14 Form No. 836 R5
Si2629 10B1

DISCLAIMER
This report was prepared a s an account of work sponsored by an agency of the United States Government. Neither t he United States Government nor any agency thereof, nor any of their employees, make any warranty, express or implied, or assumes any legal liability or responsibility for the accuracy, completeness, or usefulness of any information, apparatus, product, or process disclosed, or represents that its use would not infringe privately owned rights. Reference herein to any specific commercial- product, process, or service by trade name, trademark, manufacturer, or otherwise does not necessarily constitute or imply its endorsement, recommendation, or favoring by t h e United States Government or any agency thereof. The views and opinions of authors expressed herein do not necessarily state or reflect those of t h e United States Government or any agency thereof.

DISCLAIMER
Portions of this document may be illegible in electronic image products. Images are produced from the best available original document.
I

*. 0 - .
Nonlinear optical microscopy for imaging thin films and surfaces
Laura Smilowitz, Duncan McBranch, and Jeanne M. Robinson
Chemical Sciences and Technology Division
Los Alamos National Lab Los Alamos, NM 87545
CST-6, MS J585
Abstract
We have used the inherent surface sensitivity of second harmonic generation to develop an instrument for nonlinear optical microscopy of surfaces and interfaces. We have demonstrated the use of several nonlinear optical responses for imaging thin films. The second harmonic response of a thin film of c60 has been used to image patterned films. Two photon absorption light induced fluorescence has been used to image patterned thin films of Rhodamine 6G. Applications of nonlinear optical microscopy include the imaging of charge injection and photoinduced charge transfer between layers in semiconductor heterojunction devices as well as across membranes in biological systems.
1. Introduction
In the electric dipole approximation, an intense laser beam incident on a centrosymmetric material will not generate any even ordered harmonics. In particular, there will be no second harmonic response generated.by the bulk of the material. At the surface of a centrosymmetric medium, the inversion symmetry is broken, .allowing for a second order response characterized by the second order nonlinear susceptibility, X ( 2 ) l. Thus, X ( 2 ) has an inherent surface sensitivity which we utilize in order to image surfaces, interfaces, and thin films.
A nonzero x(2) gives rise to several phenomena of interest. In second harmonic generation (SHG) measurements, light of frequency 0 incident on a nonlinear sample generates light of frequency 20. Sum frequency generation is a more general process in which the material is excited by two different pump frequencies (01 and 02) and a response is generated at the sum of these frequencies (01+02) . A response at the difference frequency is also generated (01-02) and is called difference frequency generation (DFG). If any of these frequencies is a resonant frequency of the sample, the nonlinear response is greatly enhanced. Thus, by tuning the pump frequencies and measuring the nonlinear response of the system, electronic and vibrational resonances can be mapped out giving the technique spectral resolution.
Nonlinear responses are zero background signals since the frequency of the signal photons differs from that of the pump photons. This makes very small signals detectable with the use of high gain PMT's and avalanche photodiodes or photon counting techniques. When the pump frequencies are not resonant with the sample, a nonlinear response is generated without absorption of the pump photons. This enables us. to use very high pump intensities without damaging the sample thus allowing measurable nonlinear
. .
responses despite low efficiencies. It also means that the nonresonant response is instantaneous and can be used to map out the time dynamics of a process occurring at the sample. SHG and SFG are dependent upon the electric dipole moment of the sample. By putting different adsorbates on a sample surface, the dipole moment is changed. Similarly, a charge transfer across an interface or across a cell membrane will generate a very large local dipole moment at the interface. The local dipole moments can be probed by SHG allowing the surfaces and buried interfaces to be imaged. The submonolayer sensitivity of the technique means that micron areas of a surface can be measured 1-3.
2. Theory X ( 2 ) is dependent on the microscopic properties of the material. It is
given by a sum over terms of the form 4:
where puii is the dipole matrix element and @,is the resonant frequency for a transition between the i and j states. From the form of X(2) , we can see that it contains both structural and spectral information about the material. The numerator is dependent on the dipole matrix elements while the denominator leads to resonances in X ( 2 ) when one of the optical frequencies approaches an allowed electronic transition.
The effective nonlinearity from the surface, Xs,eff includes components due to the stuctural symmetry breaking of the surface, the discontinuity in the field at the surface, and a com onent which arises from the discontinuity in
appearing at the surface, is dependent on a bulk parameter. For systems with bulk centrosymmetry but no inversion symmetry in the plane of the surface, the components of Xs,eff due purely to surface parameters dominate. This is also true if one tunes specifically into a surface resonance. In general however, there is a component of Xs,eff which is due to bulk parameters. By modifying the surface in some way, such as introducing an adsorbate, one can separate the surface and bulk components of X s,eff
The SHG is generated by radiation from the nonlinear polarization of the system in response to intense fields. The nonlinear polarization P(2) is given by 6:
the bulk electric quadrupole X( 2P at the surface 6. The last component, while
6.
C P 3 2 w ) = XD:E(w)E(w)+XQ1:E(w)VE(w)-V.XQ2:E(o)E(w)+-V xX':E(w)E(o) z20
M where X D , X Q , and X are the electric dipole, electric quadrupole, and magnetic dipole susceptibilities. Solving the wave equation with the nonlinear polarization as a source term and using the continuity equations to determine boundary conditions yields the radiated SH waves in transmitted and reflected directions 47 7-9. Phase matching conditions at the boundary yield the nonlinear Snell's equations for determining directions of propagations of the waves. For a reflected SH wave in a linear medium with n(o)=n(2o), the SH wave is collinear with the linearly reflected wave. This will be a useful feature
. .
for system alignment to be discussed below. The reflected and transmitted SH waves depend on Fresnel coefficients related to the interface dielectric constants similar to the linear case. As with the linear case, there is a Brewster's angle for the SH at which the p-polarized reflected SH wave disappears. The solution for the reflected and transmitted second harmonic E- fields can then be used to calculate the reflected second harmonic intensity which is given by 8-10:
where Oz0 is the angle from the surface normal of the reflected SHG and e(Q) is the unit vector for the field polarization at frequency Qcorrected by the Fresnel coefficients. For a pulsed pump beam of pulsewidth T and cross-section A, the SH intensity is given by 11:
16 n3w sec2 ( 8)P2 Ix::$(photoas / s) S(2w) = Ac3ATR
where P is ower in Watts, T is pulsewidth, R is repetition rate, and A is beam area in cm? Given some typical s stem parameters (1OOmW per pulse, 100 ps pulse width, and a X ( 2 ) of 10-12esu), the SH response generated is 1000 photons/sec. Thus, assuming a detector sensitivity of 10 photons per second, measurements are possible on systems with this nonlinear coefficient with coverages down to 1% of a monolayer 3. An even greater sensitivity will be achieved for surfaces with a larger nonlinearity. Typical surface X(2) values are on the order of 10-14 to 10-15 esu g.
3. Instrument and Results
A schematic of the general Nonlinear Optical Microscope system is shown in Figure 1. This figure demonstrates the versatility of the tool. By changing detection schemes (which in some cases is as simple as substituting different filters), various nonlinear processes can be probed. SHG with a single plane wave excitation is the simplest experiment. However, by looking for emission at energies below the doubled harmonic energy, we can study two photon light induced fluorescence (TPF) rather than SHG. Using two excitation frequencies allows us to study sum and difference frequency generation. Because nonresonant nonlinearities occur instantaneously, we can determine dynamic information about the system with a temporal resolution limited only by the pulse width of the exciting laser beam. By using a tunable laser, we can obtain spectroscopic information as well. This general system offers the capabilities of temporal resolution limited by the laser pulse width, spectral resolution limited by the laser spectral width, and spatial resolution limited by the diffraction limited spot size of the beam.

. .
detector
microscope optics rnonochromater
Sample
I XYZ translation stage I Fluorescence: no 02; oout = emission
TPF: absorption at 0 1 + q ; mout < 01+ 02
Figure 1: General schematic for a nonlinear optical microscope.
We have constructed two different systems for SHG imaging. The first system uses a CCD camera and laser beam diameter on the order of 5 mm (Figure 2).

YAG loops, 10Hz 1OmJ
Filters
Figure 2: Experimental setup using CCD camera for imaging.
This system has the advantage of high speed image collection since the CCD has 5 1 2 x 5 1 2 pixels which integrate the SHG signal in parallel. The camera we use is a Photometrics liquid nitrogen cooled CCD with 18 pm x 18 pm pixels with a dark current on the order of 1 electron per pixel per hour and read noise on the order of several electrons per pixel per read. The combination of the pixel size and the magnification used determines the system resolution. With a magnification of 2, we are able to resolve 7 pm features on a test pattern resolution target. The quantum efficiency of the system at 5 3 2 nm is approximately 25%. The very low read noise allows us to perform long signal integrations without being swamped by detector noise buildup.. This is important for our application, in which we expect on the order of 10-100 counts per pixel per hour at the detector. We typically integrate between 2 0 minutes and 1 hour to build up images. Our pump light is the 1064 nm output of a NdYAG laser which produces 100 ps pulses at 10 Hz. We typically use about 10 mJ per pulse with a beam diameter of about 5 mm. The spatial filter gives a cleaner beam profile at the cost of laser power; images are taken with or without spatial filtering depending on the amount of light needed to obtain a measurable signal. The sample is kept in a vacuum chamber which is evacuated to 10-5 torr and then sealed. Conducting the SHG experiments under low vacuum gives a higher peak power damage threshhold. The very low average powers present with a 10 Hz source mean that the damage mechanism is due to peak power rather than heating, and the use of a cold finger is not needed. Optical filters are used to separate the fundamental and harmonic light. Several Schott glass BG39 filters with a total optical density > 15 at 1064 nm and transmission > 75% at 532 nm are placed between the sample and the CCD to remove any reflected 1064 nm light. A narrow bandpass filter centered at 532 nm is also placed just before the CCD in order to separate out a second harmonic response from other stray light sources. A Schott glass RG665 filter is placed just before the sample to remove any 5 3 2 nm light generated elsewhere in the system. This filter is removed for alignment purposes. In order to verify the source of the signal, different combinations of filters are used. An RG665 filter is placed after the sample to verify that the signal does not arise from reflected IR. A BG39 filter is placed immediately before the sample to insure that the signal being imaged is generated at the sample. The images discussed below are taken with a p-polarized fundamental beam; polarization studies are currently underway.
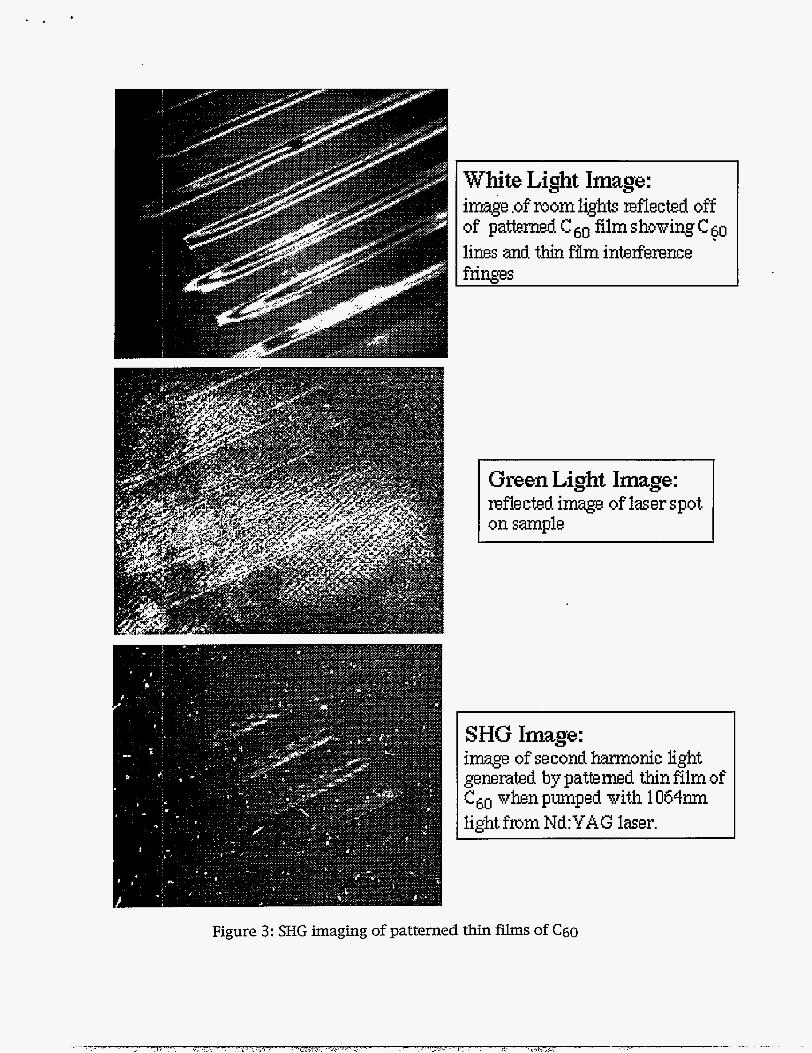
White Light Image: image .of mom lights wflected off of patterned C lines and film interference fringes
film shoving C 60
Green Light Image: reflected image of laser spot on sample
SHG Image: image of second harmonic light generated by pattemed thin film of C60 whenpumped vith 1064nm light fmm Nd:YAG laser.
Figure 3: SHG imaging of patterned thin films of C6o

We have successfully used this system to image SHG from thin films of C6o and the conjugated polymer MEHPPV. Figure 3 shows the SHG image obtained from a patterned thin film of C6o which is made by vacuum sublimation of c60 through a mask onto a Suprasil substrate. Figure 3A shows a white light image of the sample which is composed of lines of c 6 0 300-400 microns wide separated by millimeter spaces. The films produced this way are several thousand angstroms thick as determined by Dektak Profilometer measurements. Figure 3B shows the reflected 532 nm light present when the first RG665 filter is removed for alignment and Figure 3C is the SHG image generated by the film when it is pumped with 115mW of 1064 nm light.
We have also used this setup to take an image of the two photon light induced fluorescence from a thin film of Rhodamine 6G laser dye as shown in figure 4 2. The sample is prepared by drop casting a solution of R6G in methanol onto an Suprasil substrate producing a film 0.5-1 pm thick into which a pattern is scribed. The TPF is imaged by removing the 532 nm notch filter. A second image is taken with the 532 notch filter in place in order to determine what part of the image is from SHG and what part from longer wavelength emission.
5 mm I
Figure 4: Two photon light induced fluorescence from a n R6G film.
The second system we built uses a focused pump beam and builds up an image pointwise by rastering the sample (Figure 5). In this case, the time required to build up an image is the product of the integration time per point (typically on the order of a 20 shotdpoint at 10 Hz) and the number of points taken. Thus an image of 100 points by 20 points will take 1 hour to acquire. If the points are taken 100 microns apart, an area of 1 cm by 0.2 cm will be imaged in 1 hour. The tradeoffs here are between sensitivity and image acquisition time. For larger signals, fewer shots per pulse and a shorter integration time are needed. The higher the resolution required and the larger the area to be imaged, the higher the number of points needed and the longer the scan time. The ultimate resolution of the image is limited by the spot size at the sample. This is diffraction limited in theory. In practice, it is limited by signal to noise which will depend on the peak damage threshhold of the sample (which is improved by having the sample in vacuum). The images shown in Figure 6 are obtained usihg a 7.5 cm focal length lens which gives a

spot size of 200 pm at the sample. The second harmonic goes as the square of the spot size which gives a FWHM of 140 pm. The second harmonic generated by the sample is collimated and then collected by a PMT with filters as described above to separate the fundamental and harmonic frequencies.
attenuator spatial filter
computer
1
7
I X Stage Figure 5: Rastering set up
The rastering setup has the advantage of being more flexible than the CCD experiment. By removing the focusing lens and using a collimated excitation beam, a larger area can be probed at once and a larger signal obtained. This makes it easier to map out the parameter space in order to obtain more quantitative information about the sample. For instance, the dependence on the polarization of the fundamental and SHG can be mapped out as can the intensity dependence. These experiments are currently in progress.

Reflected green light image of c60 lines
lines 300-400 pn wide spaces - 1 mm wide
SHG image of C6o lines
Resolution: y-axis 25 pixels, 100 pm step size x-axis 60 pixels, 100 pm step size
Figure 6: SHG image of C6o lines using rastering setup.
With two different functioning setups for collecting SHG images, we have identified several systems to study. We have already begun work on studying photoinduced charge transfer reactions using second harmonic generation. Second harmonic is sensitive to local dipole moments. Photoinduced charge transfer in a heterojunction configuration should produce a large local dipole moment by separating charges across an interface12. Photoinduced charge transfer has been shown to occur at the interface between conjugated polymers such as MEHPPV and C ~ O 13. SHG imaging will be useful in characterizing the dynamics of charge injection at contacts in heterojunction devices, photoinduced charge transfer reactions across interfaces and across membranes such as in biological systems.
Other applications rely on the use of tunable pump beams to gain spectroscopic information about the surface. The high sensitivity of sum frequency generation lends it to identifying the presence of trace quantities

of substances on a surface spectroscopically. Adding a third stage to the rastering set up will allow us to build up 3-dimensional images which will be useful in mapping out the diffusion of a chemical moiety through a porous medium. A straightforward modification of this system for confocal imaging will allow for higher spatial resolution 14.
5. Acknowledgements
The authors would like to thank Mark Hoffbauer for the use of his vacuum sublimation system and Ian Campbell for assistance with Dektak Profilometer measurements. LS wishes to acknowledge the support of a LANL Director's Fellowship. This wprk was funded by the LANL Laboratory Directed Research and Development program.
6. References
l.K.A. Schultz, 1.1. Suni and E.G. Seebauer, "Microscopy of Adsorbates by Surface Second-Harmonic Generation", J. Opt. SOC. Am. B, Vol. 10, pp. 546, 1993.
2. G.T. Boyd, Y.R. Shen and T.W. Hansch, "Coninuous-Wave Second- Harmonic Generation as a Surface Microprobe", Optics Lett., Vol. 11, pp. 97, 1986.
3. Y.R. Shen, "Surfaces Probed by Nonlinear Optics", Surface Science,
4. Y.R. Shen, The Principles of Nonlinear ODtics, John Wiley and Sons, New York, 1984.
5. Bert Koopmans, Anna-Maria Janner, Harry T. Jonkman, George A. Sawatzky and Folkert van der Woude, "Strong Bulk Magnetic Dipole Induced Second-Harmonic Generation from C60", Phys. Rev. Lett., Vol. 71, pp. 3569, 1993.
6. P. Guyot-Sionnest and Y.R. Shen, "Bulk Contribution in Surface Second-Harmonic Generation", Phys. Rev. B, Vol. 38, pp. 7985, 1988.
7. N. Bloembergen and P.S. Pershan, "Light Waves at the Boundary of Nonlinear Media", Phys. Rev., Vol. 128, pp. 606, 1962.
8. G.L. Richmond, J.M. Robinson and V.L. Shannon, "Second Harmonic Generation Studies of Interfacial Structure and Dynamics", Progress in Surface Science, Vol. 28, pp. 1-70, 1988.
9. Y.R. Shen, "Optical Second Harmonic Generation at Interfaces", Annu. Rev. Phys. Chem., Vol. 40, pp. 327, 1989.
10. Robert M. Corn and Daniel A. Higgins, "Optical Second Harmonic Generation as a Probe of Surface Chemistry", Chem. Rev., Vol. 94, pp. 107-125, 1994.
11. T.F. Heinz and G.A. Reider, "Surface Studies with Optical Second Harmonic Generation", Trends in Analytical Chemistry, Vol. 8, pp. 1989.
12. M.S. Yeganeh, J. Qi, A.G. Yodh and M.C. Tamargo, "Influence of Heterointerface Atomic Structure and Defects on Second-Harmonic Generation", Phys. Rev. Lett., Vol. 69, pp. 3579, 1992.
13. N.S. Sariciftci, L. Smilowitz, A.J. Heeger and F. Wudl, "Photoinduced Electron Transfer from a Conducting Polymer to Buckminsterfullerene", Science, Vol. 258, pp. 1992.
14. Tony Wilson, Theory and Practice of Scanning OD tical Microscopv3 Academic Press, London, 1984.
Vol. 299/300, pp. 551-562, 1994.
0


![arXiv:2010.03080v1 [quant-ph] 6 Oct 2020Yi git Suba˘s y Computer, Computational, and Statistical Sciences Division, Los Alamos National Laboratory, Los Alamos, NM 87545, USA The utility](https://static.fdocuments.us/doc/165x107/6090aaa4a0c3895eb2256914/arxiv201003080v1-quant-ph-6-oct-2020-yi-git-subas-y-computer-computational.jpg)

