LA-UR-03-760 - Los Alamos National Laboratory · LA-UR-Approved for public release; distribution is...
36
LA-UR- Approved for public release; distribution is unlimited. Title: Author(s): Details: Form 836 (8/00) Los Alamos National Laboratory, an affirmative action/equal opportunity employer, is operated by the University of California for the U.S. Department of Energy under contract W-7405-ENG-36. By acceptance of this article, the publisher recognizes that the U.S. Government retains a nonexclusive, royalty-free license to publish or reproduce the published form of this contribution, or to allow others to do so, for U.S. Government purposes. Los Alamos National Laboratory requests that the publisher identify this article as work performed under the auspices of the U.S. Department of Energy. Los Alamos National Laboratory strongly supports academic freedom and a researcher’s right to publish; as an institution, however, the Laboratory does not endorse the viewpoint of a publication or guarantee its technical correctness. 03-760 PENETRATION OF HLSA-100 STEEL WITH TUNGSTEN CARBIDE SPHERES AT STRIKING VELOCITIES BETWEEN 0.8 AND 2.5 KM/SEC Rick L. Martineau (X-2) Michael B. Prime (ESA-WR) Thomas Duffey International Journal of Impact Engineering Vol 30 (2004) pp. 505-520
Transcript of LA-UR-03-760 - Los Alamos National Laboratory · LA-UR-Approved for public release; distribution is...
LA-UR-Approved for public release;distribution is unlimited.
Title:
Author(s):
Details:
Form 836 (8/00)
Los Alamos National Laboratory, an affirmative action/equal opportunity employer, is operated by the University of California for the U.S.Department of Energy under contract W-7405-ENG-36. By acceptance of this article, the publisher recognizes that the U.S. Governmentretains a nonexclusive, royalty-free license to publish or reproduce the published form of this contribution, or to allow others to do so, for U.S.Government purposes. Los Alamos National Laboratory requests that the publisher identify this article as work performed under theauspices of the U.S. Department of Energy. Los Alamos National Laboratory strongly supports academic freedom and a researcher’s right topublish; as an institution, however, the Laboratory does not endorse the viewpoint of a publication or guarantee its technical correctness.
03-760
PENETRATION OF HLSA-100 STEEL WITH TUNGSTEN CARBIDE SPHERES AT STRIKING VELOCITIES BETWEEN 0.8 AND 2.5 KM/SEC
Rick L. Martineau (X-2)Michael B. Prime (ESA-WR)Thomas Duffey
International Journal of Impact EngineeringVol 30 (2004) pp. 505-520

Penetration of HSLA-100 Steel with Tungsten Carbide Spheres at
Striking Velocities Between 0.8 and 2.5 km/sec
Rick L. Martineaua,*, Michael B. Primeb, and Thomas Duffeyc
a Group X-2, MS T085, Los Alamos National Laboratory, Los Alamos, NM, 87545, USA
b Group ESA-WR, MS P946, Los Alamos National Laboratory, Los Alamos, NM, 87545, USA
c Consulting Engineer, P.O. Box 1239, Tijeras, NM 87059, USA
Keywords: foreign object damage, impact, penetration resistance, ballistic, residual stress
Abstract
A 51 mm thick plate of High-Strength Low-Alloy (HSLA-100) steel was impacted by
6.4 mm diameter tungsten carbide spheres traveling at velocities ranging from 0.8-2.5
km/sec. The width and depth of the crater for each impact event are provided in tabulated
form and graphed as a function of velocity. The impacts were simulated using an explicit
Lagrangian finite element model. A residual stress map over a cross-section through the
crater was also measured by the Contour Method for the 2.2 km/sec impact. The
predominant feature of the stress map was a peak compressive stress of 1100 MPa, which is
1.6 times the yield strength, centered approximately one crater diameter below the crater
floor. Residual stresses in the as-received HSLA-100 plate were also measured and were
used to evaluate the effect of initial stresses on the model prediction. Good agreement is
shown between the numerical simulation of the impact event and the experimental data.

2
Background
The effect of impact and penetration on the subsequent performance of components
and structures is receiving increased attention, most notably in studies of foreign object
damage (FOD). The term “foreign object damage” originated to describe damage on the
blades in jet aircraft turbine engines. Such damage is caused by impingement of debris, sand,
hailstones, etc. High-cycle fatigue, the leading cause of failure for these engines, usually
occurs in the impacted region [1]. These regions are later affected by factors such as residual
stress, stress concentrations, microstructural damage, and cracks formed as a result of the
impact. Recent studies have isolated the residual stress effects and have shown that they play
a major role in the observed degradation of fatigue life [2,3,4,5]. The drastic effect of a high
velocity impact on the fatigue crack propagation rate has been further examined in the recent
experimental work by Lanciotti [6], who studied the result of space debris impact on
simulated space structures.
Only a few experimental measurements of the residual stresses resulting from an
impact or penetration have been reported in the literature, such as a fairly simple test to
estimate the surface residual stresses after an impact event on an aluminum plate [6].
Recently, synchrotron X-ray diffraction [7,8] was used to examine residual strains in the
region of a dynamic impact onto a plate of Ti-6Al-4V [4,9]. Although these two studies are
the most extensive measurements to date of damaged induced residual stresses, the work by
Peter et al. [4] was performed at much lower impact velocities than in this study, and the
work by Boyce et al. [9] only measured the surface stresses, due to experimental limitations.
3
Several recent studies have been performed involving the impact of tungsten carbide
spheres on a variety of different target materials and thicknesses, and over a wide range in
impact velocities. Grady [10] reports experiments on using tungsten carbide solid spheres to
impact thin plastic and glass target materials at impact velocities in the range 2-4 km/sec.
The solid spheres underwent failure and dynamic fragmentation, with incipient failure at the
lowest velocities, and extremely intense particulation at the highest impact velocities. The
sphere impact data are complemented by both dynamic compression (Hugoniot elastic limit
and shock EOS) and dynamic tension (spall) test data for tungsten carbide. Williams [11]
investigates the role of phase changes on impact parameters using a tungsten carbide sphere
impacting a lead target. Impact velocities were in the range 2.7-8.3 km/sec, somewhat higher
than those considered by Grady [10], and crater parameters were reported. It was found that
both crater depth and crater diameter are linear functions of impact velocity, i.e., the
influence of phase changes is not reflected in these parameters. Wang, et al. [12] investigate
numerically and experimentally the low-speed (0.02-0.3 km/sec) impact behavior of a
tungsten carbide sphere into semi-infinite white cast iron targets. It appears the projectiles
were effectively rigid at this impact velocity level. Crater depth increased monotonically
with impact velocity. Finite Element simulations of plastic deformation and lip formation
were in excellent agreement with experimental measurements of crater diameter, depth and
lip height. FE predictions included predicting the stress state in the target developed during
impact.
Other recent work reported for sphere impact involves materials other than tungsten
carbide. Peters et al. [4] examined the effects of 1 and 3.2 mm diameter chrome-hardened

4
steel spheres on the fatigue life of Ti-6Al-4V. Fatigue cracks and high tensile residual
stresses were observed from the 0.2-0.3 km/sec impacts. Tanabe, et al. [13] report the
impact of a ferrite sphere into four types of semi-infinite carbon targets in the impact velocity
range of 0.6-1.5 km/sec. It was found in this experimental study that crater depth is mainly
controlled by the impact pressure (i.e., impact velocity) and the fracturing of the projectile.
Impacts of copper spheres into relatively thin hardened steel plates are reported by Grady and
Kipp [14] in a study of the mechanisms of breakup and disintegration of sphere and target.
The role of phase-change phenomena on sphere impact is reported by Hertel, et al. [15].
Considerable recent work has been reported on hypervelocity impact of spheres as
well. For example, Orphal [16] investigates penetrating projectile fragments for highly
oblique impact of stainless steel spheres on thin laminated targets. Piekutowski [17]
characterizes the sphere failure from plastic deformation through fracture and fragmentation
up to complete disintegration of the sphere at higher impact velocities. A crater depth study
for hypervelocity impact of a spherical projectile into a semi-infinite target is reported by
Hayhurst, et al. [18].
No studies appear to have been performed on high velocity impact of HSLA steels,
nor have any measurements of the residual stress state been performed on the targets
following an impact above 0.3 km/sec. It is therefore the purpose of this paper to present
results on the impact of tungsten carbide spheres on semi-infinite HSLA steel targets in the
high-velocity range of 0.8-2.5 km/sec. HSLA alloys are of interest because of their high
yield strength, toughness, and weldability, making them excellent candidates for the hulls on
naval ships and blast loaded structures.

5
A second emphasis of the paper is to examine numerically and experimentally the
residual stress state in the target material as a result of the impact and subsequent crater. The
residual stresses are examined because of their possible effect on the ability of armor or
turbine blades to survive multiple impacts or to survive future service loads when the original
impact event did not cause total failure. In this paper, the Contour Method by Prime [19]
was used to generate an experimentally measured map of sub-surface residual stresses from
the impact of the spherical ball. Finite element models were used to predict both the
geometry of the crater and the resulting residual stresses. Good comparisons are shown
between the measured data and numerical predictions.
Experiments
The plate material used in this study (see Figure 1) is a low carbon, copper
precipitation hardened, High-Strength Low-Alloy. This steel is often used for naval ship
hulls, armor, and containment structures. The chemical composition of HSLA-100 is given
in Table 1. The 51 mm thick plate material was prepared by hot cross-rolling. It was
Austenized at 900 ºC for 75 minutes and then water quenched. The plate was then tempered
at 660 ºC for 200 minutes followed by another water quench. A flame cut section of plate
measuring 148 mm wide and 457 mm long was used for the impact experiments described in
this study.
Tungsten carbide spheres were purchased from Machining Technologies, Inc. in
Elmore, Ohio. The 6.35 mm diameter spheres were composed of 94% tungsten carbide with
6% of a cobalt binder. The spheres were Grade 25, Class C-2 material, where the grade
6
refers to a roundness tolerance of 0.000025 of an inch and Class C-2 refers to material with a
hardness of 92 on the Rockwell A scale.
The steel plate was impacted normal to the plate surface by the small diameter
spheres with velocities ranging from 0.8-2.5 km/sec. The projectiles were fired from a 12.7-
mm (0.50-inch) smooth bore powder gun after being placed in a polyethylene obturator that
was specifically designed to release the projectile during flight. A pair of light screens,
which was placed between the gun and target, was used to measure the velocity of the
projectile. An angled stripper plate was located between the light screens and target to
further separate the projectile from the obturator. The impact events were spaced a minimum
of one plate thickness (51 mm) from each other along the 457 mm length of the target plate,
as shown in Figure 1, and both of the large 457 × 148 mm surfaces were used for
experiments. The target centers on each side were off-set, thus minimizing the potential for
the stress state associated with the craters on the back surface to influence the depth of
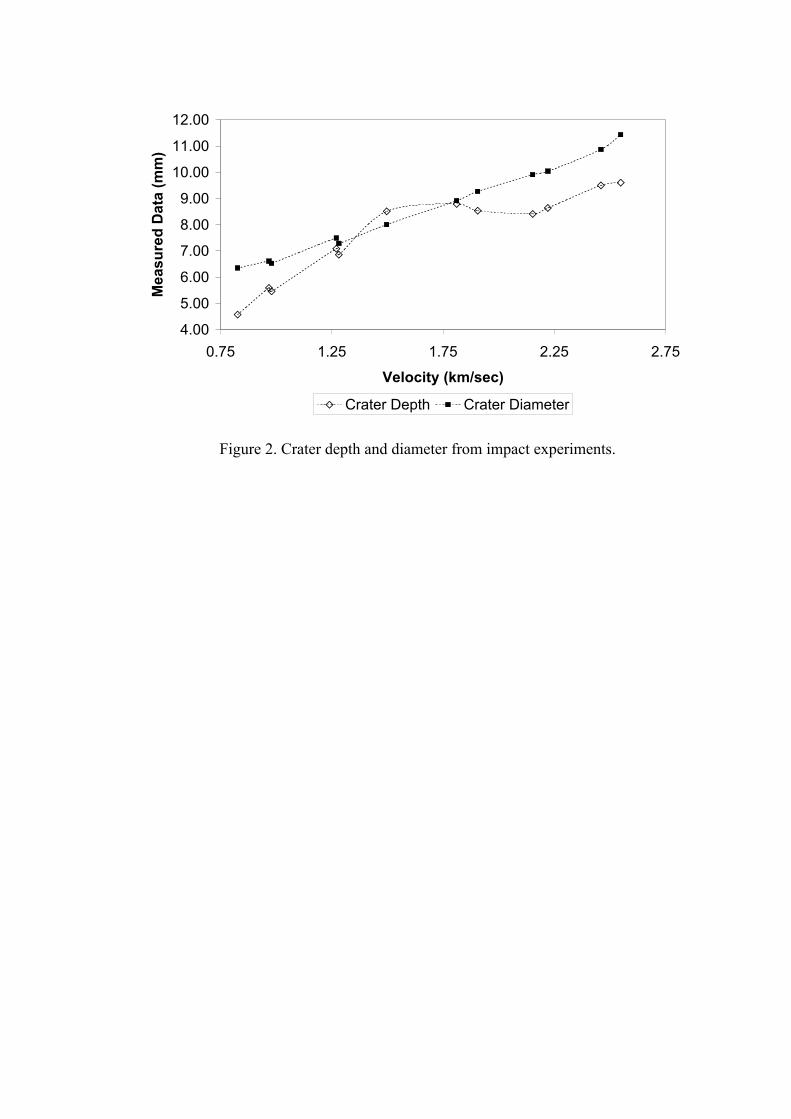
penetration on the front surface. The impact velocity, depth, width, and crater volume of the
resulting crater are shown in Table 2. The depth and width of the crater, which were
measured relative the planar surface of the plate, are plotted as a function of impact velocity
in Figure 2. It is interesting to note that the crater diameter is relatively linear with velocity,
while the depth of penetration appears to roll over at approximately 1.5 km/sec.
A qualitatively similar rollover of the penetration depth vs. velocity curve has been
reported elsewhere by Forrestal and Piekutowski [20] for the somewhat related situation
involving spherical-nose steel projectiles, although their partitioning of the response into
three regions as striking velocities increased is only partially valid for the brittle spherical
7
projectiles impacted in the present study. Hohler and Stilp [21] also present numerous
examples of this rollover, including for the closely related case of a projectile with length-to-
diameter ratio of 1.
The impacted region from the 2.2 km/sec experiment was later examined for residual
stresses. The resulting crater, which is shown in Figure 3, is approximately 10 mm in
diameter and 12 mm deep from the top of the lip to the bottom of the crater. The lip for the
2.2 km/sec crater is approximately 3.6 mm above the original planar surface.
Residual Stresses Measurements
The Contour Method [19] maps residual stresses using two experimental steps
followed by an analytical step. First, the material is carefully cut in two at the point of
interest. The cut surface deforms as residual stresses are released. Assuming the cut was
made on a flat plane, the deformed shape, or contour, is then uniquely related to the original
residual stresses. The second experimental step then measures the deformed shape, or
contour, of the cut surface. Assuming that stresses relaxed elastically because of the cut,
Bueckner’s Superposition Principle [22] says that the original residual stresses normal to the
cut plane are given analytically by the pressures required to force the deformed surface back
to a flat plane [19]. In practice, the same answer is given more conveniently by starting with
a flat surface in a finite element (FE) model and deforming the surface into the opposite of
the measured contour. Since the displacements are small, the same result is returned. The
ability of the contour method to accurately measure a complex stress state has been
experimentally validated by comparison with a known stress specimen [19] and by
8
comparison with neutron diffraction measurements on a welded plate [23]. Because of space
limitations in this paper, the reader is referred to other work [19] for details on the subtleties,
assumptions, and limitations of the contour method.
In this study on the penetrated plate, the cut to measure residual stress was made with
a Mitsubishi FX-10 wire Electric Discharge Machine (EDM) and a 150 µm diameter brass
wire. The test piece was cut through the center of the penetration crater, Figure 1, making a
cut surface approximately 51 mm × 148 mm. A fixture was constructed to clamp the plate on
both sides of the cutting plane to prevent the EDM wire from moving off the cut plane. The
148 mm long cut took nearly 13 hours to complete. “Skim cut” settings, which are normally
used for better precision and a finer surface finish, were used to minimize any recast layer
and cutting-induced stresses. Under such conditions, EDM cutting has been demonstrated to
not significantly affect residual stress measurement [24]. Contour method measurements on
a weldment with very high stresses were validated independently [23], which also gives
confidence that EDM cutting will not affect the residual stress measurements reported in this
paper.
After cutting and unclamping, the contours of both cut surfaces were measured using
a MS Impact II Coordinate Measuring Machine (CMM), which touches the surface with a
small trigger probe to map the surface contour. A 1 mm diameter spherical ruby tip was used
on the probe. The cut surfaces were measured on 0.5 mm spaced grids, giving about 29,000
points on each cut surface.
Figure 4 shows data points measured on one of the two halves after cutting. The
peak-to-valley range in the contour is about 150 µm. The most striking feature in the contour

9
is the large bump centered about one crater diameter below the impact crater. The contour on
the other half was very similar.
A test cut was made near the edge of the plate to validate the assumption of a planar
cut. The free-surface condition in this area should result in stresses, and thus deformations,
that are less than 10% of the values expected in the central region of the plate. The measured
contour from this cut was less than 6 µm peak-to-valley. This is consistent with our
expectations and thus validates our flat cut assumption.
The residual stresses were calculated from the measured surface contours using a
static, elastic FE model and the commercial code ABAQUS. A 3-D model was constructed
of one half of the plate, the condition after it had been cut in two, including the crater as a
pre-existing feature. The mesh was graded with a minimum element size of about 1 mm,
resulting in 116,980 linear shape–function (i.e., 8 node) brick elements and 375,408 degrees
of freedom. The material behavior for HSLA-100 was modeled as isotropic elastic with the
elastic modulus and Poisson’s ratio shown in Table 3.
In order to smooth out noise in the measured surface data and to enable evaluation at
arbitrary locations, the data were fitted to smoothing splines. A detailed description of this
process is given elsewhere [23], including how to objectively choose the amount of
smoothing and estimate the uncertainties in the calculated stresses. The spline fits to the
measured contour data were evaluated at a grid corresponding to the FE nodes, averaged
between the two sides, the signs reversed, and then applied as z-direction displacement
boundary conditions on the cut surface in the model. Three additional displacement
constraints were applied to prevent rigid body motions, and no other constrains or boundary
10
conditions are applied to the model. Figure 5 shows the deformed FE model, which as
explained shows the opposite of the measured contour of Figure 4. The surface stresses were
then obtained by evaluating the values of σz at the nodes of the surface elements and
averaging among all elements sharing a given surface node.
Numerical Model
The predicted residual stresses from the dynamic impact were estimated from an
explicit finite element calculation using LS-DYNA, which is a commercially available
Lagrangian code [25]. An axisymmetric finite-element model was generated for the analysis
of the plate and sphere using 4-node elements. The mesh for the ball consisted of 467
elements with an element size of approximately 0.2 mm. The mesh for the plate consisted of
22,500 elements, with a graded distribution. The smaller elements in the plate, which were
nearest the point of impact, had a minimum element size of 0.4 mm.
Our calculations used the most elementary hydrodynamic material model available in
LS-DYNA that utilizes both an Equation of State (EOS) and Failure. Both of the materials
used the same elastic-plastic hydrodynamic material model (Mat 10) in LS-DYNA with a
Grüneisen EOS. The implementation of this elementary hydrodynamic material model did
not include a pressure cutoff, or temperature and rate sensitivity, but simply a tabulated form
of the flow stress as a function of strain. Therefore, the flow stress for a given state of strain
was determined computationally by interpolation within the tabulated values. The
motivation for this was due in part to the availability of constitutive data for the materials of
interest. However, as will be shown later, the results were surprising good.
11
The flow stress data for the HSLA material were determined from Instron testing
performed at Los Alamos National Laboratory [26] and are presented Figure 6 for a strain-
rate of 0.001/s at 49°C. An elastic-perfectly plastic data set was used for the spheres based
on physical properties and ultimate strength published by Johnson [27]. Failure strains of 0.8
and 0.007 were respectively defined for the plate and sphere materials. However, the
material model used for this simulation does not conserve mass or energy when an element is
eroded at the specified failure strain. In addition, the tension spall option was activated for
the tungsten carbide. The constitutive properties for both materials are provided in Table 3.
The LS-DYNA simulations presented here are not sophisticated and are recognized to
have limitations with regard to variations in strain-rate, temperature, and failure. LS-DYNA
has more advanced models such as Johnson-Cook. However, these models were not used
due to the limited amount of constitutive data for the materials. Documented failure strains
were unavailable and credible values of 0.8 and 0.007 were arbitrarily selected.
The time step for the analysis was 2 nsec. A sequence of six images, illustrating a
section of the finite element mesh for the ball and plate, are shown Figure 7. The timeframe
illustrated in this figure spans from 0 to 11 µsec, at which time the ball has been completely
eroded and approximately 380 elements in plate have been eroded. The numerical
calculation was continued to 52 ms to obtain ensure a reasonably steady stress state for the
residual stress prediction.
ResultsThe numerical predictions for both crater width and depth are shown as a function of
velocity in Figures 8 and 9, respectively. The relationship between the crater depth and the

12
impact velocity is shown to be much more linear in numerical predictions than indicated by
the experimental data. The error in the values presented for the numerical predictions is on
the order of the element size, since an entire element is eroded at once and the depth of
penetration is based on the nodal position of the remaining elements. The resulting crater
shape from this impact is examined further in Figure 10 with a comparison between the finite
element model and the experimental data.
Figure 11A shows the map of residual stress (σz) measured by the contour method,
and Figure 11B shows the prediction from the finite element model, where the hoop stress in
the axisymmetric model corresponds with the measured σz. Good agreement between the
model and the measurements is especially evident in the region of compressive stress
centered about one crater diameter below the bottom of the crater. The size and shape of the
compressive region is similar between the prediction and the measurement. The model
predicted a peak compressive stress of 1100 MPa and the measurements gave a value of 1095
+/- 25 MPa. This agreement is excellent considering the highly nonlinear nature of the
impact event, the large range of strain rates and the localized temperatures experienced
during the impact. However, the model did not account for existing residual stresses in the
plate before the impact event, which are expected to alter the predictions. Note that the peak
σz compressive stress significantly exceeds the yield strength of about 720 MPa because the
stress is highly triaxial in this region, thus the effective stress is significantly lower than
maximum stress component. For the element with the peak hoop stress of -1100 MPa, the
model predicted radial stress of -696 MPa and axial (y) stress of -896 MPa, which, combined
with non-zero shear stresses, give an equivalent von Mises stress of only 500 MPa.

13
Individual residual-stress components exceeding the yield strength because of triaxiality have
been observed routinely, usually in tensile stress regions of welds [ \* MERGEFORMAT
28].
The agreement between the prediction and the measurement is less evident in other
regions of the stress map due to the initial residual stresses in the plate prior to the impact.
The numerical model assumed an initial stress free condition. Examination of Figure 11A
reveals a background residual stress distribution of compressive stress near the top and
bottom surfaces of the plate and tensile in the center, typical of quenching stresses.
To evaluate the effect of initial residual stresses, a stress map was measured on a plate
of HSLA-100 material that had not been impacted. Because it was the only piece available, a
60.75 mm thick plate was tested using the contour method. This plate underwent the same
processing and was expected to have very similar initial residual stresses to the 51 mm thick
plate used in the impact experiments. Figure 12 shows the measured stress map in the
thicker plate, which shows the expected quenching distribution of residual stresses. Note, the
stress map in Figure 12 does not show the same high tensile stresses at the +x and –x edges
as Figure 11A because the specimen measured for Figure 12 was saw cut along those edges
from a larger plate whereas the specimen used for Figure 11A had been flame cut. Flame
cutting, not surprisingly, produced much higher stresses.
A subsequent coarse attempt to account for the initial residual stresses proved to be
surprisingly effective at reconciling the model predictions with the measurements. The initial
residual stresses were not introduced directly into the LS-DYNA simulation due to resource
limitations. Subsequent work and enhanced calculations may consider this capability to

14
provide a more direct comparison between the experimental data and numerical predictions.
Therefore, a correction was made to the measured stress map presented here by subtracting
off the initial residual stresses. Such a subtraction implies the stress maps can be
superimposed, which obviously over-simplifies the highly nonlinear process. Nonetheless,
the resulting stress map shown in Figure 13A agrees remarkably well with the model
prediction of Figure 13B, where Figure 13B is an exact duplication of Figure 11B.
The residual stress results also confirm that the spacing between impact tests was
sufficient to avoid interaction between the tests. At one plate thickness (51 mm) away from
one impact site, the distance between tests, the residual stresses are essentially unaffected by
the penetration. Furthermore, the stresses are less affected on the side opposite the impact,
which justifies the experimental choice to use both sides of the target.
Conclusions & Observations
The complex cross-sectional residual-stress map in a penetrated plate was measured
using the contour method. The stress map probably could not have been measured with any
other technique because of the size of the specimen [29]. For example, measuring a
comparable stress map with neutron diffraction would not have been practical because of the
51 mm thickness of the plate.
The impact produced a region of compressive residual stress exceeding the material’s
yield strength, located about one crater diameter below the crater floor, which is balanced by
a region of tensile stresses located farther from the crater. This stress state may be a concern
for subsequent loading, particularly for the tensile region, which extends to the surface of the

15
part and thus provides an area for the initiation of a crack. This issue should be addressed in
a subsequent study.
The diameter and depth of penetration resulting from a high velocity impact by a
small diameter tungsten-carbide sphere have been shown and compared with numerical
predictions. The experimental data indicate that the diameter of the resulting crater increases
linearly as a function of impact velocity. However, the relationship between velocity and the
depth of penetration appears to be nonlinear over the velocity ranges studied here, in
qualitative agreement with experimental observations reported elsewhere by Forrestal and
Piekutowski [20] and by Stilp and Hohler [21]. A detailed physical explanation of the
nonlinear impact velocity/depth of penetration relationship is given in [20] based upon
experimental observations of penetration behavior of spherical-nose steel projectiles for a
range in impact velocities overlapping the work reported herein. As discussed in the
Experiments Section above, Forrestal and Piekutowski [20] identified three response regions
as striking velocities of the projectiles increased, using post-test radiographs of the targets.
However, these response regions are not fully applicable for the brittle spherical projectiles
impacted in the present study, notwithstanding the qualitative agreement in the general shape
of the penetration depth vs. velocity curve.
The data presented here are insufficient to fully explain this observation. Studies
discussed in the background above suggest that fragmentation behavior of spheres may vary
with velocity. Grady’s [10] experiments, which were conducted at velocities between 2.1-4.0
km/sec, suggest that the fragmentation cloud from higher velocity impacts is much more

16
dispersed with more radial separation at the front of the impact. Piekutowski [17] observed
similar behavior for aluminum spheres traveling between 2-4.6 km/sec and reported a failure
transition at velocities above 2.6 km/sec. These studies, in addition to phase change studies
by Williams [11] and Hertel et al. [15], may provide valuable insight into the penetration
behavior observed in Figure 9.
Overall, the explicit finite-element model gave excellent agreement with the residual
stress measurements for the single case investigated, especially considering the elementary
nature of the material model. Marginal agreement is shown for the crater geometry, and the
simulations did not predict the non-linear relationship observed in experimental data between
the depth of penetration and velocity. The model predictions may have been improved by
including the initial residual stresses in the plate in the calculations. The agreement in this
area may also have been affected by the spall or phase change phenomenon discussed above.
A strain-rate dependent constitutive model may also be important, particularly in this type of
calculation where the simulation spans from the high-velocity impact to the quasi-static state
of equilibrium. Future work should include more realistic failure parameters based on
physical data as well as more physically based strength, damage, and failure models.
Acknowledgement
This work was performed at Los Alamos National Laboratory, operated by the
University of California for the United States Department of Energy under contract W-7405-
ENG-36.
17
References
[1] Cowles BA. High cycle fatigue in aircraft gas turbines: An industry perspective. Int JFract 1996; 80(2-3): 147-163.
[2] Mall S, Hamrick JL, Nicholas T. High cycle fatigue behavior of Ti-6Al-4V withsimulated foreign object damage. Mech Mater 2001; 33(11): 679-692.
[3]Thompson SR, Ruschau JJ, Nicholas T. Influence of residual stresses on high cyclefatigue strength of Ti-6Al-4V subjected to foreign object damage. Int J Fatigue 2001;23(SS): S405-S412.
[4] Peters JO, Boyce BL, Chen X, McNaney JM, Hutchinson JW, Ritchie RO. On theapplication of Kitagawa-Takahashi diagram to foreign-object damage and high-cyclefatigue. Eng Fracture Mech 2002; 69 (13): 1425-1446.
[5] Chen X, Hutchinson JW. Particle impact on metal substrates with application to foreignobject damage to aircraft engines. J. Mech Phys Solids 2002; 50 (12): 2669-2690.
[6] Lanciotti A, Ottaviano S. Some fracture mechanics properties in high-velocity impact-damaged aluminium plates: Fatigue Fract Engng Mater Struct 2001; 24(6): 419-427.
[7]Reimers W, Broda M, Brusch G, Dantz D, Liss KD, Pyzalla A, Schmackers T,Tschentscher T. Evaluation of residual stresses in the bulk of materials by high energysynchrotron diffraction: J Nondes Eval 1998; 17(3): 129-140.
[8]Webster PJ, Oosterkamp LD, Browne PA, Hughes DJ, Kang WP, Withers PJ, VaughanGBM. Synchrotron X-ray residual strain scanning of a friction stir weld: J Strain AnalEngng Des 2001; 36(1): 61-70.
[9] Boyce BL, Chen X, Hutchinson JW, Ritchie RO. The residual stress state due to aspherical hard-body impact: Mech Mater 2001; 33(8): 441-454.
[10] Grady DE. "Impact failure and fragmentation properties of tungsten carbide", Int. J.Impact Engineering, 1999; 23(1): 307-317.
[11] Williams AE. "The effect of phase changes on target response", Int. J. ImpactEngineering, Vol. 1995; 17: 937-947.
[12] Wang A, De Souza UJ and Rack HJ. "Impact deformation and damage of a highchromium white cast iron by spherical projectile at normal incidence:", Wear, 1991; 151:157-173.
18
[13] Tanabe Y, Saitoh T, Akatsu T, and Sawaoka A. "Crater formation of carbon materialsby impact of a high velocity sphere", Carbon, Bol. 33, 1995; 11: 1547-1552.
[14] Grady DE and Kipp ME. "Experimental and computational Simulation of the HighVelocity Impact of Copper Spheres on Steel Plates", Int. J. Impact Engineering, 1994; 15:645-660.
[15] Hertel ES Jr., McIntosh RL, and Patterson BC. "A comparison of phase changephenomena in cth with experimental data", Int. J. Impact Engineering, 1995; 17: 399-408.
[16] Orphal DL. "Highly oblique impact and penetration of thin targets by steel spheres",Int. J. Impact Engineering, 1999; 23(1): 687-698.
[17] Piekutowski AJ. "Fragmentation of a sphere initiated by hypervelocity impact with athin sheet", Int. J. Impact Engineering, 1995; 17: 627-638.
[18] Hayhurst CJ, Ranson HJ, Gardner DJ, and Birnbaum NK. "Modelling of microparticlehypervelocity oblique impacts on thick targets", Int. J. Impact Engineering, 1995; 17:375-386.
[19] Prime MB. Cross-sectional mapping of residual stresses by measuring the surfacecontour after a cut. J. Engng. Mater. Tech. 2001; 123(2): 162–168.
[20 ] Forrestal MJ, Piekutowski AJ. Penetration experiments with 6061-t6511 aluminumtargets and spherical-nose steel projectiles at striking velocities between 0.5 and 3.0km/s. Int J Impact Eng 2000;24:57-67.
[21] Stilp AJ, Hohler V. Long-rod penetration mechanics. In: J.A. Zukas, editor. Highvelocity impact dynamics. New York, NY: Wiley, 1990 [Chapter 5].
[22] Bueckner HF. The propagation of cracks and the energy of elastic deformation. TransAmer Soc Mech Engineers 1958; (80): 1225–1230.
[23] Prime MB, Sebring RJ, Edwards, JM, Hughes JD, Webster PJ. Laser surface-contouring and spline data-smoothing for residual stress measurement. Exptl Mech;submitted 2003.
[24]Cheng W, Finnie I, Gremaud M, Prime MB. Measurement of near-surface residual-stresses using electric-discharge wire machining. J. Engng Mater Tech 1994; 116(1): 1-7.
19
[25] LS-DYNA. Version 950, Users Manual, Livermore Software Technology Corporation,June 1997.
[26] Chen SR. private communication.
[27] Johnson AE Jr.. National Advisory Committee for Aeronautics, Technical Note 3309,(1954).
[28] Webster GA, Ezeilo AN. Residual stress distributions and their influence on fatiguelifetimes. I. J. Fracture 2001; 23(SS): S375-S383.
[29] Withers PJ, Bhadeshia HKDH. Overview : Residual stress part 1 : Measurementtechniques. Mat Sci & Tech 2001; 17(4): 355-365.

Table 1. Chemical composition of HSLA-100 steel plate in wt-%.
Fe C Mn P S Cu Si Ni Cr Mo V Ti Al
92.6 0.06 0.85 0.005 0.002 1.56 0.26 3.45 0.56 0.58 0.003 0.001 0.025

Table 2. Impact velocity and resulting crater diameter, depth, and volume from impact
experiments.
Shot Velocity Diameter Depth Volume# (km/sec) (mm) (mm) (ml)1 0.83 6.35 4.57 0.112 0.97 6.60 5.59 0.173 0.98 6.53 5.46 0.164 1.27 7.49 7.09 0.245 1.28 7.29 6.86 0.266 1.50 8.00 8.51 0.357 1.81 8.92 8.79 0.58 1.91 9.27 8.53 0.59 2.15 9.91 8.41 0.7310* 2.22 10.03 8.64 0.6611 2.46 10.87 9.50 0.9312 2.55 11.43 9.60 1
* Experiment selected for residual stress comparison
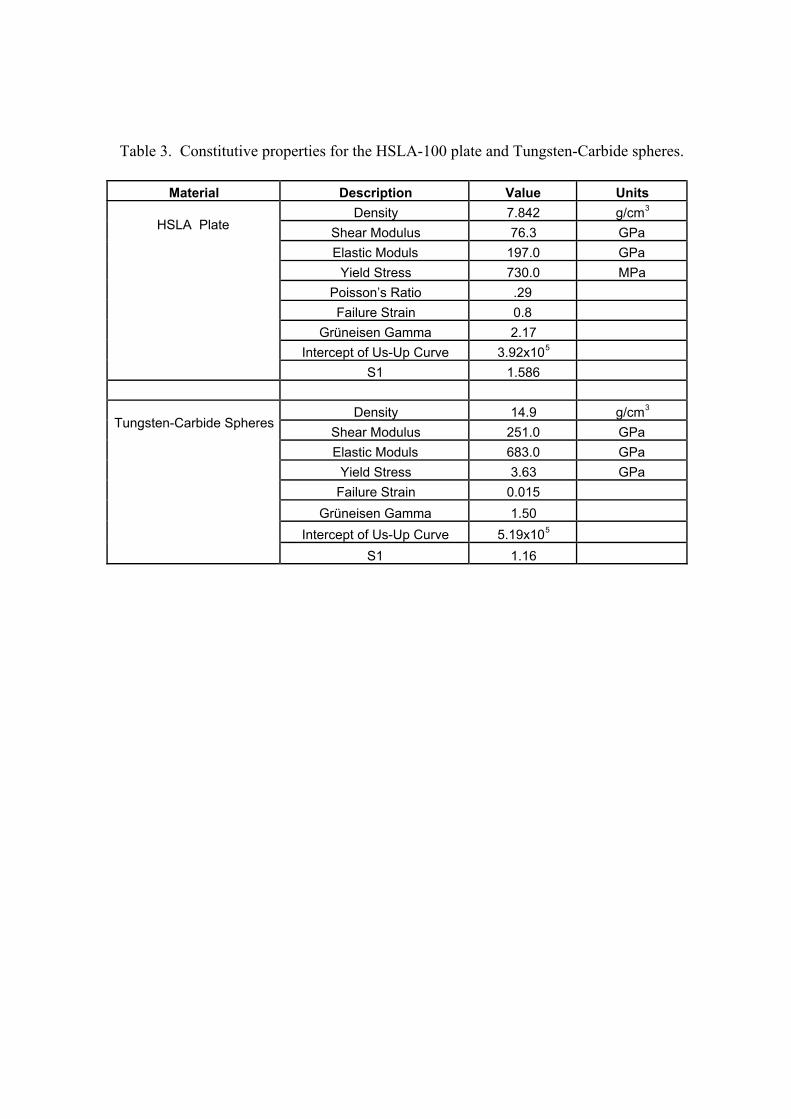
Table 3. Constitutive properties for the HSLA-100 plate and Tungsten-Carbide spheres.
Material Description Value Units
Density 7.842 g/cm3
Shear Modulus 76.3 GPa
Elastic Moduls 197.0 GPa
Yield Stress 730.0 MPa
Poisson’s Ratio .29
Failure Strain 0.8
Grüneisen Gamma 2.17
Intercept of Us-Up Curve 3.92x10⁵
HSLA Plate
S1 1.586
Density 14.9 g/cm3
Shear Modulus 251.0 GPa
Elastic Moduls 683.0 GPa
Yield Stress 3.63 GPa
Failure Strain 0.015
Grüneisen Gamma 1.50
Intercept of Us-Up Curve 5.19x10⁵
Tungsten-Carbide Spheres
S1 1.16
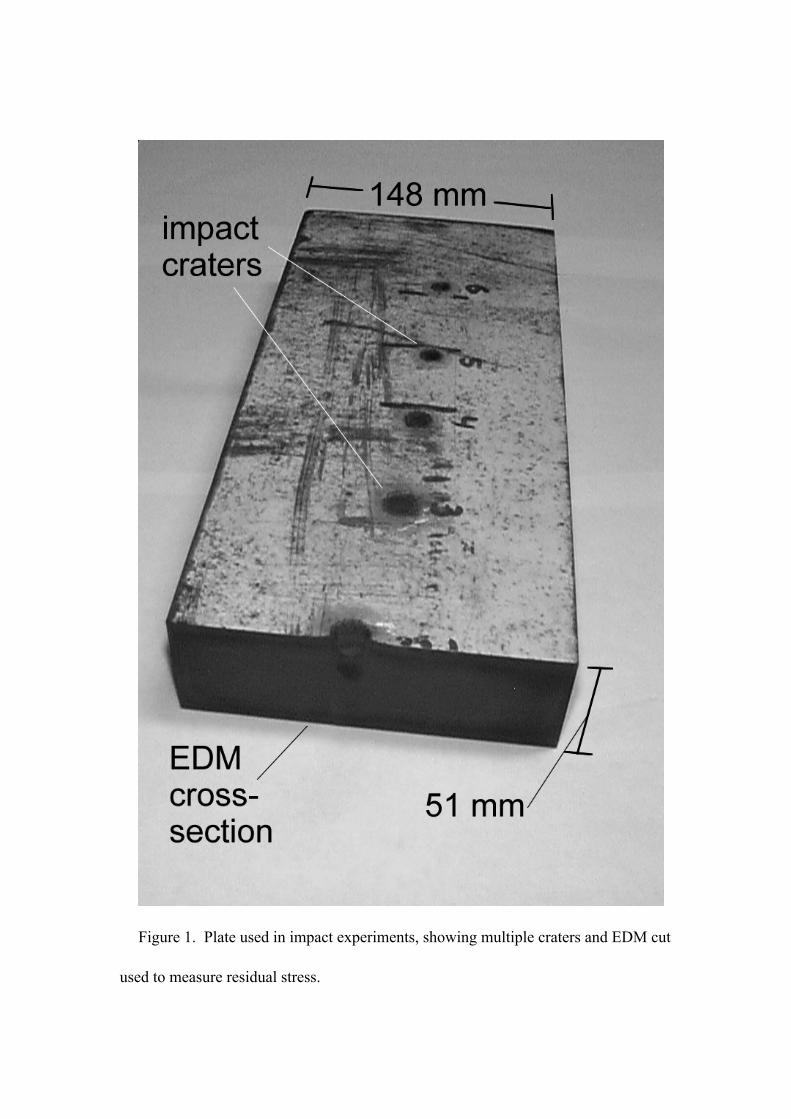
Figure 1. Plate used in impact experiments, showing multiple craters and EDM cut
used to measure residual stress.
4.00
5.00
6.00
7.00
8.00
9.00
10.00
11.00
12.00
0.75 1.25 1.75 2.25 2.75
Velocity (km/sec)
Mea
sure
d D
ata
(mm
)
Crater Depth Crater Diameter
Figure 2. Crater depth and diameter from impact experiments.
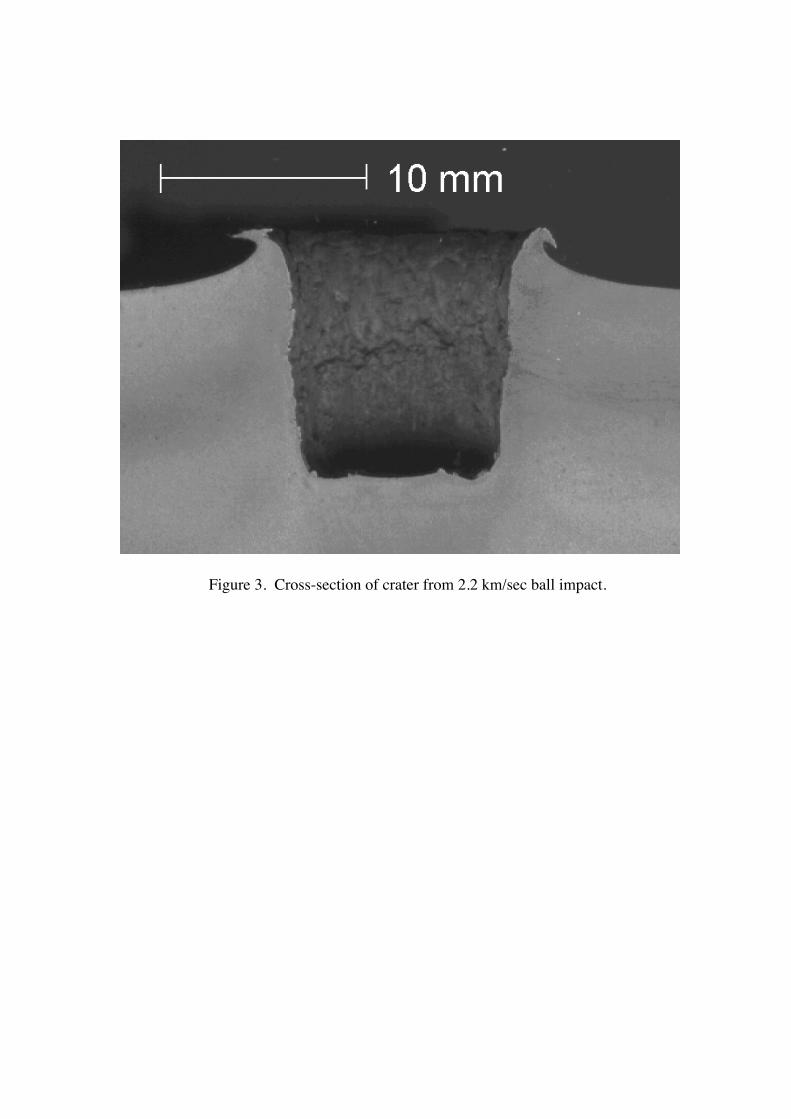
Figure 3. Cross-section of crater from 2.2 km/sec ball impact.
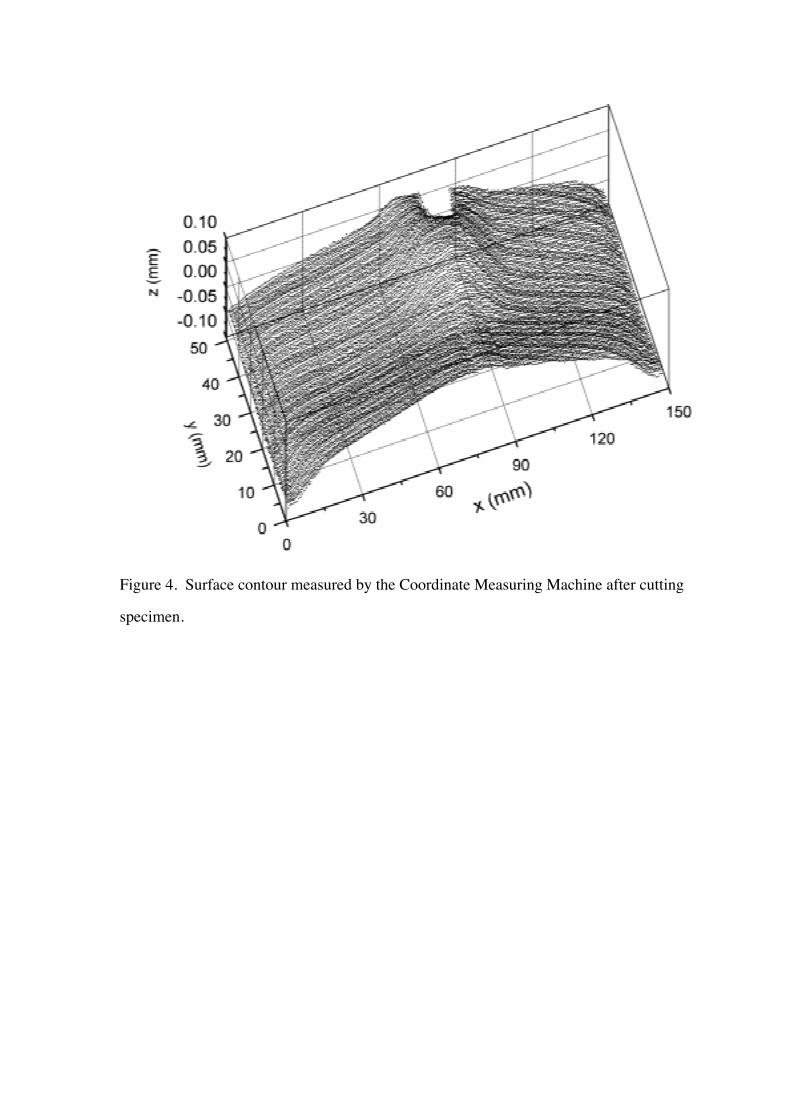
Figure 4. Surface contour measured by the Coordinate Measuring Machine after cutting
specimen.
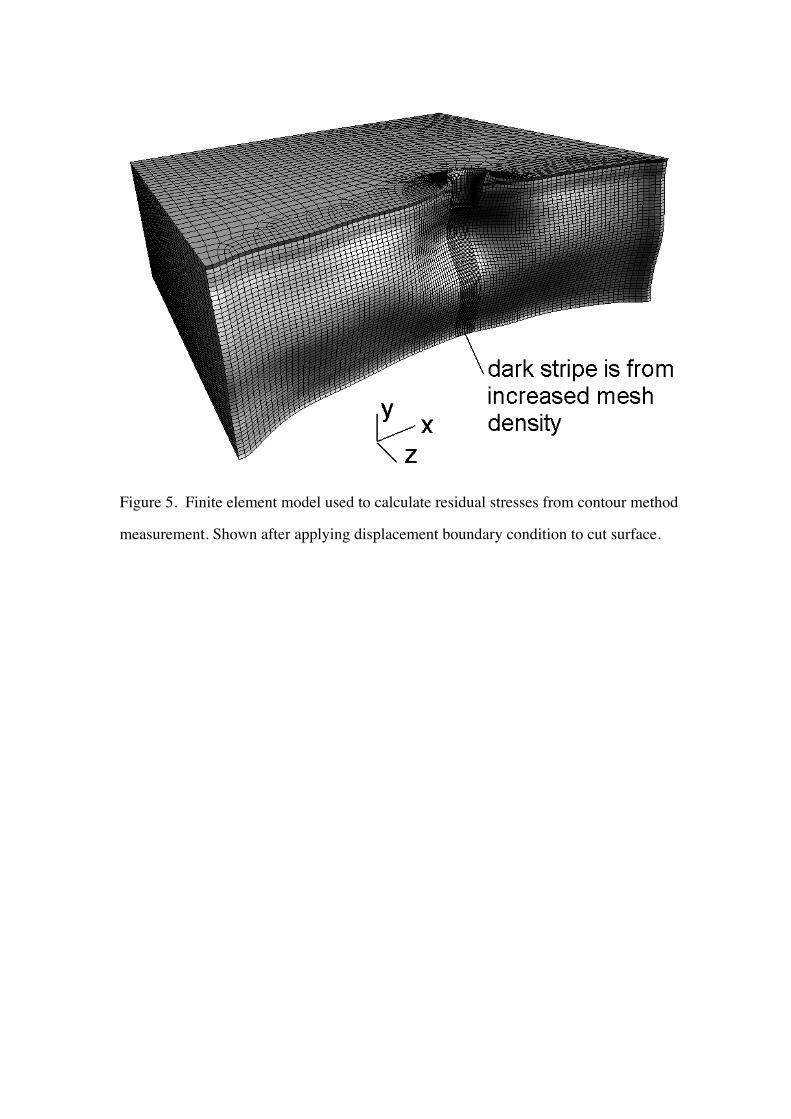
Figure 5. Finite element model used to calculate residual stresses from contour method
measurement. Shown after applying displacement boundary condition to cut surface.

0
200
400
600
800
1000
1200
0 0.05 0.1 0.15 0.2 0.25 0.3
Strain
Str
ess
(MP
a)
Figure 6. Flow Stress for HSLA-100 plate for a strain-rate of 0.001/s at 49°C [26].
Figure 7. Section of the Finite Element Mesh Illustrating Element Erosion from
0-11 µsec
2.0 µs 4.0 µs
6.0 µs 8.0 µs 11.0 µs
0.0 µs
5
6
7
8
9
10
11
12
0.5 1.0 1.5 2.0 2.5 3.0
Velocity (km/sec)
Cra
ter
Dia
met
er (
mm
)
Experimental Data Numerical Results
Figure 8. Crater Diameter from experimental data and numerical model.
5
6
7
8
9
10
11
12
13
14
0.5 1.0 1.5 2.0 2.5 3.0
Velocity (km/sec)
Cra
ter
Dep
th (
mm
)
Experimental Data Numerical Results
Figure 9. Crater depth from experimental data and numerical model.

Figure 10. Measured and calculated crater shape from 2.2 km/sec ball impact.
Figure 11. Residual stresses in HSLA-100 plate after penetration by tungsten carbide
sphere. A. Measured by contour method. B. Hoop stress prediction from lagrangian,
explicit, axisymmetric model, shown on half of cross-section.

Figure 12. Residual stress map measured in as-received plate by contour method, shows
original quenching stresses. Scale is the same as shown in Figure 11.
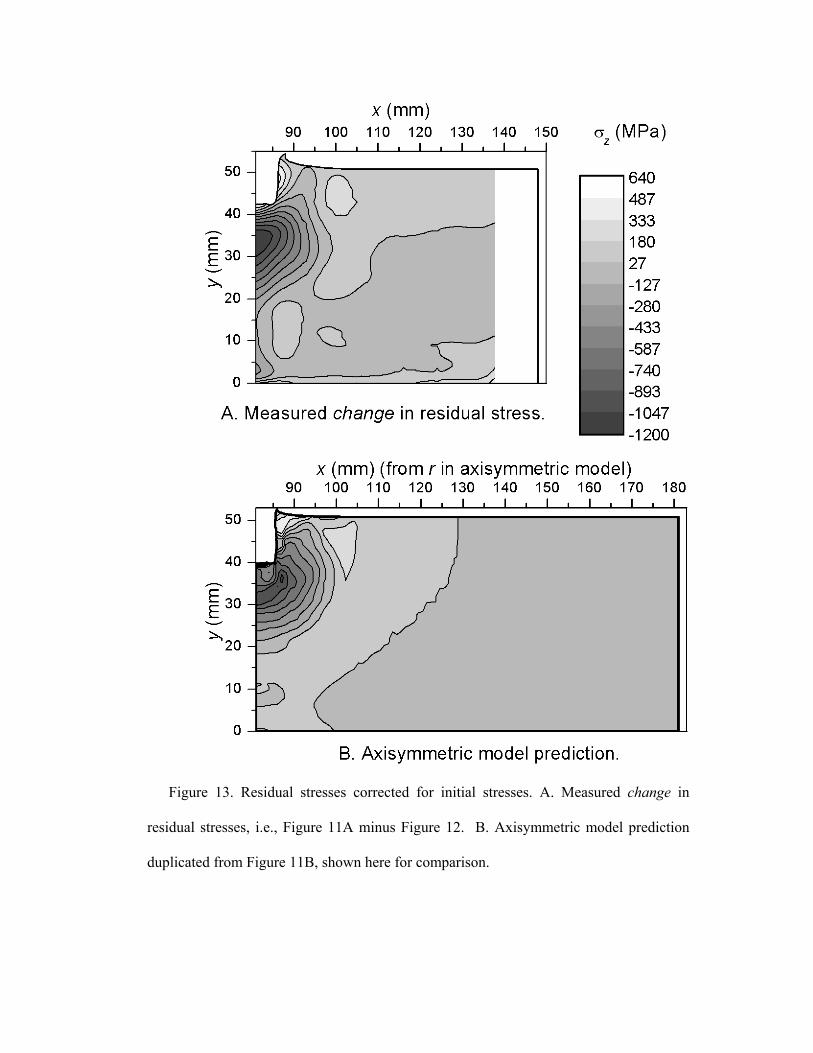
Figure 13. Residual stresses corrected for initial stresses. A. Measured change in
residual stresses, i.e., Figure 11A minus Figure 12. B. Axisymmetric model prediction
duplicated from Figure 11B, shown here for comparison.