L1. Gel time and peak exothermic temperature of ...users.encs.concordia.ca/~hoasuon/MECH...
21
1 L1. Gel time and peak exothermic temperature of thermosetting resins 1. Aim Familiarize with vinyl ester resins (manipulation, curing, cleaning/disposal) and measure their gel time and peak exothermic temperature. 2. Introduction Gel time and peak exothermic temperature are two of most important parameters for a thermosetting material processor [1]. Gel time is the interval of time between introduction of catalyst and the formation of gel. Such information regarding viscosity change with time of resin-catalyst mixture helps to determine working-life characteristics of the material. The maximum temperature reached by reacting thermosetting plastic composition is called peak exothermic temperature. Resin producing high exothermic heat susceptible to cure shrinkage and craze cracking. This is due to the thermal expansion that occurs as the heat is generated and shrinkage that takes place when thermosetting three-dimensional network forms. The American Society for Testing and Materials proposes two standards to characterize thermosetting resins: one is the ASTM D2471 – based on hand-probing for the gel time and thermocouple for recording the peak exothermic temperature [2], and the other is ASTM D3056 – uses a gel-time apparatus that detects the gel time based on a torsion wire [3]. Since the gel time and the peak exothermic temperature of a reacting thermosetting plastic composition vary with the volume of material mixed at one time, it is essential that the volume be specified in any determination. By selection of an appropriate volume, gel time and peak exothermic data may be obtained in sufficiently precise and reproducible form or application evaluation, quality control, and material characterization of a thermosetting plastic composition [2]. Vinyl ester resins (VERs) [4] are largely applied as matrix systems in high-performance fiber reinforced composites, and will be used in the experiment. Styrenated vinyl resins can be cured by either room temperature (RT) or heatcuring methods. RT curing systems are usually based on transition metal soaps (cobalt naphthenate) as the primary promoters and ketone peroxides (methyl ethyl ketone peroxide (MEKP)) as the catalysts. Many commercial resins are double promoted in that they contain not only metallic primary promoters, but also secondary promoters – accelerators (tertiary amines such as diethylaniline (DEA)). Their function to (1) speed up the cure after gelation, and (2) help stabilize the gel-time drift on aging that often occurs with single cobalt- promoted resins. In order to increase the gel time retarders are also used (2, 4- Pentadione).
Transcript of L1. Gel time and peak exothermic temperature of ...users.encs.concordia.ca/~hoasuon/MECH...

1
L1. Gel time and peak exothermic temperature of thermosetting resins
1. Aim
Familiarize with vinyl ester resins (manipulation, curing, cleaning/disposal) and measure their gel time and
peak exothermic temperature.
2. Introduction
Gel time and peak exothermic temperature are two of most important parameters for a thermosetting material
processor [1]. Gel time is the interval of time between introduction of catalyst and the formation of gel. Such
information regarding viscosity change with time of resin-catalyst mixture helps to determine working-life
characteristics of the material. The maximum temperature reached by reacting thermosetting plastic composition
is called peak exothermic temperature. Resin producing high exothermic heat susceptible to cure shrinkage and
craze cracking. This is due to the thermal expansion that occurs as the heat is generated and shrinkage that takes
place when thermosetting three-dimensional network forms.
The American Society for Testing and Materials proposes two standards to characterize thermosetting resins: one
is the ASTM D2471 – based on hand-probing for the gel time and thermocouple for recording the peak exothermic
temperature [2], and the other is ASTM D3056 – uses a gel-time apparatus that detects the gel time based on a
torsion wire [3].
Since the gel time and the peak exothermic temperature of a reacting thermosetting plastic composition vary with
the volume of material mixed at one time, it is essential that the volume be specified in any determination. By
selection of an appropriate volume, gel time and peak exothermic data may be obtained in sufficiently precise
and reproducible form or application evaluation, quality control, and material characterization of a thermosetting
plastic composition [2].
Vinyl ester resins (VERs) [4] are largely applied as matrix systems in high-performance fiber reinforced composites,
and will be used in the experiment. Styrenated vinyl resins can be cured by either room temperature (RT) or
heatcuring methods. RT curing systems are usually based on transition metal soaps (cobalt naphthenate) as the
primary promoters and ketone peroxides (methyl ethyl ketone peroxide (MEKP)) as the catalysts.
Many commercial resins are double promoted in that they contain not only metallic primary promoters, but also
secondary promoters – accelerators (tertiary amines such as diethylaniline (DEA)). Their function to (1) speed up
the cure after gelation, and (2) help stabilize the gel-time drift on aging that often occurs with single cobalt-
promoted resins. In order to increase the gel time retarders are also used (2, 4- Pentadione).
2
3. Materials and equipment
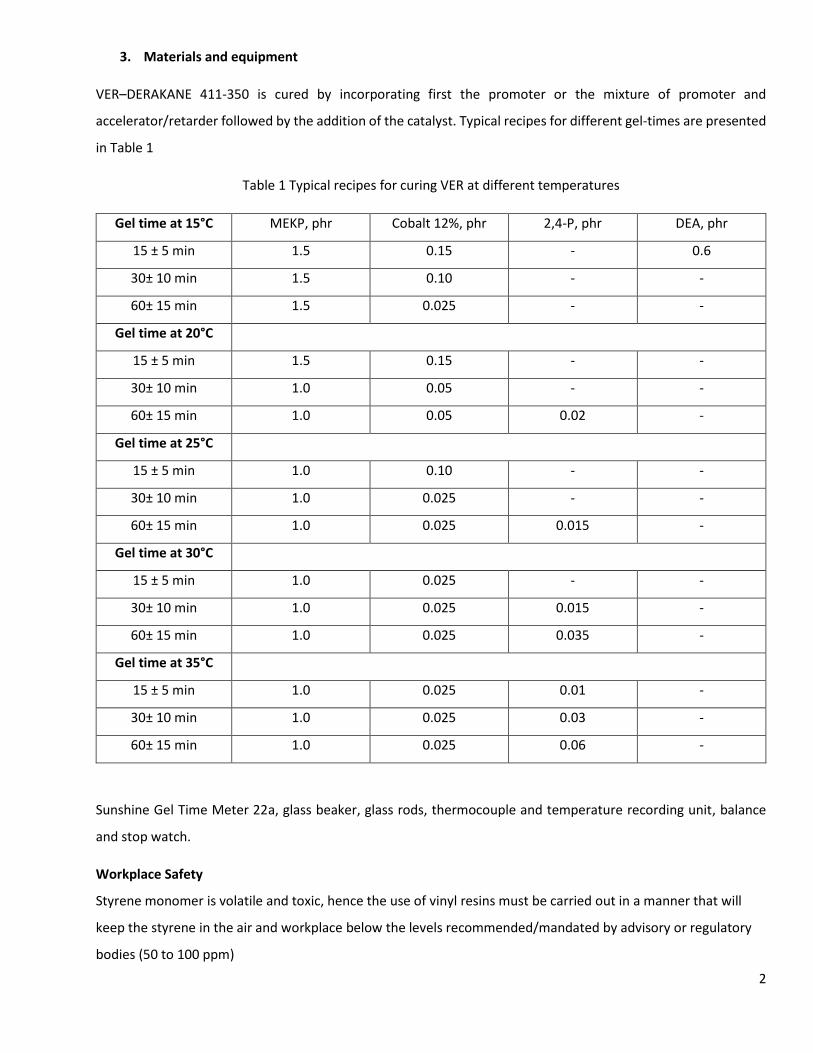
VER–DERAKANE 411-350 is cured by incorporating first the promoter or the mixture of promoter and
accelerator/retarder followed by the addition of the catalyst. Typical recipes for different gel-times are presented
in Table 1
Table 1 Typical recipes for curing VER at different temperatures
Gel time at 15°C MEKP, phr Cobalt 12%, phr 2,4-P, phr DEA, phr
15 ± 5 min 1.5 0.15 - 0.6
30± 10 min 1.5 0.10 - -
60± 15 min 1.5 0.025 - -
Gel time at 20°C
15 ± 5 min 1.5 0.15 - -
30± 10 min 1.0 0.05 - -
60± 15 min 1.0 0.05 0.02 -
Gel time at 25°C
15 ± 5 min 1.0 0.10 - -
30± 10 min 1.0 0.025 - -
60± 15 min 1.0 0.025 0.015 -
Gel time at 30°C
15 ± 5 min 1.0 0.025 - -
30± 10 min 1.0 0.025 0.015 -
60± 15 min 1.0 0.025 0.035 -
Gel time at 35°C
15 ± 5 min 1.0 0.025 0.01 -
30± 10 min 1.0 0.025 0.03 -
60± 15 min 1.0 0.025 0.06 -
Sunshine Gel Time Meter 22a, glass beaker, glass rods, thermocouple and temperature recording unit, balance
and stop watch.
Workplace Safety
Styrene monomer is volatile and toxic, hence the use of vinyl resins must be carried out in a manner that will
keep the styrene in the air and workplace below the levels recommended/mandated by advisory or regulatory
bodies (50 to 100 ppm)

3
4. Procedure
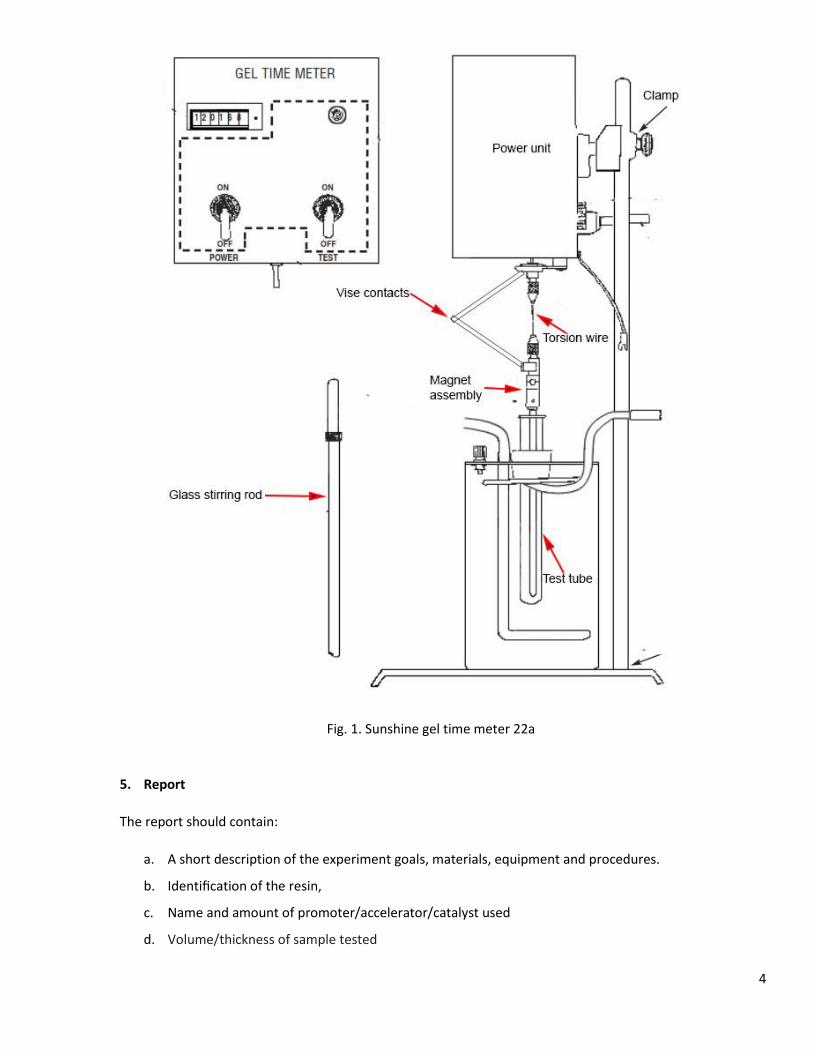
4.1. Set up the Sunshine Gel Time Meter and the computer for the temperature recording
Use the 3/32” gage to set the distance between the vises. The motor is rotating counter clockwise,
therefore the lower vise should be behind the upper one.
4.2. Resin preparation:
- weigh 80 g of resin to the nearest 0.01 g
- calculate the amount of promoter (CoNaph) and catalyst (MEKP) according to Table 1
- weigh into the resin the promoter and mix it for 2 min and avoid entrapping air
- weigh into the mixture the catalyst, mix it for 1 min and start the stop watch
- weigh 9.5 to 10.5 grams of catalyzed resin into a test tube
- the rest of the mixture will be used to determine manually the gel-time and to measure the peak
exothermic temperature
4.3. ATTENTION steps number 4.4 and 4.9 are starting simultaneously.
4.4. Place the test tube into the bath and connect the spindle to the magnetic assembly (figure 1).
4.5. Turn ON the POWER switch. The motor assembly will begin rotating at 1 rpm.
4.6. Adjust the height of the glass rod at ¼” from the bottom of the test tube, by adjusting the clamp on the
back of the power unit. Also make sure that the rod is centered in the test tube.
4.7. Turn ON the TEST switch. The contact vise assembly is energized. The process continues until the resin in
the test tube “gels” enough to cause the vise contact to touch each other. Then, the timer will stop
indicating the gel-time and the buzzer will beep. The buzzer can be silenced by shutting of the TEST switch.
4.8. Turn OFF the POWER switch, detach the spindle from the magnetic assembly, remove the glass rod from
the mixture and clean it for future use.
4.9. Insert a thermocouple into the geometric center of the mixture and start the temperature logging
software
4.10. Every 15 s, probe the center surface of the reacting mass, with the applicator stick perpendicular to the
material surface.
4.11. When the reacting material no longer adheres to the end of a clean probe, record the “gel time” as the
elapsed time from the start of mixing
4.12. Continue recording the time and temperature until the temperature starts to drop. Record the highest
temperature reached as the “peak exothermic temperature.” Record the “peak exothermic time” as the
elapsed time from the start of mixing.
4
Fig. 1. Sunshine gel time meter 22a
5. Report
The report should contain:
a. A short description of the experiment goals, materials, equipment and procedures.
b. Identification of the resin,
c. Name and amount of promoter/accelerator/catalyst used
d. Volume/thickness of sample tested
5
e. Temperature of the bath and the liquid used
f. Gel time to the nearest 0.1 min (D3056) 0.5 min (D2471)
g. Peak exothermic temperature, to the nearest 1°C
h. and peak exothermic time, to the nearest 1 min
6. References
[1] Handbook of Plastics Testing and Failure Analysis, Vishu Shah, Wiley-Interscience 2007, pg. 214
[2] ASTM D2471-99 Standard Test Method for Gel Time and Peak Exothermic Temperature of Reacting
Thermosetting Resins (Withdrawn 2008)
[3] ASTM D3056 - 05(2010) Standard Test Method for Gel Time of Solventless Varnishes
[4] Handbook of Thermoset Plastics (Third Edition), Sydney H. Goodman, Hanna Dodiuk-Kenig Eds, Elsvier, 2014,
pg 125 (http://www.sciencedirect.com/science/book/9781455731077)

1
L2. Differential Scanning Calorimetry of thermoset resins
1. Aim
Familiarize with the DSC, sample preparation, temperature programming and data analysis
2. Introduction
Thermal analysis describes the techniques used in characterizing materials by measuring a physical property as a
function of temperature or time at a constant temperature or as function of temperature [1].
Differential scanning calorimetry (DSC) measures the energy absorbed (endotherm) or produced (exothermic) as
a function of time or temperature. DSC is a technique that measures the difference in the heat flow to a sample
and to a reference sample as a direct function of time or temperature under heating, cooling or isothermal
conditions. It is used to characterize melting, crystallization, resin curing, loss of solvents and other processes
involving an energy change. DSC may also be applied to processes involving a change in heat capacity, such as
glass transition.
Figure 1 shows the typical heat-flux DSC. The components are the (1) disk, (2) furnace, (3) lid, (4) differential
thermocouple(s), (5) programmer and controller, (S) crucible with sample substance, and (R) crucible with
reference sample substance. The heat flow rate from the furnace to the sample crucible is ϕFS; ϕFR is the heat flow
rate from the furnace to the reference sample crucible; ϕm is the measured heat flow rate; and K is the
temperature dependent calibration factor.
Fig. 1 Heat flux DSC
2
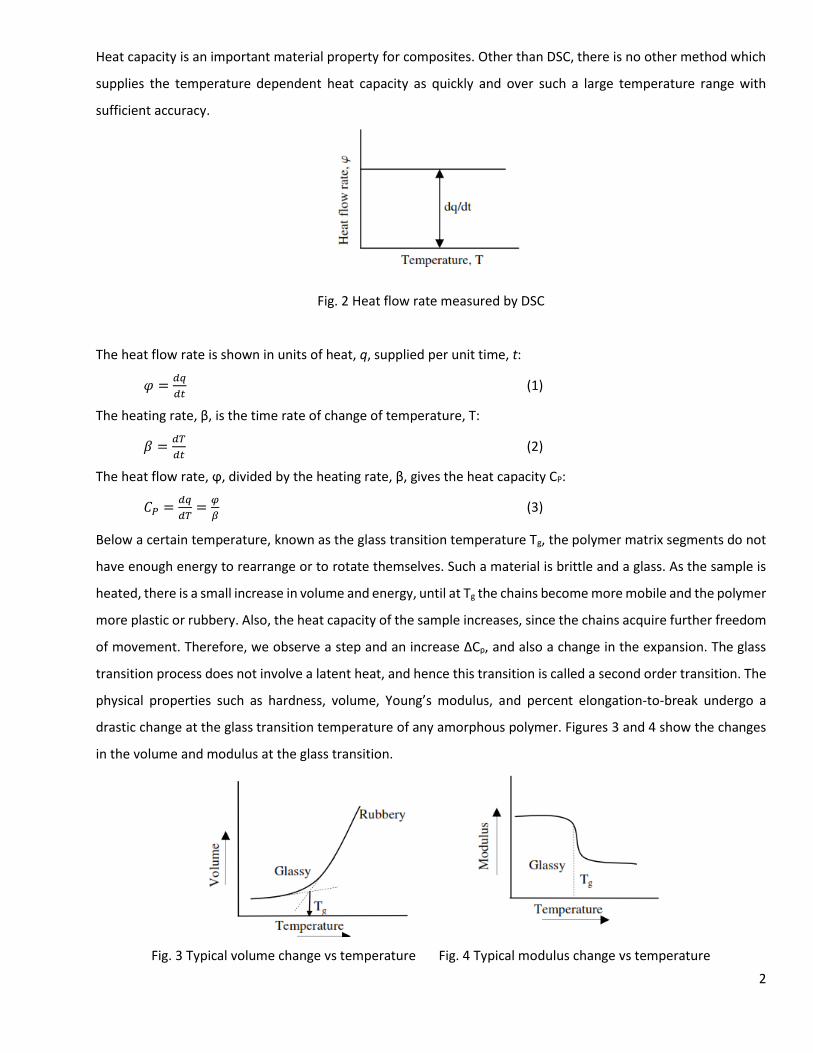
Heat capacity is an important material property for composites. Other than DSC, there is no other method which
supplies the temperature dependent heat capacity as quickly and over such a large temperature range with
sufficient accuracy.
Fig. 2 Heat flow rate measured by DSC
The heat flow rate is shown in units of heat, q, supplied per unit time, t:
𝜑 =𝑑𝑞
𝑑𝑡 (1)
The heating rate, β, is the time rate of change of temperature, T:
𝛽 =𝑑𝑇
𝑑𝑡 (2)
The heat flow rate, ϕ, divided by the heating rate, β, gives the heat capacity CP:
𝐶𝑃 =𝑑𝑞
𝑑𝑇=
𝜑
𝛽 (3)
Below a certain temperature, known as the glass transition temperature Tg, the polymer matrix segments do not
have enough energy to rearrange or to rotate themselves. Such a material is brittle and a glass. As the sample is
heated, there is a small increase in volume and energy, until at Tg the chains become more mobile and the polymer
more plastic or rubbery. Also, the heat capacity of the sample increases, since the chains acquire further freedom
of movement. Therefore, we observe a step and an increase ΔCp, and also a change in the expansion. The glass
transition process does not involve a latent heat, and hence this transition is called a second order transition. The
physical properties such as hardness, volume, Young’s modulus, and percent elongation-to-break undergo a
drastic change at the glass transition temperature of any amorphous polymer. Figures 3 and 4 show the changes
in the volume and modulus at the glass transition.
Fig. 3 Typical volume change vs temperature Fig. 4 Typical modulus change vs temperature

3
The glass transition region occurs over a temperature range. So, Tg is typically defined as the point of inflection
of the DSC curve, as illustrated in Figure 5. ASTM Standard Test Method E1356-03 gives further guidelines for
assigning the glass transition temperature using DSC [2].
Fig 5 Heat flow rate measured by DSC showing practical determination of Tg
3. Materials and equipment
TA Q200 DSC, pans and lids, ground cured resin composite.
Fig. 6 TA Q200 DSC
Fig. 7 DSC furnace (left) and sample pan + lid (right)
4
4. Procedure
4.1. DSC setup
- Open the Nitrogen valve
- Start the cooling system
4.2. Sample preparation
- Use drilling to grind some cured resin
- Tare an empty pan and weigh 10 mg of ground resin to the nearest 0.1 mg
- Cover the pan with the lid and use the TA press to close it.
4.3. Temperature program
- In order to erase the temperature history of the sample a heat-cool-heat cycle will be used
- Heating rate 10°C/min
- Cooling rate 10°C/min
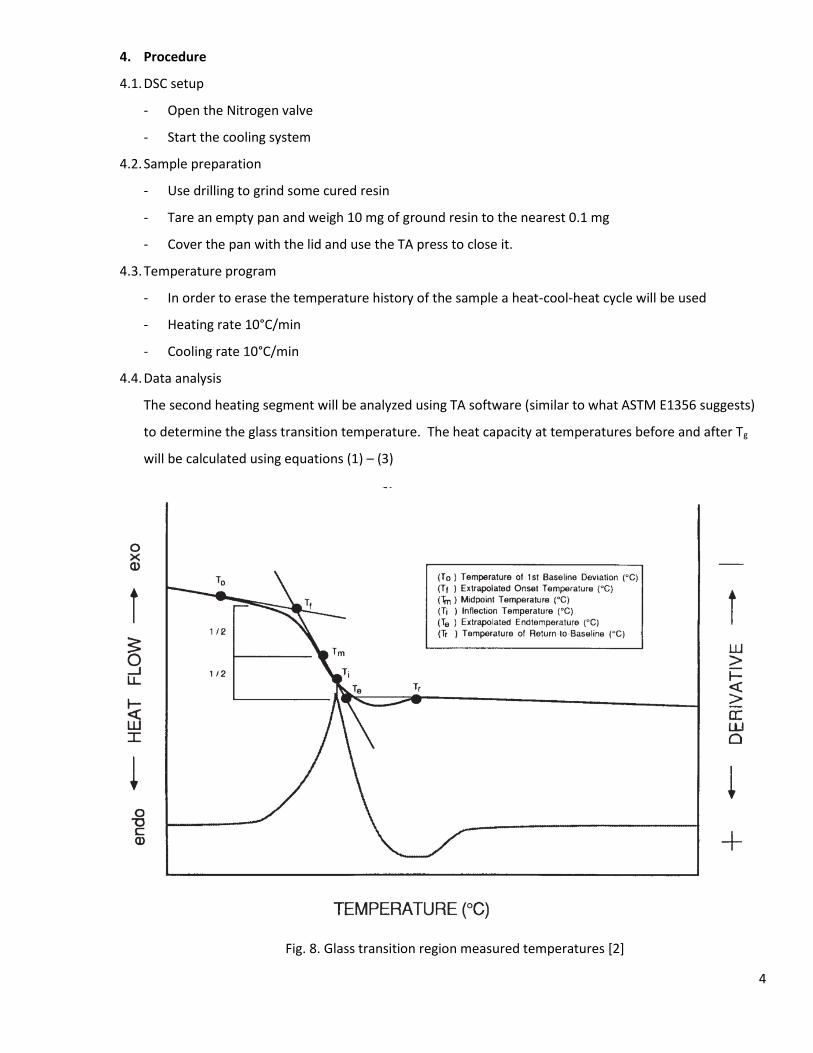
4.4. Data analysis
The second heating segment will be analyzed using TA software (similar to what ASTM E1356 suggests)
to determine the glass transition temperature. The heat capacity at temperatures before and after Tg
will be calculated using equations (1) – (3)
Fig. 8. Glass transition region measured temperatures [2]

5
4.5. Once the experiment is completed the nitrogen valve should be closed, the cooling system turned off
and the sample removed from the furnace.
5. Report
a. A short description of the experiment goals, materials, equipment and procedures.
b. Identification and description of the material tested
c. Statement of the dimensions, geometry, and material of the specimen holder.
d. The temperature program, heating, cooling rates in °C/min.
e. Identification of the specimen environment (the inert gas)
f. Results of the transition measurements using temperature parameters (Tg, etc.) cited in Fig. 8, or
any combination of parameters that were chosen.
g. Tg(half extrapolated heat capacity temperature) is preferred
h. Cp before and after Tg
6. References
[1] Characterization and Failure Analysis of Plastics, Steve Lampman, ASM International, 2003, pg 121
[2] ASTM E1356 - 08(2014) Standard Test Method for Assignment of the Glass Transition Temperatures by
Differential Scanning Calorimetry
1
L3. Autoclave curing of thermoset laminates
1. Aim
Familiarize with prepreg lay-up and autoclave curing
2. Introduction
Autoclave curing is an important method of manufacturing carbon fiber-reinforced plastic laminates. During this step, the composite laminate is transformed from a prepreg lay-up into a stiff structural part [1, 2].
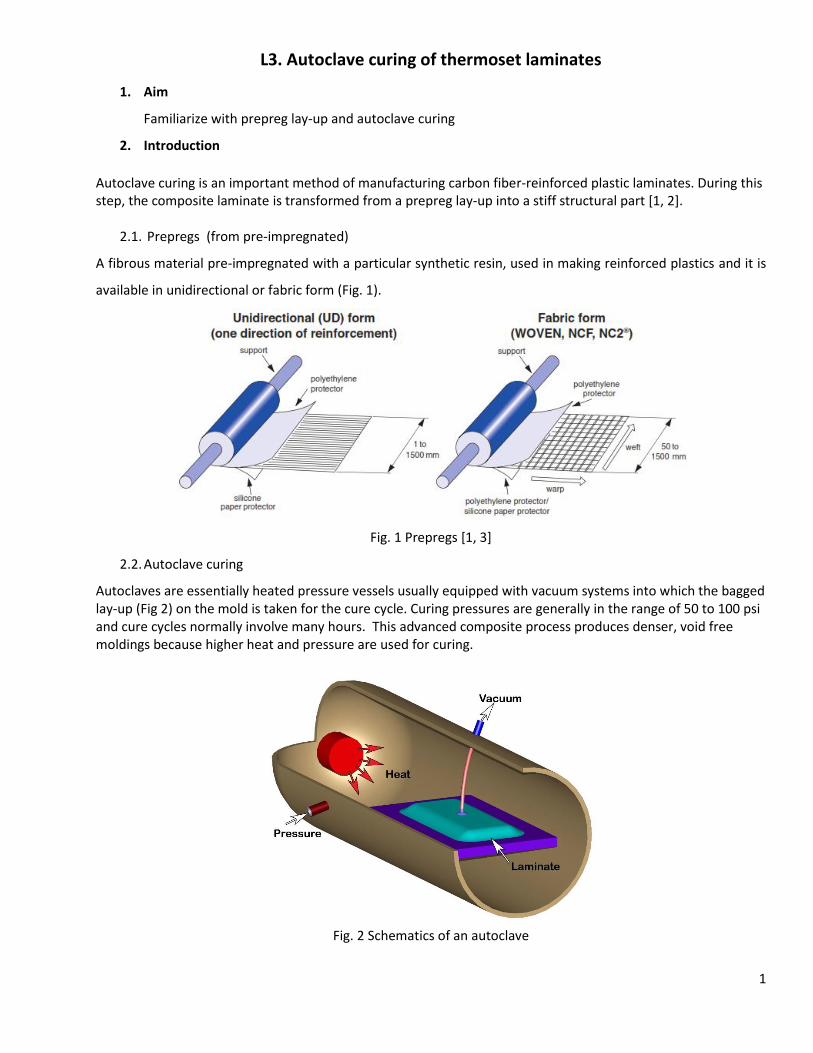
2.1. Prepregs (from pre-impregnated)
A fibrous material pre-impregnated with a particular synthetic resin, used in making reinforced plastics and it is
available in unidirectional or fabric form (Fig. 1).
Fig. 1 Prepregs [1, 3]
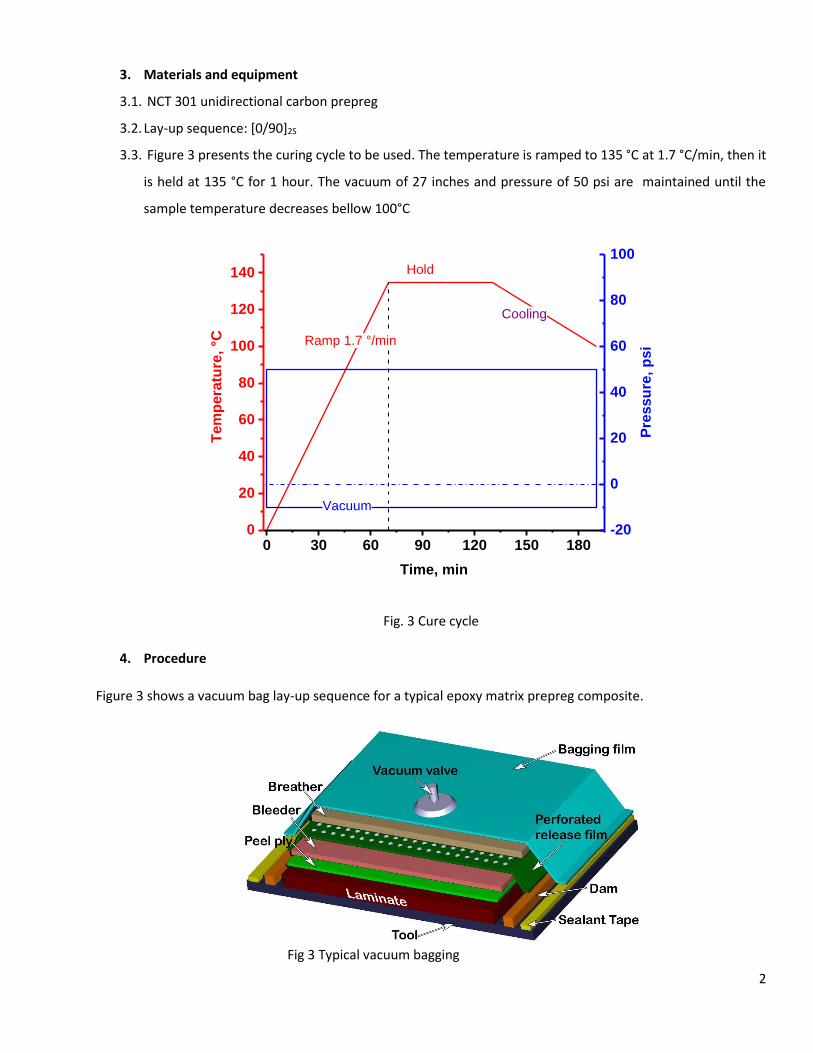
2.2. Autoclave curing
Autoclaves are essentially heated pressure vessels usually equipped with vacuum systems into which the bagged lay-up (Fig 2) on the mold is taken for the cure cycle. Curing pressures are generally in the range of 50 to 100 psi and cure cycles normally involve many hours. This advanced composite process produces denser, void free moldings because higher heat and pressure are used for curing.
Fig. 2 Schematics of an autoclave
2
3. Materials and equipment
3.1. NCT 301 unidirectional carbon prepreg
3.2. Lay-up sequence: [0/90]2S
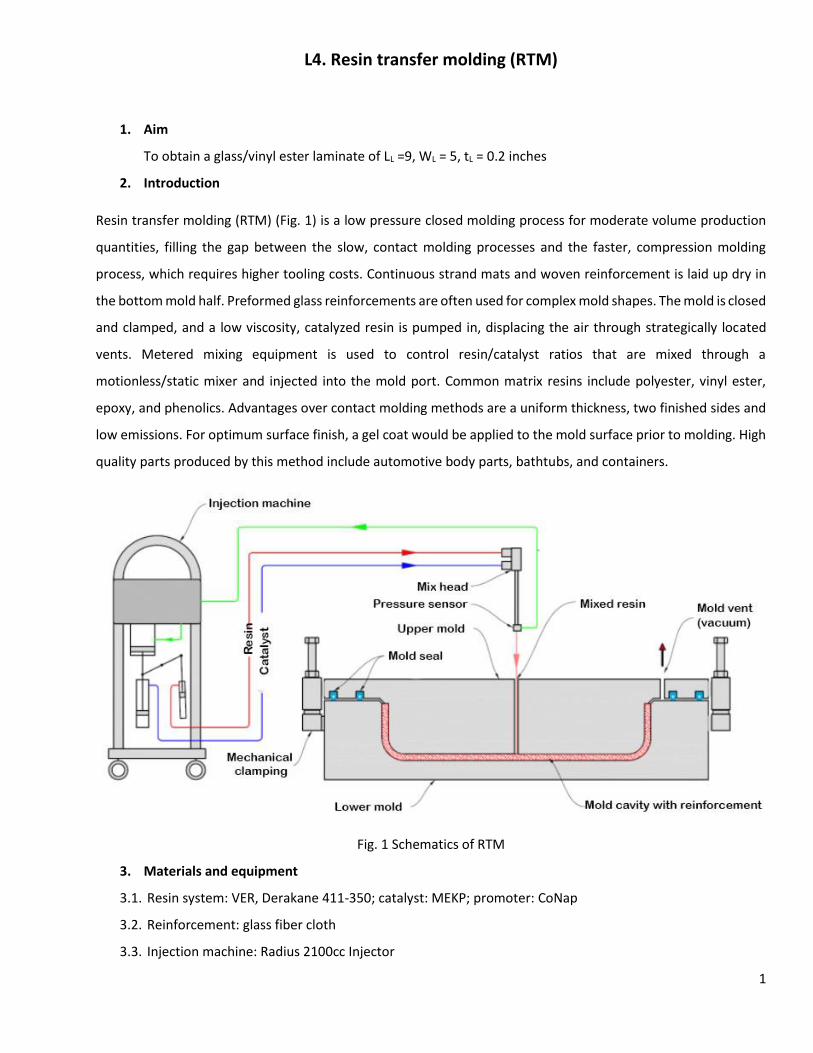
3.3. Figure 3 presents the curing cycle to be used. The temperature is ramped to 135 °C at 1.7 °C/min, then it
is held at 135 °C for 1 hour. The vacuum of 27 inches and pressure of 50 psi are maintained until the
sample temperature decreases bellow 100°C
Fig. 3 Cure cycle
4. Procedure
Figure 3 shows a vacuum bag lay-up sequence for a typical epoxy matrix prepreg composite.
Fig 3 Typical vacuum bagging
0 30 60 90 120 150 1800
20
40
60
80
100
120
140
Tem
pera
ture
, °C
Time, min
Ramp 1.7 °/min
-20
0
20
40
60
80
100
Pre
ssu
re,
psi
Vacuum
Hold
Cooling

3
4.1. Clean the aluminum plate using acetone. Then apply mold-release agent (Frekote 700 NC) to the top
surface of the aluminum plate twice
4.2. Cut-out the necessary plies of 6x6 inches from the prepreg roll. (ATTENTION, the prepreg roll should be
taken out from the freezer at least with 12 hours before cutting. The prepreg should be left to thaw
slowly to room temperature to avoid moisture condensation).
4.3. Place the prepreg stack on the plate being sure to keep at least 2 inches from each edge.
4.4. OPTIONAL. Place a strip of cork-rubber material along each edge of the laminate to form a dam. The
dam around the lay-up prevents lateral motion of the panel, and minimizes resin flow parallel to the
aluminum plate and through the edges of the laminate.
4.5. Completely encircle the prepreg stack and dam with sealant tape. The purpose of this material is to form
a vacuum seal.
4.6. Place the peel-ply and the bleeder (with the same dimensions as the lamintate) on the top of the
prepreg stack. The bleeder sheet absorbs the excess resin from the laminate
4.7. Place a sheet of perforated release film over the bleeder material, which prevents the breather from
saturation with the excess resin.
4.8. Place the breather over the laminate and extend it over the vacuum line attachment. The breather
provides path for volatiles to escape when the vacuum is applied and achieves uniform distribution of
vacuum
4.9. Place nylon bagging film over the entire plate, and seal it against the sealant tape. Allow enough material
so that the film conforms to all contours without being punctured.
4.10. Attach the plate to a vacuum pump and check for leaks.
4.11. Place the plate in the autoclave and attach the vacuum line. Start the vacuum pump
4.12. After closing the autoclave door, apply pressure and initiate the appropriate curing cyclcle. As the
temperature is increased, the resin viscosity decreases rapidly and the chemical reaction of the resin
begins. The temperature hold controls the rate of the chemical reaction and prevents the degradation
of the material by the exothermic process. The pressure is held constant throughout the cure cycle to
consolidate the plies until the resin in the laminate is in its glassy state at the end of the cooling phase.
The vacuum is applied to achieve a uniform pressure on the laminate and draw out volatiles created
during the cure.
4.13. After the power is turned off to the autoclave, maintain pressure until the inside temperature has
dropped to about 100 °C.

4
4.14. Carefully remove the laminate from the aluminum plate. Gently lift it in the direction parallel to the
principal fiber direction.
4.15. Clean the aluminum plate from the resin particles using an aluminum knife than wipe it with acetone.
5. Report
The report should contain:
a. A short description of the experiment goals, materials, equipment and procedures.
b. Identification of the prepreg (name of manufacturer, batch number, etc.)
c. Identification and the role of all the materials used for vacuum bagging
d. Assess visually the quality of the cured laminate
6. References
[1] Principles of the Manufacturing of Composite Materials, Suong Van Hoa, DEStech, 2009, pg 143
[2] Experimental Characterization of Advanced Composite Materials, 3rd ed, D.F. Adams, L.A. Carlsson, R.B. Pipes,
CRC press, 2003, pg 41.
[3] HexPly Prepreg Technology (http://www.hexcel.com/Resources/DataSheets/Brochure-Data-
Sheets/Prepreg_Technology.pdf)
1
L4. Resin transfer molding (RTM)
1. Aim
To obtain a glass/vinyl ester laminate of LL =9, WL = 5, tL = 0.2 inches
2. Introduction
Resin transfer molding (RTM) (Fig. 1) is a low pressure closed molding process for moderate volume production
quantities, filling the gap between the slow, contact molding processes and the faster, compression molding
process, which requires higher tooling costs. Continuous strand mats and woven reinforcement is laid up dry in
the bottom mold half. Preformed glass reinforcements are often used for complex mold shapes. The mold is closed
and clamped, and a low viscosity, catalyzed resin is pumped in, displacing the air through strategically located
vents. Metered mixing equipment is used to control resin/catalyst ratios that are mixed through a
motionless/static mixer and injected into the mold port. Common matrix resins include polyester, vinyl ester,
epoxy, and phenolics. Advantages over contact molding methods are a uniform thickness, two finished sides and
low emissions. For optimum surface finish, a gel coat would be applied to the mold surface prior to molding. High
quality parts produced by this method include automotive body parts, bathtubs, and containers.
Fig. 1 Schematics of RTM
3. Materials and equipment
3.1. Resin system: VER, Derakane 411-350; catalyst: MEKP; promoter: CoNap
3.2. Reinforcement: glass fiber cloth
3.3. Injection machine: Radius 2100cc Injector

2
3.4. Release agent: Frekote 700NC, plastic beaker (1L), flexible tubing and scale.
4. Procedure
4.1. Clean the molds with acetone and coat the active surfaces with release agent
4.2. Install the mold sealing rings on the lower and upper mold
4.3. Cut and weigh 4-6 layers of glass fabric of 8.5 x 4.5 inches. Place the fiber preform stack on the lower
mold inside the aluminum frame. Close the mold and tighten the bolts. Check for leaks.
4.4. Connect flexible tubing to the inlet and outlet of the mold.
4.5. Weigh 800 g of VER resin to the nearest gram, add 0.1 phr cobalt naphthenate (CoNap) and mix
thoroughly for 2 minutes. Then add 1 phr of methyl ethyl ketone peroxide (MEKP) and mix thoroughly
for 1 minute.
4.6. Load the resin mix into the delivery cylinder of the injection machine. Connect the flexible tubing
between the mold inlet and injector.
4.7. Start the injection. Record the injection pressure (P0). Once the resin reaches the mold inlet start the
stopwatch. After the mold is filled and the preform is impregnated resin become visible at the mold
outlet. Record the time to fill the mold (tff). Continue the resin injection until no bubbles are observed.
4.8. Clamp the outlet and inlet tubing before stopping the injector
4.9. Clean the Injector machine
4.10. After full cure (next day) the laminate can be removed from the aluminum mold
4.11. Clean the aluminum mold and all the tools used in this experiment
5. Report
a. A short description of the experiment goals, materials, equipment and procedures.
b. Identification of the resin system and reinforcement
c. Assess visually the quality of the laminate
d. Calculate the volume fraction of the fibers (Vf) knowing the followings:
- Resin density: 1140 kg/m3
- Fiber glass density: 2600 kg/m3
- mF – reinforcement weight;
- mL – laminate weight
e. Calculate the permeability of the fiber preform using the following equation [1]:
𝐾𝑥𝑥 = 𝜑 𝜇
2 𝑃0 𝑡𝑓𝑓 𝑥𝑓𝑓
2 (1)

3
Where Kxx – permeability [m2]; ϕ – porosity equal to (1- Vf); Vf – fiber volume fraction; P0 – constant pressure at
the injection gate [Pa]; tff – time to fill the mold [s]; xff – mold length [m]; µ - resin viscosity = 0.35 Pa s.
6. References
[1] Principles of the Manufacturing of Composite Materials, Suong Van Hoa, DEStech, 2009, pg 264

1
L5. Vacuum-assisted resin transfer molding (VARTM)
1. Aim
To obtain a glass/vinyl ester laminate of LL =12, WL = 8, tL = 0.04 inches
2. Introduction
In VARTM, atmospheric pressure is utilized to achieve consolidation and impregnation by vacuum bagging the
laminate [1, 2]. An inlet for the resin is located at one or more points in the tool or bag, and vacuum outlets are
located some distance away. The vacuum pump creates a pressure gradient of approximately 1 atm within the
bag, which is sufficient for the impregnation of laminates large in size and complex in geometry. For processes in
which final cure occurs after the mold is filled, completion of cure can be carried out in an oven while atmospheric
pressure is maintained on the impregnated laminate.
3. Materials and equipment
3.1. Resin system VER DERAKANE 411-350, catalyst: MEKP; promoter: CoNap
3.2. Reinforcement: glass fabric
3.3. Aluminum plate, sealant tape, LDPE spiral tubing, flexible tubing and distribution media, plastic beakers,
mixing rods, clamps or valves.
3.4. Vacuum pump and scale
4. Procedure
4.1. The tool is a flat aluminum plate with planar dimensions sufficient to accommodate the proposed
composite panel. Clean the tool surface with acetone. Coat the tool surface with release agent (Frekote
700 NC). Place sealant tape on the tool surface to form a frame LF = LL + 4 inches; WF = WL inches. (Fig. 1)
Fig. 1 Aluminum with a frame of sealant tape
2
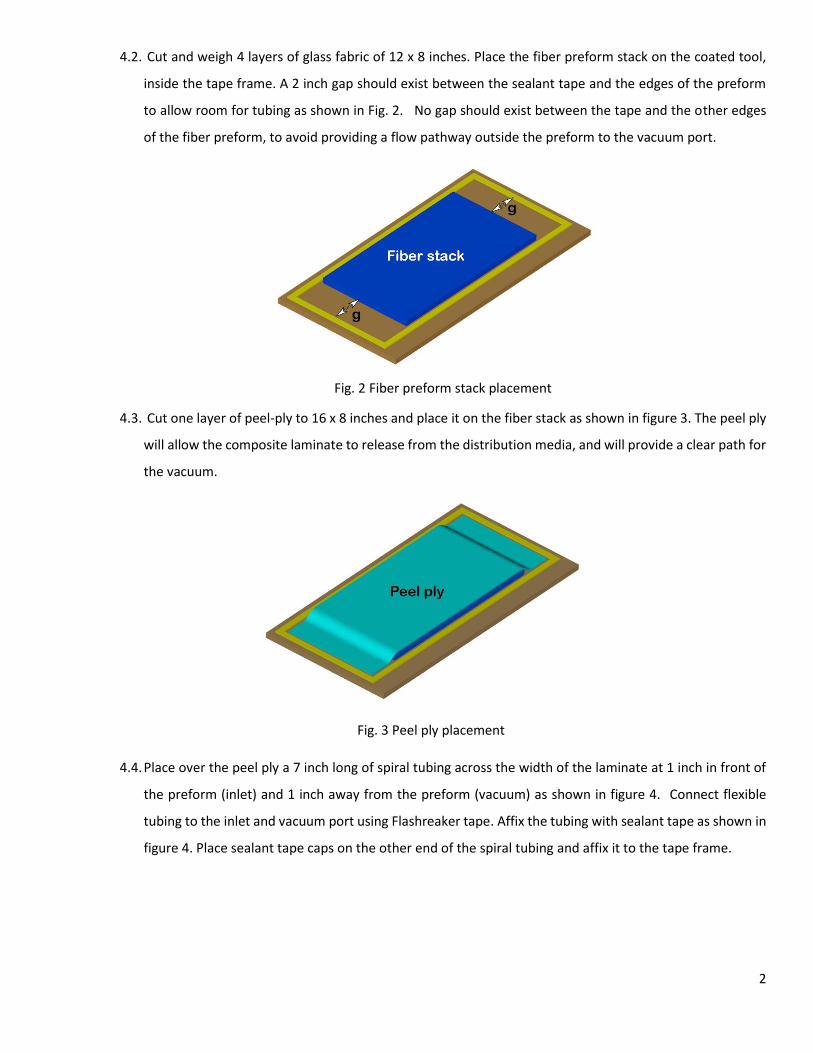
4.2. Cut and weigh 4 layers of glass fabric of 12 x 8 inches. Place the fiber preform stack on the coated tool,
inside the tape frame. A 2 inch gap should exist between the sealant tape and the edges of the preform
to allow room for tubing as shown in Fig. 2. No gap should exist between the tape and the other edges
of the fiber preform, to avoid providing a flow pathway outside the preform to the vacuum port.
Fig. 2 Fiber preform stack placement
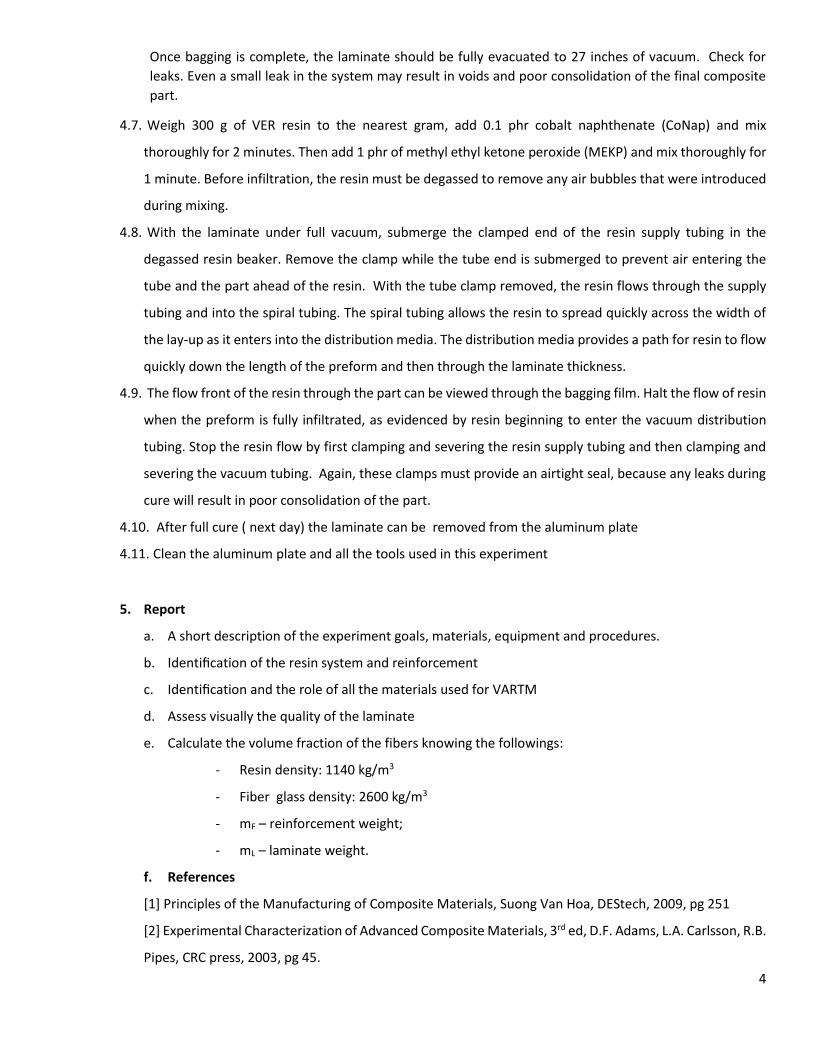
4.3. Cut one layer of peel-ply to 16 x 8 inches and place it on the fiber stack as shown in figure 3. The peel ply
will allow the composite laminate to release from the distribution media, and will provide a clear path for
the vacuum.
Fig. 3 Peel ply placement
4.4. Place over the peel ply a 7 inch long of spiral tubing across the width of the laminate at 1 inch in front of
the preform (inlet) and 1 inch away from the preform (vacuum) as shown in figure 4. Connect flexible
tubing to the inlet and vacuum port using Flashreaker tape. Affix the tubing with sealant tape as shown in
figure 4. Place sealant tape caps on the other end of the spiral tubing and affix it to the tape frame.

3
Fig. 4 Spiral tubing and connectors
4.5. Cut one layer of distribution media to Ld = 13 and Wd = 7 inches. Place the layer of media so that a 1 inch
gap exists on the top of the preform at the vacuum end (Figure 5) This gap will force the resin to fill through
the thickness rather than be drawn directly into the vacuum port. The length of the gap will vary with the
desired thickness of the composite panel. A 0.5 inch gap should exist between the media and the sides of
the preform. This will help prevent resin flow outside the preform. A 2 inch length of the media will
overhang the preform at the resin inlet end of the lay-up.
Fig. 5 Distribution media placement
4.6. With the laminate complete and the tubing in place, the part can be bagged using an appropriate film
(Figure 6). Ensure an airtight seal with the tool surface and sealant tape.
Fig. 6 Vacuum bag placement
4
Once bagging is complete, the laminate should be fully evacuated to 27 inches of vacuum. Check for
leaks. Even a small leak in the system may result in voids and poor consolidation of the final composite
part.
4.7. Weigh 300 g of VER resin to the nearest gram, add 0.1 phr cobalt naphthenate (CoNap) and mix
thoroughly for 2 minutes. Then add 1 phr of methyl ethyl ketone peroxide (MEKP) and mix thoroughly for
1 minute. Before infiltration, the resin must be degassed to remove any air bubbles that were introduced
during mixing.
4.8. With the laminate under full vacuum, submerge the clamped end of the resin supply tubing in the
degassed resin beaker. Remove the clamp while the tube end is submerged to prevent air entering the
tube and the part ahead of the resin. With the tube clamp removed, the resin flows through the supply
tubing and into the spiral tubing. The spiral tubing allows the resin to spread quickly across the width of
the lay-up as it enters into the distribution media. The distribution media provides a path for resin to flow
quickly down the length of the preform and then through the laminate thickness.
4.9. The flow front of the resin through the part can be viewed through the bagging film. Halt the flow of resin
when the preform is fully infiltrated, as evidenced by resin beginning to enter the vacuum distribution
tubing. Stop the resin flow by first clamping and severing the resin supply tubing and then clamping and
severing the vacuum tubing. Again, these clamps must provide an airtight seal, because any leaks during
cure will result in poor consolidation of the part.
4.10. After full cure ( next day) the laminate can be removed from the aluminum plate
4.11. Clean the aluminum plate and all the tools used in this experiment
5. Report
a. A short description of the experiment goals, materials, equipment and procedures.
b. Identification of the resin system and reinforcement
c. Identification and the role of all the materials used for VARTM
d. Assess visually the quality of the laminate
e. Calculate the volume fraction of the fibers knowing the followings:
- Resin density: 1140 kg/m3
- Fiber glass density: 2600 kg/m3
- mF – reinforcement weight;
- mL – laminate weight.
f. References
[1] Principles of the Manufacturing of Composite Materials, Suong Van Hoa, DEStech, 2009, pg 251
[2] Experimental Characterization of Advanced Composite Materials, 3rd ed, D.F. Adams, L.A. Carlsson, R.B.
Pipes, CRC press, 2003, pg 45.