l ruot l I 2o2o zozo - pharmaaids.com
14
PHARMA AIDS LIMITED Statement of Financial Position (Un-audited) As on December31,2020 Particulars Assets Non-Current Assets: Property, Plant and Equipment Current Assets: lnventories Trade and Other Receivable Advance, Deposit & Prepayments L/C Margin & Others Cash and Cash Equivalent Total Assets Equity & Liabilities Shareholders' Equity: lssued Share Capital Tax Holiday Reserve CSR Fund Retained Earnings Current Liabilities: Trade Payable Loan & Advance Liabilities For Expenses Dividend Payable lncome Tax Payable Liabilities For WPPF Liabilities For Providend Fund Total Equity & Liabilities NAV Note: sd/- M. A. MASUD Chairman sd/- K. H. REZA, FCS Corporate Secretary sd/- FAIZUL HASSAN Managing Director 'sd/- MD. ABU TAHER Chief Financial Officer 351,425,554 315,341,220 266,492,764 257,555,944 84,932,790 57,785,276 351,425,554 315,341,220 82.54 sd/- SHAHINOOR BABY Director 85.4',1 1) NAV: Net Assets Value (NAV) per share has been increased due to increase of retained earnings. 2) Trade & other Receivable: Respecting the privacy of the parties, schedule of Trade and Other Receivable cannot be shown in the Financial Statement. l ruot" l I I I December 2o2o ll .rune zozo I 79,241,432 74,118,974 79,241,432 ll 74,118,974 3 4 E 6 7 10 11 12 13 14 15 16 17 272,184,122 31,938,472 166,517,411 34,308,916 7,'190,519 32,228,804 24',1,222,246 24,453,232 175,846,534 23,260,156 3,579,861 14,082,463 175,143 6,371,169 15,319,970 26,740,093 25,979,617 6,058,767 4,288,031 426,743 5,086,025 13,794,954 11,221,826 17,599,720 5,317,890 4,338,'1 18
Transcript of l ruot l I 2o2o zozo - pharmaaids.com

PHARMA AIDS LIMITEDStatement of Financial Position (Un-audited)
As on December31,2020
Particulars
AssetsNon-Current Assets:Property, Plant and Equipment
Current Assets:lnventories
Trade and Other ReceivableAdvance, Deposit & PrepaymentsL/C Margin & Others
Cash and Cash Equivalent
Total Assets
Equity & Liabilities
Shareholders' Equity:lssued Share Capital
Tax Holiday Reserve
CSR Fund
Retained Earnings
Current Liabilities:Trade Payable
Loan & Advance
Liabilities For Expenses
Dividend Payable
lncome Tax Payable
Liabilities For WPPFLiabilities For Providend Fund
Total Equity & LiabilitiesNAV
Note:
sd/-
M. A. MASUDChairman
sd/-K. H. REZA, FCS
Corporate Secretary
sd/-FAIZUL HASSANManaging Director
'sd/-
MD. ABU TAHER
Chief Financial Officer
351,425,554 315,341,220
266,492,764 257,555,944
84,932,790 57,785,276
351,425,554 315,341,220
82.54
sd/-SHAHINOOR BABY
Director
85.4',1
1) NAV: Net Assets Value (NAV) per share has been increased due to increase of retained earnings.
2) Trade & other Receivable: Respecting the privacy of the parties, schedule of Trade and Other Receivablecannot be shown in the Financial Statement.
l ruot" l
I I I December 2o2o ll .rune zozo I
79,241,432 74,118,97479,241,432 ll 74,118,974
3
4E
6
7
10
11
12
13
14
15
16
17
272,184,122
31,938,472
166,517,411
34,308,916
7,'190,519
32,228,804
24',1,222,246
24,453,232
175,846,534
23,260,156
3,579,861
14,082,463
175,143
6,371,16915,319,970
26,740,093
25,979,617
6,058,7674,288,031
426,743
5,086,025
13,794,954
11,221,826
17,599,720
5,317,890
4,338,'1 18

[-l l-J,r. roro 1 l-J,rrol, I I o"t. roro I|*"3] o""lio,o ll o""]?0,, llo"":;o;o I
Net Sales Revenue
Cost of Goods Sold
Gross Profit
Operating Expenses:
Administrative and Selling Expenses
Profit from Operation
Other lncome
Financial Cost
Profit before Contribution to WPPF
Contribution to WPPF
Profit berfore Tax
Disposal of Gas Generator
Profit berfore Tax
lncome Tax Provision
Profit after Tax for the period
Net profit after Tax
Earning per share (EPS)
Number of shares used to compute EPS
Note:
132,102,370
(80,636,856)
51,465,5'14
(15,671,676)
35,793,939
47,015
(689,386)
35,151,467
(1,673,87e)
33,477,599
33,477,588
(8,369,397)
25,108,191
PHARMA AIDS LIMITEDStatement of Comprehensive Income
For the 2nd Quarter ended on December 3'1,2020 (Un-audited)
19
20
146,222,706
(87,591,595)
58,631,111
(14,615,170)
44,015,941
27,331
(475,328)
43,567,944
(2,074,664)
41,493,290
(839,056)
40,654,224
(10,163,556)
30,490,669
67,540,457
, (43,140,880)
24,399,577
(6,415,554)
17,984,023
(369,447)
17,614,576
(838,789)
16,775,787
Amount in Taka
Oct.2019to
Dec.2019
74,354,469
(45,634,822)
28,719,647
(6,017,105)
22,702,542
27,331
(248,752)
22,491,121
(1,070,530)
21,410,591
2',1
15
22
23
14
27
25,',109,19,1 30,490,669
8.05 9.77
3,120,000 3,120,000
16,775,787
(4,193,947)
12,581 ,84012,581,840
4.03
3,120,000
21,410,591
(5,352,648)
16,057,943
16,057,943
5.15
3,120,000
1) EPS: EPS decresed due to decrease of Sales and Net Profit.2) Tax: lncome Tax expenses is recognised in the statement of Profit or Loss and Other Comprehensivelncome and accounted for in accordance with the requirements of IAS-12.The Company qualifies as a publiclytraded company, hence the applicable Tax rateis21o/o.
3) Deferred Tax: There is no effect on deferred Tax Assets/Liabilities for the 2nd Quarter Flnancial Statements
4) Exchange Rate: We have no foreign currency balance. So, there is no effect of exchange rate on cash andcash equivalent.
sd/-M. A. MasudChairman
sd/-K. H. Reza, FCSCorporate Secretary
sd/-Faizul HassanManaging Director
sd/-Md. Abu TaherChief Financial Officer
sd/-Shahinoor Baby
Director

sd/-M. A. MASUD
Chairman
sd/-K. H. REZA, FCS
Corporate Secretary
PHARMA AIDS LIMITED
Statement of Changes in Equity (Un-audited)For the 2nd Quarter ended on December 31, 2020
Statement of Changes in Equity (Un-audited)
For the 2nd Quarter ended on December 31, 201 9
sd/-FAIZUL HASSANManaging Director
sd/-MD, ABU TAHER
Chief Financial Officer
sd/-
SHAHINOOR BABYDirector
Particulars Share Capital Tax Holiday Reserve CSR Fund Retained Earnings Total
Balance as on July 01, 2020
Net profit for the period
CSR Fund Current period expenses
CSR Fund Provision @ 2.5%
Cash Dividend (20 1 9-2020)
31,200,000 2,867,808 2,921,814
(s71 ,371)
627,705
220,566,322
25,1 08,1 91
(627,705)
(1 s,600,000)
257,555,944
25,108,191
(s71,371
(1 5,600,000
Balance as on December 31, 2020 31,200,000 2,867,808 2,978,148 .1229,446.808 266,492.764
Particulars Share Capital Tax Holiday Reserve CSR Fund Retained Earnings Total
Balance as on July 01, 2019
Net profit for the period
CSR Fund Current period expenses
CSR Fund Provision @ 2.5%
Cash Dividend (2o1 8-2019)
31,200,000 2,867,808 2,704,63',1
(428,2s0)
762,267
185,003,423
30,490,668
(762,267)
(1 5,600,000)
221,775,862
30,490,668
(428,250)
(1 5,600,000)
Balance as on Oecember 3'1, 2019 31,200,000 2,867,808 3,038,648 199,131,824 236,238,280
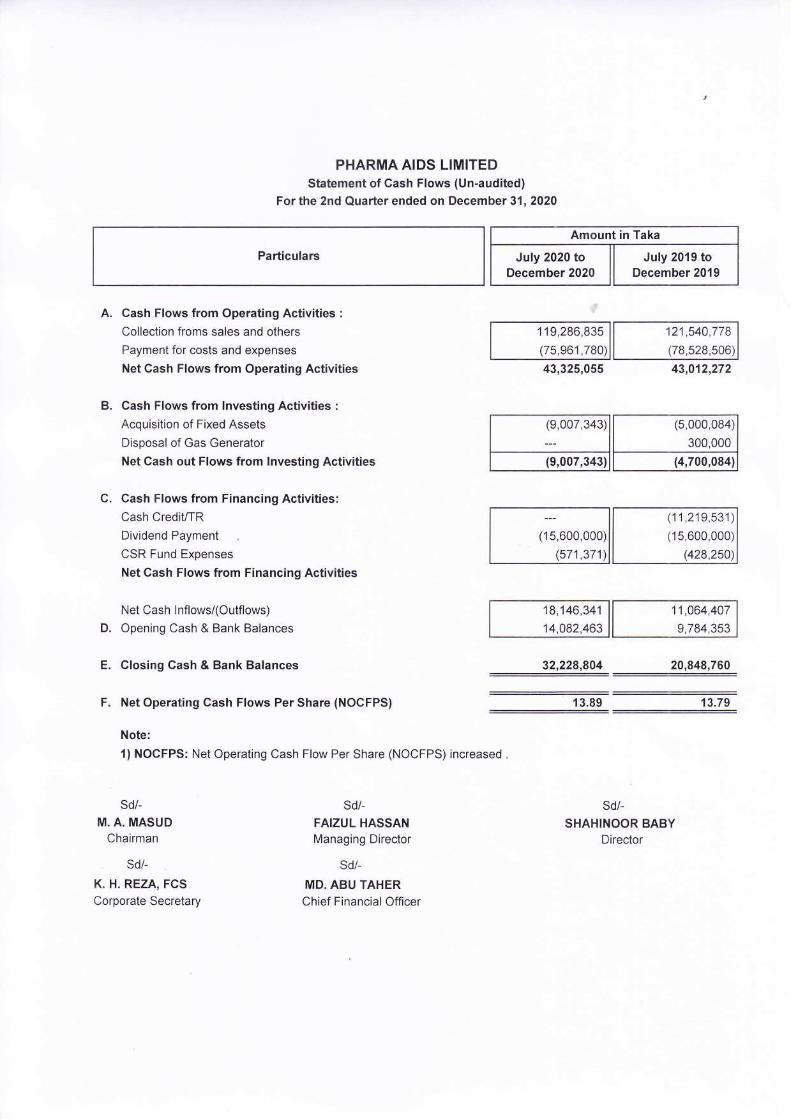
PHARMA AIDS LIMITEDStatement of Cash Flows (Un-audited)
For the 2nd Quarter ended on December 31,2020
Particulars
A. Cash Flows from Operating Activities :
Collection froms sales and others
Payment for costs and expenses
Net Cash Flows from Operating Activities
Cash Flows from lnvesting Activities :
Acquisition of Fixed Assets
Disposal of Gas Generator
Net Cash out Flows from lnvesting Activities
C. Cash Flows from Financing Activities:Cash Cred|UTR
Dividend Payment
CSR Fund Expenses
Net Cash Flows from Financing Activities
Net Cash lnflows/(Outflows)
D. Opening Cash & Bank Balances
E. Closing Gash & Bank Balances
F. Net Operating Cash Flows Per Share (NOCFPS)
Note:
1) NOCFPS: Net Operating Cash Flow Per Share (NOCFPS) increased .
1 19,286,835
(75,961,780)
43,325,055
121,540,778
(78,528,506)
43,012,272
(9,007,343
(9,007,343
(5,000,084)
300,000
(4,700,084)
(15,600,000)
(s71,371)
(11,219,531
(15,600,000)
(428,250)
18,146,341
14,082,463
11,064,407
9,784,353
32,228,804 20,848,760
13.89 13.79
sd/-M. A. MASUD
Chairman
sd/-
K. H. REZA, FCS
Corporate Secretary
sd/-FAIZUL HASSANManaging Director
sd/-
MD. ABU TAHERChief Financial Officer
sd/-
SHAHINOOR BABYDirector
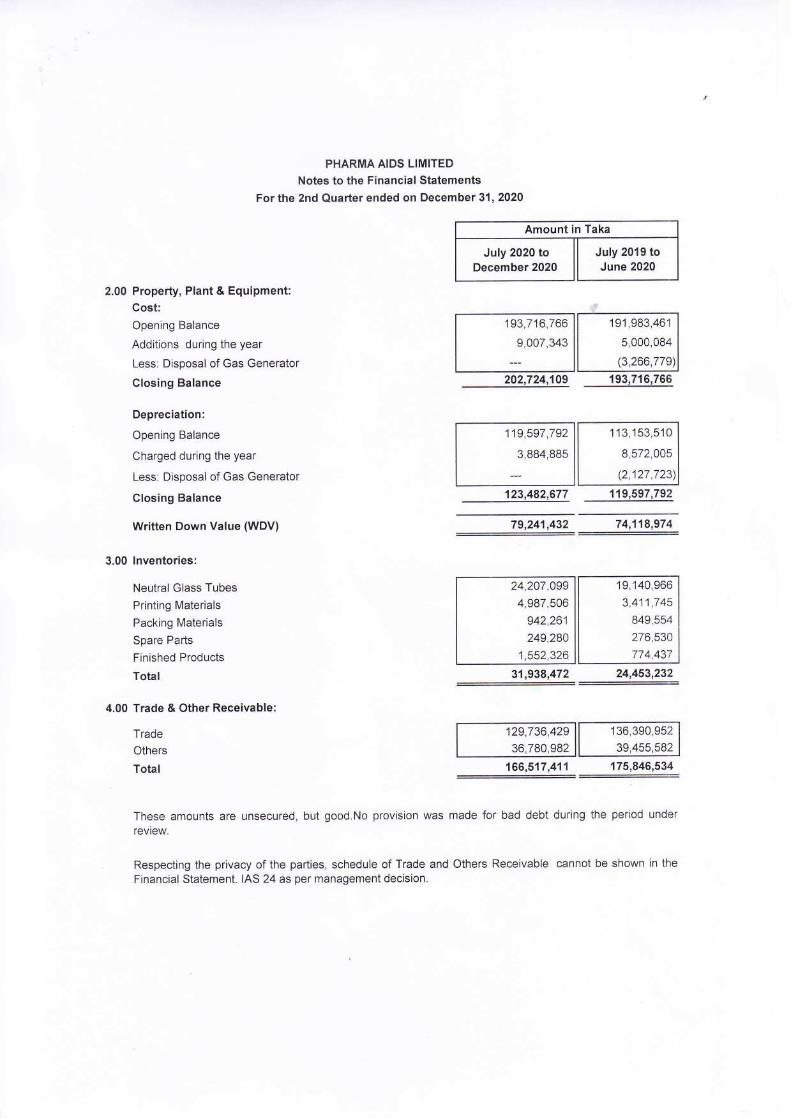
PHARMA AIDS LIMITED
Notes to the Financial Statements
For the 2nd Quarter ended on December 31,2020
Amount in Taka
July 2020 to | | July 2019 toDecember 2020 ll June 2020
2.00 Property, Plant & Equipment:Cost:
Opening Balance
Additions during the year
Less: Disposal of Gas Generator
Closing Balance
Depreciation:
Opening Balance
Charged during the year
Less: Disposal of Gas Generator
Closing Balance
Written Down Value (WDV)
lnventories:
Neutral Glass Tubes
Printing Materials
Packing Materials
Spare Parts
Finished Products
Total
Trade & Other Receivable:
TradeOthers
Total
119,597,792
3,884,885
1 13,153,510
8,572,005
(2,127,723
3.00
123,482,677 119,597,792
79,241,432 74,118,974
31,938,472 24,453,232
129,736,42911 teO,gso,ssz
36,780,982 ll 39,455,582
'166,517,411 175,846,534
These amounts are unsecured, but good.No provision was made for bad debt during the period under
review.
Respecting the privacy of the parties, schedule of Trade and Others Receivable cannot be shown in the
Financial Statement. IAS 24 as per management decision.
202,724,109 193,716,766

5.00 Advance, Deposits & Prepayments:
5.01 Advance:
Against Staff Salary
HN Consultancy Service
Advance in Others
Office Rent
Protec Electronic Ltd.
Janos Sofsys Engennering Ltd.
Total
5.02 Security Deposits:
BTCL for Telephone
Linde (Oxygen)
Earnest Money
VAT Deposit (Excise Duty)
VAT Prepaid
VAT Adjustment
Titas Gas
REB
CDBL for DSE Server
House Rent
Power Gas Trading
S.N. Engneering Workshop
Total
5.03 Prepayments
AIT on Bill of Entry
AIT at Source taken by Buyers
AIT paid in Cash (2019-2020)
Total
Total Advance, Deposits & Prepayments
6.00 UC Margin and Others:Raw Materials : Glass Tubes
Total
2,036,052 1,734,052
7,193,812 6,212,947
5,440,379
9,872,778
292,398
100,000
1,123,654
170,000
300,000
50,000
304,398
100,000
' t__|'n'uuo
34,308,916 23,260,156
Deposits: This balance represents Security Deposits made by the Company for Electrical Substation
Connection, Titas Gas, Telephone Lines, Earnest Money against Govt. Tenders, etc. which are
secured.ln the opinion of the Management, all current assets, investments, loans and advances are on
realization in the ordinary course of business. There is no claim against the Company, which can be
acknowledged as debt.
7.190,519
7,190,51 9
3,579,861
3,579,861
3,000 ll 3,000
1o,oo0 ll '1o,ooo
2,458,e00 ll 1,958,500
451,472 ll qSt,ttz218,051 ll 217,586
1,858,345 ll 1,858,345
1,031,240 ll I ,031,240382,804ll sez,eo+
100.000 ll 100,000
200,000 ll 200,ooo
400,000 ll --80,000 ll --
This amount represents against L/C margin for import of raw materials (Glass Tubes)

7.00 Cash & Cash Equivalent:
Cash in Hand
Cash at Bank:State Bank of lndia (Dilkusha Branch)
BCBL (Principal Branch)
AIBL (V.l.P. Road Branch)
PBL (Naya Paltan Branch)
PBL (Head Otfice)
ABBL (Chandra Branch)
DBBL(Foreign Exchange Branch)
lFlC (Chandra Branch)
Total Cash at Bank
Cash & Cash Equivalent
The bank balances have been confirmed and reconciled with
has been verified by the Management at the end of the period.
356,465 ?96,783
31,872,339 13,685,680
*__u 228,80 + _ _____ 1 4 W,463_
respective bank statements. Cash in hand
Share Capital:
Authorized Capital:
50,00,000 Ordinary Shares @ Tk. 10 each
lssued, Subscribed & Paid up Gapital:
31 ,20,000 Ordinary Shares of Tk. 101 each paid-up in full
50,000,000 50,000,000
31,200,000 31,200,000
15,277 ll 15,277
5,584,803 ll 5,433,311
25,668,776 ll ' 7,848,641
279,040 ll 47,230
4,795 ll 4,795
6,554 ll 4,554
204,603 ll 301,682
108,491 ll 30,190
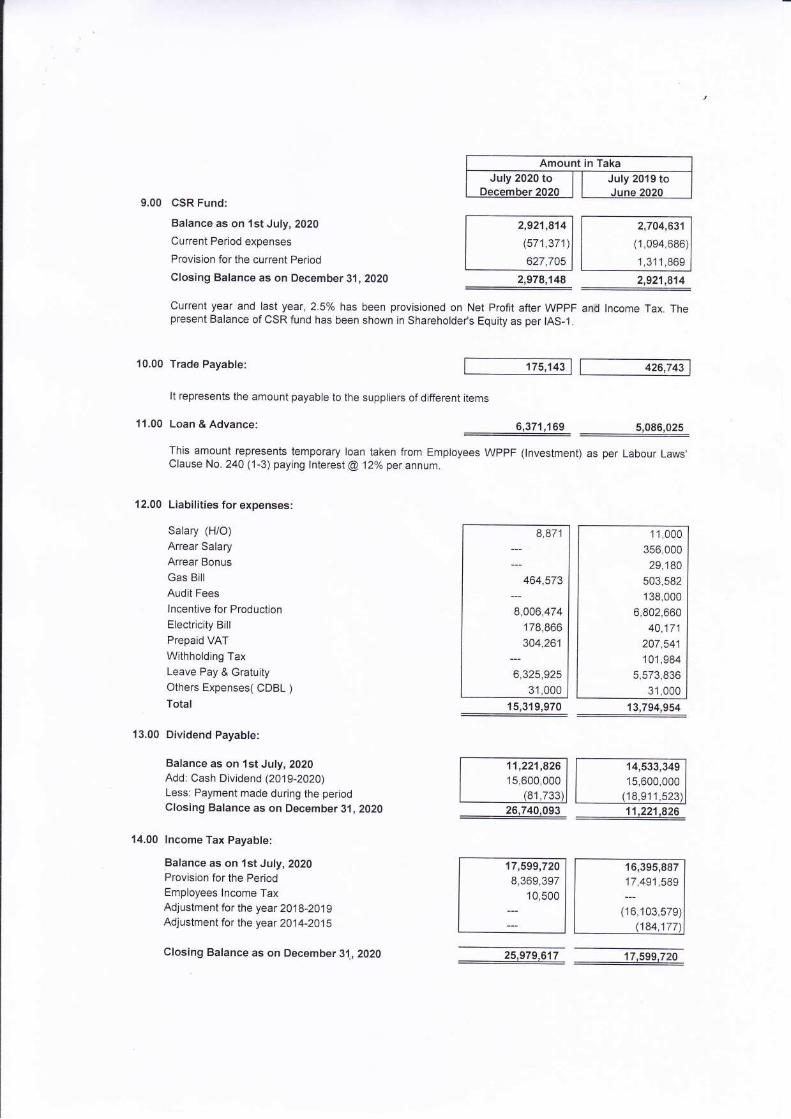
9.00 CSR Fund:
Balance as on 1st July,2020Current Period expenses
Provision for the current Period
Closing Balance as on December 31,2020
10.00 Trade Payable:
It represents the amount payable to the suppliers of different
11.00 Loan & Advance:
12.00 Liabilities for expenses:
Salary (H/O)
Arrear SalaryArrear Bonus
Gas Bill
Audit Fees
lncentive for ProductionElectricity Bill
Prepaid VAT
Withholding TaxLeave Pay & GratuityOthers Expenses( CDBL )
Total
13.00 Dividend Payable:
Balance as on 1st July,2020Add: Cash Dividend (2019-2020)Less: Payment made during the periodClosing Balance as on December 31,2020
14.00 lncome Tax Payable:
Balance as on 1st July,2020Provisron for the PeriodEmployees lncome TaxAdjustment for the year 2018-2019Adjustment for the year 2014-2015
Closing Balance as on December 31,,2020
2,921,814
(571,371)
627,705
2,978,148
2,704,631
(1,094,686
1,311,869
2,921,814
Current year and last year, 2.5o/o has been provisioned on Net Profit after WPPF and lncome Tax. Thepresent Balance of CSR fund has been shown in Shareholder's Equity as per IAS-1.
175,143 426,743
items
9IZU_q9_ ___94!!,0?!_This amount represents temporary loan taken from Employees WPPF (lnvestment) as per Labour Laws,Clause No. 240 (1-3) paying lnterest @ 12o/o per annum.
8,871
464,573
-
u,oou,oro178,866
304,261
6,325,925
31,000
15,319,970
11,000
356,000
29,180
503,582
138,000
6,802,660
40,171
207,541
101,984
5,573,836
31,000
13,794,954
1',t,22't,82615,600,000
81,
_______29119p9!_
14,533,349'15,600,000
18,91 1 ,523)
____1J221,826_
17,599,7208,369,397
10,500
16,395,88717,491,589
(1 6,1 03,579)(184,177
__2s.s7s.61? ________:1 5e3f2o
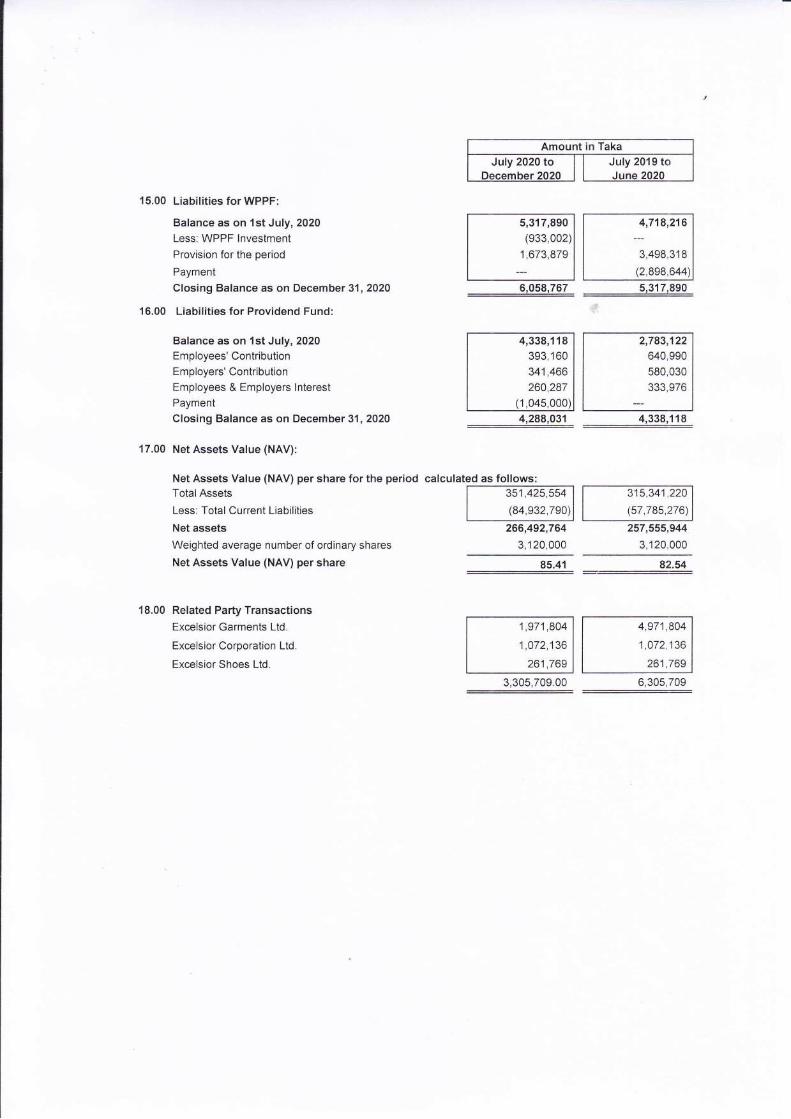
15.00 Liabilities for WPPF:
Bafance as on 1st July,2020Less: WPPF lnvestment
Provision for the period
Payment
Closing Balance as on December 31,2020
16.00 Liabilities for Providend Fund:
Balance as on 1st July,2020Employees' ContributionEmployers' ContributionEmployees & Employers lnterest
Payment
Closing Balance as on Decembet 31,2020
17.00 Net Assets Value (NAV):
Total Assets
Less: Total Current Liabilities
Net assets
Weighted average number of ordinary shares
Net Assets Value (NAV) per share
18.00 Related Party Transactions
Excelsior Garments Ltd.
Excelsior Corporation Ltd.
Excelsior Shoes Ltd.
s,317,890(933,002)
1,673,879
__________q,09u92_
4,718,216
3,498,318
(2,898,644)
_________1,312,899_
Net Assets Value (NAV) per share for the period calculated as follows:351 ,425,554(84,932,790)
266,492,764
3,1 20,000
315,341,220
(s7,78s,276)
257,555,944
3.120.000
85.41 82.54
1,971,804
1,072,136
261,769
4,971,804
1,072,136
261,769
3,30s,709.00 6,305,709
4,338,118393,1 60
341,466
260,287(1,045,
---------1288'031-
2,783,122640,990
580,030
333,976
4,338,1 18

19.00 Net Sales Revenue:
Gross Sales
Less: VATLess: Discount on Sales
Net Sales
20.00 A) cosT oF GooDS soLD:Raw Materials (Glass Tubes)
Printing Materials
Packing Materials
Spare Parts
Salary & Wages
Bonus
Fuel
Power & Energy
Repairs & Maintenance
Staff benefit & Welfare
lncentive
Entertainment Expenses
Labour Charge
Depreciation
Leave Pay & Gratuity
lnsurance (Fire)
Telephone & Postage
Duties & Taxes
Conveyance Exp.
Printing & Stationery
Donation
Legal Expenses
Picnic
lnternat Bill
Misc. Expenses
Total Cost of Goods Manufactured
Add: Opening Stock of Finished Goods
Less: Closing Stock of Finished Goods
Total Cost of Goods Sold20.01 Break-up of Power & Enerqv
Electricity
Diesel for Generator
Gas Consumption
Mobil for Generator
Rent for Generator
157,130,994(20,495,347)
4,533,277132,102,370
173,400,798(22,617,495
4,560,
146,222,706
Note-20.01
80,635,856
4,147,815
98,735
4,344,904
8,591,454
44,297,769
3,370,957
3,456,358
342,212
15,373,981
643,624
199,550
5,616,580
566,022
1,040,194
1,893,552
139,843
36,970
3,502,791
380,749
373,422
11,620
64,760
35,640
13,565
23,400
5,000
6,60019,586
81,414,7
774,437
82,189,182(1,552,326\
49,600,656
3,563,285
4,156,711
428,852
11,637 ,753584,994
344,586
8,591,454
818,990
1,210,408
1,706,232
157J92
16,000
3,633,2s1
346,069
342,741
9,300
1 06,1 50
44,550
13,01 I41,500
5,500
853,728
5,900
44 986
88,264,407
545,095
88,809,502(1,2',t7 ,
87,591,595
580,550
1 ,105
4,122,925
192,000
720.000
5,616,580

21.00 Administrative & Selling Expenses:
AGM ExpensesBoard Meeting Fee
Dlrector's RemunerationSalaryDirector's Bonus
Employee's BonusConveyanceEntertainmentlncentiveOffice RentHouse RentPrinting & StationeryTelephone Bill
Postage
Carriage OutwardsBooks & PeriodicalsTours & TravelsRenewal & RegistrationDepreciationFuel for VehiclesVehicles MaintenanceECL ContributionAdvertisment ExpensesCar lnsuranceCanteen SubsidyBusiness PromotionRepairs & Maintenance (Office)
lnternet ExpensesBest Business Bond Ltd.(Software)
Electricity Bill
Water & Sewerage Bill
Duties & TaxesConsultancy Fee
Compliance Fee
Leave Pay & GratuityDonationMisc. Expenses
Total22.00 Other lncome:
Sale of Wastage
Less: VAT
Total Other lncome
256,554120,000
4,920,0004,570,950
431,334304,32054,36s83,277
828,320510,470
441,00048,81862,983
1,885
446,700s,020
14,627
187,279
382,094240,648214,165300,000
56,68090,1 69
59,210
302, 1 39
89,25036,60012,600
'106,638
s5,55323,1 38
28,750371,340
2,00012,800
23.00 Financial Cost:interest on Short Term Loan (Note No. 23.01)
Bank Charges
Total Financial Cost
lnterest charged on WPPF & Providend Fund23.01
246,505100,000
4,350,0004,1 79,998
374,667
236,220
65,766
83,743
623,520514,423
444,50029,73759,703
16,298
503,00014,04055,1 89
148,635
s14,030203,8'10
72,625300,000
185,145101 ,209
97,779
349,250
99,1 45
37,5501 12,000
96,40633,1 40
9,1 50
30,000
309 487a,ooo
15,500
14,615,170

24.00 Directors' Remuneration:
It represents the amount paid as under to the Managing Director and other 3 (three) Directors during the
half year for the services rendered by them:
1) Mr.Faizul Hassan (M.D.) @ Tk.5,50,000 per month
2) Mr. M.A Masud (Chairman) @ 1,50,000 per month
3) Mrs. Shahinoor Baby (Director) @ 60,000 per month
4) Mrs. Shahinoor Begum (Director) @ 60,000 per month
4,920,000 4,350,000
No amount was spent by the Company for special services rendered by any other member of the Board
25.00 Remuneration and other facilities for 4 Directors
3,300,000
900,000
360,000
360,000
3,000,000
750,000
300,000
300,000
Remuneration
House rent
Utilities
Bonus
Conveyance
25.00 Salary and other facilities for 9 Executives
Salary
House reni
Utilities
Bonus
Conveyance
27.00 Basic Earning Per Share (EPS):
The computation of EPS is given below:
Net Profit after Tax
Weighted average number of ordinary shares
Basic EPS (based on 3,120,000 shares)
Net Cash Flows from Operating Activities
Weighted average number of Ordinary shares
Net Operating Cash Flows Per Share (NOCFPS)
29.00 Reconciliation of the statement of cash flows:
Profit after Tax
Collection from Sales & Others:Current Assets - Cash
Net Sales Revenue
Current Assets - Cash
Total Collection From sales & Others
4,920,000
441,000
431,334
5,792,334
4,350,000444,500
374,667
5,1 69,1 67
5,092,800
339,1 00
5,431,900
4,530,600
301,OOO
4,831,600
25,1 08,1 91
3,120,000
8.05
30,490,668
3,1 20,000
9.77
28.00 Net Operating Cash Flows Per Share (NOCFPS) :
Net Operating Cash Flows Per Share has been Calculated as follows:
43,325,055
3,120,000
't 3.89
43,012,272
3,120,000
13.79
227,139,783
132,102,370(239,955,318)
1 19,286,835
197,647,137
146,222,706(222,329,065)
121,540,778
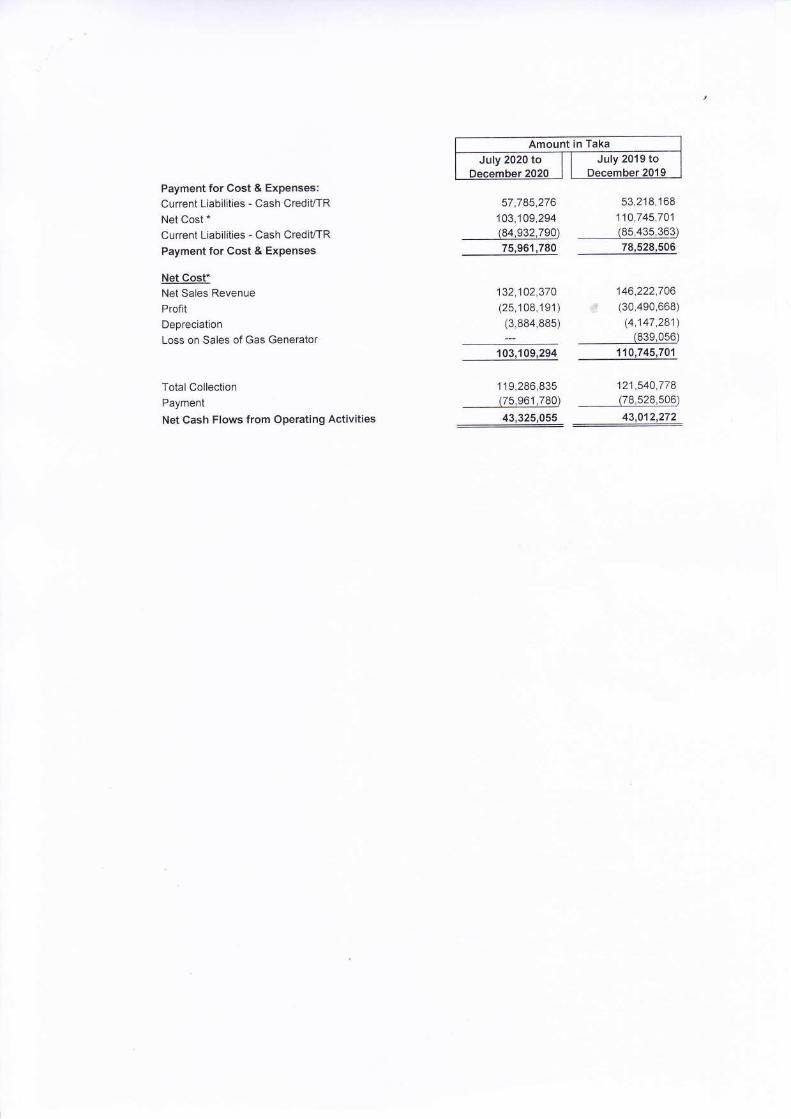
Payment for Cost & Expenses:Current Liabilities - Cash Credit/TR
Net Cost "Current Liabilities - Cash CrediUTR
Payment for Cost & Expenses
Net Cost*Net Sales RevenueProfit
Depreciation
Loss on Sales of Gas Generator
Total Collection
Payment
Net Cash Flows from Operating Activities
57,785,276
1 03,1 09,294(84,932,790)
,75,961,180
132,102,370(2s,108,191)
(3,884,885)
103,109,294
119,286,835(75,961,780)
43,325,055
53,21 8,168
110,745,701
, (85,4.35,363)
78,528,506
146,222,706
€ (30,490,668)
(4,147,281)(83e,056)
'l'10,745,70'l
121,540,778(78,528,506)
______$,0n2?2_

-so) o)f--- o-NNo@lf)_ (ocf)
N(olf)lr)$- lr)-$ f.-co(o(o_ oJN
6oorooo
an"aEtsE3xo-V.x;ruGo)0)trggOoo(,rOc>f(5
E.eCF(U*
o3I6o(!E'oPfi,ooGLoo-aoG
!oLo(LoELooct)LG
oco.gooo-oo
@o@
o)(of.-sNn.@
so,o,lr)(f)(f)-
$(o
oo$_N@ro
c.)r()crr-rOrOO)
F.@$_(o@
rOrOco-(or--
c)(oN.@N(\
@F-c).$cr)
F-ocO-
F.r.-ce-
(Y)tto-(o(o(o
NO)rO_
O)(r)
OO@N@o-CY)
o@@_
cr)f.-(o
(\a(Y)
a\tc!o)t-
$Nqco
+N
oo)@.(o
(o
NCr)
o)(o(o.
No
oo@-t-r--
sco@lr)
No)
loO)(o
oo,@s
rON(o-N$lr)
r--@$.F.@lr)
(oF-c.l(oo@-(o
(f)F-o_ooN
rtr)r()co-
O)
O
lr)N
N
oro-
ot-F-
t-NqNoa(Y)(\l
NO)F--r.-o)lr)o
s(os.o@
$$.$COO).
N
oo(o-o,N
N@olorO
c.)@N.co
o(nN+
@oto-@
Cr)f--o_f.-
s(Y)o.cr)r.c)
F-
c)f.-
olf)-CY)s
F-@@-osl(9
coi*@-or{)
ro@co+@qcl
loOo-NNrf)-@
@Nc\l(otr)o)-ro
(oo)@_
scr)F--o)o)
ooo.@s
OJlr)@-N(r)tr)
o)N$_@@(f)
No@_
tN$
f.-
.tNlf)
sO)co^
o(otr)
N$ryolr)(o_
CY)
No@_
f--N
lr)sc)_@$
(r)sry$c)@-(o
Nc)@_
o)N
NCDt\l-O)q(n
Ot()-c)lr)
o
s1r)
sO
so so so srO
s!o
so soN
soN
soN
soN
slr)
@_
o@
O)lr)s_
srO-
N
(o
rooot-(o
ooo.o$@
$os.@c)lr)_
O)r.-@-
(oU)
(otr)!t_tr)@(o
@@@_
oNr.-
lO$@_
oF-
(Y)@lO.
o@
d
(o
o_F-(o@
F-s$_cf)@s
oOr_
N$c\lo
oO)CD.
s:frt-
O)o+N\NoN
(o@\(oF-oO)
oNCD.
cf)CY)co
rON(o-
@l()_
@
ooo-ro
@sCD.
F-F-
ei{(t:
I\cco
v@o_ooo-lf)
@-o@
O)@o-@oryN
(oolO_
CONs-@rO
ooo-os(o
$O)s.@c)lc).
o,f.-@_
(olr)
@Ir)alO@(o
@@@-ONF-
tr)scO_
of.-
c)@l.r)
o@
d
(o
o-Ntr)6
f.-$s_(f)@$
oO)-
N$ryO
N$ot-(ocD-
(o@\@
\c)o)
(os_c)@O)_
c(UJ
o.=
=5c0
-oC
oG
05
oo-
oaU'(I)
oEo
a
C.oo6o
(5o()o
uJ
CoE.9fo
LU
6ooC)
tu
Lotr.gJo
IrJ(,o
o
c)!fP.xIIodoa=traII
co(E
6o
;Cfooo
o(E
oooC)oxo
LC)ooOL
+
=oU)U)'6ao)
.oo
oo.9eo
oo
=
oooo
I!tca
oNoNN
(9
EoF.
oNoN
I
@oIo(o
6oF
o NO(.)o tto l.r,o
(oo F.O
@o O)o o N c.) s
i,f;(EN- oE
*i:=o
co.goEooo
os 6*P 8:
(Y)
E#.9t or.9E.= bat 3 *-E
ooo ccJtr oiS oQ(E.8iob
o(!e.
ooo
o-
F C-,1s 6*,O oT- O- (t
-9.6!pE or.9=FLe,= ()r:.oooc$c oi!oQ(E(E;ob
oo)oo
oiocno(!o
oz6
IoL:,xoEE
+,oEo.5orct FtlJJ O.dTEb$.ctdE-o>oEOooo-9ELtrr.- Oooo<Eooa
oIIJF==ao
=tJ.o-