
l Published December - Inter Research · The exponential rate of natural mortality for fish eggs...
16
MARINE ECOLOGY - PROGRESS SERIES Mar. Ecol. Prog. Ser. Published December 19 l Natural mortality of marine pelagic fish eggs and larvae: role of spatial patchiness Michael D. McGurk* Institute of Animal Resource Ecology, The University of British Columbia, 2204 Main Mall, Vancouver, British Columbia V6T 1W5, Canada ABSTRACT: Daily instantaneous natural mortality rates of marine pelagic fish eggs and larvae are higher than expected from the trend of mortality rate with dry weight in the sea. The difference between observed mortality rates and those predicted from the trend of mortality with dry weight is directly and positively correlated with the patchiness of their spatial distribution, which suggests that it is caused by the feeding of predators on patches of eggs and larvae. The product of weight-dependent mortality, 5.26 X 10⁻³ , and 1 + Lloyd's patchiness index predicts mortality rates close to those that have been measured from the field by other workers. Mechanisms that control the spatial patchiness of eggs and larvae may control early life history survival and thereby influence relative year-class strength of adult fish stocks. INTRODUCTION Mathematical models of mort&ty rate in marine pelagic organisms have been based mainly on size- dependalli precidiion (Ursin i967, Ware i915, Peterson & Wroblewski 1984). The inherent assumption of these models is that predation occurs everywhere at the same rate, but this is not a realistic assumption because predation in a real aquatic ecosystem depends on the spatial distribution of both predators and prey. The act of predation includes search time as well as feeding time, which implies that the spatial distribution of prey influences both the fraction of the total time spent by a predator searching for prey, and the intensity of feed- ing (number of attacks per unit time spent feeding) once a predator has located prey. The maximum effect of spatial distribution on mor- tality rate occurs in the limiting case where the time required by a predator to handle (capture and con- sume) a prey item is very much smaller than the total time. In this case a predator's feeding rate is not limited by handling time and it can attack every prey item it encounters. In such a situation the mortality rate inflicted on a prey population by a predator population is mainly controlled by 2 correlated variables: the time available for feeding, and the density of the prey ' Present address: Envirocon Pacific Ltd., 205-2250 Boundary Road, Burnaby, British Columbia V5M 323, Canada @ Inter-Research/Printed in F. R. Germany patches. The variables are correlated because they are different aspects of a single phenomenon: spatial patchiness. The fraction of the total time that is spent searching for prey is directly proportional to the frac- non of the total area that is empty of prey, and the density of prey in the remaining area is directly pro- portional to the fraction of the total area that is empty of prey. The situation of negligible handling time occurs in nature for at least one group of prey: pelagic fish eggs and larvae. Fish eggs and newly-hatched larvae have poorly developed sensory systems, skeleton, and mus- culature. The eggs cannot evade capture once a preda- tor has fixed its attention on them, and newly-hatched larvae have only a marginally improved evasion capa- bility. However, once fish larvae begin to school, if they are a pelagic species, or migrate to the ocean floor, if they are a demersal species, the situation of negligible handling time may no longer apply. At this age and size a fish develops predator avoidance behaviour and the handling time of its predator increases towards the level where the natural mortality rate of the fish and its spatial distribution become uncoupled. Fish eggs and larvae are known to be patchily distn- buted in space (Smith 1973, Hewitt 1981, Houde & ~6vdal 1985, Koslow et al. 1985, McGurk 1986). This implies that natural mortality rates of fish eggs and larvae are higher than would be expected from the
Transcript of l Published December - Inter Research · The exponential rate of natural mortality for fish eggs...

MARINE ECOLOGY - PROGRESS SERIES Mar. Ecol. Prog. Ser.
Published December 19 l
Natural mortality of marine pelagic fish eggs and larvae: role of spatial patchiness
Michael D. McGurk*
Institute of Animal Resource Ecology, The University of British Columbia, 2204 Main Mall, Vancouver, British Columbia V6T 1W5, Canada
ABSTRACT: Daily instantaneous natural mortality rates of marine pelagic fish eggs and larvae are higher than expected from the trend of mortality rate with dry weight in the sea. The difference between observed mortality rates and those predicted from the trend of mortality with dry weight is directly and positively correlated with the patchiness of their spatial distribution, which suggests that it is caused by the feeding of predators on patches of eggs and larvae. The product of weight-dependent mortality, 5.26 X 10⁻³ , and 1 + Lloyd's patchiness index predicts mortality rates close to those that have been measured from the field by other workers. Mechanisms that control the spatial patchiness of eggs and larvae may control early life history survival and thereby influence relative year-class strength of adult fish stocks.
INTRODUCTION
Mathematical models of mort&ty rate in marine pelagic organisms have been based mainly on size- dependalli precidiion (Ursin i967, Ware i915, Peterson & Wroblewski 1984). The inherent assumption of these models is that predation occurs everywhere at the same rate, but this is not a realistic assumption because predation in a real aquatic ecosystem depends on the spatial distribution of both predators and prey. The act of predation includes search time as well as feeding time, which implies that the spatial distribution of prey influences both the fraction of the total time spent by a predator searching for prey, and the intensity of feed- ing (number of attacks per unit time spent feeding) once a predator has located prey.
The maximum effect of spatial distribution on mor- tality rate occurs in the limiting case where the time required by a predator to handle (capture and con- sume) a prey item is very much smaller than the total time. In this case a predator's feeding rate is not limited by handling time and it can attack every prey item it encounters. In such a situation the mortality rate inflicted on a prey population by a predator population is mainly controlled by 2 correlated variables: the time available for feeding, and the density of the prey
' Present address: Envirocon Pacific Ltd., 205-2250 Boundary Road, Burnaby, British Columbia V5M 323, Canada
@ Inter-Research/Printed in F. R. Germany
patches. The variables are correlated because they are different aspects of a single phenomenon: spatial patchiness. The fraction of the total time that is spent searching for prey is directly proportional to the frac- non of the total area that is empty of prey, and the density of prey in the remaining area is directly pro- portional to the fraction of the total area that is empty of prey.
The situation of negligible handling time occurs in nature for at least one group of prey: pelagic fish eggs and larvae. Fish eggs and newly-hatched larvae have poorly developed sensory systems, skeleton, and mus- culature. The eggs cannot evade capture once a preda- tor has fixed its attention on them, and newly-hatched larvae have only a marginally improved evasion capa- bility. However, once fish larvae begin to school, if they are a pelagic species, or migrate to the ocean floor, if they are a demersal species, the situation of negligible handling time may no longer apply. At this age and size a fish develops predator avoidance behaviour and the handling time of its predator increases towards the level where the natural mortality rate of the fish and its spatial distribution become uncoupled.
Fish eggs and larvae are known to be patchily distn- buted in space (Smith 1973, Hewitt 1981, Houde & ~ 6 v d a l 1985, Koslow et al. 1985, McGurk 1986). This implies that natural mortality rates of fish eggs and larvae are higher than would be expected from the

Mar. Ecol. Prog. Ser. 34: 227-242, 1986
general trend of mortality w t h weight in the sea, because predators have a higher feeding rate on patches of prey than on a uniform or randomly distri- buted prey. Peterson & Wroblewski (1984) noted that mortality rates of some species of fish larvae with a mean dry weight between 1 X 10-* and 1 X 10-* g were higher than expected from the overall trend of mortality rate with dry weight for fish.
This paper describes a model of mortality rate in marine pelagic fish eggs and larvae that combines the weight-dependence of previous models with an index of the spatial patchiness of the eggs and larvae. First, the model and its assumptions are described. Second, a large body of published data is used to demonstrate that mortality rates of marine pelagic fish eggs and larvae are 5 to 10 times higher than rates expected from their dry weight. Third, it is shown that this difference in mortality rates can be explained as the result of the reaction of predators to the spatial patchi- ness of the eggs and larvae. Finally, the implications of this patchiness-mortality interaction for the study of the population dynamics of fish eggs and larvae, and for the general theory of fishing, are discussed.
MODEL OF MORTALITY-PATCHINESS INTERACTION
The exponential rate of natural mortality for fish eggs and larvae is assumed to be the product of the expression for the weight-dependence of mortality, M, (d-'), and a function of patchiness, H(p),
where N = the number of eggs and larvae; t = tlme (d). M, is assumed to decrease with increasing body weight of the prey in the pelagic ecosystem according to Peterson & Wroblewski's (1984) model,
where W = dry body weight (g). This model was based on a combination of biomass spectrum theory and bioenergetics principles. It is not a regression model. It was found to describe well the trend of decreasing mortality rate with increasing size for juvenile and adult fishes.
A simple and appropriate index of spatial patchiness is Lloyd's index (Lloyd 1967, Pielou 1977),
where E = the mean density of eggs or larvae for a cruise; u2 = the variance of X. This index measures the
actual crowding of an individual, relative to the aver- age crowding expected in a randomly dispersed popu- lation. In a randomly distributed population each indi- vidual occupies its own individual space. If the dis- tribution becomes more non-random each individual comes to share its space with 'crowders'. Lloyd's index is equal to the number of 'crowders' per personal space. It is probably the best index of spatial patchi- ness because it has some biologcal meaning, it is independent of density, and it is theoretically indepen- dent of the scale of sampling. helou (1977) presented a mathematical argument based on the Poisson distribu- tion that demonstrated the latter point. However, the empirical relation between Lloyd's index and sarn- pling scale for ichthyoplankton is unknown.
Predators of fish eggs and larvae move through spaces that are empty of prey as well as spaces that contain prey. Therefore, any hypothesis that links pre- dation mortality with spatial patchiness must be tested with data that contains both zero counts and non-zero counts. An examination of the effect of including zero counts on patchiness reveals a simple empirical law: patchiness calculated from data including zero counts, p , , is always higher than patchiness calculated from data excluding zero counts, p, and the fractional change in patchiness is exactly equal to the fraction of zero counts among the total samples, Zj i.e.
Rearranging Eqn (4 ) for pl gives
The ratio 2 in Eqn (5) is equal to that fraction of the total time that is spent searching for food in empty space. Therefore, 1 - g is equal to the fraction of the total time that is spent feeding in a patch, and p , is the ratio of the relative number of prey 'crowders' ingested to the fraction of total time that is spent feeding in a patch. pl is, in fact, the ratio of the 2 correlated vari- ables discussed above that are thought to control the rate of predation in the case where handling time is negligible. It is an index of the intensity of predation; as the ratio 3 increases, a predator spends more time n searching empty space, but when it encounters a patch it feeds more rapidly and efficiently than it would if the prey were distributed more randomly in space.
The hypothesis proposed in this paper is that H(p) varies directly with 1 + p l , one for the occupant of a personal space plus the number of 'crowders' that share its space. Therefore, the complete model 1s

McGurk: Mortality of fish eggs and larvae 229
SOURCES OF DATA
Lists of data sources used in this paper are given in Table 1 and the Appendix. Table 1 lists mortality rates for populations of fish eggs and larvae with accom- panying patchiness values. All other mortality rates are included in the Appendix. The total mortality rates
of fish eggs, larvae, and juveniles, and of pelagic invertebrates were estimated as the slopes of the right- hand limbs of the catch curves (log, density on age: Ricker 1975). The catch curves of larval fishes spanned the first-feeding stage. The natural mortality rates of adult fishes and whales were calculated from several methods: catch curves of virgin populations; Beverton
Table 1. Natural mortality rates, M, dry weights, W, and spatial patchiness of marine pelagic fish eggs and larvae. Mortality rates for fish eggs and larvae that are not accompanied by estimates of patchiness are listed in the Appendix. V: average volume of water filtered in one plankton-net tow; A: total area surveyed during one cruise; N: number of sampling stations occupied during the cruise; a: area per sampling station. The mean patchiness is the geometric mean weighted by the number of samples taken on
each cruise; n: number of cruises or number of ages for which patchiness was reported. Dashes: m~ssing data
Species Area M W V A N a Patchiness Source
(d.') ( g ) (m3) (km2) (km2) X SD n -
Fish eggs Chrysophrys aura tus
Melanogramm U
aeglefin us Pleuronectes platessa
Sardinops sagax
Scomber scombrus
Hauraki Gulf. New Zealand
Browns Bank, Nova Scotia
English Channel
S California coast
NE Atlantic coast. USA
NE Atlantic coast, USA
Fish larvae Archosargus Terminos Lagoon. 0.43 9 . 2 ~ 10-5
rhornboidalis SE Mexico Clupea harengus Barkley Sound. 0.09 1 . 6 ~ 1 0 - ~ pallas1 Vancouver Is. 0.09 1 . 6 ~
U.Ub 1 . 6 ~ 1 0 - ' 0.31 1 . 6 ~ 1 0 - ~
Engraulis S California 0 22' 7 . 0 ~ 1 0 - ' mordax coast
Pleuronectes platessa
SardineUa aurita
Scom ber scombrus
Sebastes spp.
Trachurus symmetricus
English Channel 0.08" 7 5x 10-'
Senegal-Garnb~a 0 45 3 6 x lV4 coast
NE Atlantic coast 0.35 3 . 0 ~ 1 0 - ~ USA
Flemish Cap, NW Atlantic
S California coast
Crossland (1980)
Koslow et al. (1985)
Harding & Talbot (1973). Talbot (1977)
Ahlstrom (1966). Smith (1973)
Sette (1943)
Berrien et al. (1981)
- 1.6x10³ 17 9.24x10 9.80 1.69 7 Stepien (1976). Cha- vance et al. (1984)
207 4.16x10 9 4.51 1.86 1.48 4 McCurk (1986) 207 4.16X10 9 4.51 2.13 1.57 22 207 4.16X10 9 4.51 1.86 1.48 13 207 4.16X10 9 4.51 1.77 1.64 13 500 6.1 X 10⁵ 202 3.0x10³ 16 79b,d 1.34 13 Ahlstrom (1966),
Zweifel & Lasker (1976), Hewitt (1981), Zweifel & Smith (1981), Hewitt & Methot (1982)
1 . 3 ~ 10' - - 1 0 0 - - Harding & Talbot (1973), Talbot (1977)
7 . 1 ~ 1 0 ' 46 1 . 5 ~ 1 0 ' 11.39 1.76 11 Conand & Fagetti (1971). Zweifel & Lasker (1976) Conand (1977)
850 6 . 8 ~ 10' 33 2.1 X 10:' 5.38 1.26 9 Sette (1943), Kendall& Gordon (1981), Ware & Lambert (1985)
- 5 . 8 ~ 1 0 " 42 1.4x10³ 3.53 1.51 3 Anderson (1984) - 5 . 8 ~ 1 0 ' 42 1 . 4 ~ 1 0 ~ 2.43 1.09 3 - 5 . 8 ~ 1 0 ' 42 1 . 4 ~ 1 0 ~ 1.05 1.55 4
500 6.10x10⁵ 202 3.02x10³ 15.83b.d 1.41 9 Ahlstrom (1966). Hewitt (1981). Hewitt e t al. (1985)
Mean of 6 estimates of M Weighted geometric mean patchiness-at-age over the age range over which natural mortality was measured
C Mean of 79 quarterly estimates of mortality rate taken from Zweifel & Smith (1981), and 2 annual estimates for 197%79 taken from Hewitt & Methot (1982). The former were calculated assuming that average hnear rate of growth in length was 0.4 mm d-' over the 3 to 15 mm length range
Patchiness for data including zero counts, p,, was calculated by combining patchiness for data excluding zero counts, p, and data on the proportion of zero counts to total sample size, n l - n ' , (both variables taken from Hewitt [19811) with the identity: p , = p ( l - r ~ ~ . n - ' ) - ~ " Mean of 4 annual estimates 'Mortality rate at age 12.5 d, the m~dpolnt of the age range 1 to 25 d. Mortality rate fell from 1.38 d.' at hatchng to 0.18 d- ' at age 30 d
Mar. Ecol. Prog. Ser. 34 : 227-242, 1986
& Holt's (1957), Pauli's (1963), and Joseph & Callun's (1969) tag-recovery methods; regressions of total mor- tality on fishing effort to find the intercept when fish- ing effort was zero; and Beverton & Holt's (1956) method of calculating mortality rates from the parame- ters of the growth equation and the average length of the catch. No distinction was made between pelagic or demersal adult fish.
Dry weight was assumed to be 20 O/O of wet weight. Some universal assumption had to be made because the proximate compositions of many aquatic organisms are not available in the literature. The same assump- tion was used by Peterson & Wroblewslu (1984) and others.
Wet weight was calculated from the midpoint of the length range that spanned the time period over whlch the mortality rate was measured using a weight-length equation for that species. An equation for a closely related species was employed if a weight-length equa- tion was not avadable. This procedure is acceptable as long as the body shapes of the 2 species are similar, e.g. early post-yolk-sac clupeid larvae.
The average length was calculated as the definite integral of the length-age equation, g(t), from time tl to time t2, divided by t2 - t , , i.e.
The midpoint of the length range was used for species for which there were no available growth curves.
Egg wet weight was taken from the equation for the volume of a sphere,
where r = the average radius of the egg (cm); p = the specific gravity of the eggs ( l g cm-3). Egg radii were taken from the author or from Bagenal (1971), Russell (1976), and Theilacker & Dorsey (1980).
Estimates of Lloyd's patchiness index came from 3 sources: (1) values reported by the authors, e.g. Smith (1973), Hewitt (1981), Koslow et al. (1985), and McGurk (1986); (2) values calculated from densities- at-station data reported by the authors, e.g. Sette (1943), Conand & Fagetti (197 l), Crossland (1980), Ber- rien et al. (1981), Anderson (1984), and Chavance et al. (1984), or (3) values calculated from catch statistics such as the coefficient of variation of the catches reported by Harding & Talbot (1973). All estimates of patchiness were extracted from the same body of data that were used to calculate mortality rates. The patchi- ness or density-at-station data were reported for either a series of sampling cruises (Sette 1943, Conand & Fagetti 1971, Harding & Talbot 1973, Crossland 1980, Berrien et al. 1981, Anderson 1984, Chavance et al. 1984, McGurk 1986), or for a range of ages of the eggs or larvae (Smith 1973, Hewitt 1981, Koslow et al. 1985). The calculation of patchiness for density-at-station data was as follows: (1) a mean density, a variance, and a single patchness index were calculated for each cruise; (2) each value of patchiness was log,-trans- formed, because patchiness is log-normally distributed for many of the species for which it has been measured, and was then weighted by the total number of samples used to estimate it, because the accuracy of a statistic increases with the number of samples used to calculate it; and (3) a mean (k 1 SD) patchiness value was calcu- lated from the weighted log, (patchiness) values for the series of cruises. The patchiness values reported for a range of ages had to be adjusted so that they were
o Fish eggs
Fish larvae 0 JuvenileIAdult f i sh A Whales
0 Pelagic inver tebra tes
I O - ~ 1 o - ~ 1 o - ~ 1 1 02 1 0 4 1 0 6
D r y Weight ( g )
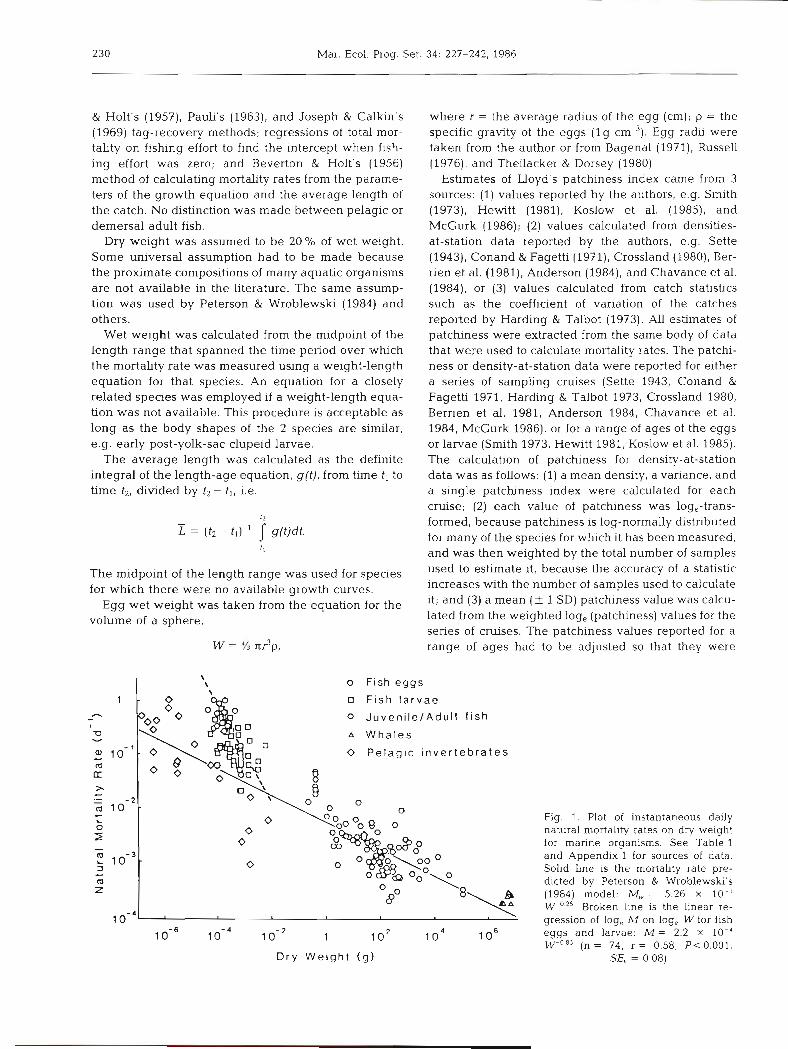
Fig. 1. Plot of instantaneous daily natural mortality rates on dry weight for manne organisms. See Table 1 and Appendix 1 for sources of data. Solid line is the mortality rate pre- dicted by Peterson & Wroblewski's (1984) model: M, = 5.26 X 10⁻³ W-'.*' Broken llne is the linear re- gression of log, M on log, W for fish eggs and larvae: M = 2.2 X 10-' W-''' (n = 74, r = 0.58, P<0.001,
SE, = 0.08)

McCurk: Mortality of fish eggs and larvae 23 1
comparable to those calculated directly from density- at-station data. This was done by: ( l ) using the reported mortality rates to calculate the relative number of eggs or larvae that were present at each age; (2) weighting each log,-transformed value of patchiness-at-age by the relative number of individu- als at that age; and (3) calculating a mean (+ 1 SD) patchiness value from the weighted log (patchiness-at- age) values. This procedure gives patchiness values that are correlated to some small degree with the observed field mortality rates. Therefore, caution was exercised in employing these data.
Sampling scale was measured with 2 variables: (1) the average volume of water filtered by one tow of the plankton net; and (2) the average area surrounded by a single sampling station. This latter variable corresponds to Lloyd's (1967) definition of a quadrat. I assumed that all surveys were performed over a uniform grid of stations. The total survey area was estimated from maps reported by the authors and then divided by the total number of sampling stations to give the average area of the quadrat surrounding a single station. All linear regressions reported in this paper are of
the functional, rather than predictive, type because of all the variables were measured with error. In such cases the functional regression provides the best esti- mate of the central tendency of the relation (Ricker 1973).
RESULTS
Natural mortality and dry weight
The plot of natural mortality rates on dry weight (Fig. 1) shows that the mortality rates predicted by Peterson & Wroblewski's (1984) model provide an excellent overall fit to the data for pelagic inverte- brates, juvenile and adult fish, and whales, over a weight range of 14 orders of magnitude. The plot also shows that: (1) their model consistently underestimates the mortality rates within the fish eggs and larvae group; (2) these rates are 5 to 10 times higher than those predicted from their dry weight; and (3) the weight exponent of the mortality rate for fish eggs and larvae is more than 3 times higher than -%. The relation estimated by the linear regression of log, M on log, W for fish eggs and larvae is
M = 2.2 X 1 0 - ~ w0.85; = 74; r = 0.58; P < 0.001; SE, = 0.08, (7)
where SE, = the standard error of the slope, v. These 3 observations suggest that a variable additional to dry weight is involved in determining the natural mortality
rates of manne pelagic fish eggs and larvae. The hidden variable, H, must be equal to the ratio of the observed mortality rate a s summarized by Eqn (7) to that predicted by Eqn (2) , or
H = 4.18 X 10⁻² wo60. (8)
Patchiness of fish eggs and larvae
The patchiness of marine pelagic fish eggs and lar- vae is generally log-normally distributed within a species (Fig. 2). Therefore, the geometric mean is the appropriate statistic of the central tendency of patchi- ness (Table 1). A plot of mean patchiness on dry weight (Fig. 3) demonstrates that patchiness is an excellent
S c o m b e r s c o m b r u s I
S c o m b e r
s c o m b r u s
P l e u r o n e c l e s
I p l a t e s s a I ii
C l u p e a h a r e n g u s p a l l a s #
C l u p e a h a r e n g u s p a l l a s i I ",
C l u ~ e a h a r e n g u s
p a l l a s i I Q S e b a s l e s S D P I 4 I S e b a s t e s S D P e S e b a s t e s s p p l S c o m b s r
s c o m b r u s I
Larvae
Patchiness
Fig. 2. Frequency distribution of sample-welghted log,-trans- formed Lloyd's patchiness index for 10 species of manne pelagic flsh eggs and larvae. Vertical axes range from 0.0 to
1.0. Empty circles indicate mean log, (patchiness)

232 Mar. Ecol. Prog. Ser. 34: 227-242, 1986
candidate for the hidden variable, H; the mean patchi- ness values of the eggs of 5 species of fish and the larvae of 8 species of fish fall symmetrically about the line described by Eqn (8). The linear regression of log, (mean patchiness) on log, W has a slope ( + 1 SE) of -0.79 (t 0.15); the slope (k 1 SE) for the regression using only patchiness-cruise data is -0.71 (f 0.14). Although both the slopes and the intercepts are higher than those of Eqn (8), the fit of the patchiness data is good considering the error involved in measuring both patchiness and dry weight.
In order to determine if the scale of sampling has an effect on patchiness 2 indices of sampling scale were
5 1 o - ~ 1 o - ~ 1 o - ~
Dry Weight (g)
Fig. 3. h n e a r regression of mean log, (patchiness) on log, (dry weight) for marine pelagic fish eggs and larvae. Vertical bars indicate f l standard deviation of mean log, (patchiness). Broken line is the predicted line for the hidden variable, H. Open symbols are patchmess values from patchiness-at-age data; closed symbols are values from patchiness-cruise data
devised: (1) the average volume of water filtered in one plankton-net tow; and (2) the average area per sampling station. Unfortunately, the volume of water filtered was reported for only 7 of the 13 species listed in Table 1. In the other 6 species it was replaced with numbers of eggs or larvae m-2 surface area or numbers m-' d-l. The information required to convert one set of numbers to another was not reported. Therefore, the residuals of the patchiness-weight regression were plotted on area per stahon. They were positively and significantly (0.001 .< P < 0.005) correlated with area per station but this correlation depended totally on the area per station of the 3 species sampled by the Cal- COFI ichthyoplankton survey grid off southern Califor- nia (Ahlstrom 1966): Sardinops sagaz eggs, and En- graulis mordax and Trachurus symmetricus larvae.
0 r e 0 10 20
Patchiness
Fig. 4. Linear regression of the ratio of observed mortality. M, to the rate predicted by Peterson & Wroblewski's (1984) model, M,, on Lloyd's patchiness index. Broken hne IS pre- dicted from Eqn (6 ) : M . M , = 1 + p,. Open symbols are patchiness values calculated from patchiness-at-age data;
closed symbols from patchiness-crulse data
Observed M (d-'1 Fig. 5. Lnear regression of mortality rates predicted by the mortality-patchiness model, M = 5.26 X 10⁻³ W-"'" (1 + PI), on observed field mortality rates. Broken line is the Line of equality between predicted and observed. Open symbols are patchiness values calculated from patchmess-at-age data;
closed symbols are values from patchiness-cruise data

McGurk Mortality of fish eggs and larvae 233
When these species were removed the correlation was not significant ( P > 0.05). Since: (1) two of these 3 Cal- COFI data points were derived from patchiness-at-age data, which is considered less trustworthy than patchi- ness-cruise data; (2) there was no relation between the residuals and area per station over the range 0 to 2050 km2; and (3) there is no other evidence to support the hypothesis that patchiness increases with increasing quadrat size, but theoretical arguments that support the opposite, patchiness was not corrected for the effects of sampling scale.
Patchiness-mortality interaction
A plot of the ratio of the observed field mortahty rates to that predicted by Eqn (2) on mean patchiness shows that the 2 variables are highly correlated (Fig. 4) . This correlation remains after the 3 patchiness- at-age data points are removed, although the level of significance falls to 0.01 < P < 0.05. The slope and the intercept of the regression are indistinguishable from 1.0, which supports the theoretical arguments that the hidden variable is equal to 1 + patchiness. When the mortality rate predicted by Eqn (6) is plotted against the observed field mortality rates (Fig. S), the data points fall symmetrically about the line of equality. A linear regression of predicted on observed mortality rate has a slope that is within 1 standard error of the line of equality and an intercept that is indistinguish- able from zero. These results are unchanged when the 3 patchiness-at-age data points are removed. In summary, the evidence supports the hypothesis that the mortality rates of marine pelagic fish eggs and larvae vary directly with their spatial patchiness as measured by 1 + Lloyd's patchiness index.
DISCUSSION
Powerful ideas generate new questions as well as answer old ones. The allometric approach to studying ecosystem processes has produced a simple model of the weight-dependence of mortality rate in the pelagic ecosystem. It has also generated a new question: why are the mortality rates of marine pelagic fish eggs and larvae so much higher than those predicted by this general trend line? This observation is what Schmidt- Nielsen (1984) calls a 'secondary signal'. I propose one possible answer: the mortality rate for this group of animals is directly proportional to their spatial patchi- ness. This hypothesis has biological meaning that is rooted in the idea that fish embryos and early stage larvae are more vulnerable to predators than they would otherwise be on the basis of their body weight.
Their vulnerability implies that the feeding rate of their predators is limited more by the time required to locate them than by the time required to capture and consume them. Thus the spatial distribution of fish eggs and larvae determines how often a predator encounters a patch of eggs or larvae and how intense is the predation mortality on a patch.
Peterson & Wroblewski's (1984) premise, that natural mortality rate scales as the -0.25 power of dry weight, was derived from data on juvenile and adult fish only, but it also happens to describe well the overall trend of mortality rate with dry weight for organisms other than adult fish. It also happens to be the exponent for the weight-dependence of specific metabolic rate (meta- bolic rate per unit weight). Therefore, it was used in this paper as a convenient description of the first-order scaling of natural mortality rate. In this argument, patchiness is considered to be a second-order scaling. I recognize that the weight exponent of mortality rate may be quite different from -0.25 for groups other than fishes. It is possible that the profound differences in the mass exponent and scallng coefficient of the production/biomass (P/B) ratios between inverte- brates, fishes, and mammals that were demonstrated by Banse & Mosher (1980) have counterparts in the weight exponents of natural mortality rate. In a steady- state system the P/B ratio is equivalent to natural mortality rate because it is that fraction of the produc- tion which is excess to the requirements of maintaining a steady-state biomass and which is lost to predation. The question of the correct numerical weight exponent of mortality rates is still an open one; it can be ans- wered by: (1) evaluating the parameters of Peterson & Wroblewski's Eqn (6), M , = ckW-", for organisms other than fish; (2) by filling the gaps in the mortality- weight plot, particularly the gap between 10-' and 1 g and the very large gap between 10-'' and 10-"g; and (3) by devising and testing second-order ecological hypotheses to account for any between-group differ- ences in the weight exponent. However, even if it can be demonstrated that the overall weight exponent is not -0.25, this does not affect the core of the mortality- patchiness hypothesis. There is a real correlation between natural mortality and spatial patchiness in pelagic fish eggs and larvae and there are logical arguments to support the idea that this correlation is causal in nature.
The mortality-patchiness hypothesis is a significant improvement over Peterson & Wroblewski's (1984) model; it reduces the deviation between model and observation from a factor of +5 to 10 to a factor of f l. The fit of the field mortality rates to the model is excellent for those species whose eggs and larvae experience mortality rates less than 0.1 d-': Pleuro- nectes platessa eggs and larvae, Clupea harengus

234 Mar. Ecol. Prog. Ser.
pallasi larvae, and Sebastes spp. larvae. The fit is less good for those with higher mortality rates. One reason for the relatively poor fit of the latter group is real variation in time and space of both mortality and patchiness.
In this analysis natural mortality rates are assumed to be constant over the egg and larval stages even though it is obvious that over longer time periods mortality must decrease in order to approach the lower values that have been measured for juvenile and adult fish. The assumption of constant mortality rate has been commonly used in larval fish ecology and it is supported by the fact that the catch curves of most fish eggs and larvae are relatively straight (May 1974, Dahlberg 1979). This assumption is probably reason- able for those species which fall on the low mortality/ low patchiness end of the mortality-patchiness con- tinuum, but it is probably not an accurate assumption for those species in the high mortality/high patchmess group. An example of the former is Pacific hemng Clupea harenguspallasi; the larvae lose 2.5 patchiness points over a 25 d period before they begin to school (McGurk 1986). According to the mortality-patchiness hypothesis this implies a 2.5-fold decrease in larval mortality rate over this period, a decrease which is probably within the range of observational error; the catch curves measured for all populations of larval Pacific hemng have been straight (McGurk 1984, 1986). An example of the latter group is the jack mackerel Trachurus symmetricus, which loses 12 patchiness points in 4 d of early larval life (Hewitt 1981). Hewitt et al. (1985) reported that the mortality rate of larval jack mackerel off southern Cahfornia decreases from 1.37 d-l at hatch to 0.18 d-' 30 d later (Table l ) , a 7.6-fold decrease. The eggs of the Pacific sardine Sardinops sagax lose about 50 patchiness points in 3 d (Smith 1973), indicating that the mortality rate should decrease 50-fold during the egg stage. This rapid change in mortality rate may not be measurable with current sampling and egg-aging techniques. At the very least, it suggests that the estimate of M =
0.31 d-' (Table 1) for Pacific sardine eggs is too low. Mortality rates have been assumed to operate
uniformly in space but there is evidence to indicate that mortality varies spatially as well as temporally. Irreversibly starving larvae have been found to be patchily distributed by Shelbourne (1957: Pleuronectes platessa), O'Connell (1980: Engraulis mordax), Hewitt et al. (1985: Trachurus symmetricus), and McGurk (1986: Clupea harengus pallasi]. The role of irrevers- ible starvation has been ignored in this analysis because there is no agreement on how the instantane- ous rate of mortahty due to starvation is to be calcu- lated, and therefore, there is no agreement on its rela- tive importance to total mortality. The evidence to date
indicates that starvation occurs in nature but that it is responsible for only 3 to 25 % of total mortality (McGurk 1986). Eqn (6) can be easily modified to accept an additive term for starvation mortality. This subject deserves further investigation.
Spatial patchiness also changes with time and space. It changes with age as eggs disperse from their spawn- ing sites and as larvae develop schooling behaviour (Hewitt 1981, Koslow et al. 1985, McGurk 1986). Therefore, the patchiness indices calculated from ich- thyoplankton sample data are influenced by the daily rate of production of eggs and larvae, the daily rate of mortality, and the age structure of the population. Despite theoretical argument to the contrary, it is entirely reasonable to suppose that there is a relation- ship between patchiness and sampling scale. The nature of the relationship, if it exists, is entirely unknown; it deserves more investigation.
The success of Eqn (6) in predicting the mortality rates of fish eggs and larvae in the sea has implications for the study of reproductive strategies in marine fishes, and for the study of the recruitment process. Those species which release eggs in a highly patchy pattern, e.g. Pacific sardine, experience relatively high egg and larval mortality rates. 1 speculate that there are advantages to patchy egg release that offset the losses due to predation. One possible advantage is predator avoidance by the spawning adults. A com- prehensive theory of reproductive strategies in fishes must combine hypotheses of egg release in space with hypotheses of egg release in time (Lambert & Ware 1984).
The model implies that turbulent mixing of the upper sea due to storms, upwelling events, and tides would promote dispersal of eggs and larvae and thereby decrease predation mortality, while stratifica- tion of the water would tend to retard dispersal and so increase predation mortality. Lasker (1985) has prop- osed that stratification would tend to promote survival in larval fishes by d o w i n g the formation of patches of food organisms with sufficient density to promote suc- cessful first-feeding. The optimal environment for lar- val survival may be a balance between high densities of aggregated food organisms and low densities of well-dispersed larvae. Such an environment occurs whenever hspersing larvae drift into a front between 2 water masses where mixing is vigorous and biological production is high. These fronts are presumed to define and surround larval fish retention zones (Iles & Sinclair 1982).
The patchiness-mortality hypothesis described in this paper can be generalized to any predator-prey system where handling time can be considered a rela- tively small quantity. One system of obvious practical importance is predation by man on schooling pelagic
McGurk: Mortality of fish eggs and larvae 235
fishes. For such fisheries the limiting step is the time required to locate a school, not the time required to handle it. For example, once a purse-seine vessel has located a school of herring and manoevered its gear into the school it can often capture a large proportion of the school. It is reasonable to speculate that the instan- taneous rate of fishing mortality is proportional to the spatial patchiness of the herring. Since fishing mortal- ity is equal to the product of the catchability coefficient and fishing effort, this implies that the catchability
coefficient is directly proportional to the spatial patchi- ness of the fish. It also implies that management policies that involve restricting the area1 extent of a fishery may be biasing the catchability of the fleet and the fishing mortality that it exerts on the stock. This generalization of the mortality-patchiness hypothesis and others have yet to be tested.
Acknowledgements. Earlier versions of this paper were read and commented upon by N. J. Wilimovsky, D. Hay, K. Banse, L. M . Dickie, and one anonymous referee.
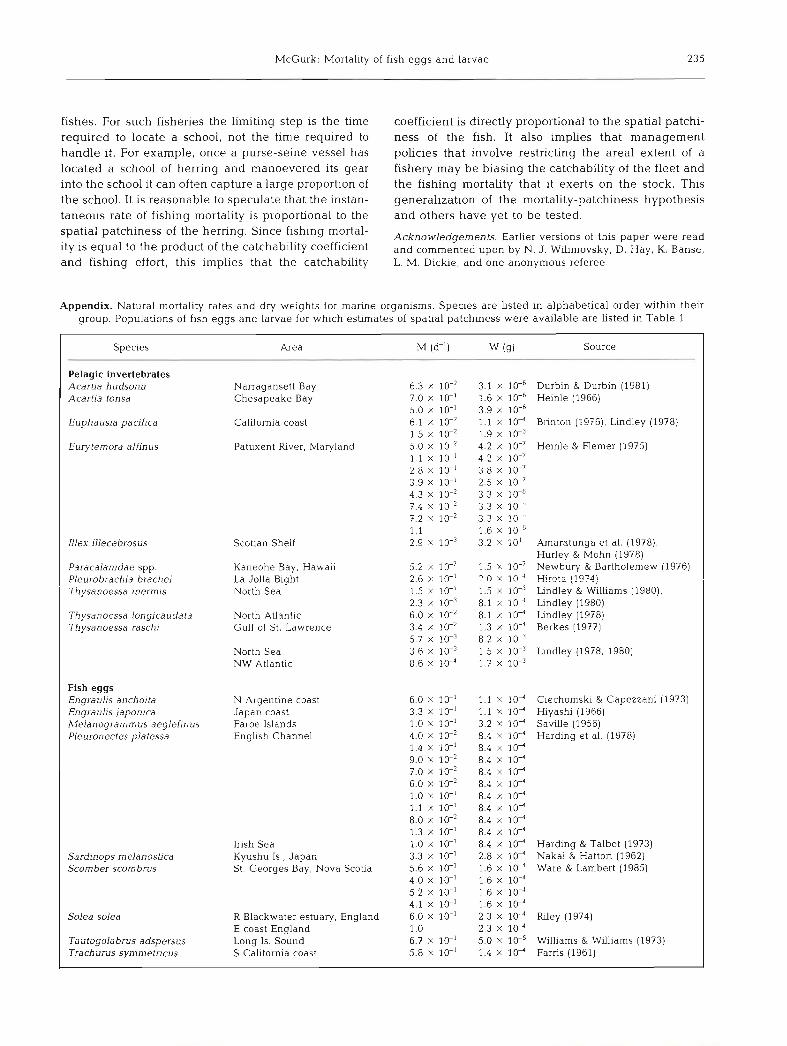
Appendix. Natural mortality rates and dry weights for marine organisms. Species are listed in alphabetical order within their group. Populations of fish eggs and larvae for which estimates of spatial patchmess were available are listed in Table 1
Species Area
Pelagic invertebrates AcarOa hudsonu Acartia tonsa
Eurytemora affinus
Illex illecebrosus
Paracalanidae spp Pleurobrachia brache~ Th ysanoessa jnerrnls
Thysanoessa longicaudata Thysanoessa raschi
Fish eggs Engra ulis anchoita Engra ulis japon~ca Melanograrnrnus aeglefznus Pleuronectes platessa
Sardinops melanostica Scorn ber scorn brus
Tautogolabrus adspersus Trachurus syrnrnetncus
Narragansett Bay Chesapeake Bay
California coast
Patuxent kve r , Maryland
Scotian Shelf
Kaneohe Bay, Hawail La Jolla Bight North Sea
North Atlantic Gulf of St. Lawrence
North Sea NW Atlantic
N Argentine coast Japan coast Faroe Islands English Channel
Irish Sea Kyushu Is., Japan St. Georges Bay, Nova Scotia
R Blackwater estuary, England E coast England Long Is. Sound S California coast
W (g) Source
3.1 X IO-~ Durbin & Durbin (1981) 1.6 X Heinle (1966) 3 9 X 10-~ 1.1 X 10" Bnnton (1976). L~ndley (1978) 1.9 X 1 0 - ~ 4.2 X 10-' Heinle & Flemer (1975) 4.2 X 10-' 3.8 X 10⁻⁷ 2.5 X 10-' 3.3 X IO-~ 3.3 X 10 " 3 3 X 1 0 " 1.6 X 10-" 3.2 x 10' Amaratunga et al. (19781,
Hurley & Mohn (1978) 1.5 X 10-' Newbury & Bartholemew (1976) 7 0 x l c ! Hlrnta (1974; 1.5 X 10-' Lndley & Williams (1980), 8.1 X 10 ' Lindley (1980) 8.1 X 10" Lndley (1978) 1.3 X IO-~ Berkes (1977) 8.2 X 10 ' 1.5 X I O - ~ Llndley (1978. 1980) 1.7 X 10⁻³
6.0 X 10-I 1.1 X 10" Ciechornski & Capezzani (1973) 3.3 X 10-I 1.1 X 10" Hiyashl (1966) 1.0 x 10-l 3.2 x 10⁴ Savdle (1956) 4.0 X 10⁻² 8.4 X 10⁻⁴ Harding et al. (1978) 1 4 X 10-' 8.4 X 10⁴ 9.0 X IO-~ 8 4 X 10⁴ 7.0 X IO-~ 8.4 X 10A 6.0 X 10-~ 8.4 X 10⁴ 1.0 X 10-' 8.4 X 10" ~ . i x i o - ' 8 . 4 ~ 1 0 " 8.0 X 1 0 - ~ 8.4 X 10⁴ 1.3 X 10-I 8.4 X 10" 1.0 X 10-' 8.4 X 10" Hardmg & Talbot (1973) 3.3 X 10-' 2.8 X 10A Nakai & Hatton (1962) 5.6 X 10-' 1.6 X 10⁴ Ware & Lambert (1985) 4.0 X 10-' 1.6 X 10" 5.2 X 10-' 1.6 X 10" 4.1 X 10-' 1.6 X 10A 6.0 x 10-' 2.3 X 10n Mey (1974) 1.0 2.3 X 10n 6.7 X 10-' 5.0 X 10-' Wilhams & Williams (1973) 5.8 x 10-' 1.4 X 10" Farris (1961)

Mar. Ecol. Prog. Ser. 34: 227-242, 1986
Species
Fish larvae Clupea harengus harengus
Clupea harengus pallasi
Engraulis japonica
Etrurneus teres
Harengula jaguana
I Melanograrnm us aeglefin us Micromesistius poutassou Opisthonema o ~ h u m
Pleuronectes platessa
Pseudopleuronectes arnerican us Sardinops melanostica
Sardinops sagax
Scorn ber japonicus
Scorn ber scorn brus
Juvenile and adult fishes Arnmodytes tobianus Argentina sjlus Argyrosornus argen ta tus Blennius pholis Brevoortia tyrannus Cephalopholis fulva Cetengraulis mysticetus Cheilodactylus macropterus Clupea haiengus haringus
Colabis saira Cynoscion nebulosus Cynoscion nobilis Eopsetta jordani
Epinephelus guttatus Epinephelus striatus Etrumeus micropus Fundulus heterocljtus Gadus rnacrocephalus Gadus minutus
Appendix (continued)
Area M (d-l)
Bay of Fundy. Nova Scotia
Norwegian coast
Georges Bank
R Blackwater estuary, England 6.0 X 1 0 - ~ 7.0 X 10-'
Barkley Sound, British Columbia 4.1 X 10-' Queen Cove, Vancouver Is. 2.5 X TO-' Akkeshi Bay. Japan 9.0 X 10-'
1.2 X 10-' W coast Japan 3.0 X 10-I
E Gulf of Mexico
E Gulf of ~Mexico North Sea Rockall Bank, NE Atlantic E Gulf of Mexico
English Channel
Mystic R, Connecticut S Japan coast
S California coast
Japan coast
St. Georges Bay, Nova Scotia
SE English coast 3.3 X 10⁴ Nova Scotia banks 7.7 X 10 " E China and Yellow Seas 1.9 X I O - ~ Menai Straits, Wales 2.5 X 1 0 ~ ~ Chesapeake Bay 1.0 X 10 ' S Jamaican Shelf 1.5 X I O - ~ Gulf of Panama 5.8 X 1 0 - ~ Chatham Is.. New Zealand 2.2 X 10 ': Celtic Sea 5.5 X 10" S North Sea 5.5 X lo4 Lusterfjord, Norway 2.1 X I O - ~ N Norway Sea 9.4 X IO-.~ NE Pacific 4.4 X l 0 I' SW Florida coast 1.2 X 1 0 ~ ~ California coast 8.3 X lo4 British Columbia coast 6.9 X lo4
5.5 X 10⁴ S Jamaican Shelf 1.9 X I O - ~ S Jamaican Shelf 5.8 X 10⁴ W Sea of Kyushu 1.9 X I O - ~ Delaware Bay, USA 1.9 X 10 ' Hecate Strait, British Columbia 2.5 x 10 ' English Channel 3.0 X 10 '
2.5 X 10⁻³
W (g) Source
l. 1 X 10⁴ Das (1968). Laurence (1979) 1.1 X 10⁻⁴ 1.1 X 10⁴ 1.4 x 10" Dragesund & Nakken (197la),
Laurence (197 9) 1.4 X 10" Dragesund & Nakken (1971b),
Laurence (1979) 1.6 x I O - ~ Laurence (1979),
Lough et al. (1981) 4.6 x 10⁴ Henderson et al. (1984), 4.6 x 10⁴ Laurence (1979) 3.0 x 10" Stevenson (1962), McGurk (1986) 3.0 X 10⁴ 3.3 X 10" Iizuka (1966), McGurk (1986) 3.3 X to4 7.0 X 10⁴ Hiyashi (1966),
Zweifel & Lasker (1976' 2.7 x 10⁴ Houde (1977a) 2.2 X 10⁻⁴ 3.0 x 10⁴ Houde (1977~) 4.9 x 10⁴ Jones (1973), Laurence (1979) 2.7 X 10⁴ Bailey (1974), Laurence (1979) 3.7 X 10⁴ Houde (l977b) 3.7 X 10⁴ 7.5 x 10⁻⁴ Bannister et al. (1974).
Ryland (1966) 7.5 X 10⁴ 6.0 X IO-' Pearcy (1962a, b) 7.0 x 10⁴ Nakai & Hattori (1962).
Zweifel & Lasker (1976) 1.8 x 1 0 - ~ Lenarz (1973),
Zweifel & Lasker (1976) 7 .O x I O - ~ Watanabe (197O),
Ware & Lambert (1985) 1.7 X 10⁴ Ware & Lambert (1985) 1.7 X 10⁴ 1.7 X 10⁴
Reay (1973) Zukowski (1972) Mako (1961) Qasirn (1957) Schaaf & Huntsman (1972) Thompson & Munro (1978) Bayliff (1966) Vooren (1977) Burd & Bracken (1965) Cushing & Bridger (1966) Aasen (1952) Dragesund (1970) Hughes (1974) Iverson & Moffet (1962) Thomas (1968) Ketchen & Forrester (1966)
Thompson & Munro (1978) Thompson & Munro (1978) Chullasorn et al. (1977) Meredith & Lotrich (1979) Ketchen (1964) Menon (1950)

McGurk: Mortality of f ~ s h eggs and larvae 237
Appendix (continued)
Species Area M (d-l)
Gadus morhua Labrador coast 4.9 X lo4 Faroe Islands 4.7 X lo4 Gulf of St. Lawrence 2.7 X 10⁴ W Baltic Sea 9.6 X 10⁴ S Gulf of St. Lawrence 5.2 X 10⁴
Source
Pinhorn (1975) Jones (1966) Dickie (1964) Jensen (1959), Bagge (1974) Paloheirno & Kohler (1968), Kohler et al. (1970) Minet (1978) Grant et al. (1979)
NE Gulf of St. Lawrence SE Australian coast Galeorhinus australis
Glyptocephalus cynoglossus SW Newfoundland Kohler et al. (1970), Bowering (1977) Pitt (1973), Kohler et al. (19701 Hennernuth (1959), Joseph & Calkins (1969) Pauly (1980) Lebeau & Cueff (1975) Matthews (1975) Nelson & Larklns (1970) Whte & Chittenden (1977) Broadhead (1953). Broadhead & Mefford (1956) Hennernuth (1961) Pauly & Martosuboro (1980) Everson (1970) Burchett & Ricketts (1984) Manooch & Huntsmann (1977) Young (1963) Holland (1969)
Hippoglossoides platessoides Grand Banks
E Pacific Katsu wonus pelamis
Le~ogna thus splendens Letlirinus en~gma tus A4erluccius angustimanus Merluccius productus Micropogonias undulatus Mugil cephalus
Borneo coast S Inchan Ocean Gulf of California NE Pacific N Gulf of Mexico N Gulf of Mexico
E Pacific S China Sea S Orkney Islands S Georgia, Antarctica Caroline coast, USA California coast Puget Sound, USA
Neoth unnus macropterus Nemipterus marginatus Notothenia neglecta Notothenia rossi Pagrus pagrus Paralabrax clathrus Parophrys vetulus
N Hecate Strait, British Columbi Ketchen (1947). Holland (1969)
Pleuronectes pla tessa Kuipers (1977) Kuipers (1977), Lockwood (1980)
Wadden Sea Filey Bay. England
Firernore Bay, Scotland
Port Erin Bay, lreland Red Wharf Bay, N Wales North Sea
Pseudopeneus maculatus S Jamaican Shelf Pseudopleuronectes amencanus Mystic R, Connecticut
Macer (1967). Kuipers (1977) Beverton & Holt (1957) Munro (1976) Pearcy (1962b)
St Mary's Bay, Nova Scoha Massachusetts coast
Dickie & McCracken (1955) Lux (1969), Howe & Coates (1975) Rao (1966, 1968) Mako (1961) Sudjastani (1974) Hongskul (1974) Webb (1972), Colman (1978) Newman (1970) Mako (1961) Paciorkowski et al. (1973) Isakov (1974) Westrheim & Snytko (1974), Gunderson (1977)
Pseudosdaena diacan thus Pseudosdaena manchurica Rastrelliger kanagurta Rastrelliger neglectus Rhombosolea plebeia Sardinops ocellatus Saun-da tumbil Scomber scombrus
E lndian Ocean E China and Yellow Seas Java Sea Gulf of Thailand Canterbury. New Zealand Walvis Bay, S Africa E China and Yellow Seas New England coast
Sebastes alutus NE Pacific
Queen Charlotte Sound Gulf of Alaska Westrheim & Snytko (1974),
Chikuni (1975) Aleutian Islands 1.2 X 1 0 ~ ~
Sphyraena argentea California coast 5.0 X 10⁴

238 Mar. Ecol. Prog. Ser. 34: 227-242, 1986
Appendix (continued)
Species Area M (d-') l.V (g) Source
Sprattus sprattus Skagerak, Sweden 2.9 X I O - ~ 6.4 Johnson. (1970). Lndquist (1978)
North Sea 3.3 X 1 0 - v . 3 Bailey (1980) Stenotomus chrysops E Long Is. Sound 4.4 X 10-R 5.7 X 10' Briggs (1968),
Finkelstein (1971) Tajus tumifrons E China Sea 5.5 X 10⁴ 1.4 X 10² Shindo (1960) 73unnus obesus Central Atlantlc 1.2 X I O - ~ 1.5 X 10⁴ Lenarz (1974), Kume (1977)
Pacific Ocean 9.9 X 10⁴ 5.7 X 10³ Sllliman (1966), Suda & Kume (1967)
E China Sea 2.7 X 10" 2.8 X 10' Mitani & Shojima (1966) E China and Yellow Seas 9.9 X 10⁴ 6.1 X 10' Misu (1964) N North Sea 4.4 X 1 0 ~ ~ 3.4 Raitt (1968) Victoria State, Australia 1.2 X I O - ~ 7.8 X 10' Edwards (1980) Georges Bank 2.3 X 1 0 - ~ 5.1 X 10' Kohler et al. (1970),
Rikhter (1974)
Trachums japonicus Trichiums lepturus Trisopterus esmarkil Urolophus paucimaculatus Urophysis chuss
Whales Balaenopterus boreahs Eschnchtius robustus
Megaptera novaeangljae
Physeter catodon
S Africa coast E Pacific Ocean
Antarctic Ocean
S Africa coast
1 6 X 10⁴ 3.6 X 10⁶ Lockyer (1977a, b) 2.2 X 10⁴ 5.0 x 10⁶ Rice & Wolman (1971) 2.6 X 10⁴ 5.8 X 10⁶ 2.4 X 10⁴ 5.8 X 10⁶ Chittleborough (1965), 2.4 X 10⁴ 6.6 x 10⁶ Lockyer (1976) 1.6 X 10⁴ 6.6 X 10⁶ Gambell (1974). 1.6 X 10⁴ 3.1 X 10"len & firkwood (1977)
LITERATURE CITED
Aasen. 0. (1952). The Lusterfjord herring. F~sk . Dir. Skr.. Ser. Havunders. 10 (2)
Ahlstrom, E. H. (1966). Distribution and abundance of sardine and anchovy larvae in the California Current region off California and Baja California, 1951-64, a summary. Spec. Scient. Rep. U.S. Fish Wildl. Serv. (Fisheries) No. 534
Allen, K. R., Kirkwood, G. P. (1977). Further development of sperm whale population models. Int. Whaling Comm. Rep. 27: 106-112
Amaratunga, T., Roberge, M., Wood, L. (1978). An outline of the fishery and biology of the short-finned squid, Illex illecebrosus, in Eastern Canada. In: Balch, N.. Ama- ratunga, T., O'Dor. R. K. (ed.) Proceedings of the workshop on IUex illecebrosus. Tech. Rep. Fish. Mar. Serv. Canada NO. 833, p. 2.1-2.17
Anderson. J. T. (1984). Early l ~ f e history of redfish (Sebastes spp.) on Flemish Cap. Can. J. Fish. Aquat. Sci. 41: 110&1116
Bagenal, T. B. (1971). The interrelation of the size of fish eggs, the date of spawning and the production cycle. J F ~ s h Biol. 3: 207-219
Bagge, 0. (1974). The Danish cod fishery in the Baltic 1957-70. Rapp. P.-v. Reun. Cons. int. Explor. Mer 166: 103-105
Bailey, R. S. (1974). The life history and biology of the blue whiting in the northeast Atlantic. I. The planktonic phase in the Rockall area. Mar. Ser. Scotl. 1974 (1): 1-29
Bailey, R. S. (1980). Problems in the management of short- lived pe lapc fish as exemplified by North Sea sprat. Rapp. P.-v. Reun. Cons. int. Explor. Mer 177: 477-488
Bann~ster, R. C. A., Harding, D., Lockwood, S. J. (1974). Larval mortality and subsequent year class strength in the plaice (Pleuronectes platessa L.). In: Blaxter, J. H. S. (ed.) The early Me history of fish. Springer-Verlag, Berlin, p . 21-37
Banse, K., Mosher, S. (1980). Adult body mass and annual
production/biomass relationships of field populations. Ecol. Monogr. 50: 355-379
Bayliff, W. H. (1966). Population dynamics of the anchoveta, Cetengrauh mysticetus, in the Gulf of Panama, as deter- mined by tagging experiments. Bull. Inter-Am. Trop. Tuna Comm. 11: 1-288
Berkes, F. (1977). Production of the euphausiid crustacean Thysanoessa raschi in the Gulf of St. Lawrence. J. Fish. Res. Bd Can. 34: 443446
Berrien, P. L., Naplin, N. A., Pennington, M. R. (1981). Atlan- tic mackerel, Scomber scombrus, egg production and spawning population estimates for 1977 in the Gulf of Mexico, Georges Bank, and middle Atlantic Bight. Rapp. P.-v. R6un. Cons. int. Explor. Mer 178: 279-288
Beverton, R. J. H., Holt, S. J. (1956). A review of methods for estimating mortality rates in exploited populations, with special reference to causes of bias in catch sampling. Rapp. P.-v. Reun. Cons. int. Explor. Mer 140: 67-83
Beverton, R. J. H., Holt, S. J. (1957). On the dynam~cs of exploited fish populations. U.K. Min. Agric. Fish., Fish. Invest., London, Series 11, 19, p. 1-533
Bowering, W. R. (1977). The status of the witch flounder fishery in ICNAF Subdivision 3PS. ICNAF Select. Pap. No. 2: 11-14
Briggs, P. T (1968). The sport fisheries in the inshore waters of eastern Long Island. N.Y. Fish Game J. 15: 165-185
Bnnton, E. (1976). Population biology of Euphauua pacifica off southern California. Fish. Bull. U.S. 74: 733-762
Broadhead, G. C. (1953). Investigations of the black mullet, Mugd cephalus L., in northwest Florida. Florida State Board of Conservation, Tech. Ser. No. 7, p. 1-34
Broadhead, G. C. , Mefford, H P. (1956). The migration and exploitalon of the black mullet, Mugil cephalus L., in Florida, as determined from tagging during 194%1953. Florida State Board of Conservation. Tech. Ser. No. 18, p. 1-31
Burchett, M. S., Ricketts, C. (1984). The population dynamics

McGurk: Mortality of fish eggs and larvae 239
of Notothenia rossi from South Georgia (Antarctica). Polar Biology 3: 35-38
Burd, A. C., Bracken, J. (1965). Studies on the Dunmore herring stock. I . A population assessment. J . Cons. int Explor. Mer 29: 277-301
Chavance, P., Flores-Coto, C., Sanchez-lturbe, A. (1984). Early Life history and adult biomass of sea bream in the Terminos Lagoon, southern Gulf of Mexico. Trans. Am. Fish. Soc. 113: 166-177
Chikuni, S. (1975). Biological studies on the population of the Pacific ocean perch in the North Pacific. Bull. Far Seas Fish. Res. Lab. No. 12: 1-119
Chittleborough, R. G. (1965). Dynamics of two populations of the humpback whale, Megaptera novaeangliae (Borow- ski). Aust. J. mar. Freshwat. Res. 16: 33-128
Chullasom, S., Mako, H., Oka, M,, Matsushita, Y. (1977). Studies on the fishery biology of the round herring in the western Sea of Kyushu. Seikai Reg. Fish. Res. Lab. 50: 37-7 1
Ciechomslu, J. Dz. de, Capezzani, D. A. (1973). Studies on the evaluation of the spawning stocks of the Argentinean anchovy, Engraulis anchoita, on the b a s s of egg surveys. Rapp. P.-v. Reun. Cons. int. Explor. Mer 164: 293-301
Colman, J. A. (1978). Tagging experiments on the sand floun- der, Rhornbosolea plebeia (Richardson), in Canterbury, New Zealand, 1964 to 1966. Fish. Res. Dir. N.Z. Ministry Agric. Fish., Fish. Res. Bull. No. 18
Conand, F. (1977). Oeufs et larves de la sardinelle ronde (Sardinella aurita) au Senegal; distribution, croissance, mortalite, variations d'abondance de 1971 a 1976. Cah. ORSTOM (Ser Oceanogr.) 15: 201-214
Conand, F., Fagetti. E. (1971). Description et distribution saisonniere des larves de sardinelles des cBtes du Senegal et de la Gambie en 1968 et 1969. Cah. ORSTOM (Ser. Oceanogr.) 9: 293-318
Crossland, J. (1980). The number of snapper, Chrysophrys auratus (Forster), in the Hauraki Gulf, New Zealand, based on egg surveys in 1974-75 and 1975-76. N.Z. Fish. Res. Bull. No. 22
Cushing, D. H., Bridger, J . P. (1966). The stock of herring in the North Sea, and changes due to fishing. Fish. Invest., London, Series 11, 25: 1-123
Dahlberg, M. D. (1979). A review of survival rates of fish eggs and larvae in relation to impact assessments. Mar. Fish. Rev. U.S. 41: 1-12
Das, N. (1968). Spawning, distribution, sunival and growth of larval herring (Clupea harengus L.) in relation to hydro- graphic conditions in the Bay of Fundy. Fish. Res. Bd Can. Tech. Rep. No. 88: 1-129
Dickie, L. M. (1964). Estimation of mortality rates of Gulf of St. Lawrence cod from results of a tagging experiment. ICNAF Special Publ. No. 4: 71-80
Dickie, L. M,, McCracken, E. D. (1955). Isopleth diagrams to predict equilibrium yields of a small flounder fishery. J. Fish. Res. Bd Can. 12: 187-209
Dragesund, 0. (1970). Distribution, abundance and mortality of young and adolescent Norwegian spring spawning her- ring (Clupea harengus Linne) in relation to subsequent year-class strength. Fisk. Dir. Skr., Ser Havunders. 15: 451-556
Dragesund, O., Nakken, 0 . (1971a). Relationship of parent stock size and year class strength in Norwegian spring spawning herring. Rapp. P.-v. Reun. Cons. int. Explor. Mer 164: 15-29
Dragesund, O., Nakken, 0. (1971b). Mortality of herring du- ring the early larval stage in 1967. Rapp. P,-v Reun. Cons. int. Explor. lMer 164: 142-146
Durbin, A. G., Durbin, E. G. (1981) Standing stock and estimated production rates of phytoplankton and zoo- plankton in Narragansett Bay, Rhode Island. Estuaries 4: 24-4 1
Edwards, R. R. C. (1980). Aspects of the population dynamics and ecology of the white spotted stingaree, Urolophus paucirnacdatus Dixon, in Port Phillip Bay, Victoria. Aust. J. mar. Freshwat. Res. 31: 459-467
Everson, I. (1970). The population dynamics and energy budget of Notothenia neglecta Nybelin at Signy Island, South Orkney Islands. Bull. Brit. Antarct. SW. 23: 25-50
Fanis, D. A. (1961). Abundance and distribution of eggs and larvae and survival of larvae of jack mackerel (Trachurus symmetricus). Fish. Bull. U.S. 61: 247-279
Finkelstein, S. L. (1971). Migration, rate of exploitation and mortality of scup from the inshore waters of eastern Long Island Sound. N.Y. Fish Game J. 18: 97-111
Gambell, R. (1974). Sperm whales off Durban. In: Schevill, W. E. (ed.) The whale problem: a status report. Harvard University Press, Cambridge, p. 87-96
Grant, C. J., Sandland, R. L., Olsen, A. M. (1979). Estimation of growth, mortality and yield per recruit of the Australian school shark, Galeorhinus australis (MacLeay), from tag recoveries. Aust. J. mar. Freshwat. Res. 30: 625-638
Gunderson, D. R. (1977). Population biology of Pacific Ocean perch, Sebastes alutus, stocks in the Washington-Queen Charlotte Sound region, and their response to fishing. Fish. Bull. U.S. 75: 369-403
Harding, D., Talbot, J. W. (1973). Recent studies on the eggs and larvae of the plaice (Pleuronectes platessa L.) in the southern Blght. Rapp. P.-v. Reun. Cons. mt. Explor. Mer 164: 261-269
Harding, D., Nichols, J. H., Tungate, D. S. (1978). The spawn- ing of the plaice (Pleuronectes platessa L.) in the southern Bight. Rapp. P.-v. Reun. Cons. int. Explor. Mer 172: 102-113
Heinle, P. R. (1966). Producbon of a calanoid copepod, Acartia tonsa, in the Patuxent Fbver estuary. Chesapeake Sci. 7: 59-74
Heinle, P. R.. Flemer. D. A. (1975). Carbon requirements of a population of the estuarine copepod, Eurytemora affinus. Mar. Biol. 31: 235-247
Henderson, P. A., Whitehorse, J. W., Cartwright, G. H. (1984). The growth and mortality of larval herring, Clupea harengus harengus L., in the kver Blackwater estuary 1978-1980. J. Fish Biol. 24: 613-622
Hennemuth, R. C. (1959). Additional information on the length-welght relationship of skipjack tuna from the east- e m tropical Pacific Ocean. Bull. Inter-Am. Trop. Tuna Comm. 4: 25-37
Hennemuth, R. C. (1961). Year-class abundance, mortality and yield-per-recruit of yellowfin tuna in the eastern Pacific ocean, 1954-1959. Bull. Inter-Am. Trop. Tuna Comm. 6: 1-51
Hewitt. R. D. (1981). The value of pattern in the distribution of young fish. Rapp. P,-v. Reun. Cons, int. Explor. Mer 178: 229-236
Hewitt, R. D., Methot, R. D. (1982). Distributions and mortality of northern anchovy larvae in 1978 and 1979. California Coop. Fish. Invest Rep 23: 226245
Hewitt, R. D., Theilacker, G. H., Lo, N. C. H. (1985). Causes of mortality in young jack mackerel. Mar. Ecol. Prog. Ser. 26: 1-10
Hirota, J. (1974). Quantitative natural history of Pleurobran- chia bachei in La Jolla Bight. Fish. Bull. U.S. 72: 295-335
Hiyashi, S. (1966). A note on the biology and fishery of the

240 Mar Ecol. Prog. Ser.
Japanese anchovy Engraulis japonica. California Coop. Fish. Invest. Rep. 11: 44-57
Holland, G. A (1969). Age, growth, and mortality of races of English sole (Parophrys vetulus) in Puget Sound, Washington. Pacif. Mar. Fish. Comm. Bull. 7: 35-50
Hongskul, V. (1974). Population dynamics of Platu, Ras- trelljger neglectus (van Kampen), in the Gulf of Thailand. Proc. Indo-Pacif. Fish. Council 15: 297-350
Houde, E. D. (1977a). Abundance and potential yield of the round herring. Etrumeus teres, and aspects of its early life history in the eastern Gulf of Mexico. Fish. Bull. U.S. 75: 61-90
Houde, E. D. (1977b). Abundance and potential yield of the Atlantic thread herring, Opisthonema oglinum, and aspects of its early life history in the eastern Gulf of Mexico. Fish. Bull. U.S. 75: 493-512
Houde, E. D. (1977~) . Abundance and potential yield of the scaled sardine, Harengula jaguana, and aspects of its early life history in the eastern Gulf of Mexico. Fish. Bull. U.S. 75: 613-628
Houde, E. D., Lovdal, J. D. A. (1985). Patterns of vanability in ichthyoplankton occurrence and abundance in Biscayne Bay, Flonda. Estuar. coast. Shelf Sci. 20: 79-103
Howe, A. B., Coates, P. G. (1975). Winter flounder rnove- ments, growth, and mortality off Massachusetts. Trans. Am. Fish. Soc. 104: 13-29
Hughes, S. E. (1974). Stock composition, growth, mortality, and availability of Pacific saury, Colabis saira, of the northeastern Pacific Ocean. Fish. Bull. U.S. 72: 121-131
Hurley, G. V.. Mohn, R. K. (1978). Considerations on the management of the international squid (Illex) fishery in ICNAF Subarea 4. In: Balch, N., Amaratunga, T., O'Dor, R. K. (ed.) Proceedings of the workshop on ILlex illecebrosus. Tech. Rep. Fish. Mar. Serv. Canada No. 833, p. 7.1-7.14
Iizuka, A. (1966). Studies on the early Life history of herring (Clupea pallasi C. et V.) in Akkeshi Bay and Lake Akkeshi. Hokkaldn Rill1 Hnl tkaid~ k g . Fi5.h.. Re.. Lsh. 31: 18-63
Iles, T D., Sinclalr, M. (1982). Atlantic herring stock discrete- ness and abundance. Science (Wash., D.C.) 215: 627-633
Isakov, V I. (1974). The estimation of natural mortality and optimum fishing intensity of mackerel from the New Eng- land area. Int. Comm. Northw. Atlant. Fish., Res. Doc., 74/ 108, Ser. No. 3346 (mimeo)
Iverson, E. S., Moffett, A. W. (1962). Estimation of abundance and mortality of a spotted seatrout population. Trans. Am. Fish. Soc. 91: 395-398
Jensen, A. J. C. (1959). Danish investigations on the stocks of cod, plaice, flounder, and dab in the central Baltic and the fishery for these species in the western Baltic. Rapp. P.-v. Reun. Cons. int. Explor. Mer 147: 14-23
Johnson, P. 0 . (1970). The Wash sprat fishery. Fish. Invest., London, Series 11, 26: 1-88
Jones, B. W. (1966). The cod and the cod fishery at Faroe. Fish. Invest., London, Series 11, 24: 1-32
Jones, R. (1973). Density-dependent regulation of the num- bers of cod and haddock. Rapp. P.-v. Reun. Cons. int. Explor. Mer 164: 119-127
Joseph, J.. Calkins, T. P. (1969). Population dynamics of the skipjack tuna (Katsuwonas pelamis) of the eastern Pacific ocean. Bull. Inter-Am. Trop. Tuna Comm. 13: 7-119
Kendall, A. W., Jr., Gordon, D. (1981). Growth rate of Atlantic mackerel (Scomber scombrus) larvae in the middle Atlan- tic Bight. Rapp. P.-v. Reun. Cons. int. Explor. Mer 178: 337-341
Ketchen, K. S. (1947). The age, growth and mortality of the lemon sole (Parophrys vetulus Girard) on the British Co-
lumbia fishing grounds. M. A. thesis, University of British Columbia, Vancouver
Ketchen, K. S. (1964). Preliminary results of studies on growth and mortality of Pacific cod (Gadus macrocephalus) in Hecate Strait, British Columbia. J. Fish. Res. Bd Can. 21: 1051-1067
Ketchen, K. S., Forrester, C. R. (1966). Population dynamics of the petrale sole, Eopsetta jordani, in waters off western Canada. Bull. Fish. Res. Bd Can. No. 153
Kohler, A. C., Fitzgerald, D. N. Halliday, R. G., Scott, J. S., Tyler, A. V (1970). Length-weight relationships of marine fishes of the Canadian Atlantic region. Fish. Res. Bd Can. Tech. Rep. No. 164
Koslow, J. A., Brault, S., Dugas, J., Page, F. (1985). Anatomy of an apparent year-class failure: the early life history of the 1983 Browns Bank haddock Melanogrammus aeglefinus. Trans. Am. Fish. Soc. 114: 47-89
Kuipers, B. P. (1977). On the ecology of juvenile plaice on a tidal flat in the Wadden Sea. Neth. J. Sea Res. 11: 5&91
Kume, S. (1977). Recent status of bigeye tuna in the Atlantic Ocean. Int. Comm. Conserv. Atlant. Tuna Coll. Vol. Sci. Pap., Vol. VI: 162-167
Lambert, T. C., Ware, D. M. (1984). Reproductive strategies of demersal and pelagic spawning fish Can. J . Fish. Aquat. Sci. 41: 1565-1569
Lasker, R. (1985). What limits clupeoid production? Can. J. Fish. Aquat. Sci. 42 (Suppl. 1): 31-38
Laurence, G. C. (1979). Larval length-weight relations for seven species of northwest Atlantic fishes reared in the laboratory. Fish. Bull. U.S. 76: 890-895
Lebeau, A., Cueff, J. C. (1975). Biologie et peche du Capitaine, Lethrinus enigmatus (Smith 1959), du Banc de Malha (Ocean Indien). Rev. Trav. Inst. P&ches Marit. 39: 415-442
Lenarz, W. H. (1973). Dependence of catch rates on size of fish larvae. Rapp. P,-v. Reun. Cons. int. Explor. Mer 164: 27&275
Lenarz, W. H. (1974). Length-weight relations for five eastern tropical Atlantic scombrids. Fish. Bull. U.S. 72: 848-851
Lndley, J . A. (1978). Population dynamics and production of euphausiids. I. Thysanoessa longicaudata in the North Atlantic Ocean. Mar. Biol. 46: 121-130
hndley, J. A. (1980). Population dynamics and production of euphausiids. 11. Thysanoessa inermis and 7. raschi in the North Sea and American coastal waters. Mar. Biol. 59: 225-233
Lindley, J. A., Williams, R. (1980). Plankton of the Fladen Ground during FLEX 76. 11. Population dynamics and production of Thysanoessa inermis (Crustacea: Euphausacea). Mar Biol. 57:79-86
Lindquist, A. (1978). A century of observations on sprat in the Skagerrak and the Kattegat. Rapp. R.-v. Reun. Cons. int. Explor. Mer 172: 187-196
Lloyd, M. (1967). 'Mean crowding'. J. Anim. Ecol. 36: 1-30 Lockwood, S. J . (1980). Density-dependent mortality in O-
group plaice (Pleuronectes platessa L.) populations. J. Cons. int. Explor. Mer 39: 1 4 g 1 5 3
Lockyer, C. (1976). Body weights of some species of large whales. J. Cons. int. Explor. Mer 36: 259-273
Lockyer, C. (1977a). Mortality estimates for mature southern sei whales. Rep. Int. Whaling Comm., Spec. Issue No. 1: 53-57
Lockyer, C. (1977b). Some estimates of growth in the sei whale, Balaenoptera borealis. Rep. Int. Whaling Comm., Spec. Issue No. 1: 58-62
Lough, R. G., Bolz, G. R. , Grosslein, M. D., Potter, D. C. (1981).

McGurk: Mortality of fish eggs and larvae 24 1
Abundance and survial of sea herring (Clupea harengus L.) larvae in relation to environmental factors, spawning stock size, and recruitment for the Georges Bank area, 1968-1977. Rapp. P.-v. Reun. Cons. int. Explor. Mer 178: 22&222
L u , F. E. (1969). Length-weight relationships of six New England flatfishes. Trans. Am. F~sh. Soc. 98: 617-621
Macer, C. T. (1967). The food web in Red Wharf Bay (North Wales) with particular reference to young plaice (Pleuronectes plafessa). Helgolander wiss. Meeresunters. 15: 56&573
Mako, H. (1961). Studies on the demersal fish resources in the East Chlna and Yellow Seas, based on the fishery statistics by the market categories in fish size. Bull. Seikai Reg. Fish. Res. Lab. 24: 1-113
Manooch, C. S. 111, Huntsman, G. R. (1977). Age, growth, and mortality of the red porgy, Pagruspagrus. Trans. Am. Fish. Soc. 106: 26-33
Matthews, C. P. (1975). Some observations on the ecology and the population dynamics of Merluccius angushmanus in the south Gulf of California. J. Fish Biol. 7: 83-94
May, R. C. (1974). Larval mortality in marine fishes and the critical period concept. In: Blaxter, J . H. S. (ed.) The early life history of fish. Springer-Verlag, New York, p. 3-20
McGurk, M. D. (1984). Effects of delayed feeding and temper- ature on the age of irreversible starvation and on the rates of growth and mortality of Paclfic herrlng larvae. Mar. Biol. 84: 13-26
McGurk, M. D. (1986). The role of starvation in the population of larval Pacific herring, Clupea harengus pallasi. Ph.D. thesis, University of British Columbia, Vancouver
Menon, M. D. (1950). Bionomics of the poor-cod (Gadus rninutus L.) in the Plymouth area. J. mar. biol. Ass. U.K. 29: 185-239
Meredith, W. H., Lotrich, V. A. (1976). Production dynamics of a tidal creek population of Fundulus heteroclitus (Linnaeus). Estuar. coast. mar. Sci. 8: 99-118
Minet, J. P. (1978). Dynamics and yield assessment of the northeastern Gulf of St. Lawrence cod stock. Sel. Pap. ICNAF 3: 1-16
Misu, H. (1964). Fisheries biology of the ribbon fish (Tnchurus Jeptus Linne) in the East China and the Yellow Seas. Bull. Seikai Reg. Flsh. Res. Lab. 32: 1-58
Mitani, F., Shojima. E. (1966). Studies on the resources of jack mackerel. Trachurus japonicus (Temminck et Schlegel). in the East China Sea. 111. Natural and fishlng mortality coefficients. Bull. Jap. Soc. Sci. Fish. 32: 57-63
Munro, J. L. (1976). Aspects of the biology and ecology of Caribbean reef fishes: Mullidae (goat-fishes). J. Fish Biol. 9: 79-97
Nakai. Z., Hattori, S. (1962). Quantitative distribution of eggs and larvae of the Japanese sardine by year 1949 through 1951. Bull. Tokai Reg. Fish. Res. Lab. 9: 23-60
Nelson, M. O., Larkins, H. A. (1970). Distribution and biology of Pacific hake: a synopsis. U.S. Fish Wildl. Serv. Circ. 332: 23-33
Newbury, T. K., Bartholemew, E. F. (1976). Secondary produc- tion of microcopepods in the southern eutropic basin of Kaneohe Bay, Oahu, Hawaiian Islands. Pacif. Sci. 30: 373-384
Newman, G. G. (1970). Stock assessment of the pilchard, Sardinops ocellata, at Walvis Bay, southwest Africa. Invest. Rep. Div. Sea Fish. S. Afr. 85: 1-13
O'Connell, C. P. (1980). Percentage of starving northern anchovy. Engraulis mordax, in the sea as estimated by histological methods. Fish. Bull. U S. 78: 475-489
Paciokowski, A., hwoch, M,. Grzebielec, R., Borokowski, W..
Ucinski, S. (1973). A preliminary assessment of mackerel stock of ICNAF Subarea5 and Statistical Area6, 1968-1972. Int. Comm. Northw Atlant. Fish., Res. Doc., 73/98, Ser. No. 3058 (mimeo)
Paloheimo, J. E., Kohler, E. C. (1968). Analysis of the southern Gulf of St. Lawrence cod population. J . Fish. Res. Bd Can. 25: 555-578
Pauhk, G. J . (1963). Estimates of mortality rates from tag recoveries. Biometrics 19: 28-57
Pauly, D. (1980). The use of a pseudo catch-curve for the estimation of mortality rates in Leiognathus splendens (Pisces: Leiognathidae) in Indonesian waters. Meeresfor- schung Rep. Mar. Res. 28: 56-60
Pauly, D., Martosuboro, P. (1980). The populabon dynamics ol Nernipterus marginatus (Cuvier and Val) off western Kalimantan, South China Sea. J. Fish Biol. 17. 263-274
Pearcy, W G. (1962a). Ecology of an estuarine population of winter flounder, Pseudopleuronectes amencanus (Wal- baum). 11. Distribution and dynamics of larvae. Bull. Bing- ham Oceanogr. Coll. 18: 16-37
Pearcy, W. G. (196213). Ecology of an estuarine population of winter flounder. Pseudopleuronectes americanus (Wal- baum). 111. Distribution, abundance, growth, and produc- tion of juveniles, survival of larvae and juveniles. Bull. Bingham Oceanogr. Coll. 18: 39-64
Peterson, I., Wroblewski, J . S. (1984). Mortality rate of fishes in the pelagic ecosystem. Can. J. Fish. Aquat. Sci. 41: 1117-1120
Pielou, E. C. (1977). Mathematical ecology. John Wiley and Sons, New York
Pinhorn, A. T. (1975). Estimates of natural mortality for the cod stock complex in ICNAF Divisions 25, 3K, and 3L. ICNAF Res. Bull. No. 11: 31-36
Pinkas, L. (1966). A management study of the California barracuda, Sphyraena argentea Girard. Calif. Dept. Fish Game, Fish. Bull. No. 134
Pitt, T K. (1973). Assessment of Arnencan plaice stocks on the Grand Bank, ICNAF Divisions 3L and 3N. ICNAF Res. Bull. 10: 63-77
Qaslm, S. 2. (1957). The biology of Blennius pholis L. (Tele- ostei). Proc. 2001. Soc. Lond. 128: 161-208
Raitt. D. F. S. (1968). The population dynamics of the Norway pout in the North Sea. Mar. Ser Scot. 1968 (5)
Reay. P. J. (1973). Some aspects of the biology of the sandeel, Arnrnodytes tobianus L., in Langstone Harbour, Hamp- shire. J . mar. biol. Ass. U.K. 53: 325-346
Rao, V. S. (1966). Age and growth of 'Ghol', Pseudosciaena diacanthus (Lacepede), in Bombay and Saurashtra waters. Indian J . Fish. 13: 251-291
Rao, V S. (1968). Estimates of mortahty and yield per recruit- ment of 'Ghol', Pseudosciaena diacanthus (Lacepede). Indian J. Fish. 15: 88-98
Rice, D. W., Wolman, A. A. (1971). The life history and ecology of the grey whale (Eschrichtius robustus). Am. Soc. Mammal., Spec. Publ. No. 3
Ricker, W. E. (1973). Linear regressions in fishery research. J . Flsh. Res. Bd Can. 30: 409-434
Ricker, W. E. (1975). Computation and interpretation of the biological statistics of fish populations. Bull. Fish. Res. Bd Can. No. 191
Rikhter, V. A. (1974). A study of the dynamics of red hake (Urophysis chuss) catches from the Northwest Atlantic by the method of simulation. J. Ichthyology 14: 484-491
Riley. J. D. (1974). The distribution and mortality of sole eggs [Solea solea (L.)] in inshore areas. In: Blaxter, J. H. S. (ed.) The early life history of fish. Springer-Verlag, Berlin, p. 39-52
242 Mar. Ecol. Prog. Ser. 34: 227-242, 1986
Russell, F. S. (1976). The eggs and planktonic stages of British marine fishes. Academic Press, New York
Ryland, J. S. (1966). Observations on the development of larvae of the plaice, Pleuronectesplatessa L., In aquaria. J . Cons. int. Explor. Mer 30: 177-195
Saville, A. (1956). Eggs and larvae of haddock (Gadusmorhua L.) at Faroe. Mar. Ser Scot. 1954 (4)
Schaaf, W. E., Huntsman, G. R. (1972). Effect of fishing on the Atlantic menhaden stock: 1955-1969. Trans. Am. Fish. Soc. 101: 29&297
Schmidt-Nielsen, K. (1984). Scaling: why is animal size so important? Cambridge University Press. New York
Sette, 0 . E. (1943). Biology of the Atlantic mackerel (Scomber scombrus) of North America. Part l : Early life history, including the growth, drift, and mortality of the egg and larval populations. Fish. Bull. U.S. 50: 14S237
Shelbourne, J. E. (1957). The feeding and condition of plaice larvae in good and bad plankton patches. J. mar. biol. Ass. U.K. 36: 53%552
Shindo, S. (1960). Studies on the yellow sea bream in the East China Sea. Bull. Seikai Reg. Fish. Res. Lab. No. 20
SiUiman, R. P. (1966). Estimates of yield for Pacific skipjack and bigeye tuna. In: Manar, 7. E. (ed.) Proceedings of the Governor's conference on central Pacific fish resources. State of Hawaii, U.S.A., p. 231-249
Smith, P. E. (1973). The mortality and dispersal of sardine eggs and larvae. Rapp. P.-v. Reun. Cons int Explor. Mer 164: 282-292
Stepien. W. P., Jr. (1976). Feedlng of laboratory-reared larvae of the sea bream Archosargus rhomboldalis (Sparidae). Mar. Biol. 38: 1-16
Stevenson, J . C. (1962). Distribution and survival of herring larvae (Clupea paLlasi Valciennes) in Bntlsh Columbia waters. J . Fish. Res. Bd Can 19. 735-810
Suda, A., Kume, S. (1967). Survival and recruitment of bigeye tuna in the Pacific Ocean, estimated by the data of tuna longline catch. Rep. Nankei RPG. Fiqh R P < 1 a h 25 : 91-103
Sudjastani. T. (1974). The species of Rastrehger in the Java Sea, their taxonomy, morphometry and population dynamics. M.Sc. thesis, University of British Columbia, Vancouver
Talbot, J . W. (1977). The dispersal of plaice eggs and larvae in the Southern Bight of the North Sea. J Cons. int. Explor. Mer 37: 221-248
Theilacker, G. T., Dorsey, K. (1980). Lanfal fish diversity, a summary of laboratory and field research. In: Workshop on the effect of environmental variation on the survival of larval pelagic fishes. Washington. D.C., FAO, Inter- governmental Oceanographic Commission Workshop Report No. 28, p. 1 0 5 1 4 2
Thomas, J. C. (1968). Management of the white seabass
(Cynoscion nobilis) in California waters. CaLif. Dept. Fish Game Bull. No. 142
Thompson, R., Munro, J. L. (1978). Aspects of the biology and ecology of Caribbean reef fishes: Serranidae (hinds and groupers). J. Fish. Biol. 12: 115-146
Ursin, E. (1967). A mathematical model of some aspects of fish growth, respiration, and mortality. J. Fish. Res. Bd Can. 24: 2355-2453
Vooren, C. M. (1977). Growth and mortality of tarakihi (Pis- ces: Cheilodactylidae) in lightly fished populations. N.Z. J1 mar. Freshwat. Res. 11: 1-22
Ware, D. M. (1975). Relation between egg size, growth, and natural mortality of larval fish. J. Fish. Res. Bd Can. 32: 2503-2512
Ware, D. M., Lambert, T. C. (1985). Early life history of Atlantic mackerel (Scomber scombrus) in the southern Gulf of St. Lawrence. Can. J. Fish. Aquat. Sci. 42: 577-592
Watanabe, T. (1970). Morphology and ecology of early stages of life in Japanese common mackerel, Scomber japonicus Houttuyn, with special reference to fluctuations of popula- t i o n ~ . Bull. Tokai Reg. Fish. Res. Lab. 62: 1-283
Webb, B. F. (1972). Fish populabons of the Avon-Heathcote estuary. I . General ecology, distribution, and length-fre- quency. N.Z. J1 mar. Freshwat. Res. 6: 57&601
Westrheim, S. J., Snytko, V A. (1974). Length-weight rela- tions of some Pacific ocean perch (Sebastes alutus) in the North Pacific Ocean. J. Fish. Res. Bd Can 31: 363-366
White, M. L. , Chittenden, M. E. , Jr. (1977). Age determina- tion, reproduction and populahon dynamics of the Atlan- tic croaker, Micropogonias undulatus. Fish Bull. U S. 75: 109-123
Willian~s, G. C., Williams, D. C. (1973). Mortality rates of planktonic eggs of the cunner, Tautogolabrus adspersus (Walbaurn), in Long Island Sound. In. Pacheco, A. L. (ed.) Proceedings of a workshop on egg, larval and juvenile stages of fish in Atlantic coast estuaries. U.S. National Mari!?e Fisheries Sc::<cc, ?.I;d31e Aflaiitic riskledes Center Technical Publication No. 1 , p. 181-189
Young, P. H. (1963). The kelp bass (Paralabrax clathrus) and its fishery, 1947-1958. Calif. Dept. Fish Game, Fish. Bull. No. 172
Zukowski, C. (1972). Growth and mortality of the Atlantic argentine, Argentina silus Ascanius, on the Nova Scotia Banks. lCNAF Res. Bull. 9: 109-115
Zweifel, J. R., Lasker, R. (1976). Prehatch and posthatch growth of fishes - a general model. Fish. Bull. U.S. 74: 609-621
Zweifel, J. R., Smith, P. E. (1981). Estimates of abundance and mortality of larval anchovies (1951-75): application of a new method. Rapp. P.-v. Reun. Cons. int. Explor. Mer 178: 248-259
This article was presented by Professor K. Banse; it was accepted for printing on September 25, 1986