l - IIIIIBIIIUIW'BS' '^ 11111. 0 l
21
l l l l l l " IIIIIBIIIUIW'BS 1111 " 1 """ 0 10 A-814 l - ' "'^ . l l REPORT ON. AN l AIRBORNE MAGNETIC 1 AND VLF-EM SURVEY l BANNAGAN PROPERTY B HUTTON TOWNSHIP SUDBURY MINING DIVISION, ONTARIO l l for l IMPERIAL METALS CORPORATION l l by: T ERRAQUEST LTD. R ECEIVE Toronto, Canada ,,,o \ 1989 B January 16,1989 LANDS
Transcript of l - IIIIIBIIIUIW'BS' '^ 11111. 0 l

l l l l l
l" IIIIIBIIIUIW'BS 1111"1""" 010 A-814
l - '"'^ . ll REPORT ON. AN
l AIRBORNE MAGNETIC 1 AND VLF-EM SURVEY
l BANNAGAN PROPERTY B HUTTON TOWNSHIP
SUDBURY MINING DIVISION, ONTARIO
ll for
l IMPERIAL METALS CORPORATION
ll by: TERRAQUEST LTD. R ECEIVE
Toronto, Canada ,,,o \ 1989 B January 16,1989
LANDS

l l l l l l l l l l l l l l l l l l l
4tl15SWei36 2 . I 2228 HUTTON 010C
TABLE OF CONTENTS
1. INTRODUCTION..........
2. THEPROPERTY .........,
3. GEOLOGY
4. SURVEY SPECIFICATIONS
4.1 Instruments4.2 Lines and Data4.3 Tolerances4.4 Photomosaics
5. DATA PROCESSING .......
6. INTERPRETATION
6.1 General Approach6.2 Interpretation
7. SUMMARY
LIST OF FIGURES
Figure l ~ General Location MapFigure 2 ~ Survey Area MapFigure 3 ~ Sample Record
Figure 4 ~ Terraquest Classification of VLF-EM Conductor Axes
LIST OF MAPS IN JACKET
No. A-814-1 ~ Total Magnetic FieldNo. A-814-2- Vertical Magnetic Gradient
No. A-814-2b~ Green Shadowgraph of Magnetic Vertical DerivativeNo. A-814-3 ~ VLF-EM Survey
No. A-814-4 ~ Interpretation
Page
l
l
1
2
2
2
2
3
3
3
3
4
5
l l l l l l l l l l l l l l l l l l l
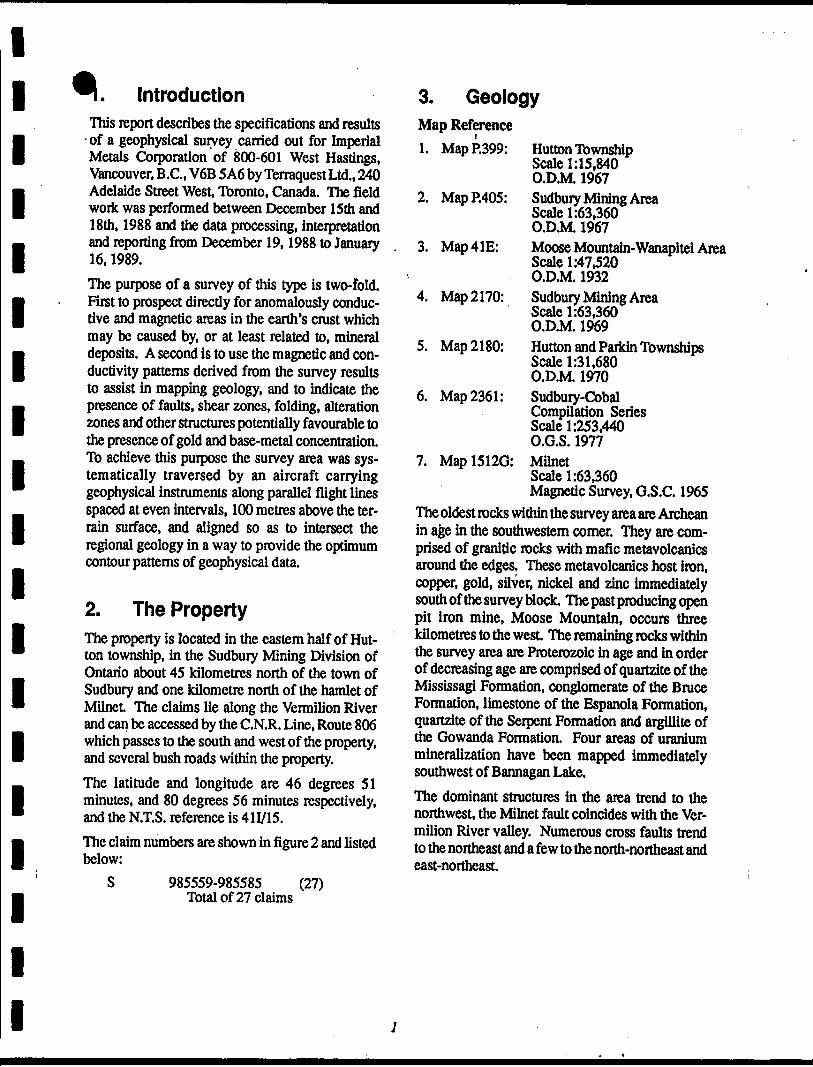
IntroductionThis report describes the specifications and results of a geophysical survey carried out for Imperial Metals Corporation of 800-601 West Hastings, Vancouver, B.C., V6B 5A6 by Terraquest Ltd., 240 Adelaide Street West, Toronto, Canada. The field work was performed between December 15th and 18th, 1988 and the data processing, interpretation and reporting from December 19,1988 to January 16,1989.The purpose of a survey of this type is two-fold. First to prospect directly for anomalously conduc tive and magnetic areas in the earth's crust which may be caused by, or at least related to, mineral deposits. A second is to use the magnetic and con ductivity patterns derived from the survey results to assist in mapping geology, and to indicate the presence of faults, shear zones, folding, alteration zones and other structures potentially favourable to the presence of gold and base-metal concentration. To achieve this purpose the survey area was sys tematically traversed by an aircraft carrying geophysical instruments along parallel flight lines spaced at even intervals, 100 metres above the ter rain surface, and aligned so as to intersect the regional geology in a way to provide the optimum contour patterns of geophysical data.
2. The PropertyThe property is located in the eastern half of Hut ton township, in the Sudbury Mining Division of Ontario about 45 kilometres north of the town of Sudbury and one kilometre north of the hamlet of Milnet The claims lie along the Vermilion River and can be accessed by the C.N.R. Line, Route 806 which passes to the south and west of the property, and several bush roads within the property.The latitude and longitude are 46 degrees 51 minutes, and 80 degrees 56 minutes respectively, and the N.T.S. reference is 411/15.The claim numbers are shown in figure 2 and listed below:
S 985559-985585 (27) Total of 27 claims
3. GeologyMap Reference1. MapP.399:
2. MapP.405:
3. Map41E:
4. Map 2170:
5. Map 2180:
6. Map 2361:
7. Mapl512G:
Hutton Township Scale 1:15,840 O.D.M. 1967Sudbury Mining Area Scale 1:63,360 O.D.M. 1967Moose Mountain-Wanapitei Area Scale 1:47420 O.D.M. 1932Sudbury Mining Area Scale 1:63,360 O.D.M. 1969Hutton and Parkin Townships Scale 1:31,680 O.D.M. 1970Sudbury-Cobal Compilation Series Scale 1:253,440 O.G.S. 1977MilnetScale 1:63,360Magnetic Survey, G.S.C. 1965
The oldest rocks within the survey area are Archean in age in the southwestern corner. They are com prised of granitic rocks with mafic metavolcanics around the edges. These metavolcanics host iron, copper, gold, silver, nickel and zinc immediately south of the survey block. The past producing open pit iron mine, Moose Mountain, occurs three kilometres to the west. The remaining rocks within the survey area are Proterozoic in age and in order of decreasing age are comprised of quartzite of the Mississagi Formation, conglomerate of the Bruce Formation, limestone of the Espanola Formation, quartzite of the Serpent Formation and argillite of the Gowanda Formation. Four areas of uranium mineralization have been mapped immediately southwest of Bannagan Lake.The dominant structures in the area trend to the northwest, the Milnet fault coincides with the Ver milion River valley. Numerous cross faults trend to the northeast and a few to the north-northeast and east-northeast.

Suite 9O
5, 121 Richm
ond Street W
est, Toronto, C
anada, M5H
2K1, T
elephone (416) 869-0010

240
Ade
laid
e St
reet
Wes
t, T
oron
to,
Can
ada
M5H
1W
7, T
elep
hone
(41
6) 9
71-5
400.
fix
(41
6) 9
71-6
449

l l l l l l l l l l l l l l l l l l l
Survey Specifications
4.1 InstrumentsThe survey was carried out using a Cessna 182 aircraft, registration C-FAKK, which carries a magnetometer and a VLFelectromagnetic detector.The magnetometer is a proton precession type based on the Overhauser effect The Overhauser effect allows for polarization of a proton rich liquid of the sensor by adding a "free radical" to it and ir radiating it by RF magnetic field. Strong preces sion signals are generated with modest RF power. The sensor element is mounted in an extension of the right wing tip. It's specifications are as follows:
Model: GSM-9BAManufacturer: GEM Systems Inc
105 Scarsdale Road Don Mills, Ontario
Resolution: 0.5 gammaAccuracy: 0.5 gamma
Cycle time: 0.5 secondRange: 20,000-100,000 gammas in 23
overlapping stepsGradient tolerance: Up to 5,000 gammas/m
The VLF-EM unit uses three orthogonal detector coils to measure (a) the total field strength of the time-varying EM field and (b) the phase between the vertical coil and both the "along line" coil (LINE) and the "cross-line" coil (ORTHO). The LINE coil is tuned to a transmitter station (Channel 1) that is ideally positioned at right angles to the flight lines, while the ORTHO coil transmitter (Channer 2) should be in line with the flight lines. It's specifications are:
Model: TOTEM 2AManufacturer: Herz Industries, Toronto,
CanadaAccuracy: Y9o
Reading interval: 0.5 second
The VLF sensor is mounted in the left wing tip ex tension.Other instruments are:* King KRA-10A radar altimeter* PDAS-1100 data acquisition system with two
3.5" floppy disk drives manufactured by Picodas Group Inc., Richmond Hill, Ontario
* Geocam video camera and recorder for flight path recovery, manufactured by Geotech Ltd., Markham, Ontario.
* PBAS-9000 portable field base station with a 3.5" floppy disk drive and an analog print out manufactured by Picodas Group Inc., Richmond Hill, Ontario, coupled with a GSM-8 proton magnetometer manufactured by Gem Systems Inc., Toronto, Ontario.
4.2 Lines and DataLine spacing: 100 metres
Line direction: 050 degreesTerrain clearance: 100 m
Average groundspeed: 156 km/hr
Data point interval:Magnetic: 27 metres VLF-EM: 27 metres
Tie Line interval: 2km Channel l (LINE): NAA Cutler, 24,0 kHz
Channel 2 (ORTHO): NSS Annapolis, 21.4 kHzLine km over total
survey area including overrun: 126 line km
Line km over claim groupsr
Magnetic surveytotals: 54 line km
VLF~EM surveytotals: 54 line km
4.3 TolerancesLine spacing: Any gaps wider than twice the line spacing and longer than 10 times the line spacing were filled in by a new line.Terrain clearance: Portions of line which were flown above 125 metres for more than one km were reflown if safety considerations were acceptable.Diurnal magnetic variation: Less than twenty gammas deviation from a smooth background over a period of two minutes or less as seen on the base station analogue record.Manoeuvre noise: Approximately +J- 5 gammas.

l l i i i i i i i i i i i i i i i i i
Z* O QC CO *-t O (S'i ut ijJ in n.j,mJjj j 11 li j j J t^j^
lAItimefer
::VUF. .station. 1
- OJ ^"--x*-, r, . . . .2^ J . . . . . . . . . . . . . . . . . . -M . . . . . . . . . rl . . . . . . . . . , . . .-| . . . . . . . l . . . . . . . . .
' nri j r rm TT'TT'P TT n T n r-pi m-rirrp ri r-in-n-pi-m-rvrr'y'^iTTr'i'n-rj-ri ITTI rt i-j-rr-rTrTnt^Ti-i iJ"nn|T TT in'i l (~r i-r TTT-TI T-|-rr-iT iTTri|T-nrrrTiT'
f '" l" b J It- CtJ 'X O TD 1.4 J CO J-- C"Fiducials
FIGURE 3. Sample of analogue data
l
*9
TERRAQUESr LTD.

l l l l l l l l l l l l l l l l l l l
1.4 PhotomosaicsFor navigating the aircraft and recovering the flight path, semi-controlled mosaics of aerial photographs were made from existing air photos. Each photograph forming the mosaic was adjusted to conform to the NTS map system before the mosaic was assembled.
5. Data ProcessingRight path recovery was carried out in the field using a video tape viewer to observe the flight path as recorded by the Geocam video camera system. The flight path recovery was completed daily to enable reflights to be selected where needed for the following day.The magnetic data was levelled in the standard manner by tying survey lines to the tie lines. The IGRF has not been removed. The total field was contoured by computer using a program provided by Dataplotting Services Inc. To do this the final levelled data set is gridded at a grid cell spacing of 1/1 Oth of an inch at map scale.The vertical magnetic gradient is computed from the total field data using a method of transforming the data set into the frequency domain, applying a transfer function to calculate the gradient, and then transforming back into the spatial domain. The method is described by a number of authors includ ing Grant, 1972 and Spector, 1968. The computer program for this purpose is provided by Paterson, Grant and Watson Ltd. of Toronto.The VLF data was treated automatically so as to normalize the non conductive background areas to 100 (total field strength) and zero (quadrature). The algorithms to do this were developed by Ter- raquest and will be provided to anyone interested by application to the company.All of these dataprocessing calculations and map contouring were carried out by Dataplotting Ser vices Inc. of Toronto.Grant, F.S. and Spector A., 1970: Statistical
Models for Interpreting Aeromagnetic Data; Geophysics, Vol 35
Grant, F.S., 1972: Review of Data Processing and Interpretation Methods in Gravity and Mag netics; Geophysics Vol 37-4
Spector, A., 1968: Spectral Analysis of Aeromag
netic maps; unpublished thesis; University of Toronto.
6. Interpretation
6.1 General ApproachTo satisfy the purpose of the survey as stated in the introduction, the interpretation procedure was car ried out on both the magnetic and VLF data. On a local scale the magnetic gradient contour patterns were used to outline geological units which have different magnetic intensity and patterns or "signa tures". Where possible these are related to existing geology to provide a geological identity to the units. On a regional scale the total field contour patterns were used in the same way.Faults and shear zones are interpreted mainly from lateral displacements of otherwise linear magnetic anomalies but also from long narrow "lows". The direction of regional faulting in the general area is taken into account when selecting faults. Folding is usually seen as curved regional patterns. Altera tion zones can show up as anomalously quiet areas, often adjacent to strong, circular anomalies that represent intrusives. Magnetic anomalies that are caused by iron deposits of ore quality are usually obvious owing to their high amplitude, often in tens of thousands of gammas.VLF anomalies are categorized according to whether the phase response is normal, reverse, or no phase at all. The significance of the differing phase responses is not completely understood al though in general reverse phase indicates either overburden as the source or a conductor with con siderable depth extent, or both. Normal phase response is theoretically caused by surface conduc tors with limited depth extent. In some cases, a change in the orientation of the conductor appears to affect the sense of the phase response.Areas showing a smooth VLF-EM response some what above background (ie. 110 or so) are likely caused by overburden which is thick enough and conductive enough to saturate at these frequencies. In this case no response from bedrock is seen.The VLF-EM conductor axes have been identified and evaluated according to the Terraquest clas sification system (Figure 4). This system correlates the nature and orientation of the conductor axes with stratigraphic, structural and topographic fea-

l l l l l l l l l l l l l l l l l l l
to obtain an association from which one or more origins may be selected. Alternate associa tions are indicated in parentheses.
t
6.2 InterpretationThe magnetic and VLF-EM data are shown in con toured format on maps at a scale of 1:10,000 in the back pocket. An interpretation map is also provided. The following notes are intended to sup plement these maps.The total magnetic field has a relief of approximate ly 1,250 gammas and is dominated by strong responses beyond the survey area to the northeast except for a narrow anomaly that extends along the river valley from the southeast. The vertical gradient format identifies several subtle anomalies that trend variably to the northwestThe source of the strong anomaly to the northeast occurs along the edge of the survey area and ap pears to be related to mafic intrusives at depth. The nature and orientation of this anomaly can be ob served on the government magnetic map (Map 1512G).The narrow anomaly that extends northwestwards from Fraser Lake has a relief of approximately 250 gammas. It appears to be an extension of the iron formation located along strike to the south of the survey area. The interpreted width is probably ex aggerated due to the overwhelming effect com monly associated with strong susceptibilities. The two short anomalies of similar magnitude which occur along strike to the northwest may also be re lated to iron formation, possibly at depth.Most of the smaller, broken up anomalies to the southwest correlate with the amphibolide, mafic in trusive rocks (Unit 4). The subtle anomaly on the east end of Bannagan Lake trends to the north- northeast and is interpreted to originate from similar intrusives.The mafic metavolcanics (Unit 1) correlate with moderate strength responses. These are best iden tified where they occur in contrast with the mag netically quiet Proterozoic sediments. The easternmost edge of the metavolcanic unit is characterized by slightly stronger responses (Unit 1m) which may be related to either iron formation, pyrrhotite or more mafic compositions.The remaining lithologies correlate with weak magnetic responses and cannot be readily dis-
criminated on the total magnetic field map. This is primarily due to the fact that the strong anomaly to the northeast overwhelms and dominates these sub tle responses. For example the Gowganda Forma tion (Unit 9) correlates with the strongest responses on the map area, but are not interpreted to be the source of die magnetism. Similarly, the Bruce For mation conglomerates (Unit 6) correlate with weak responses to the west of Vermilion River and moderate responses north of Bannagan Lake, the difference being a function of the regional gradient across the property.The subtle anomalies detected on the vertical gradient map correlate with parts of the Bruce For mation (Unit 6m) and parts of the Serpent Forma tion (Unit 8m). These may be related to minor concentrations of magnetic minerals such as mag netite or pyrrhotite within the Proterozoic sedi ments. Note that many of these trends are consistent with the bedding of the mapped lithologies. Alternatively, some of these responses may be related to the underlying mafic metavol canic rocks (Unit 1).Further processing of the vertical magnetic gradient using the shadowgraph technique is generally con sistent with the overall interpretatioa In several in stances the shadowgraph has identified very subtle expressions that were not present on the vertical derivative plots. These are parallel to and therefore consistent with the overall lithological trends. Note that the shadowgraph is based on a sun declination of 030 degrees and therefore creates a detection bias in favour of northwest trending bodies.The structural interpretation is highly subjective due to the fact that: a) many of the anomalies are short and truncated, b) there are numerous assumed faults as shown on the mapped geology, and c) many of the anomalies may be derived from sour ces at depth beneath the Proterozoic sediments. Supporting evidence has been taken from airphoto lineaments both within and beyond the survey area. This structural interpretation is not consistent with most of the assumed faults shown on the geologi cal map. The Milnet Fault is not readily identifi able by magnetic mapping as it is parallel to the magnetic units.Most of the magnetically interpreted faults trend to the east to east-southeast It is suspected that these offset the Milnet Fault in at least two places. Minor faults or shear zones trend to the north to north-

lSYMBOL
a , A
b, B
c , C
d , D f , F
ob, OB
cul CUL
NOTES
FIGURE 4
TERRAQUEST CLASSIFICATION OF VLF-EM CONDUCTOR AXES
CORRELATION
Coincident with magnetic stratigraphy
Parallel to magnetic stratigraphy
No correlation with magnetic stratigraphy
Coincident with magnetic dyke
Coincident with topographic lineament or parallel to fault system
Contours of total field response conform to topographic depression
Coincident with cultural sources
ASSOCIATION: Possible Origins
Bedrock magnetic horizons:'stratabound mineralogic origin or shear zone
Bedrock non-magnetic horizons: stratabound mineralogic origin or shear zone
Association not known: possible small scale stratabound mineralogic origin, fault or shear zone, overburden
Dyke or possible fault: mineralogic or electrolytic
Fault zone: mineralogic or electrolytic
Most likely overburden: clayey sediments, swampy mud
Electrical, pipe or-railway lines
1 - Upper case symbols denote a relatively strong total field strength2 - Underlined symbols denote a relatively strong quadrature response3 - Mineralogic origins include sulphides, graphite, and in fault zones, gouge4 - Electrolytic origins imply conductivity related to porosity or high moisture content
240 Adelaide Street West, Toronto, Canada M5H IW7, Telephone (416) 971-5400, Fax (416) 971-6449

l l l l l l l l l l l l l l l l l l l
jrtheast similar to those shown on the geological map.The VLF-EM survey has identified several strong conductor axes that trend to the east-southeast dis playing an obvious detection bias in favour of the transmitter azimuth (Cutler, 098 degrees). The contours of the total field strength of most of these conductive zones conform to topographic depres sions suggesting that the primary source is from conductive overburdeaThe narrow conductive zones that coincide with either topographic depressions or magnetically in terpreted faults are interpreted to possess structural origins, either faults or shear zones. This type of conductivity may be related to mineral origins such as sulphides, graphite or gouge along the structure, or b) an ionic effect created by water or porosity within the structure or along the upper weathered and leached edge.The strongest conductive zone appears to be related primarily to the railroad tracks along the south side of the river valley, however there may be minor
contributions from the Milnet Fault zone or the overburden within the valley.
7. SummaryAn airborne combined magnetic and VLF-EM sur vey has been done on the property at line intervals of 100 metres. The total field and vertical gradient magnetic data, VLF-EM data and interpretation maps are produced at a scale of 1:10,000.The magnetic data has been used to modify and up date the existing geology and has shown a number of new contacts and faults. Several VLF-EM con ductor axes have been identified and have been in terpreted to be derived from overburden and structural sources.
Geologist

Ministry o(Northern Developmentand Mines
Ontario
D\Report of Work
(Geophysical, Geological,
l DOCUMEN'
W8907-
Type of Surveyls
Expenditures)
Mining Act41II5SW0I36 Z . \S226 HUTTON
Claim Holder (t)"Airborne Magnetic and VLF Survey
Township or Area
Hutton Twp. - Sudbury M.D.Prospector'* Licence No.
T4978
900
Imperial Metals CorporationAddress
Suite 800, 601 West Hastings Street, Vancouver, B.C. CanadaCompany Date of Survey (from fi/ to)
L5y i IMmgy i Li. 13?Total Miles of line Cut
Name and Address of Author (of Geo-Technical report)
Credits Requested per Each Claim in Columns at right
Expenditures (excludes power stripping) Type of Work Performed
Performed on Claim(s)
Calculation of Expenditure Days Credits
Totel Expenditures
Special Provisions
For first survey:
Enter 40 days. (This includes line cutting)
For each additional survey: using the same grid:
Enter 20 days (for each)
Man Days
Complete reverse side and enter totalOhCe^* C
MAR
MINING LAN
Airborne Credits
Note: Special provisions credits do not apply to Airborne Surveys.
Geophysical
- Electromagnetic
- Magnetometer
- Radiometric
- Other
Geological
Geochemical
Geophysical
l m B*eca*omagnetic
- Magnetometer
l iVIOlpiometrlc
- Other
JS.SEHIONGeochemical
Electromagnetic
Magnetometer
Radiometric
Days per Claim
Days per Claim
Days per Claim
40
40
Total Day* Credits
InstructionsTotal Days Credits may be apportioned at the claim holder's choke. Enter number of days credits per claim selected In columns at right.
/lDate
February 3, 1989Holder
Certification Verifying ReporfofWorkA/ i \JISrrofWorkx
1 hereby certify that 1 have a personal and i
Agent (Slgneture)
Mining Claims Traversed (List in numerical sequence)Mining Claim
Prefix Number
985 582
985 583985 584
985 585
UDBUR"MINING OIV. ^
C C l V B P
B
n^z:~F*
Expend. Days Cr.
8080
80
80
P.M.m-h
Total number of mining claims covered by this report of work.
or witnessed same during and/or after lit completion and the annexed report If true.timate knowledge of the facts set forth in the Report of Work annexed hereto, having performed the work
and Postal Address of Person Certifying

Slllfa 01
Ministry ofNorthern Developmentand Mines
Ontario
Geophysical-Geological-Geochemlcal Technical Data Statement
File
TO BE ATTACHED AS AN APPENDIX TO TECHNICAL REPORTFACTS SHOWN HERE NEED NOT BE REPEATED IN REPORT
TECHNICAL REPORT MUST CONTAIN INTERPRETATION, CONCLUSIONS ETC.
Type of Survey(s) AtrSome Magnetic and VLF-EM Survey Township or Ar.a Hutton Twp. Sudbury M.D.______ Claim Holder(s^ Imperial Metals Corporation
Terraquest Ltd.SurveyAuthor of Report Charles Q. Barrie
1 Author 2 4Q Adelaide Street. W. Toronto Covering Dates of SnrJfoc 15 - 18. 1988———————
(linecutting to office) Total Miles of Line Cut________________________
SPECIAL PROVISIONSCREDITS REQUESTED
ENTER 40 days (includes line cutting) for first survey.ENTER 20 days for each additional survey using same grid.
Geophysical —Electromagnet
-Other
Ocnlogiral ,
DAYS per claim
AIRBORNE CREDITS (Special provision credit! do not apply to airborne turveyi)
-JH—Electromagnetic .JQ—— Radiometric ————(enter dayi per claim)
HATR- Feb 3. 1989 SIGNATURE:
Res. Geol.. . Qualifications.Previous Surveys
File No. Type Date Claim Holder
MINING CLAIMS TRAVERSED List numerically
S 985 559 S 985 580^.•••••••^••••••••••••••••••••••••••••••••••••••ti
'(pVefixjS 985 560
S 985 561S 985 562
S 985 563
S 985 564
S 985 565
S 985 566
S 985 567
S 985 568
S 985 569
S 985 570^
S 985 571
..?...?.?.?...?.?.?..
S 985 573
S 985 574
S 985 575
S 985 576
S 985 577
S 985 578,
S 985 579
(number)S 985 581S 985 582
S 985 583
S 985 584
S 985 585
TOTAL CLAIMS. 27

GEOPHYSICAL TECHNICAL DATA
GROUND SURVEYS - If more than one survey, specify data for each type of survey
Number of Stations—————————————————————————Number of Readings — Station interval ————^^——————^-^—..-————^——..—Line spacing^——^— Profile scale _____________________________—-————^———-
C
tL
z c
Contour interval.
Instrument —
o, Q
Accuracy — Scale constant.
Diurnal correction method.Base Station check-in interval (hours). Base Station location and value ——^
ELECTROMAGNETKO^il rnnfigiiratirm
Toil separation
Arriirary
Method: O Fixed transmitter D Shoot back D In lineFrcqiienry
(specify V.L.F. station)
O Parallel line
Parameters measured.
Instrument,Scale constant.
Corrections made.
Base station value and location,
Elevation accuracy.
Instrument .—————————————————————————————————;———-——————— Method D Time Domain D Frequency Domain
Parameters - On time __________________________ Frequency ————— -Off time——————————————————————————— Range ————————
— Delay time ———— Integration time.
Power.u.- ' E lectrode array.2 Electrode spacing .
Type of electrode

SELF POTENTIALInstrument_________________________________________ Range.Survey Method ——————————————————————————————————._______.
Corrections made.
RADIOMETRICInstrument ————Values measured.Energy windows (levels)——-————-.——^—^—————-—^———.—^——.-.—^—Height of instrument___________________________Background Count. Size of detector-^—^-———————..^^——-———.^^—....———..—.———.™.^——.—.Overburden ————^———^-—-—^—-———^—-^———.^—^——————.———-———
(type, depth - include outcrop map)
OTHERS (SEISMIC, DRILL WELL LOGGING ETC.) Type of survey-^^-^———————^——^———————Instrument ————^^^—-——————————^^^—Accuracy———————————.—^——-^^^^———.—Parameters measured.
Additional information (for understanding results).
AIRBORNE SURVEYSType of .nrwyfr) Atrfrorne Magnetic and W~EM SurveyInstrument(s) Magnetic - GEM Systems Inc. GSN - 9BA. ^VLf EM Hertz Ind. Totem 2A
(specify for each type of turvey)Magnetic - Q. 5 gamma________ VLF-EM ~ U———-——^—-
(specify for each type of survey)Aircraft ....H Cessna 182^^————————————^————————.^^^Sensor altitude——lOCLj]_____________________________________________ Navigation and flight path recovery method Semt controlled photo mosaics; Geocam viflpn
Aircraft altitude_________1QQ m_________________Line Sparing 100 m———— Miles flown over total area___^26___________________Over claims i

GEOCHEMICAL SURVEY - PROCEDURE RECORD
Numbers of claims from which samples taken.
Total Number of Samples. Type of Sample.
(Nature of Material) Average Sample Weight———————
Method of Collection————————
Soil Horizon Sampled. Horizon Development. Sample Depth———— Terrain————————
Drainage Development——————————— Estimated Range of Overburden Thickness.
ANALYTICAL METHODS Values expressed in: per cent
p. p. m. p. p. b.
D Dn
Cu, Pb,
Others—
Zn, Ni, Co, Ag, Mo, As,-(circle)
Field Analysis (.Extraction Method. Analytical Method- Reagents Used——
Field Laboratory AnalysisNo. —-^——————
SAMPLE PREPARATION{Includes drying, screening, emitting, aihing)
Mesh size of fraction used for analysis ——^—
Extraction Method. Analytical Method - Reagents Used ——,
Commercial Laboratory (. Name of Laboratory— Extraction Method—— Analytical Method.^— Reagents Used -^———
.tests)
.tests)
.tests)
GeneraL General.

KIT
CH
EN
ER
TO
WN
SHIP
t .
w .
_ _
_ _
_
\
—--
U—
-j—
- .-^
—
——
—
—i
—-
1 C*
l
—
__
__
S __
——
—
——
—
__
A
l _ _
_
,™
~"—
—
—
—'.
H .-
M
S N
MO
! N
IMdV
d
oj ai
"•a
o o-
3"
[B-
w
3 S
w' a.
•5
nT
ZQ^
W
en
W
—
C
Q)
B 5
CD 3
W (Q C
T CO c 3 CD
C/) tu Q)
T) •g 3'
to
W
CDT
Q
-
Q-
S
CD "
O
X.o
5 S
o o
3
—
CD
Q.
Q.- li
s" a
la w ™
(D ^
T3
OC
JO
CO "
DCD
D
I C
3 a o; (C
tn O 3
CO D 3
Q. ~*
C
\
Q
D D •a •D T S o "Uj
O.
B) 3 s- fD d ®
O f .
T 5' 6 3, S. —
1
o o
r— o" •D 3
T
•D 2. u
O T a
") c 0 S. 5 •4
1 5 D D D
3-
fj: i ^
C
j) - "H ir T
•D U 5' j?
O
(j t
n
r- CD
i* S
i. *
D 3 S.
-3 3
O X 5' I l
S 3 5 a D 5 3
" 1
p——
*
W o <-.
c
w c u n ID 3]
D'
3- 5T
O
d3 <
(J
O
* ^1
j Q
j *
^'
* -
^ 1
" S
,'
T
^^
•D ^g
' ^
^ S
z S2
1" -H
w (
Q O •n
, 50 O 1 D
CO
1
5
H
co3
D)
~^"
i f.
1CD
O
O
Q)
3
2.
f
9.
CD
(u^
: ,,
*
JO
33
TS
DO
O
OO
W
-g
" —
Q
O
^^
O
~
-Q)
S III. lls
lllS
s
' 1
•^S
~
ft*
(D
O
Q.
—
-"
~^
^J
^
— -C
D
~u
f?
rn
t*-,-
^to
—-o
eD
OT
3-
T r
^S
s-tu
acrtW
D.fljo
c/jx
o^
TJS
o
3-
to
S
cr'0,5
1 CT
r*
3
5
' !2-
q
fu
^
S
jT
c
^C
o5W
;C
'(g05Q
-";O
gs
^o
*3
j) ^S
Ssrm
3,
rr
3f
a.
u
Jsw
o S
*' -*
S 3
I *
-i
H I
'M
l III
1*
. 4-
- a
E
^ ^
. Q
o .
. .
. .
—
. .
. :
: :
: .
: :
s .
. .
. .
. .
. .
. .
. .
. .
.w
.
. .
. .
. .
. '
- .
-T-
, .
. .
. .
- .
. .
.
i i
i i
: i
l i'
! ':
': ':
l :.
': l
'. \
:.
: :
: :
: :
: :
: :
: S
: :
: :
: :
:
j j
t i
l \
\ ' .
' H ^
i |
j {J
g
i IP
3 S
gZ
*^
O
O
'^(S
J^
"o!
. -
c w
w
w
2j3
C
3-
C
j3;
g 2
5 3
ODS
y
CD
3
CD
CD 1CO
CT
,-A
O
S
o
IV
9 oo
J 31
-1 tn O •n O
O ~ ra * * w
-n
r-
s rt
iw
o R
OD
ON
C
(B IP
•n*
O(B
^ 3)
X
-1
" 5
0
a
5
5
v
2
o
5.n
.
W N
E"
5to
-
*
0)(B
*
"*
3 01
—
I
C rf
0* IB
TJ C
" 3
CD
Wo
m
S O z K
E C r m D
M I B H X C
|3 m
w w l E Z Z e Jj.
" 8 o
H X m w m Z
z z m 3)
(0 E Z Z o o r i Ut z c cf " m ^ m
r- O
w -~ o (B O
O Z o m CO
CA 5 z H
O en E -C a m 3 K m o .^ z
Z O H m
CO
Z3D
3D
o o
s g
s5
3.
23
P
3
CD
O
IDis
*^
CO
c O) o CD
3)
tQ
-j II
H
T a 3D l •n J) O O
c/) •D
O
W H
O
c
*-
*
•n
; ;.
o 0 H. S" c 3" 9 2 2. a Z S 15 M
^
i:.I
1 ' ; N S ;
ot
J * i o M S o s o N 3 o M
O D O O
i o e
C/)
O SL o ^ o o
o o
i IO i OC
s !
. s
'f
,.
iH -H
O
15 o O
) en
o m x O o o w •o o w H
O
C
P
0^
0CO l
C/)
sl
c: ^
5
33
S O
^
OD
m
CD
s
O)
l
-c 3
Ko
o CO
20 Z
S
(D
D)
s;-
CO
p"
d.
o
t- c/i
o CDr
^ ®
5
3 -3
x:
o 2.
o •o CD D

5186
i N )t
l I5SW0136 2. 1222B HJTTON
LEGENDTerrain Clearance . . . . . . . . . 100 metresLine Spacing . . . . . . . . . . . . . 100 metresProperty Boundary ———————
VERTICAL MAGNETIC GRADIENT2.500 gammas/metre ———^—— 0.500 gammas/metre ——————— 0.100 gammas/metre ——————— 0.025 gammas/metre
IMPERIAL METALS CORPORATION
AIRBORNE MAGNETIC SURVEYVERTICAL MAGNETIC GRADIENT
Calculated From Total Field
BANNAGAN PROPERTY
HUTTON TWP. ONTARIO
NT S NO 4? |/ 1 5
SCAi t 1 :1 0.000
DRAWING NO A ~814-?
DATE January 1989
TERRAQUEST Lin

\
i \
x'A
vi P Trq nsm jtter
A Cutler, 24.0 kHz muth 098
220
LEGENDTerrain C learance . . . . . . . . . 100 metres
Line S pacing . . . . . . . . . . . 1 00 m etresProperty B oundary ———————
TOTAL FIELD STRENGTH (Contours) 50 07o ——————— 10 0Xo ———————
QUADRATURE (Profiles Along Flight Lines)
Normal S lope Reverse S lope
•f 10 07o
- 10 0Xo
10 0Xo
- 10 07o
IMPERIAL METALS CORPORATION
AIRBORNE VLF-EM SURVEYCONTOURS OF TOTAL FIELD STRENGTH
PROFILES OF QUADRATURE
BANNAGAN PROPERTY
HUTTON TWP. ONTARIO
NTS NO 42I/ 1 5
SCALE 1 : 10,000
DRAWING NO A~8 1 4-3
DATE J anuary 1 989
TERRAQWST LTD.

^-t •'l ft--1O O" t*:-.
CUL+F
Au,Afl,Cu,NI,Zn
PROTEROZOIC ARCHEAN
9 Gowganda F ormation
'IN 8m Magnetic unit within 8.
Mafic Intrusives
3 Granitic Rocks
LEGENDTerrain Clearance . . . . . . . . . 100 metresLine Spacing . . . . . . . . . . . . . 100 metresProperty Boundary ———————
INTERPRETATION
Contact
Fault
8 Serpent Formation
6m Magnetic unit within 6.4IM5SWei36 2 .12228 HUTTON 230
6 Bruce Formation
1m Magnetic unit within 1
1 Mafic Metavolcanics
IF | Iron Formation
VLF TransmitterNAA Cutler, 24.0 kHz Azimuth 098
5 Mississagi Formation
Leading edge D(image of vertical magneticgradient.
VLF-EM Conductor Axes
Normal Quadrature
Reverse Quadrature
Total Field OnlyX — K
l l t l
See text for classification of
VLF-EM conductor axes
IMPERIAL METALS CORPORATION
AIRBORNE MAGNETIC SURVEYINTERPRETATION
BANNAGAN PROPERTY
HUTTON TWP. ONTARIO
N T S NO 421/15
S'ALf 1-10.000
DRAWING NO A- B 1 4 4
Januiiry 1989
TERRAQl JEST LTD.

o?-
V
o-b
f.NLEGEND
Terrain Clearance . . . .Line Spacing . . . . . . .Property Boundary
TOTAL MAGNETIC FIELD1000 gammas
250 gammas50 gammas10 gammas
100 metres 100 metres
IMPERIAL METALS CORPORATION
AIRBORNE MAGNETIC SURVEYTOTAL MAGNETIC FIELD
BANNAGAN PROPERTY HUTTON TWP. ONTARIO
NT S NO 4?|/ -J 5
SCALE. 1:10,000
DRAWING NO A 8 1 4- 1
DATE January 1989
TERRAQIJESTLTD.