L a r s e n | 1 Facebook Changing the Face of Voting: How ...
39
Larsen | 1 Facebook Changing the Face of Voting: How the Internet and Social Networking Sites Affected Youth Voting Behaviors in the 2008 Election Aleesha M. Larsen Bemidji State University Political Science Senior Thesis Bemidji State University Dr. Patrick Donnay, Advisor April 2012
Transcript of L a r s e n | 1 Facebook Changing the Face of Voting: How ...
L a r s e n | 1
Facebook Changing the Face of
Voting: How the Internet and
Social Networking Sites Affected
Youth Voting Behaviors in the
2008 Election
Aleesha M. Larsen
Bemidji State University
Political Science Senior Thesis
Bemidji State University
Dr. Patrick Donnay, Advisor
April 2012

L a r s e n | 2
Contents
Abstract……………………………………………………………………..3
Introduction………………………………………………………………...4
Literature Review…………………………………………………………..6
Methods and Data………………………………………………………...17
Interpretations of Results………………………………………………...20
Discussion………………………………………………………………….29
Appendix A………………………………………………………………..32
References…………………………………………………………………38
L a r s e n | 3
Abstract
Since the eligible voting age was changed in 1972 to include 18-21 year-olds, turnout has
been historically low for the youngest group of American voters. But, the 2008 election
got young people to swarm the polls, resulting in one of the highest turnout rates, among
the youngest age cohort, in history. The Obama campaign was the first to successfully
use social networking sites, like Facebook and Twitter, to help mobilize and persuade
young voters. In this study, I attempted to find how significant of a role in the Internet
played in convincing voters aged 18-24 to vote in 2008, especially for Obama. I use the
PEW Internet and American Life Project November 2008 Post-Election Tracking Survey
to examine Internet use for campaigning and political purposes among over 2,000
respondents. Preliminary analysis shows that the Internet is not only the number one
source of political information for young voters, but it’s encouraging them to be more
politically active and knowledgeable. However, including other socioeconomic factors,
the role of the Internet and social networking sites loses significance. The majority of
these young, “wired,” voters chose the Democratic ticket in 2008, which raises question
about what they will decide 2012.
L a r s e n | 4
Introduction
In the world of politics, the subject of voting behavior is constantly being
researched and theorized about. And ever since 1972, when the voting age requirements
were lowered to include 18-21 year-olds, even more focus has been targeted towards
getting these newly eligible voters to the polls. Generational differences, weaker ties to
the major political parties, and a general lack of interest in politics have been the reasons
many scholars have given to explain the inactive young voters.
So, then what made the youngest age group of eligible voters swarm voting
booths in 2008? The turnout amongst 18-24 year-olds in the 2008 presidential election
was one of the highest ever. And it was the highest since 1992. But, what was so
appealing about the 2008 elections? Was it Barack Obama who seemed to not only
persuade, but also mobilize millions of young voters?
The Obama campaign had almost every advantage. They raised and spent more
money than any other presidential election in history. They installed a massive and
successful “grass roots” movement. Obama’s fresh face and cool, calm, collected
demeanor was also appealing. Was it a combination of the money, rallies, image, age,
and race that got fired-up youth to the polls in Obama’s favor? Was it the chance to make
history? Was it classic socioeconomic factors such as race, education, and income? Or
was it one specific aspect, because all these qualities can have an advantageous effect on
every age cohort, just in differing fashions.
But, the Obama campaign did something not previously done to such an extent.
They tapped into the hearts and minds of the Internet generation. Obama was the most
L a r s e n | 5
be-friended person on Facebook in 2008. The campaign used Twitter to constantly update
the people about where they could see their shining star candidate. I believe their tactics
in the Internet sphere was the deciding factor in mobilizing 18-24 year-old voters for the
Obama campaign. They successfully understood and used all aspects of the Internet to
their advantage. They tapped directly into the life source of most of American young
adults.
Prior to 2008, voter turnout had been on a steady decline for years, with few
exceptions. And no other age cohort has had more pathetic turnout rates than 18-24 year-
olds. In a nation becoming increasingly apathetic but increasingly angry with
government, candidates need to motivate the youngest generation of Americans to vote
and keep voting. Without such efforts, someday sooner rather than later, polls might be
close to empty. If that happens, what will that do to our democracy?
L a r s e n | 6
Literature Review
General Voting Behavior
The start of the twentieth century marked the beginning of turnout declines
compared to the nineteenth century (Hout &Knoke, 1975). Cavanagh (1981) found that
after a post-war peak turnout of 62.8% in 1960, the rate fell to 53.9% in 1980, which was
the lowest since 1948. Some of this drop could be attributed to the larger pool of eligible
voters after the eligible age was dropped to 18. Since 1980, the year with the lowest
turnout was 1996 with only 58.4% of eligible voters showing up at the polls (File, 2010).
The biggest drops happened among the young, poor, and uneducated (Cavanagh, 1981).
Also interesting is that the decline in turnout occurred during a period when legal
impediments to voting had been eased and even eliminated and education levels were
rising among Americans (Flanigan & Zingale, 2006). This raises more curiosity about the
influences that are encouraging young voters to go to the polls or stay home if education
and registration restrictions have been made into less significant factors.
The young are less likely to begin voting while the middle-aged are more likely to
stop voting. And the new age cohort of 18-21 year-olds that started voting after 1972,
represent a constituency that, some believe, have been drifting in and out of the electorate
ever since (Cavanagh, 1981). The “pattern of decreasing turnout among successively
younger birth cohorts, suggest differences in the political socialization of voting
obligations between the nineteenth and twentieth centuries” (Hout &Knoke, 1975:52).
Perhaps, Obama’s record-breaking campaign changed political socialization back to
stronger levels for the twenty-first century. But, distractions in the non-political world
affect all age groups. So, despite this evidence, there is something more to be said about
L a r s e n | 7
youth voting behaviors and how these relate to their voting tendencies, or lack thereof,
especially for present and future elections.
Youth Voting Behavior in the Twenty-First Century
Any extension of suffrage is usually done with the expectation that the newly
franchised group will show support for the political preferences of leaders. But, this
hasn’t always worked for the 18-21 year-old voters. The voting age was lowered in
response to student movements opposing the Vietnam War, but turnout didn’t reflect the
new found availability (Flanigan & Zingale, 2006). In 2006, 18-29 year-olds represented
42 million people in the pool of eligible voters (“Youth Voter Mobilization Tactics,”
2007). This is obviously a crucial demographic to get involved, so why don’t young
adults get involved politically?
Hooghe and Wilkenfeld (2007) studied the idea that intended behaviors at a
young age have a predictive value for actual behavior at an older age. For instance, a 14
year-old who intends to vote when they are of age, will most likely vote. This idea was
validated by Granberg and Halmberg (1990). But, these studies focused on European
countries, which are all governed by very different systems than the United States. And
here, our system and especially registration restrictions have been proven to be of critical
influence towards turnout rates (Cavanagh, 1981). In countries where young adults
express high levels of trust in political institutions, adolescents and young adults are
expected to vote at higher levels (Hooghe & Wilkenfeld, 2007). What about American
adolescents? Does that theory prove true among American young adults?
L a r s e n | 8
As people grow older they tend to grow through different “adult roles” that may
increase voter turnout after they are completed. Life events such as, “settling down,”
getting married, developing community ties, finding a career, and leaving home made a
significant impact. Residential stability, which is categorized as those who have stayed
put for three years or more, had a turnout rate 11% higher than those that have more
instability (Highton & Wolfinger, 2001). So, 18-25 year-olds were still showing the least
stability since they tend to be a lot more mobile than other age groups (Hooghe &
Wilkenfeld, 2007). Previously, when residency requirements were more stringent, it had
a higher negative effect on younger voters who are the most mobilized of the population.
So, in 1972, the Supreme Court linked residency requirements with the length of time it
takes to prepare lists of registered voters and discovered it only takes 30 days. But, they
allow states with 50-day residency requirements to keep them on the books (Flanigan &
Zingle, 2006). This was done in hopes of getting higher turnout among young, mobile
voters. But, it didn’t do much to raise their turnout. Then what does it take to motivate
young voters?
This question has prompted think tanks, campaigns, and research centers to
develop answers for the Internet generation and their more modern forms of
communication. The George Washington University created a pamphlet in 2007 that
specified some tactics to get young people mobilized to vote. They found that more
personalized interaction is crucial for young voters and when it comes to online political
activity, young voters prefer the opportunity to join in on the political conversation just
like the services offered on social networking sites. Another benefit of using newly
available Internet techniques is that they are cheap and the easiest way to reach this
L a r s e n | 9
historically unmotivated age cohort. Getting 18-29 year-olds to the voting booths isn’t
just beneficial to the candidates in a single election, “…mobilizing young voters creates a
larger, more vibrant voting base in the long-run, re-energizing our nation’s democracy,”
(“Youth Voter Mobilization Tactics”)
Factors and Strategies of the 2008 Campaign
The electoral participation of Americans under 25 has declined anywhere between
13 and 15 percentage points in presidential election years from 1972 to 2000. (Levine
&Lopez, 2002). Even the share of the electorate belonging to youth voters has shrunk
from 14.2% in 1972 to 7.8% since 2000.
In 2004, however, there was a temporary jump in turnout rates for voters aged 18-
25. They showed the largest increase from 2000 to 2004 among all ages increasing from
48% to 60%, respectively. Thomas E. Patterson points out that young voters were more
likely to say they “really dislike” a candidate, perhaps indicating that the unattractiveness
of a candidate may be incentive to vote (Flanigan & Zingale, 2006). With George W.
Bush’s almost record low approval ratings by 2008, this could have been a cause for
youth voter participation that November.
Voters are motivated by the ability to make good and easy decisions (Lau, et. al.,
2008). And with 44% of young people preferring a president in his or her 40s, age could
be the easiest deciding factor. This was focused on young Democrats, however. Yong
Republicans preferred candidates in their 50s (Thee, 2007).
With Barack Obama being the first African-American president, the “race thing”
was definitely talked about quite often during his campaign. Many believed that his race
L a r s e n | 10
was the only reason so many young black youth voted in his favor, or showed up to vote
period. But, this actually became problematic. Obama’s identity is missing cultural
markers with which blacks are more familiar (Walters, 2007). As Debra Dickerson
(2006) explained, “…you’re not embracing a black man, a descendent of slaves. You’re
replacing the black man with an immigrant of recent African descent of whom you can
approve without feeling guilty or frightened.” This made the candidate’s race an
uncertain factor for 2008.
Obama’s ground game proved to be a massive success. With over 700 field
offices, scattered especially in battleground states, this resulted in a huge increase of the
Democratic vote share. Obama offices even managed to flip three states from a
Republican to a Democratic majority (Masket, 2009). As an Obama campaign official
confirmed, “…The more offices we had the easier it was to empower your local
organizers and your local volunteers to be part of the effort…it was more efficient to
have more offices.” But, too many offices and volunteers could cause oversaturation and
a decline in the positive effect (Masket, 2009: 1026).
The Obama campaign, along with the Democratic National committee, poured
$112 million into state-level parties (Farnam &Haynes, 2008). These funds went straight
towards the Obama volunteer army. Which proved that “…investing more in shoe leather
may be a wise decision.” The results were a one point overall increase in the vote share
and almost a three point increase in some states (Masket, 2009).
L a r s e n | 11
Youth Results in 2008
The 2008 Obama campaign was the first in decades to be carried so far on the
backs of the young. The campaign made the youth a priority, which can be critical
towards getting them to the polls. For example, the Obama campaign developed a
student-to-student phone bank where volunteer students could download a contact list
and call from the comfort of their dorm (Drehle, 2008).
The Obama campaign “…has been heralded as ushering in a new era in online
youth civic engagement and two-way communication between citizens and political
decision makers,” (Milner, 2010: 73). With an e-mail list containing over 13 million
names and an interactive website that gives tools for grass roots organizing, it was hard to
deny or escape Obama’s presence on the world wide web in 2008 (Milner 2010). Besides
the campaign’s main website, Obama was on Facebook, Twitter, YouTube, and took cues
from different politically motivated, left-leaning organization websites like MoveOn, the
Huffington Post, and Daily Kos.
One of the most critical tactics for the Obama campaign was that they got young
voters participating early. More than 6.5 million young, interested voters participated in
the 2008 primaries and caucuses. This was a rise from 9% in 2000 to 17% in 2008. And
60% of these young primary voters supported Obama (Kirby, et. al., 2008). Obama
actually received his biggest victory margins in college towns (Millner, 2010). The
primary victory in Iowa over Hillary Clinton came almost entirely from voters under 25
years old. They preferred Obama to the next-closest competitor by more than 4 to 1. The
under-25 crowd gave Obama a net gain of some 17,000 votes and he won by just under
20,000 votes in Iowa. “Combining digital-age technology with old-fashioned shoe
L a r s e n | 12
leather, the Illinois Senator first rallied Iowa students to cancel Clinton’s catwalk”
(Drehle, 2008).
Internet Effects
The Internet is proving to be a force to be reckoned with in almost every aspect of
American life. It is a news media that provides information quicker, cheaper and in a
more convenient form than other mediums. This makes it more likely to be adopted and
have the ability to change behavioral patterns. It is actually the only media outlet that has
the power to influence political behavior. (Tolbert & McNeal, 2003). It is definitely
having a major impact on political participation online as well as offline. American
Online reported around the time of the 2000 election that seven of the all time top ten live
“online chats” were political in their scope, suggesting that the Internet may be leading to
higher political interest and participation. A study conducted by Tolbert and McNeal
(2003) showed that respondents with access to the Internet and other online election news
were significantly more likely to report voting in the 1996 and 2000 elections, even after
controlling for socioeconomic factors.
“Internet may indeed be narrowing the participation gap between age groups.”
Those under 30 are more likely to seek information online in general and half-again more
likely to seek political information online in the forms of creating, posting, or forwarding
political messages. And it’s been shown that a preference for online political information
makes younger voters more politically active online and offline (Bachman, et. al., 2010).
The Internet also helped to get more minorities politically involved. Over half of the
major demographic subgroups were politically engaged online, including 25% of
L a r s e n | 13
African-Americans and English-speaking Hispanics that signed up to receive election
updates online (Smith, 2009).
With Facebook boasting a market share of 85% on four-year University
campuses, it was a golden opportunity for Obama to charm young voters (Drehle, 2008).
If political institutions, candidates, and organizations can present politics in a more
relevant way to younger voters, their decline in political interest may be slowed, stopped,
or even reversed (Lupia &Philpot, 2005). The Internet is the best medium to attempt to
cause this change. With more advances in computers, laptops, smart phones, and even
tablets, the Internet is increasingly becoming just an arm’s length away. But, the only
way that political information and campaign news has been aimed at young adults so far
is through satire news websites such as the Daily Show or the Onion News Network.
These sites have 27% of political online consumers aged 18-29 visiting them for
campaign news (Smith, 2009). This statistic can be fairly troubling considering these
sources are entertainment more than news.
The mix of age, race, life events, ground movements, and Internet manipulation
all worked together to create a brilliant 2008 campaign for Obama that seemed to surpass
all standard obstacles.
About 59% of all voters had taken part in some sort of campaign activity online
during the 2008 election cycle (Smith, 2008). Among all Americans under the age of 50,
the Internet use for political purposes outpaced newspapers, which has traditionally been
the number two news source used for political news after television. And 34% of 18-29
year-olds relied almost entirely on the Internet for political news and information leading
L a r s e n | 14
up to the 2008 election. In fact, politically aimed Internet use overall has jumped from
37% in 2004 to 46% in the spring of 2008, then to 59% directly after the election (Smith,
2009). Using the Internet to further campaign messages as well as receive donations was
a smart move by any and all candidates. The aspect of particular interest for me was the
use of social networking sites such as Facebook and Twitter.
During the 2008 campaign, nearly 1 in 5 political online users posted their
thoughts, comments, or questions on websites, blogs, or social networks. Thirty percent
of these people posting political thoughts and feelings were under the age of 25. But, the
overall use of social networking sites is the most impressive with usage numbers almost
quadrupling since 2005. Fewer than 1 in 10 Americans used a social networking site in
2005 and more than 1 in 3 Americans used one in 2009. Fifty-two percent of these people
used these sites for political purposes. That represents 14% of all Americans using
Facebook or similar sites to gain or share information about the 2008 election (Smith
2009).
Of all the political online consumers and all the different political activities
online, most of the Internet sided with Obama. Even though Democrats were less likely
to go online compared to Republicans, the Democrats that were online were more
aggressively in support of their party’s candidates. Twitter users voting behaviors were
more tilted towards Obama and Independent Obama supporters outpaced McCain voters
in social networking activities that corresponded to the campaigns. Online Obama
supporters took part in a wider range of online political activities overall (Smith, 2009).
L a r s e n | 15
But, no one specific part has been labeled as the ultimate campaign advantage.
Yes, it has been shown that the Internet definitely has an impact on youth political
curiosity and advancement of their political knowledge, but nothing has specified just
how much of an impact this still fairly new medium will have on current young voters as
well as future voters. It should definitely raise curiosity knowing that the study conducted
by Tolbert and McNeal (2003) showed that the Internet is the only medium that had a
measureable impact on voting behavior. And not just on voting, but it impacted other
forms of political participation like having political discussions, displaying buttons or
signs, attending rallies, and even donating money to a certain candidate, party, or interest
group. Not even television can do that. A survey from May 2011 that has been used by
the Romney 2012 campaign showed that 31% of likely voters had not watched “live”
television in the previous week, meaning they hadn’t watched a show or advertisements
as they originally aired on TV. Because of this, television advertising is becoming less
reliable and desirable considering the costs and low impact. This is causing more targeted
online advertising (Peters, 2012).
Also, a lot of voting behavior research is fairly outdated. Twenty-first century
youth voters need to be studied. “Contemporary research has found that young adults are
changing the forms of social organization and interaction-and thus citizenship norms-in
American society and politics” (Bachman, et. al., 2010). If my generation is having such
a large impact on American society, then why hasn’t more research been done on
convincing us to vote? Previous empirical research on the role of Internet access in
shaping citizen political participation has shown mixed results because of the lack of
datasets (Tolbert & McNeal, 2003). Also, there has been a total lack of research into the
L a r s e n | 16
popular genre of social networking sites, which is a growing field not only in scope, but
also in power and influence.
My generation is the Internet generation. We not only grew up with the Internet, it
grew up with us. And I believe the Internet, specifically the social networking sphere,
was the ticket to the White House for the Obama campaign. There has been limited
research on this and I want to find the answers to this historic election.
L a r s e n | 17
Methods and Data
Dataset
For this study I used the PEW Internet and American Life Project November 2008
Post-Election Tracking Survey. The PEW Internet and American Life Project has been
conducting multiple studies over the course of recent years to examine the role of Internet
is playing not only in individual lives, but in American society as a whole. This particular
study was done via telephone immediately after the 2008 election and had 2,254
individual respondents (1,591 of which were Internet users) who answered questions
regarding their Internet use, level and methods of online political participation, offline
political participation, and other socioeconomic determinants.
Determining Independent and Dependent Variables
Dependent Variables
Since the main goal of my research was to discover the significance of different
factors on young voters who chose Obama on Election Day 2008, I only used one
dependent variable and a recoded version of the same variable, both being nominal level
variables. These variables were simple derived from yes or no answers given by the
respondents pertaining to whom they voted for in 2008. I labeled the variable, vote02,
which enumerated the options of party tickets that could have been voted for. Only the
Democratic ticket of Barack Obama and Joe Biden as well as the Republican ticket of
John McCain and Sarah Palin was of interest, so the other answers were considered
missing. I later created a dummy variable from vote02 for logistical regression purposes,
which became vote02recode, where only a vote for the Democratic ticket was coded as a
L a r s e n | 18
1 and all other votes coded as 0. I used logistic regression analysis in conjunction with
crosstabs due to a lack of interval level data, especially in regards to dependent variables.
Independent Variables
The independent variables I used in my analysis were ones that exclusively
pertained to Internet use during the 2008 campaign, besides multiple variables regarding
age. The original variable, age, being interval wasn’t used until logistical regression. I
used a recoded age variable, recage, which split the age variable into six groups: 18-24,
25-34, 35-44, 45-54, 55-64, and 65+. While I used all groups in order to compare and
contrast results, my main focus was on the youngest age cohort. This group of 18-24
year-old respondents was also recoded into a dummy variable labeled, yng_dum. The
final variation on the age variable was a binned variable that grouped all ages into three
categories: youngest (18-37), middle aged (37-54), and senior (54+).
Variables concerning Internet use included different activities such as using the
Internet in general; using it as the main source for election news; how often the
respondent used the Internet; if the respondent used social networking sites to post
comments, questions, or theories regarding the election; or if the respondent has used
social networking sites to receive any election information. These social networking sites
included Facebook, Twitter, LinkedIn, and others that were not specified.
I used both types of independent variables separately to analyze the individual
effect age had on the potential of a Democratic vote in 2008 as well as how being a
frequent Internet user or using the Internet as a main source of political information
affected the respondents votes. I then combined different sets of these variables to test the
L a r s e n | 19
strength of each type when the other was introduced, or to analyze if the chances of
predicting a Democratic vote could be enhanced.
Control Variables
I wanted to use a set of control variables that have shown over time to be
significant in predicting how an individual may vote. By using these, I was able to truly
test the significance of the Internet and social networking sites on youth voting results in
2008. Variables such as 2007 income, education, race, and student status were used in
logistical regression to test the strength of association between the Internet and a
Democratic vote. Also, these were used in layered crosstabs to test the same idea and to
see the changes different independent and control variables had across all age cohorts.
L a r s e n | 20
Interpretation of Results
Because I have a fairly thorough and multi-part hypothesis, I started with some
simple analysis then continued to add independent and control variables along the way.
My hypotheses not only looked at 18-24 year-olds being more apt to use the Internet and
social networking sites for political purposes, but that this actually encouraged them to
vote in 2008 and that it also encouraged them to vote for Obama significantly more than
other age groups or the entire voting population as a whole. I started my analysis by
testing the relationships between different age groups, use of the Internet as a main
political news source, and which party the respondent voted for on Election Day as the
dependent variable. The first step I took was to run a couple cross-tabulations. The first
cross-tab I ran compared the recoded age independent variable with the dependent
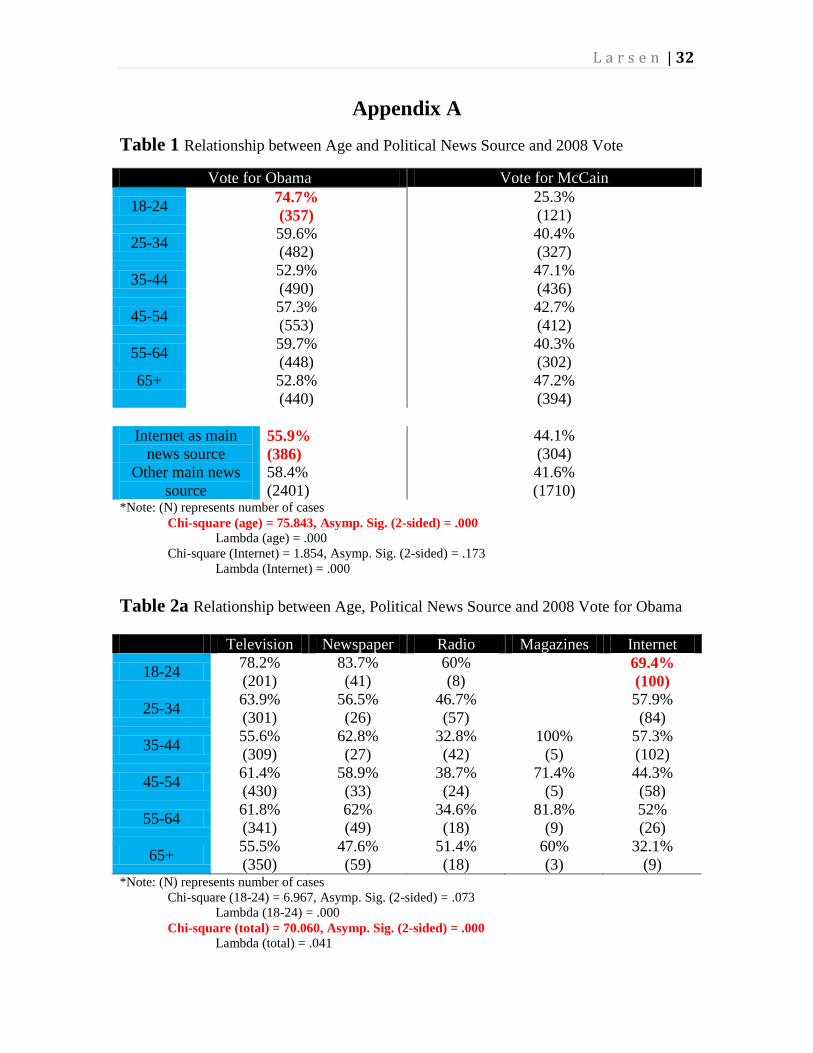
variable regarding which party the respondent chose to vote for. I found that age was
significantly related to the party ticket voted for and that 18-24 year-olds were the highest
supporters of Obama, in terms of percentages, compared to the other five age groups with
74.7% of the youngest respondents voting for Obama compared to the 25.3% who voted
for McCain. A chi-square value of almost 76 resulted in a .000 significance value. After
creating a dummy variable, coding the use of Internet as a main source of election news
as 1 and all other news sources as 0, I ran another cross-tabulation testing how a
respondent’s political news preference affects the outcome of their vote. According to the
Pearson chi-square score, there was not a significant relationship at 1.471 and a
significance value of .225. However, the almost 12 percentage point difference between
Internet users voting for the Democratic ticket over the Republican ticket shows that
L a r s e n | 21
there was some amount of a relationship between the independent and dependent
variables.
(Table 1 about here)
To examine the relationship further, I combined both independent variables in layered
cross-tabs to test the effect of both age and Internet use on Election Day results. Overall,
the combination of the two independent variables had a significant effect on the ability to
predict a vote for Obama at the .000 level. I found that 69.4% of 18-24 year-olds who
prefer the Internet for election news voted for Obama over the 30.6% who voted for
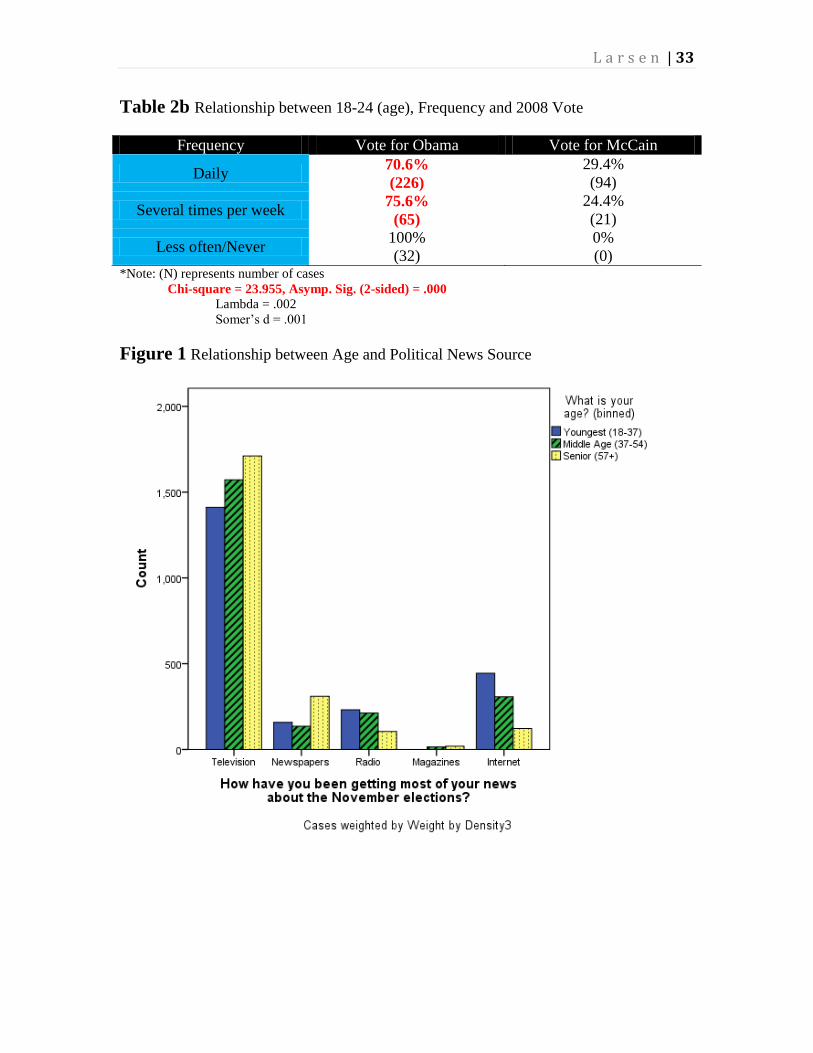
McCain. But, relying on Internet sources for political information among the youngest
age cohort wasn’t quite significant at .073. It did end up being significant though at the
.001 level for those aged 18-24 who used the Internet on a frequent basis. I came to this
conclusion by performing a layered cross-tab using an 18-24 year-old dummy variable
and the variable, often, with the dependent variable. I also illustrated this relationship
with a bar chart using the binned age variable instead. The graph also shows that Internet
has overtaken newspapers as the second most highly used source for political updates.
This quite possibly will have an effect on future campaigning and future research if this
trend continues.
(Table 2 about here)
(Figure 1 about here)
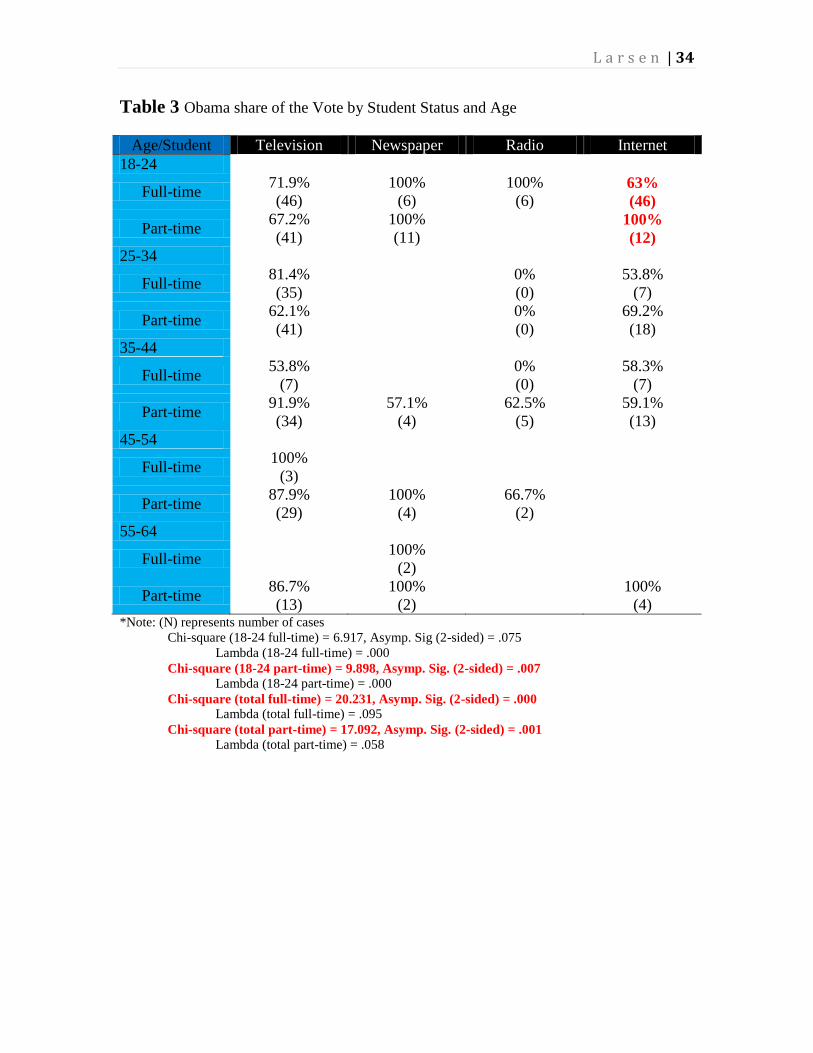
With the large amount of support for Obama and the mobilization of college
students in particular, I wanted to study the role that a respondent’s student status played,
in combination with the source of election news, in determining a vote for Obama. I ran
L a r s e n | 22
another layered cross-tab for this relationship. Both full-time and part-time students who
prefer to use the Internet as their main news source were overwhelmingly in favor of
Obama on Election Day with 63% of full-time students and 100% of part-time students
that are Internet newsreaders choosing the Democratic ticket. The chi-square result for
full-time, 18-24 year-old students was insignificant, however, with a value of 6.917 and
the related significance at the .075 level. However, there was significance for part-time,
18-24 year-old students the chi-square had a value 9.898 and significance at the .007
level. Across all ages, the relationship was significant for both full and part-time students
with Asymp. Sig. (2 sided) values at .000 and .001, respectively. The total effect that
student status had on the dependent variable was the only independent variable that had a
Lambda score worth discussing. The Lambda for all full-time students was .095, while
the Lambda for all part-time students was .058. This tells me that knowing someone’s
student status improves my odds of predicting their 2008 vote by anywhere from 6% to
9.5%.
(Table 3 about here)
After analyzing the basic effects of the Internet on young voters, I wanted to dig
deeper into the way Internet was used by 18-24 year-olds during the 2008 election
season. First, I wanted to look at where on the Internet respondents were getting their
campaign or candidate information, specifically if this information was received from a
social networking site like Facebook, Twitter, or LinkedIn. News about a campaign or
specific candidates on these sites can actually come from a variety of different areas.
Respondents can get personal updates from the candidates themselves via status updates
on their personal Facebook pages or Twitter accounts. This is also where information
L a r s e n | 23
regarding when a rally might be held or where in the country the campaign may be
headed next can be found. These personal pages can also be where a candidate posts
recent videos of speeches, their latest commercial advertisement, or links to the official
campaign website and places online to donate money to the campaign. If respondents are
not “friends” with the candidate on Facebook or following them on Twitter, they can still
possibly receive this same multitude of information from other people who are sharing
videos, postings, etc. regarding the candidate of interest. A lot of this information may
just be for entertainment value, like videos of the “Obama Girl” on YouTube, or it could
be just plain false. However, this is where many people may look for a story to further
investigate on a different website. Facebook can be a terrific starting point to gathering
more information. This is why I wanted to specifically look at the influence these types of
websites had on young voters in 2008, not only because their popularity is soaring among
all age groups, but because the technology and methods of receiving and sharing news
through these sites is incredible and they keep improving.
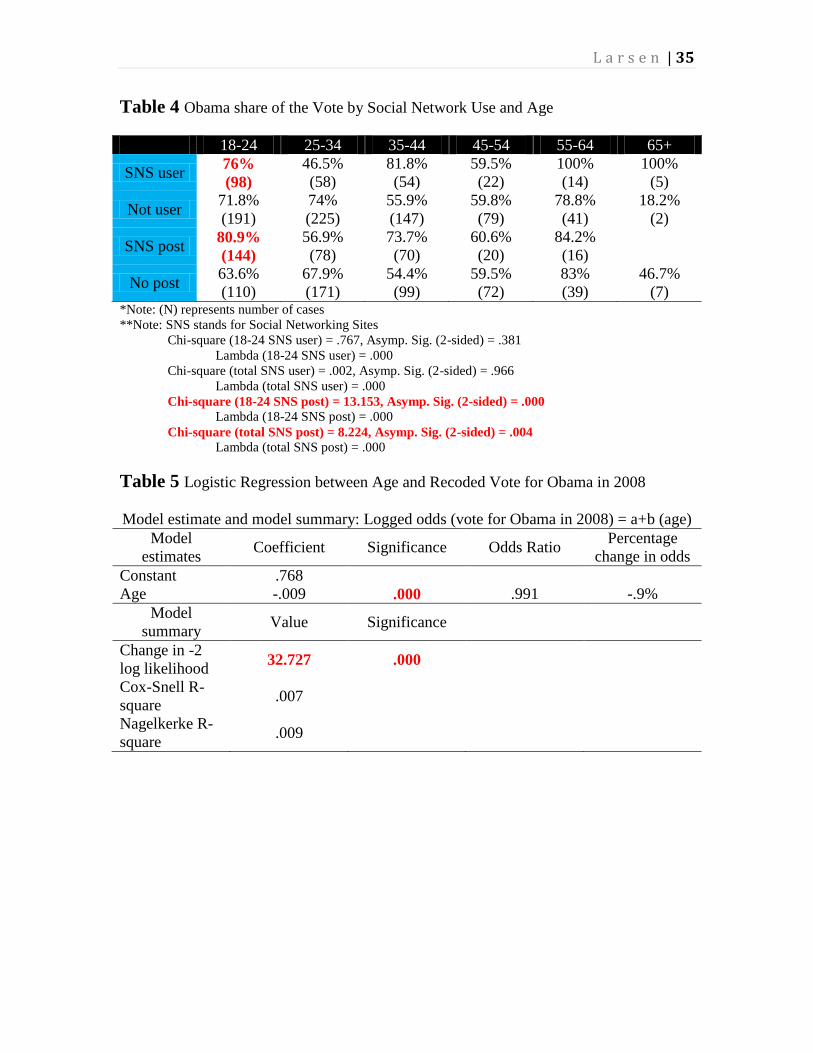
To analyze the relationship between social network sites, age, and the 2008 vote, I
used layered cross-tabs. Even though 76% of 18-24 year-old respondents who commonly
used social networking sites for political information voted for Obama, the chi-square
score of .381 showed that the relationship was not significant. Surprisingly, the 81.8% of
35-44 year-olds who commonly used social networking sites for political information and
voted for Obama did show a significance level of .000 according to chi-square.
I then looked at the relationship between performing different social networking
activities, such as posting comments or questions about a candidate, or posting a video of
a campaign commercial, along with age and the dependent variable. A large majority of
L a r s e n | 24
18-24 year-olds who posted something about the campaigns on a social networking site,
80.9%, voted in favor of Obama. The chi-square value of 13.153 shows that age as well
as political activity on social networking sites has a significant impact on party choice at
the .000 level.
(Table 4 about here)
Posting questions and comments, or sharing videos and links involving the election or a
candidate is now considered by some to be a form of political participation. These online
activities may skew perceptions on all political participation though, by possibly showing
in the future that political apathy is dwindling, especially among the young. But, can a
couple clicks of the mouse to share a political advertisement with friends of Facebook
really be considered legitimate participation in the political process?
To get a more detailed test of my theory, I employed logistic regression. This also
helped me see the strength of my independent variables more clearly and to see if those
relationships would hold significance when other control variables are introduced. First, I
ran a binary logistic regression analysis between age and the party ticket voted for on
Election Day 2008, modeled by the equation: Logged odds (vote for Obama in 2008) = a
+ b (age).
(Table 5 about here)
The resulting model is: logged odds (vote for Obama in 2008) = .768 - .009 (age). This
model tells me that, without knowing someone’s age, the logged odds of them voting for
Obama in 2008 is .768 and these logged odds decrease by .009 for each one-year increase
in age. To make this number more meaningful, I took the odds ratio value of .991 and
L a r s e n | 25
converted it into a percentage to show the change in odds in a more direct fashion. My
results told me that the slightly negative relationship meant that a respondent at a certain
age is .9% more likely to have voted for Obama in the 2008 election than a respondent at
the next higher age. While .9% may not seem like much, when the results are reliant on
just a single year increase in age, the percentage change in odds takes on more meaning.
According to the Wald score of 32.555, this is a significant relationship. The Cox & Snell
R-square as well as the Nagelkerke R-square scores gauges the strength of association
between the dependent and independent variables, with the Cox-Snell measurement being
the more conservative of the two. In this scenario the Cox & Snell R-square score was
.007 and the Nagelkerke R-square was .009, showing that there was a weak relationship.
But how accurate is the model’s ability to predict a respondent’s vote in 2008? Well, the
change in -2 log likelihood was 32.727, which is significant at the .000 level. This means
that knowing a respondent’s age significantly enhanced the model’s ability to predict a
vote in 2008. The “full effect” of the independent variable, age, on the dependent
variable, 2008 vote, is -.18 meaning that across the full range of observed values, an
increase in age decreases the probability of voting for Obama by .18.
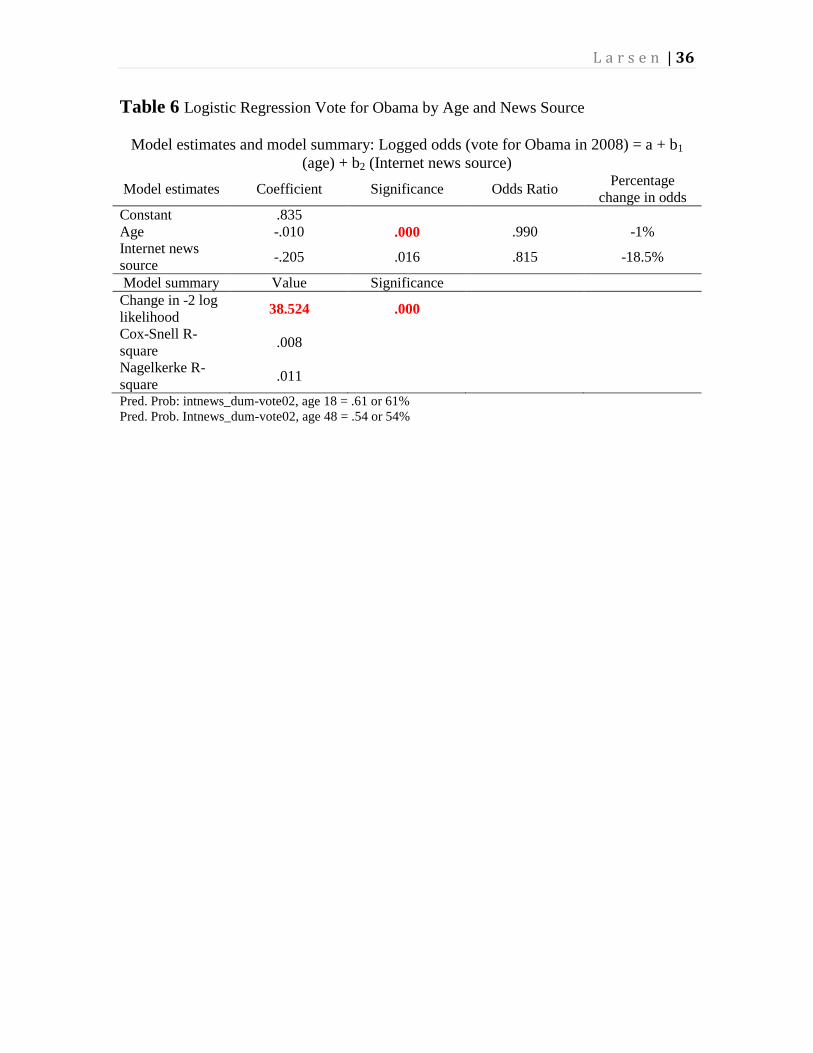
I then expanded my logistical regression analysis to further test the strength of the
relationship between age, using the Internet as a main source of election news, and a vote
for Obama in 2008 modeled by the equation: logged odds (vote for Obama in 2008) = a +
b1 (age) + b2 (use of Internet as main news source). I expected to see a higher strength of
association than when I was only measuring age. I also expected to see an even higher
ability to enhance the predictive power of the equation.
(Table 6 about here)
L a r s e n | 26
The resulting model is: logged odds (vote for Obama in 2008) = .835 - .01 (age) - .205
(use of Internet as main news source). This model tells me that not only will an increase
in age cause a decrease in the logged odds of voting for Obama, but also those who
choose different methods of news decreases the logged odds of voting for Obama by .01
and .205 logged odds, respectively. The odds ratio for age in this scenario is basically still
the same. The odds ratio for using the Internet for election news is 18.5%, which tells me
in a more direct fashion, that respondents who use other news sources such as television
or newspapers over the Internet, are 18.5% less likely to have voted for Obama in 2008.
The Wald score, 36.743, shows that this combination of variables has a significant
relationship. The Cox & Snell R-square improved slightly to .008 and the Nagelkerke R-
square also improved slightly to .011. While this still shows a weak relationship, it has
strengthened it slightly. The main question for this part of my analysis is whether or not
the two independent variables working together enhanced the model’s ability to predict a
respondent’s vote in 2008. The change in -2 log likelihood improved slightly to 38.524,
resulting in a .000 level of significance. So, both variables enhanced the ability of the
model to correctly predict a respondent’s vote in 2008 and it was a light improvement
from just knowing a respondent’s age. Using this information I was able to find the
predicted probability for 18 year-olds as well as 48 year-olds. I used the age of 48,
because it was the average age of respondents in the entire survey and it is part of an age
cohort that tends to be politically active. The predicted probability that this model gives
to 18 and 48 year-olds is .61 and .54, respectively. This means that for 18 year-olds who
use the Internet as their main source for political news, the probability of them voting for
Obama is 61% and for 48 year-olds who use the Internet as a main source for political
L a r s e n | 27
news, their probability for voting for Obama is 54%. The other information these
probabilities give me is the difference between the two ages. Voters at the age of 18 has a
.07 or 7% higher probability of voting for Obama than voters aged 48, giving more
emphasis to the fact that Obama knew how to mobilize and persuade young voters very
well.
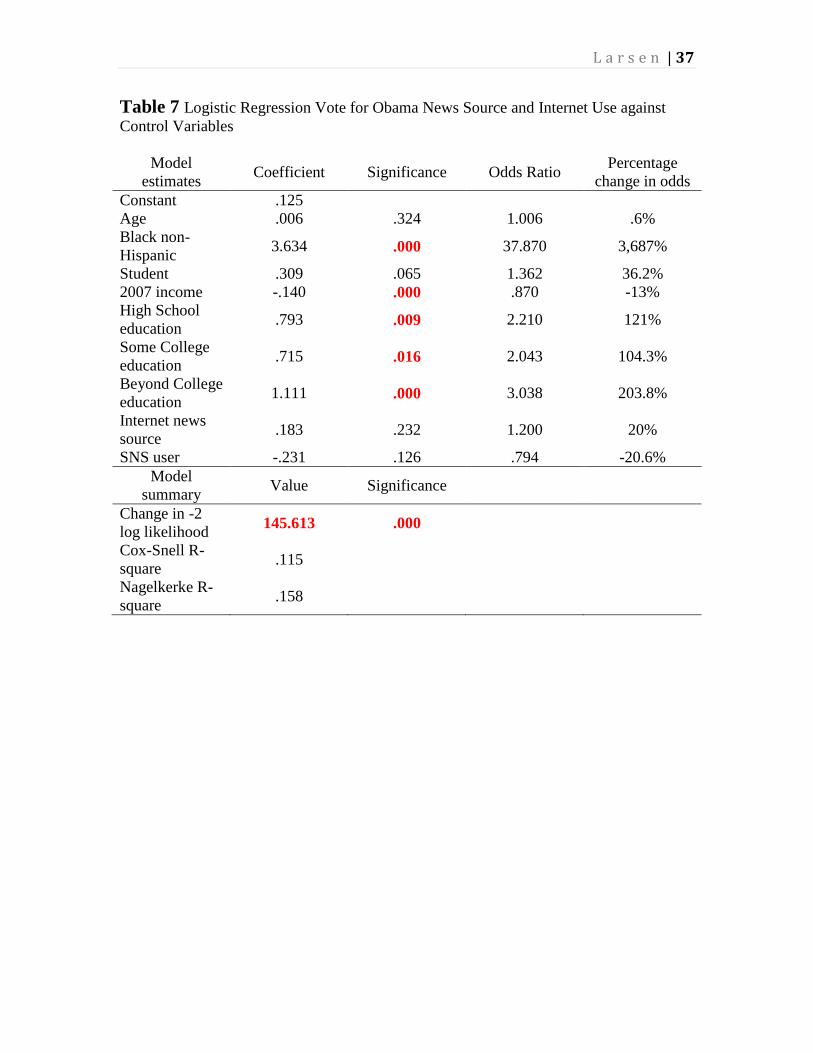
Based on the strength of these results, my final test includes additional control
variables. I again included age as well as other independent variable, which were: use of
social networking sites to gain campaign information and using the Internet as the main
source of political news. The control variables I used included: a dummy variable
representing black non-Hispanic voters, a dummy variable combining full-time and part-
time students, household income in 2007, and three separate dummy variables
representing different levels of education. I was hoping to find that even with the addition
of control variables, my Internet based independent variables would still hold a
significant influence.
(Table 7 about here)
The results of this analysis raised questions about the hypothesis. Not only did my two
Internet related independent variables fail to be significant, with using the Internet as a
main source of political news at a Wald score of 1.431 and related significance level of
.232, and using social networking sites for political information at a Wald score of 2.347
and a related significance of .126, but event the age variable lost significance with a Wald
score of .973 and a related significance score of .324. All the other control variables,
excluding student status, proved to be significant in predicting a vote for Obama in 2008.
L a r s e n | 28
The combination of all nine variables did significantly enhance the model’s ability to
predict by quite a large margin. The change in -2 loge likelihood was over 1, 394, which
is much higher than the change discovered by knowing age and main source of political
news.
L a r s e n | 29
Discussion
After several steps and varying layers of analysis, my hypothesis was supported
by some analysis and challenged by other tests. While the Internet as a political news
source and performing political activities online had a significant effect on voters aged
18-24 choosing Obama in 2008, those factors couldn’t hold significance when other
independent variables and control variables were introduced. Socioeconomic factors like
race, education, and income still have the strongest influence in determining a person’s
vote, no matter the age or source of news and information.
On the positive side, my research and analysis showed that not only is the Internet
now more relied upon than newspapers for political information, but that the Internet is
opening doors for more political participation and knowledge. And even though the
Internet’s role may not have been statistically significant in electing Obama in 2008, I
believe it will only continue to have a stronger impact in future presidential elections. It
did have a positive influence on involving young voters in the political process, which is
critical in order to not only get them to vote for a certain candidate, but to hopefully keep
them voting in the future. So, even though my main theory proved to be inaccurate for
now, I discovered more about the role of developing technologies in the world of politics
than I expected and I firmly believe that future data and research will eventually prove
my hypothesis correct. Perhaps as soon as 2012.
The Obama campaign has already been hard at work to prepare for the 2012
campaign season. They have a team of in-house technology developers working at the
Chicago headquarters on a top-secret application that will track every door they knock
on, every dollar they fund raise, every action they take. Last November they redesigned
L a r s e n | 30
the campaign website to look and work the same on every platform: computers, mobile
phones, and tablets. Michael Slaby, Obama’s chief integration and innovation officer,
along with Joe Rospar, the campaign’s chief digital strategist, have been constructing a
“microlistening” and computer modeling program to comb online and offline behavior
patterns for voter information. They plan to use this to personalize every interaction with
the campaign from fundraising to vote persuasion. But, that’s not all. In a small, dark
corner of the Chicago offices there is a team of about a dozen developers that have been
working for months to re-write the campaign’s code (Romano, 2012). According to Jim
Messina, Obama’s head campaign manager, “Our efforts on the ground and on
technology will make 2008 look prehistoric.”
This vamped up version on the 2008 campaign will not only prove to be
interesting and possibly controversial, but it could greatly impact how technology driven
campaigns become in the future. This could most likely lead to the Internet becoming a
significant persuasion and mobilization tool in the very near future.
Although Republicans candidates have also been incredible digital strides so far
in 2012, they tend to get less attention. Mitt Romney’s campaign and a team of online
behavior analysts have already spent 18 months trying to fight television’s law of
diminishing returns. These companies are using algorithms to find similar political
sentiments online by observing and analyzing what they read, comment on, and share
online. These algorithms have told the Romney campaign that his typical online
supporter likes online quizzes, likes to share photographs, and is interested in technology,
literature, home repair, and child care. Voters online that are interested in video or casino
games, bowling, martial arts, and jazz tend to not be as supportive of Romney’s message.
L a r s e n | 31
They can even tell when someone watches a Romney video online, how long they
watched it, and if they took action because of it. The Obama digital team knows when
online supporters open e-mails from the campaign and if they accessed links to the main
campaign website (Peters, 2012). According to Darrel M. West, the director of Center for
Technology Innovation at the Brookings Institute, “This will likely become the first truly
digital election because so many people are not paying attention to live TV.” He even
compares this rise in Internet campaigning to the emergence of television advertisements
in the 1960s. That is a lot of pressure and influence that is being put on this always
expanding medium and so far, the Internet is excelling the expectations of not only
candidates, but voters as well.
L a r s e n | 32
Appendix A
Table 1 Relationship between Age and Political News Source and 2008 Vote
Vote for Obama Vote for McCain
18-24 74.7%
(357)
25.3%
(121)
25-34 59.6%
(482)
40.4%
(327)
35-44 52.9%
(490)
47.1%
(436)
45-54 57.3%
(553)
42.7%
(412)
55-64 59.7%
(448)
40.3%
(302)
65+ 52.8%
(440)
47.2%
(394)
Internet as main
news source 55.9%
(386)
44.1%
(304)
Other main news
source
58.4%
(2401)
41.6%
(1710) *Note: (N) represents number of cases
Chi-square (age) = 75.843, Asymp. Sig. (2-sided) = .000
Lambda (age) = .000
Chi-square (Internet) = 1.854, Asymp. Sig. (2-sided) = .173
Lambda (Internet) = .000
Table 2a Relationship between Age, Political News Source and 2008 Vote for Obama
Television Newspaper Radio Magazines Internet
18-24 78.2%
(201)
83.7%
(41)
60%
(8)
69.4%
(100)
25-34 63.9%
(301)
56.5%
(26)
46.7%
(57)
57.9%
(84)
35-44 55.6%
(309)
62.8%
(27)
32.8%
(42)
100%
(5)
57.3%
(102)
45-54 61.4%
(430)
58.9%
(33)
38.7%
(24)
71.4%
(5)
44.3%
(58)
55-64 61.8%
(341)
62%
(49)
34.6%
(18)
81.8%
(9)
52%
(26)
65+ 55.5%
(350)
47.6%
(59)
51.4%
(18)
60%
(3)
32.1%
(9) *Note: (N) represents number of cases
Chi-square (18-24) = 6.967, Asymp. Sig. (2-sided) = .073
Lambda (18-24) = .000
Chi-square (total) = 70.060, Asymp. Sig. (2-sided) = .000
Lambda (total) = .041
L a r s e n | 33
Table 2b Relationship between 18-24 (age), Frequency and 2008 Vote
Frequency Vote for Obama Vote for McCain
Daily 70.6%
(226)
29.4%
(94)
Several times per week 75.6%
(65)
24.4%
(21)
Less often/Never 100%
(32)
0%
(0) *Note: (N) represents number of cases
Chi-square = 23.955, Asymp. Sig. (2-sided) = .000
Lambda = .002
Somer’s d = .001
Figure 1 Relationship between Age and Political News Source
L a r s e n | 34
Table 3 Obama share of the Vote by Student Status and Age
Age/Student Television Newspaper Radio Internet
18-24
Full-time 71.9%
(46)
100%
(6)
100%
(6) 63%
(46)
Part-time 67.2%
(41)
100%
(11)
100%
(12)
25-34
Full-time 81.4%
(35)
0%
(0)
53.8%
(7)
Part-time 62.1%
(41)
0%
(0)
69.2%
(18)
35-44
Full-time 53.8%
(7)
0%
(0)
58.3%
(7)
Part-time 91.9%
(34)
57.1%
(4)
62.5%
(5)
59.1%
(13)
45-54
Full-time 100%
(3)
Part-time 87.9%
(29)
100%
(4)
66.7%
(2)
55-64
Full-time 100%
(2)
Part-time 86.7%
(13)
100%
(2)
100%
(4) *Note: (N) represents number of cases
Chi-square (18-24 full-time) = 6.917, Asymp. Sig (2-sided) = .075
Lambda (18-24 full-time) = .000
Chi-square (18-24 part-time) = 9.898, Asymp. Sig. (2-sided) = .007
Lambda (18-24 part-time) = .000
Chi-square (total full-time) = 20.231, Asymp. Sig. (2-sided) = .000
Lambda (total full-time) = .095
Chi-square (total part-time) = 17.092, Asymp. Sig. (2-sided) = .001
Lambda (total part-time) = .058
L a r s e n | 35
Table 4 Obama share of the Vote by Social Network Use and Age
18-24 25-34 35-44 45-54 55-64 65+
SNS user 76%
(98)
46.5%
(58)
81.8%
(54)
59.5%
(22)
100%
(14)
100%
(5)
Not user 71.8%
(191)
74%
(225)
55.9%
(147)
59.8%
(79)
78.8%
(41)
18.2%
(2)
SNS post 80.9%
(144)
56.9%
(78)
73.7%
(70)
60.6%
(20)
84.2%
(16)
No post 63.6%
(110)
67.9%
(171)
54.4%
(99)
59.5%
(72)
83%
(39)
46.7%
(7) *Note: (N) represents number of cases
**Note: SNS stands for Social Networking Sites
Chi-square (18-24 SNS user) = .767, Asymp. Sig. (2-sided) = .381
Lambda (18-24 SNS user) = .000
Chi-square (total SNS user) = .002, Asymp. Sig. (2-sided) = .966
Lambda (total SNS user) = .000
Chi-square (18-24 SNS post) = 13.153, Asymp. Sig. (2-sided) = .000
Lambda (18-24 SNS post) = .000
Chi-square (total SNS post) = 8.224, Asymp. Sig. (2-sided) = .004
Lambda (total SNS post) = .000
Table 5 Logistic Regression between Age and Recoded Vote for Obama in 2008
Model estimate and model summary: Logged odds (vote for Obama in 2008) = a+b (age)
Model
estimates Coefficient Significance Odds Ratio
Percentage
change in odds
Constant .768
Age -.009 .000 .991 -.9%
Model
summary Value Significance
Change in -2
log likelihood 32.727 .000
Cox-Snell R-
square .007
Nagelkerke R-
square .009
L a r s e n | 36
Table 6 Logistic Regression Vote for Obama by Age and News Source
Model estimates and model summary: Logged odds (vote for Obama in 2008) = a + b1
(age) + b2 (Internet news source)
Model estimates Coefficient Significance Odds Ratio Percentage
change in odds
Constant .835
Age -.010 .000 .990 -1%
Internet news
source -.205 .016 .815 -18.5%
Model summary Value Significance
Change in -2 log
likelihood 38.524 .000
Cox-Snell R-
square .008
Nagelkerke R-
square .011
Pred. Prob: intnews_dum-vote02, age 18 = .61 or 61%
Pred. Prob. Intnews_dum-vote02, age 48 = .54 or 54%
L a r s e n | 37
Table 7 Logistic Regression Vote for Obama News Source and Internet Use against
Control Variables
Model
estimates Coefficient Significance Odds Ratio
Percentage
change in odds
Constant .125
Age .006 .324 1.006 .6%
Black non-
Hispanic 3.634 .000 37.870 3,687%
Student .309 .065 1.362 36.2%
2007 income -.140 .000 .870 -13%
High School
education .793 .009 2.210 121%
Some College
education .715 .016 2.043 104.3%
Beyond College
education 1.111 .000 3.038 203.8%
Internet news
source .183 .232 1.200 20%
SNS user -.231 .126 .794 -20.6%
Model
summary Value Significance
Change in -2
log likelihood 145.613 .000
Cox-Snell R-
square .115
Nagelkerke R-
square .158
L a r s e n | 38
References
Bachman, Ingrid, et. al. 2010. “News Platform Preference: Advancing the Effects of Age
and Media Consumption on Political Participation.” International Journal of
Internet and Science 5 (1): 34-47.
Cavanagh, Thomas E. 1981. “Changes in American Voter Turnout, 1964-1976.” Political
Science Quarterly 96 (1): 53-65.
File, Tom, and Sarah Crissey. 2010. “Voting and Registration in the Election of
November 2008.” U.S. Census Bureau. P20-562.
Flanigan, William H., and Nancy H. Zingale. 2006. “Chapter 2: Suffrage and Turnout.”
Political Behavior of the American Electorate. P35-60.
Highton, Benjamin, and Raymond E. Wolfinger. 2001. “The First Seven Years of the
Political Life Cycle.” American Journal of Political Science 45 (1): 202-209.
Holban Kirby, Emily, and Kei Kawashima-Ginsberg. 2009. “The Youth Vote in 2008.”
CIRCLE. August.
Holban Kirby, Emily, et. al. 2008. “The Youth Vote in 2008 Primaries and Caucuses.”
CIRCLE. June.
Hooghe, Marc, and Britt Wilkenfeld. 2008. “The Stability of Political Attitudes and
Behaviors Across Adolescence and Early Adulthood: A Comparison of Survey
Data on Adolescents and Young Adults in Eight Countries.” Journal of Youth
Adolescence 37: 153-167.
Hout, Michael, and David Knoke. 1975. “Change in Voter Turnout, 1952-1972.” The
Public Opinion Quarterly 39 (1): 52-68.
Levine, Peter, and Mark Hugo Lopez. 2002. “Youth Voter Turnout has Declined, By Any
Measure.” CIRCLE. June.
Lupia, Arthur, and Tasha S. Philpot. 2005. “Views from Inside the Net: How Websites
Affect Young Adults’ Political Interest.” The Journal of Politics 64 (4): 1122-
1142.
Maskert, Seth E. 2009. “Did Obama’s Ground Game Matter? The Influence of Local
Field Offices During the 2008 Presidential Election.” Public Opinion Quarterly
73 (5): 1023-1039.
Milner, Henry. 2010. The Internet Generation: Engaged Citizens or Political Dropouts.
Lebanon, NH: University Press of New England
L a r s e n | 39
Peters, Jeremy W. 2012. “As Viewing Habits Change, Political Ads Switch Screens.”
New York Times.
Romano, Andrew. 2012. “Yes We Can (Can’t We?)” Newsweek. January.
Smith, Aaron. 2008. “Post-Election Voter Engagement.” Pew Internet and American Life
Project P1-11.
Smith, Aaron. 2009. “The Internet’s Role in Campaign 2008.” Pew Internet and
American Life Project. P1-92.
Thee, Megan. 2007. “Polling Young Adults on a President’s Age.” New York Times-The
Caucus Blog.
Tolbert, Caroline J., and Ramona S. McNeal. 2003. “Unraveling the Effects of the
Internet on Political Participation?” Political Research Quarterly 56 (2):
175-185.
Von Drehle, David. 2008. “The Year of the Youth Vote.” TIME Magazine, January.
Walter, Ron. 2007. “Barack Obama and the Politics of Blackness.” Journal of Black
Studies 38 (1) “The Barack Obama Phenomenon”: 7-29.
Wall Street Journal. 2008. 3 November. Farnam, T.W., and Brad Hayes. “Democrats
Far Outspend Republicans on Field Operations, Stagg Expenditures.” New York
City.
“Youth Voter Mobilization Tactics.” 2007. The George Washington University Graduate
School of Political Management. CIRCLE.