Kurita Wherever Business Needs Water€¦ · Kurita Water Industries Ltd. Annual Report 2011 01...
58
Kurita Water Industries Ltd. ANNUAL REPORT 2011 ANNUAL REPORT 2011 For the year ended March 31, 2011 Kurita – Wherever Business Needs Water
Transcript of Kurita Wherever Business Needs Water€¦ · Kurita Water Industries Ltd. Annual Report 2011 01...

URL: http://www.kurita.co.jp/english/
4-7, Nishi-Shinjuku 3-chome, Shinjuku-ku, Tokyo 160-8383, JapanTel: 81 (3) 3347-3111
This report was printed on FSC-approved paper using vegetable oil ink.Printed in Japan
Kurita W
ater Industries Ltd. AN
NU
AL R
EPORT
2011
ANNUAL REPORT 2011For the year ended March 31, 2011
Kurita – Wherever Business Needs Water

Cautionary Statement with Respect to Forward-Looking StatementsThis annual report contains forward-looking statements regarding forecasts, plans, strategies and business performance in the future. These forward-looking statements represent judgments made by the Company based on information currently available to it and involve a variety of risks and uncertainties.Actual results may be materially different from these forward-looking statements. Such risks and uncertainties include (but are not limited to) changes in the economic environment, business conditions, market, demand and currency exchange rates.
cover 2 PROFILE
01 CONSOLIDATED FINANCIAL HIGHLIGHTS
02 Water Solutions for Industry04 BUSINESS REVIEW
05 BUSINESS HIGHLIGHTS
06 TO ALL OUR STAKEHOLDERS
07 Feature: Kurita’s New President Talks about Kurita’s Strategy for Growth 09 Leading the Industry in Comprehensive Solutions
11 Stepping up the Global Expansion of the Kurita Group
13 RESEARCH AND DEVELOPMENT
14 SUSTAINABLE MANAGEMENT FRAMEWORK
14 Corporate Governance
17 Environmental Improvement Activities
19 BOARD OF DIRECTORS AND CORPORATE AUDITORS
PROFILE
CONTENTS
Guided by its corporate philosophy, “study the properties of water, master
them, and we will create an environment in which nature and man are in
harmony,” Kurita Water Industries Ltd. is a leader in the industrial water field.
Kurita provides quality products and high-value-added outsourcing and
maintenance services to customers in a wide range of industries.
Since its establishment in 1949, Kurita has accumulated a high level of
technical expertise and know-how. Today, Kurita leverages these assets in a
unique business portfolio that includes both chemicals and facilities to realize
its corporate vision of becoming an advanced water and environmental
management company. As our customers and society wrestle with improving
productivity and reducing environmental impact, we are working to help
create a sustainable society by recycling the limited resource that is water
and proposing comprehensive water treatment solutions.
WATER TREATMENT CHEMICALS
WATER TREATMENT FACILITIES
Distribution of Shares
Stock Exchange Listings First Section of the Tokyo Stock ExchangeFirst Section of the Osaka Securities Exchange
Common Stock Authorized: 531,000,000 sharesIssued: 132,800,256 shares(Stock trading unit: 100 shares)
Number of Shareholders 36,089
Independent Auditor Grant Thornton Taiyo ASGAkasaka DS Bldg. 9F, 8-5-26, Akasaka, Minato-ku, Tokyo 107-0052, Japan
Transfer Agent The Chuo Mitsui Trust and Banking Co., Ltd.33-1, Shiba 3-chome, Minato-ku, Tokyo 105-8574, Japan
Main Shareholders
Shareholdings (Number of shares)
Percentage of total shares issued (%)
ITOCHU Corporation 7,448,000 5.60Nippon Life Insurance Company 6,644,283 5.00Japan Trustee Services Bank, Ltd. (Trust Account) 6,264,500 4.71Kurita Water Industries Ltd. 6,139,744 4.62Pictet and Cie (Europe) S.A. 3,770,100 2.83Tokio Marine & Nichido Fire Insurance Co., Ltd. 3,472,626 2.61The Bank of Tokyo-Mitsubishi UFJ, Ltd. 2,936,131 2.21NT RE GOVT OF SPORE INVT CORP P. LTD. 2,823,190 2.12Mizuho Trust & Banking Co., Ltd.Retirement Benefit Trust ITOCHU Corporation Account Retrustee Trust & Custody Services Banking Co., Ltd.
2,820,000 2.12
The Master Trust Bank of Japan, Ltd. (Trust Account) 2,767,100 2.08
Stock price (Yen) Trading volume (Hundreds of shares)
Shareholdings (Number of shares)
Percentage of total shares issued (%)
2,000 0.0%
n 40,584,720 30.6%
n 1,210,600 0.9%
n 18,368,313 13.8%
n 49,263,880 37.1%
n 17,230,999 13.0%
n 6,139,744 4.6%
Total 132,800,256 100.0%
INVESTOR INFORMATIONAs of March 31, 2011
Treasury Stock
Individuals
ForeignOwned
Government and Municipalities
Financial Institutions
Securities Firms
Other Domestic Firms
0
1,000
2,000
3,000
4,000
200,000
400,000
600,000
800,000
June ’11Jan. ’11June ’10Jan. ’10June ’09Jan. ’09
Stock Price Range and Trading Volume (Tokyo Stock Exchange)
55Kurita Water Industries Ltd. Annual Report 2011

01Kurita Water Industries Ltd. Annual Report 2011
Kurita FACT BOOK 2011
Kurita’s Fact Book 2011 provides a wide range
of long-term, historical data, including financial
indicators and quantitative management data.
http://www.kurita.jp/pdf/factbook_2011.pdf
20 SIX-YEAR FINANCIAL SUMMARY
21 MANAGEMENT’S DISCUSSION AND ANALYSIS
32 CONSOLIDATED BALANCE SHEETS
34 CONSOLIDATED STATEMENTS OF INCOME AND CONSOLIDATED STATEMENTS OF COMPREHENSIVE INCOME
35 CONSOLIDATED STATEMENTS OF CHANGES IN NET ASSETS
36 CONSOLIDATED STATEMENTS OF CASH FLOWS
37 NOTES TO CONSOLIDATED FINANCIAL STATEMENTS
53 REPORT OF INDEPENDENT CERTIFIED PUBLIC ACCOUNTANTS
54 CORPORATE DATA
55 INVESTOR INFORMATION
CONSOLIDATED FINANCIAL HIGHLIGHTSKurita Water Industries Ltd. and Consolidated SubsidiariesYears ended March 31
Millions of yen
Thousands of U.S. dollars (Note 1)
2011 2010 2009 2011
For the year:
Net sales ¥ 181,234 ¥ 178,520 ¥ 199,706 $2,183,550
Water Treatment Chemicals 56,735 53,743 58,331 683,558
Water Treatment Facilities 124,499 124,777 141,374 1,499,991
Operating income 27,131 26,358 27,935 326,889
Income before income taxes and minority interests 27,844 28,178 26,103 335,470
Net income 17,138 17,288 16,299 206,483
At year-end:
Total assets 253,298 251,620 245,406 3,051,790
Equity (Note 2) 198,042 192,588 177,291 2,386,059
%
Ratios:
Return on equity (ROE) (Note 3) 8.8 9.3 9.4
Return on assets (ROA) (Note 3) 6.8 7.0 6.8
Equity ratio 78.2 76.5 72.2
Yen U.S. dollars
Per share of common stock (Note 4):
Net income ¥ 134.02 ¥ 134.38 ¥ 126.69 $ 1.61
Cash dividends applicable to the year 38.00 36.00 34.00 0.46
Equity 1,563.57 1,496.98 1,378.04 18.84
Notes: 1. The U.S. dollar amounts are given solely for convenience at the rate of ¥83 to US$1, the prevailing rate on the Tokyo Foreign Exchange Market on March 31, 2011.
2. Equity represents net assets less minority interests. 3. ROE = Net income ÷ Equity (Average) ×100
ROA = Net income ÷ Total assets (Average) ×100 4. Net income and cash dividends per share are calculated using the average number of shares for the year under review. Calculation of equity per
share is based on the number of shares at year-end (excluding treasury stock).
02 Kurita Water Industries Ltd. Annual Report 2011
WATER TREATMENT FACILITIESWATER TREATMENT CHEMICALS
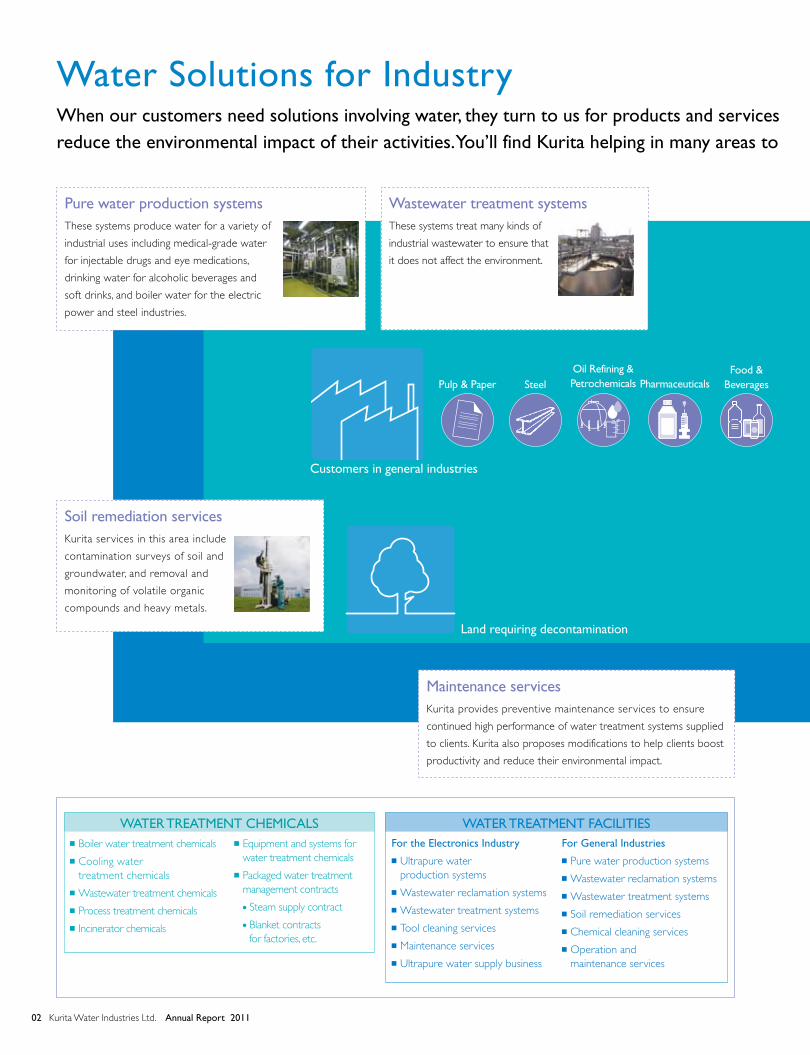
Water Solutions for IndustryWhen our customers need solutions involving water, they turn to us for products and services that boost their productivity and reduce the environmental impact of their activities. You’ll find Kurita helping in many areas to realize a sustainable society.
WATER TREATMENT FACILITIES
Pure water production systemsThese systems produce water for a variety of
industrial uses including medical-grade water
for injectable drugs and eye medications,
drinking water for alcoholic beverages and
soft drinks, and boiler water for the electric
power and steel industries.
Soil remediation servicesKurita services in this area include
contamination surveys of soil and
groundwater, and removal and
monitoring of volatile organic
compounds and heavy metals.
Wastewater treatment systemsThese systems treat many kinds of
industrial wastewater to ensure that
it does not affect the environment.
Pulp & Paper Steel Pharmaceuticals
Land requiring decontamination
Customers in general industries
Maintenance servicesKurita provides preventive maintenance services to ensure
continued high performance of water treatment systems supplied
to clients. Kurita also proposes modifications to help clients boost
productivity and reduce their environmental impact.
For the Electronics IndustrynUltrapure water production systems
nWastewater reclamation systems
nWastewater treatment systems
nTool cleaning services
nMaintenance services
nUltrapure water supply business
nBoiler water treatment chemicals
nCooling water treatment chemicals
nWastewater treatment chemicals
nProcess treatment chemicals
nIncinerator chemicals
nEquipment and systems for water treatment chemicals
nPackaged water treatment management contracts
l Steam supply contract
l Blanket contracts for factories, etc.
For General IndustriesnPure water production systems
nWastewater reclamation systems
nWastewater treatment systems
nSoil remediation services
nChemical cleaning services
nOperation and maintenance services
Food &Beverages
Oil Refining &Petrochemicals
03Kurita Water Industries Ltd. Annual Report 2011
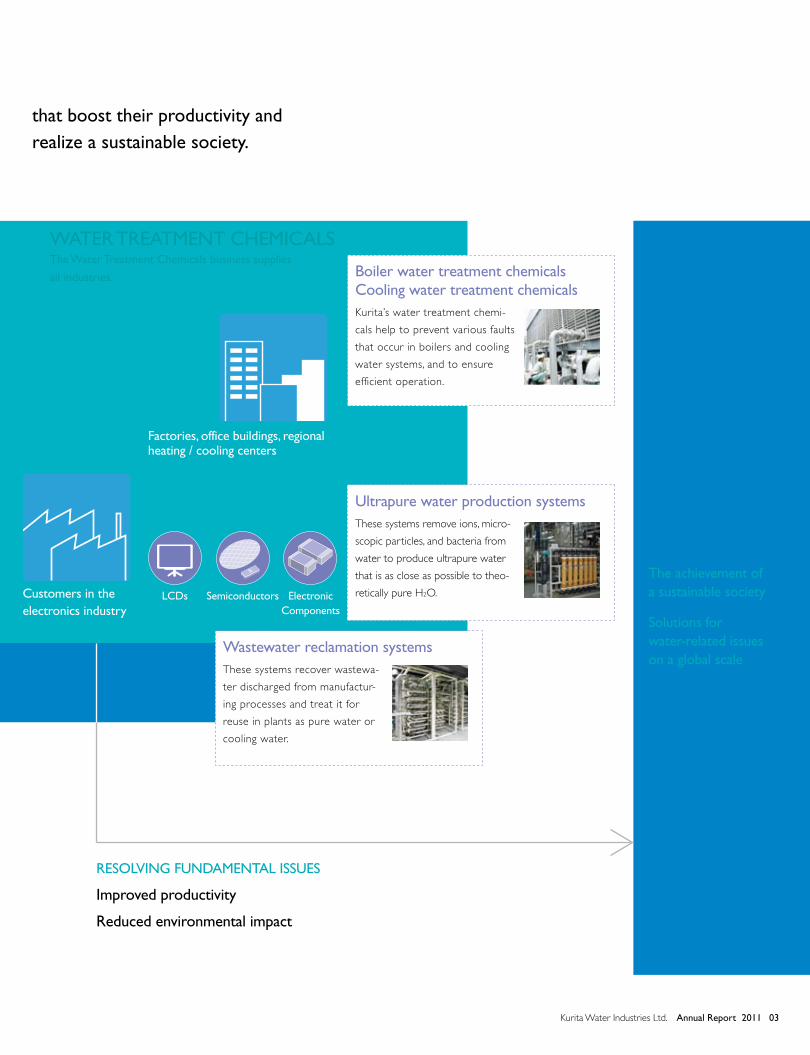
Water Solutions for IndustryWhen our customers need solutions involving water, they turn to us for products and services that boost their productivity and reduce the environmental impact of their activities. You’ll find Kurita helping in many areas to realize a sustainable society.
WATER TREATMENT CHEMICALSThe Water Treatment Chemicals business supplies
all industries.
SOCIETY
The achievement of a sustainable society
Solutions for water-related issues on a global scale
Boiler water treatment chemicalsCooling water treatment chemicalsKurita’s water treatment chemi-
cals help to prevent various faults
that occur in boilers and cooling
water systems, and to ensure
efficient operation.
Wastewater reclamation systemsThese systems recover wastewa-
ter discharged from manufactur-
ing processes and treat it for
reuse in plants as pure water or
cooling water.
Factories, office buildings, regional heating / cooling centers
Customers in the electronics industry
RESOLVING FUNDAMENTAL ISSUES
Improved productivity
Reduced environmental impact
SemiconductorsLCDs Electronic Components
Ultrapure water production systemsThese systems remove ions, micro-
scopic particles, and bacteria from
water to produce ultrapure water
that is as close as possible to theo-
retically pure H2O.

04 Kurita Water Industries Ltd. Annual Report 2011
BUSINESS REVIEW Segment Highlights
WATER TREATMENT CHEMICALS
In the fiscal year ended March 31, 2011, capacity
utilization improvements at customers’ plants spurred
an increase in domestic sales of mainstay products,
namely, boiler water treatment chemicals, cooling
water treatment chemicals, and wastewater treatment
chemicals. Overseas, performance improved at most
Kurita Group companies as production in various
industries recovered in Asia and Brazil. As a result of
these higher sales, segment operating income grew by
23.5% year on year. Together with an improved prod-
uct mix, the segment operating margin rose from
15.2% in the previous year to 17.8%.
WATER TREATMENT FACILITIES
Orders for the fiscal year ended March 31, 2011
increased 2.8% as a whole from the previous year.
Higher orders for ultrapure water production systems
overseas and maintenance services for the electronics
industry compensated for lower orders for water treat-
ment systems for general industries in Japan. However,
segment sales declined slightly year on year. While
Kurita recorded growth in sales to the electronics
industry both in Japan and overseas, overall sales fell
due to a lull of large projects for the steel industry in
Japan. Operating income fell 6.3% year on year as the
impact of lower sales of systems for general industrial
use outweighed profitability improvements in other
businesses.
See p. 21 Management’s Discussion and Analysis
Orders(Millions of yen)
2007 2008 2009 2010 2011
56,560 59,029 58,47053,370 56,714
Sales(Millions of yen)
2007 2008 2009 2010 2011
56,667 58,646 58,33153,743 56,735
Operating Income(Millions of yen)
2007 2008 2009 2010 2011
8,806 9,5258,417 8,177
10,099
Orders(Millions of yen)
2007 2008 2009 2010 2011
135,969149,659
136,595121,791 125,237
Sales(Millions of yen)
2007 2008 2009 2010 2011
140,479 146,228 141,374124,777 124,499
Operating Income(Millions of yen)
2007 2008 2009 2010 2011
15,471
20,939 19,517 18,181 17,032
(Years ended March 31)

05Kurita Water Industries Ltd. Annual Report 2011
Successful Demonstration of Ashing-less ProcessDuring the past fiscal year, Kurita demonstrated
that its electrolyzed sulfuric acid generator, Green
Sulfaceed KD™, enables manufacturers to eliminate
the ashing process used when removing resist
layers in the semiconductor manufacturing process.
Conventionally, this is a necessary pre-process step.
This development allows semiconductor manufac-
turers to cut their resist removal processing by as
much as 50% and reduce the volume of chemicals
used. This is one example of how Kurita continues
to propose solutions to
semiconductor manufac-
turers to meet their
strong demand for
increased productivity
and more environmentally
friendly processes.
New Electro-Osmosis Dehydrator LaunchedKurita has launched a new electro-osmosis dehydra-
tor, Hydropress™ E, that enables users to reduce
sludge volume and save energy. The system uses tech-
nology that makes the sludge dewatering process
more efficient by using internally mounted electrodes
to apply a voltage to sludge that makes it easier for
the water molecules to be separated. Whereas con-
ventional mechanical dewatering processes are only
able to reduce the water content of sludge to around
80%, Kurita’s new technology can reduce it to up to
60%, enabling the total volume of sludge to be com-
pacted by up to 50%. Since the new technology also
obviates the need for drying sludge, the process emits
less than one-third of the
CO2 that conventional
mechanical processes emit.
Kurita will aggressively
market Hydropress™ E to
customers worldwide who
need to reduce sludge.Saving Energy in CoolingKurita has developed a new “hybrid” cooling water
treatment technology that delivers significant energy
savings by preventing sliming and scaling of cooling
systems installed in factories and office buildings. The
new technology combines three elements:
1) Cooling water treatment chemicals that are highly
effective at preventing scaling and sliming,
2) Technology to automatically control the concentra-
tion of the chemicals in the cooling water, and
3) Technology to monitor sliming and scaling, and
thermal efficiency of cooling systems.
Kurita will pro-
mote the use of this
technology to cus-
tomers who are
looking to reduce
CO2 and utility costs.
Contribution of the Ultrapure Water Supply and Maintenance ServicesIn its ultrapure water supply business, Kurita contin-
ued in the fiscal year under review to supply cus-
tomers with the required quality and volume of
ultrapure water at one site overseas and six sites in
Japan. The business also contributed on the earnings
front to Kurita achieving a robust earnings structure
able to weather economic fluctuations. The mainte-
nance services in
Japan also helped
stabilize earnings,
recovering as cus-
tomers’ capacity
utilization improved.
BUSINESS HIGHLIGHTS
Green Sulfaceed KD™
Hydropress™ E

06 Kurita Water Industries Ltd. Annual Report 2011
TO ALL OUR STAKEHOLDERS
The Kurita Group pursues new functions and value for water. We seek to create a better society through water management.
I took up my post as president of Kurita Water Industries Ltd. on June 29, 2011, inheriting the busi-
ness base created by my predecessors. I will work diligently to retain the trust and meet the
expectations of our shareholders and other stakeholders. In doing so I will return to the Group’s
corporate philosophy: “study the properties of water, master them, and we will create an environ-
ment in which nature and man are in harmony.”
The Great East Japan Earthquake that struck in March 2011 has had a serious impact on the
Japanese economy. I offer my sincere condolences to the many people who have suffered in the
disaster, and assure you that the Kurita Group is working together to help affected areas recover
as quickly as possible.
Water is a limited resource for all of humanity. Contamination and shortages are affecting us
on a global scale. The Kurita Group is dedicated to solving these issues in industrial and social con-
texts through water management—a vital mission in today’s environment. In this way, all Kurita
Group employees are working together toward the sustainable progress of society.
July 2011
Toshiyuki Nakai
President and Representative Director
07Kurita Water Industries Ltd. Annual Report 2011
Feature: Kurita’s New President Talks about Kurita’s Strategy for Growth
In a rapidly changing world, the Kurita Group has set its sights on becoming an advanced water and environmental management company. To this end, we are continuing to evolve and expand our products and services on a global scale.
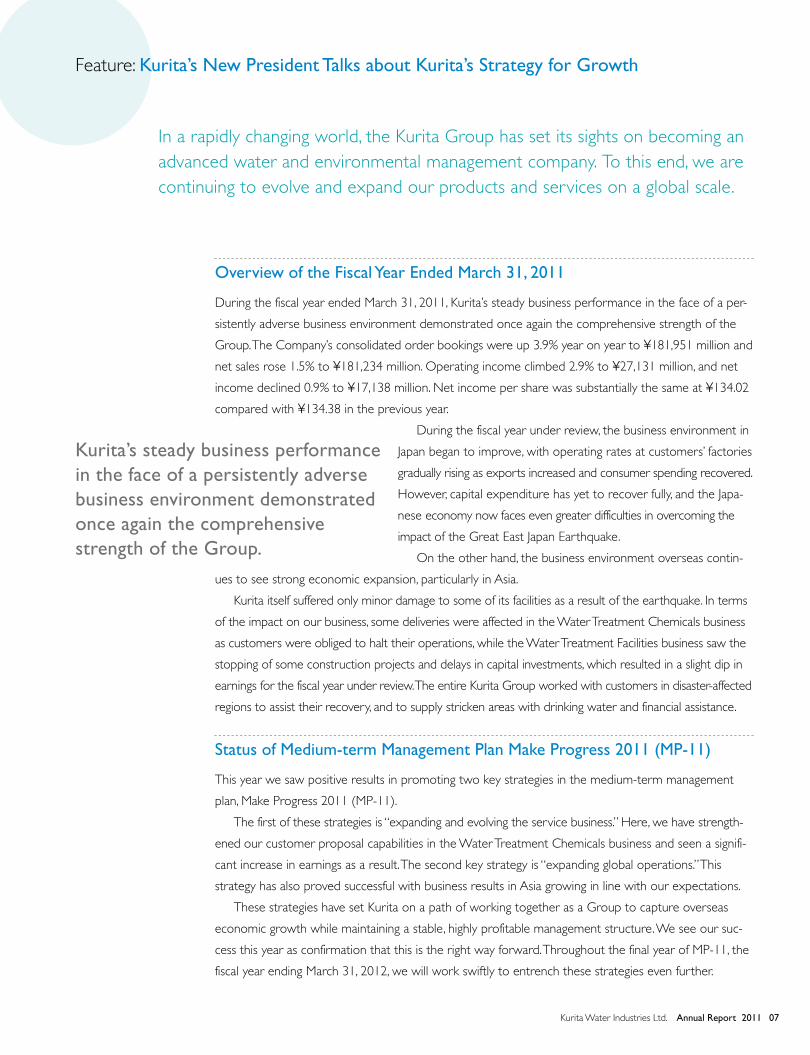
Overview of the Fiscal Year Ended March 31, 2011
During the fiscal year ended March 31, 2011, Kurita’s steady business performance in the face of a per-
sistently adverse business environment demonstrated once again the comprehensive strength of the
Group. The Company’s consolidated order bookings were up 3.9% year on year to ¥181,951 million and
net sales rose 1.5% to ¥181,234 million. Operating income climbed 2.9% to ¥27,131 million, and net
income declined 0.9% to ¥17,138 million. Net income per share was substantially the same at ¥134.02
compared with ¥134.38 in the previous year.
During the fiscal year under review, the business environment in
Japan began to improve, with operating rates at customers’ factories
gradually rising as exports increased and consumer spending recovered.
However, capital expenditure has yet to recover fully, and the Japa-
nese economy now faces even greater difficulties in overcoming the
impact of the Great East Japan Earthquake.
On the other hand, the business environment overseas contin-
ues to see strong economic expansion, particularly in Asia.
Kurita itself suffered only minor damage to some of its facilities as a result of the earthquake. In terms
of the impact on our business, some deliveries were affected in the Water Treatment Chemicals business
as customers were obliged to halt their operations, while the Water Treatment Facilities business saw the
stopping of some construction projects and delays in capital investments, which resulted in a slight dip in
earnings for the fiscal year under review. The entire Kurita Group worked with customers in disaster-affected
regions to assist their recovery, and to supply stricken areas with drinking water and financial assistance.
Status of Medium-term Management Plan Make Progress 2011 (MP-11)
This year we saw positive results in promoting two key strategies in the medium-term management
plan, Make Progress 2011 (MP-11).
The first of these strategies is “expanding and evolving the service business.” Here, we have strength-
ened our customer proposal capabilities in the Water Treatment Chemicals business and seen a signifi-
cant increase in earnings as a result. The second key strategy is “expanding global operations.” This
strategy has also proved successful with business results in Asia growing in line with our expectations.
These strategies have set Kurita on a path of working together as a Group to capture overseas
economic growth while maintaining a stable, highly profitable management structure. We see our suc-
cess this year as confirmation that this is the right way forward. Throughout the final year of MP-11, the
fiscal year ending March 31, 2012, we will work swiftly to entrench these strategies even further.
Kurita’s steady business performance in the face of a persistently adverse business environment demonstrated once again the comprehensive strength of the Group.

08 Kurita Water Industries Ltd. Annual Report 2011
Feature: Kurita’s New President Talks about Kurita’s Strategy for Growth
Our Vision–Our Mission
The Kurita Group is evolving its service business with the
goal of using water management to help customers to
solve key challenges such as improving productivity and
reducing environmental impact. These efforts are starting
to bear fruit—we are already better at proposing com-
prehensive solutions for water and the environment.
These proposals seamlessly integrate elements from our
Water Treatment Chemicals, Water Treatment Facilities, and maintenance service businesses.
Moreover, Kurita seeks to evolve water management to the next level using cutting-edge products,
technologies and services. Our goal is to realize advanced management for providing customers with
the required quality and volume of water, when and where they
need it. One area where we are already achieving this is in our
ultrapure water supply business. This business is helping to build
on our already steady earnings base, and has become a support-
ing pillar for the management of the entire group.
However, the ultrapure water supply business is just the start.
We aim to build on this success in all our businesses. This represents the full realization of our corporate
vision of becoming an advanced water and environment management company, and is the real purpose
behind our MP-11 strategy of evolving and expanding the service business. I believe it is a strategy that
will maximize the inherent strengths of the Kurita Group’s business portfolio.
Our goal is to realize advanced management for providing customers with the required quality and volume of water, when and where they need it.
Service Business Revenue(Billions of yen)
Service Business Revenue
Net Sales
2009 2010 2011
199.7181.2
98.9
58.356.7
96.1
42.5
178.5
98.4
53.7
26.4 28.4
n Water Treatment Chemicalsn Water Treatment Facilities
(service)n Water Treatment Facilities
(hardware)
(Years ended March 31)
09Kurita Water Industries Ltd. Annual Report 2011
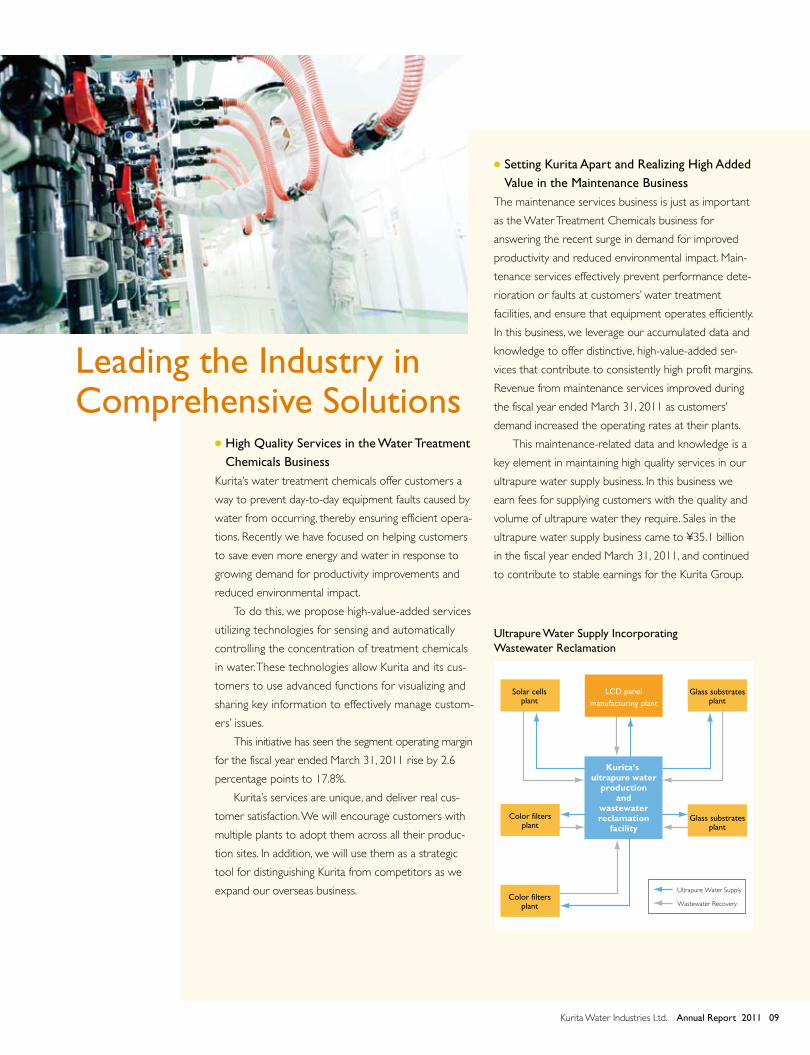
l High Quality Services in the Water Treatment Chemicals Business
Kurita’s water treatment chemicals offer customers a
way to prevent day-to-day equipment faults caused by
water from occurring, thereby ensuring efficient opera-
tions. Recently we have focused on helping customers
to save even more energy and water in response to
growing demand for productivity improvements and
reduced environmental impact.
To do this, we propose high-value-added services
utilizing technologies for sensing and automatically
controlling the concentration of treatment chemicals
in water. These technologies allow Kurita and its cus-
tomers to use advanced functions for visualizing and
sharing key information to effectively manage custom-
ers’ issues.
This initiative has seen the segment operating margin
for the fiscal year ended March 31, 2011 rise by 2.6
percentage points to 17.8%.
Kurita’s services are unique, and deliver real cus-
tomer satisfaction. We will encourage customers with
multiple plants to adopt them across all their produc-
tion sites. In addition, we will use them as a strategic
tool for distinguishing Kurita from competitors as we
expand our overseas business.
l Setting Kurita Apart and Realizing High Added Value in the Maintenance Business
The maintenance services business is just as important
as the Water Treatment Chemicals business for
answering the recent surge in demand for improved
productivity and reduced environmental impact. Main-
tenance services effectively prevent performance dete-
rioration or faults at customers’ water treatment
facilities, and ensure that equipment operates efficiently.
In this business, we leverage our accumulated data and
knowledge to offer distinctive, high-value-added ser-
vices that contribute to consistently high profit margins.
Revenue from maintenance services improved during
the fiscal year ended March 31, 2011 as customers’
demand increased the operating rates at their plants.
This maintenance-related data and knowledge is a
key element in maintaining high quality services in our
ultrapure water supply business. In this business we
earn fees for supplying customers with the quality and
volume of ultrapure water they require. Sales in the
ultrapure water supply business came to ¥35.1 billion
in the fiscal year ended March 31, 2011, and continued
to contribute to stable earnings for the Kurita Group.
Leading the Industry in Comprehensive Solutions
Solar cellsplant
Color filtersplant
Glass substratesplant
Glass substratesplant
LCD panelmanufacturing plant
Color filtersplant
Kurita’s ultrapure water
productionand
wastewaterreclamation
facility
Ultrapure Water Supply
Wastewater Recovery
Ultrapure Water Supply Incorporating Wastewater Reclamation

10 Kurita Water Industries Ltd. Annual Report 2011
Global Expansion Driven by Comprehensive Strength
Overseas business expansion will play a critical part in
Kurita’s growth, and as such, we will tackle this task with
even greater urgency. Most of our expansion has been in
regions where high economic growth is expected, such as
Asia and Brazil. However, the contribution to consolidated
net sales from our overseas businesses was still only 15%
in the fiscal year ended March 31, 2011. High economic
growth is of course a powerful accelerator for our Water Treatment Chemicals business, which serves
all types of industry. Furthermore, in emerging countries we can also expect industrial development to
boost the need for water treatment systems for recycling water
since it is a limited resource. Kurita can provide sophisticated
solutions to meet these needs, leveraging its outstanding tech-
nologies and rich knowledge in wastewater reclamation and
recycling. In China especially, remarkable growth and increasing
sophistication of industry have led to an emerging demand for
improved productivity and reduced environmental impact. This situation presents the Kurita Group with
an important opportunity to harness the comprehensive strength that stems from its chemicals, facili-
ties, and maintenance businesses to supply optimal solutions to customers, building partnerships with
them as they grow.
In emerging countries we can also expect industrial development to boost the need for water treatment systems for recycling water.
Feature: Kurita’s New President Talks about Kurita’s Strategy for Growth
Overseas Businesses
Sales by Region(Billions of yen)
Sales by Overseas Business Segment(Billions of yen)
2009 2010 2011
26.0 26.4
1.62.9 3.1
1.3
20.1
19.0
1.42.6
13.419.2
1.4
1.6
2.8
2009 2010 2011
26.0 26.4
11.0
14.9 15.5
10.9
19.0
9.4
9.6
n Othern Europen North American Asia
n Water Treatment Facilities
n Water Treatment Chemicals
(Years ended March 31)(Years ended March 31)
11Kurita Water Industries Ltd. Annual Report 2011
Stepping up the Global Expansion of the Kurita Group
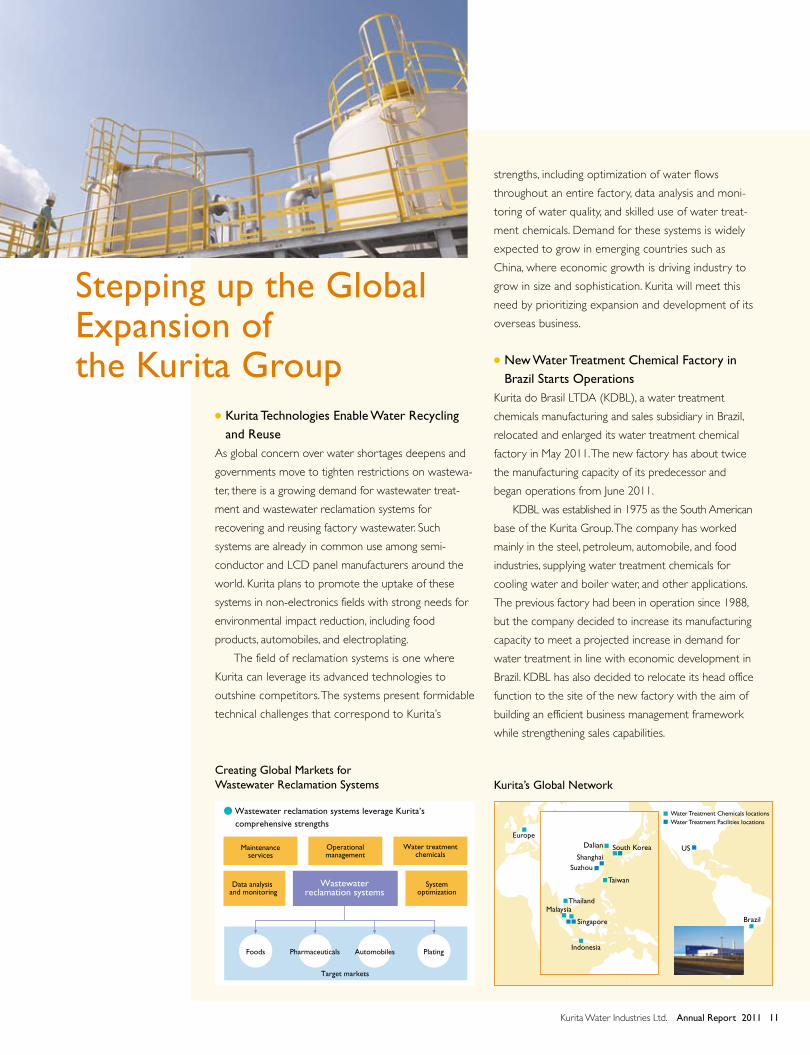
l Kurita Technologies Enable Water Recycling and Reuse
As global concern over water shortages deepens and
governments move to tighten restrictions on wastewa-
ter, there is a growing demand for wastewater treat-
ment and wastewater reclamation systems for
recovering and reusing factory wastewater. Such
systems are already in common use among semi-
conductor and LCD panel manufacturers around the
world. Kurita plans to promote the uptake of these
systems in non-electronics fields with strong needs for
environmental impact reduction, including food
products, automobiles, and electroplating.
The field of reclamation systems is one where
Kurita can leverage its advanced technologies to
outshine competitors. The systems present formidable
technical challenges that correspond to Kurita’s
strengths, including optimization of water flows
throughout an entire factory, data analysis and moni-
toring of water quality, and skilled use of water treat-
ment chemicals. Demand for these systems is widely
expected to grow in emerging countries such as
China, where economic growth is driving industry to
grow in size and sophistication. Kurita will meet this
need by prioritizing expansion and development of its
overseas business.
l New Water Treatment Chemical Factory in Brazil Starts Operations
Kurita do Brasil LTDA (KDBL), a water treatment
chemicals manufacturing and sales subsidiary in Brazil,
relocated and enlarged its water treatment chemical
factory in May 2011. The new factory has about twice
the manufacturing capacity of its predecessor and
began operations from June 2011.
KDBL was established in 1975 as the South American
base of the Kurita Group. The company has worked
mainly in the steel, petroleum, automobile, and food
industries, supplying water treatment chemicals for
cooling water and boiler water, and other applications.
The previous factory had been in operation since 1988,
but the company decided to increase its manufacturing
capacity to meet a projected increase in demand for
water treatment in line with economic development in
Brazil. KDBL has also decided to relocate its head office
function to the site of the new factory with the aim of
building an efficient business management framework
while strengthening sales capabilities.
Creating Global Markets for Wastewater Reclamation Systems
Systemoptimization
Water treatmentchemicals
Wastewaterreclamation systems
● Wastewater reclamation systems leverage Kurita’s comprehensive strengths
Data analysis and monitoring
Operationalmanagement
Foods Pharmaceuticals Automobiles
Target markets
Plating
Maintenanceservices
Kurita’s Global Network
Europe
US
Brazil
Dalian
Suzhou
Taiwan
Singapore
Shanghai
Malaysia Thailand
Indonesia
South Korea
Water Treatment Chemicals locationsWater Treatment Facilities locations

Feature: Kurita’s New President Talks about Kurita’s Strategy for Growth
12 Kurita Water Industries Ltd. Annual Report 2011
Maximizing Shareholder Value
In making returns to shareholders, our basic policy is to
continue to deliver a stable dividend, while aiming to
return profits to shareholders through dividend increases
after considering business performance and reinvestment
needs. Based on this policy, we have increased the annual
dividend for the fiscal year ended March 31, 2011 by ¥2
from the previous year to ¥38. This makes the seventh consecutive year of increased dividends. Also in
the fiscal year under review we conducted a share buyback, acquiring
1,988,400 shares of our own stock for ¥4,776 million to improve the
capital efficiency and allow for a flexible capital policy. Going forward, we
will consider various ways to return profits to shareholders, taking into
account our capital funding requirements and cash on hand. In this way
we hope to meet shareholders’ expectations and uphold their trust.
Our first priority for use of cash is to allocate it to investments in growth sectors. We aim to set
aside sufficient funds to ensure that we can respond quickly to business opportunities including alliances
and M&As, as well as new projects in the capital-intensive ultrapure water supply business.
We will also consider using some funds for investments to reduce risk and further stabilize manage-
ment. This follows a reexamination of our future risk management that was prompted by the recent
earthquake, although Kurita fortunately sustained only minor damage.
I would like to thank all of our shareholders, investors, and other stakeholders for understanding
our policies and ask for your continued support.
Our first priority for use of cash is to allocate it to investments in growth sectors.
2009 2010 2011
34.038.036.0
Dividends per Share(Yen)
(Years ended March 31)

13Kurita Water Industries Ltd. Annual Report 2011
RESEARCH AND DEVELOPMENT
The Kurita Group’s research and development activi-
ties are carried out primarily by the Research and
Development Division of Kurita Water Industries Ltd.
The Kurita Group has a combined R&D staff of
approximately 150 personnel, equivalent to 3.3% of
the Group’s total workforce. In the fiscal year ended
March 31, 2011, R&D expenses totaled ¥4,225
million, or 2.3% of net sales.
R&D activities cover a wide range of fields.
These include technology to strengthen the core
areas of business such as boiler and cooling water
treatment, ultrapure water production, water and
wastewater treatment, wastewater reclamation, and
soil and groundwater remediation. Other R&D
activities focus on basic areas such as analysis tech-
nologies, IT controls, and technologies for monitor-
ing water treatment effectiveness. Kurita is also
exploring new functions of water for the develop-
ment of entirely new businesses.
Research activities in the business segments are
explained below.
Water Treatment ChemicalsIn the Water Treatment Chemicals segment, Kurita is
developing chemicals that contribute to energy
efficiency, environmental impact reduction, and pro-
ductivity enhancement at customer sites. Research is
focused on enhancing the functions of water treat-
ment chemicals and developing systems to monitor
water treatment effectiveness.
The Water Treatment Chemicals segment’s R&D
expenses in the fiscal year totaled ¥1,285 million.
• Kurita developed chemicals that prevent mem-
brane fouling in reverse osmosis (RO) systems
used for ultrapure water production and the
wastewater reclamation process.
• Kurita developed technology to significantly
reduce the amount of treatment chemicals
needed to neutralize acidic gases released by
garbage incinerators. The technology automatically
controls the amount of chemicals injected in
response to concentration of acidic gases.
• Kurita developed chemicals to prevent corrosion
and scaling in cooling tower heat exchangers. The
chemical meets Chinese environmental regulations.
• Kurita developed chemicals for boiler water treat-
ment made from ingredients that are environmen-
tally friendly and not controlled under the
Pollutant Release and Transfer Register (PRTR) law.
Water Treatment FacilitiesIn the Water Treatment Facilities segment, Kurita is
improving the quality of ultrapure water used by the
electronics industry, and developing wastewater
treatment and soil remediation technologies in
anticipation of future environmental regulations.
Kurita is also developing technologies conducive to
a closed-loop economy, including those for waste-
water reclamation and reuse, and technologies to
reduce society’s environmental footprint, including
sludge volume reduction systems.
The Water Treatment Facilities segment’s R&D
expenses in the fiscal year totaled ¥2,940 million.
• Kurita developed an energy-efficient biotreatment
system featuring an anaerobic bacteria immobiliza-
tion carrier. Compared to conventional anaerobic
systems, this system can be used on lower organic
concentration wastewater.
• Kurita developed a low-cost pre-treatment system
for industrial water which efficiently removes
suspended matter and organic substances from
polluted raw water.
• Kurita developed a two-bed single-tower type
ion-exchange system which reduces running costs
by significantly lowering the amount of chemicals
used to regenerate ion-exchange resins.
2009 2010 2011
4,363 4,2253,990
R&D Expenses(Millions of yen)
(Years ended March 31)

14 Kurita Water Industries Ltd. Annual Report 2011
SUSTAINABLE MANAGEMENT FRAMEWORK
Corporate GovernanceBasic PolicyKurita and Kurita Group companies aim to contribute
broadly to society and meet the expectations of their
stakeholders, including shareholders and investors.
The Group does this through corporate activities in
the fields of water and environment in accordance
with the Kurita corporate philosophy, “study the
properties of water, master them, and we will create
an environment in which nature and man are in har-
mony.” To realize these aims, the Group has adopted
a basic corporate governance policy with two main
components. The first is establishing management
systems that improve management transparency and
efficiency and sustainably increase corporate value
over the long term. The second is rigorous oversight
of management and operational execution.
Corporate Governance StructureKurita’s Board of Directors currently comprises 12
directors, including one external director. The Board
of Directors’ meetings set management policy, make
management decisions, and oversee directors’ exe-
cution of their duties. The Board of Directors’ meet-
ings are chaired by the president and held monthly
on a regularly scheduled basis and whenever else
necessary on an ad hoc basis.
Kurita has an Executive Committee comprising
six directors including representative directors. The
committee meets twice monthly as a general rule to
deliberate on important management matters and
assist the Board of Directors’ decision-making.
To complement its decision-making, the Board of
Directors has also established an authorization proto-
col based on authorization and review regulations.
In terms of operational execution, Kurita has
employed an executive officer system since 2005
with the aims of realizing swift decision making by
separating management and execution and strength-
ening officers’ capabilities. Kurita currently has six
executive officers.
The external director monitors management by
voicing opinions from an independent position at
Board of Directors’ meetings. This ensures a multilat-
eral perspective and greater objectivity in directors’
decisions on execution.
Corporate Auditor SystemKurita employs a corporate auditor system. The
Board of Corporate Auditors comprises three cor-
porate auditors, including two external corporate
auditors. The Board of Corporate Auditors decides
on audit policies for the fiscal year, allocation of
duties to each corporate auditor, specific items to
be performed, schedules, and other items for exe-
cuting audits.
Corporate auditors attend Board of Directors’
meetings, Executive Committee meetings, and other
important company meetings and monitor the
directors’ execution of duties and the Board of
directors’ fulfillment of its oversight responsibilities.
Corporate auditors’ other responsibilities include
conducting asset status surveys of the entire group,
including subsidiaries, checking the status and func-
tionality of internal control systems implemented by
the directors, confirming accounting auditors’ inde-
pendence and fulfillment of duties, and meeting with
the accounting auditors regularly and as otherwise
necessary to discuss the accounting audit and
exchange opinions.
The Internal Auditing Department, which reports
directly to the president, is tasked with strengthening
internal control. The head of the department and eight
subordinate staff conduct internal audits of the entire
Group to ascertain any issues or problems arising in
the execution of duties. The department then recom-
mends measures for improvements to the president.
From the fiscal year beginning April 1, 2008, the
Organization
General Meeting of Shareholders
Board of Directors
President
Board of Corporate Auditors
Executive Committee Internal Auditing Department
Operating Divisions
Corporate Auditors

15Kurita Water Industries Ltd. Annual Report 2011
department has been responsible for monitoring the
status of internal controls and recommending and
supporting improvements in response to the introduc-
tion of the internal controls reporting system for finan-
cial reporting mandated by on the Japanese Financial
Instruments and Exchange Act. The department also
monitors the Group’s implementation and improve-
ment of risk management.
The corporate auditors and the Internal Audit-
ing Department discuss the department’s audit plan
for each fiscal year and exchange opinions regarding
the status and results of audits, assessment of inter-
nal control over financial reporting, and assessment
of risk management.
Kurita has appointed Grant Thornton Taiyo ASG
as its accounting auditor, in accordance with the law,
to implement and enhance the Company’s account-
ing audits.
The two external corporate auditors enhance
objectivity in monitoring management by auditing
from an independent perspective, drawing on their
specialized knowledge. In March 2010, Kurita regis-
tered the external director and the two external
corporate auditors as independent officers in
accord with the Tokyo Stock Exchange’s listing regu-
lations, as amended.
• Main Activities of the External Director and
External Corporate Auditors for
the Fiscal Year Ended March 31, 2011
Mr. Hayata, Kurita’s external director, attended Board
of Directors’ meetings and voiced appropriate opin-
ions as required on the proposals and deliberations
at the meetings.
In addition to conducting regular audits, Mr.
Kuzuu, one of the external corporate auditors,
attended Board of Directors’ meetings, Board of
Corporate Auditors’ meetings and other important
meetings to offer a specialist financial and accounting
perspective on matters, as well as appropriately
exchanging opinions with the accounting auditors
and Internal Auditing Department.
Mr. Uda, the other external corporate auditor,
attended Board of Directors’ meetings and Board
of Corporate Auditors’ meetings to offer opinions
appropriately as needed, mainly from a specialist
legal expert’s perspective.
Internal Control System and Risk Management SystemIn May 2006 the Board of Directors prescribed the
Fundamental Policy Regarding the Establishment of
Internal Control Systems in accordance with the
requirements of Japan’s Companies Act and has subse-
quently augmented Kurita’s internal controls in line
with this basic policy. The following systems are in place
to enhance management of compliance and safety.
• Compliance Committees
Compliance is one of Kurita’s top management
priorities. Kurita has established a Compliance Com-
mittee chaired by an executive senior managing
director (representative director) and a Group
Compliance Committee comprising representative
directors from Group companies.
The Kurita Group regards compliance activities
as entailing more than simple law abidance. Rather, it
is conceived as a broad ethical practice aimed at
realizing five values: fairness, transparency, integrity,
safety, and coexistence. Kurita set forth these values
in its Code of Ethical Conduct, prescribed in 2000.
Kurita has also instituted whistleblower protection
regulations, and established an internal consultation
desk while at the same time contracting an outside
party to provide consultation and reporting services.
• Headquarters Health and Safety Committee
The Headquarters Health and Safety Committee
reports directly to the president. The committee
oversees several subcommittees: the On-site Divi-
sion Health and Safety Committee, the Facilities
Production Division Health and Safety Committee,
the Ultrapure Water Supply Group Health and
Safety Committee, the Maintenance Group Health
and Safety Committee, and the Headquarters,
Branch and Office Health and Safety Committees.
Together these committees work to maintain and
improve health and safety at workplaces and in
business activities from the perspective of Group
companies and cooperating partners.
16 Kurita Water Industries Ltd. Annual Report 2011
• Risk Management
An officer is designated to promote oversight and
management of risk by regularly conducting risk
analysis and evaluation, and taking steps to prevent
risk events from occurring where possible.
The Group suffered only minor damage to
facilities at some of its business sites from the Great
East Japan Earthquake that occurred on March 11,
2011. The Group responded on March 11 by estab-
lishing a Disaster Response Headquarters, under the
president, to ascertain damage and assist with
recovery at customers’ sites in the affected areas,
and to offer assistance by supplying drinking water
and through monetary donations.
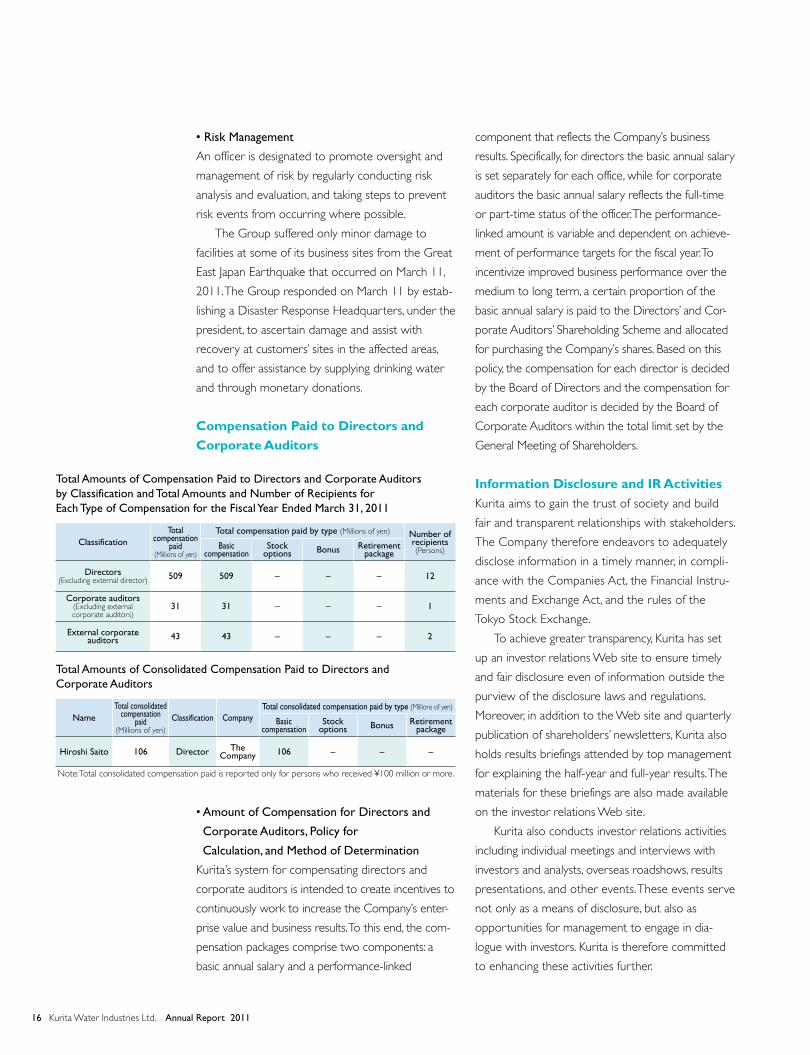
Compensation Paid to Directors and Corporate Auditors
• Amount of Compensation for Directors and
Corporate Auditors, Policy for
Calculation, and Method of Determination
Kurita’s system for compensating directors and
corporate auditors is intended to create incentives to
continuously work to increase the Company’s enter-
prise value and business results. To this end, the com-
pensation packages comprise two components: a
basic annual salary and a performance-linked
component that reflects the Company’s business
results. Specifically, for directors the basic annual salary
is set separately for each office, while for corporate
auditors the basic annual salary reflects the full-time
or part-time status of the officer. The performance-
linked amount is variable and dependent on achieve-
ment of performance targets for the fiscal year. To
incentivize improved business performance over the
medium to long term, a certain proportion of the
basic annual salary is paid to the Directors’ and Cor-
porate Auditors’ Shareholding Scheme and allocated
for purchasing the Company’s shares. Based on this
policy, the compensation for each director is decided
by the Board of Directors and the compensation for
each corporate auditor is decided by the Board of
Corporate Auditors within the total limit set by the
General Meeting of Shareholders.
Information Disclosure and IR ActivitiesKurita aims to gain the trust of society and build
fair and transparent relationships with stakeholders.
The Company therefore endeavors to adequately
disclose information in a timely manner, in compli-
ance with the Companies Act, the Financial Instru-
ments and Exchange Act, and the rules of the
Tokyo Stock Exchange.
To achieve greater transparency, Kurita has set
up an investor relations Web site to ensure timely
and fair disclosure even of information outside the
purview of the disclosure laws and regulations.
Moreover, in addition to the Web site and quarterly
publication of shareholders’ newsletters, Kurita also
holds results briefings attended by top management
for explaining the half-year and full-year results. The
materials for these briefings are also made available
on the investor relations Web site.
Kurita also conducts investor relations activities
including individual meetings and interviews with
investors and analysts, overseas roadshows, results
presentations, and other events. These events serve
not only as a means of disclosure, but also as
opportunities for management to engage in dia-
logue with investors. Kurita is therefore committed
to enhancing these activities further.
Total Amounts of Compensation Paid to Directors and Corporate Auditors by Classification and Total Amounts and Number of Recipients for Each Type of Compensation for the Fiscal Year Ended March 31, 2011
ClassificationTotal
compensation paid
(Millions of yen)
Total compensation paid by type (Millions of yen) Number of recipients(Persons)Basic
compensationStock
options Bonus Retirement package
Directors (Excluding external director) 509 509 – – – 12
Corporate auditors (Excluding external corporate auditors)
31 31 – – – 1
External corporate auditors 43 43 – – – 2
Total Amounts of Consolidated Compensation Paid to Directors and Corporate Auditors
NameTotal consolidated
compensation paid
(Millions of yen)
Classification CompanyTotal consolidated compensation paid by type (Millions of yen)
Basic compensation
Stock options Bonus Retirement
package
Hiroshi Saito 106 Director The Company 106 – – –
Note: Total consolidated compensation paid is reported only for persons who received ¥100 million or more.

17Kurita Water Industries Ltd. Annual Report 2011
Environmental Improvement ActivitiesThe Kurita Group’s business operations are closely
linked with environmental improvement activities
in the field of water and the environment. As such,
we focus on contributing to society through our
main business. Our efforts to help realize a sus-
tainable society naturally begin with reducing our
own impact on the environment. We also consider
it important to promote proposals for reducing
environmental impact to our customers.
As a framework for promoting environmental
improvement activities, Kurita has an Environmental
Improvement Promotion Committee that deliber-
ates on matters relating to the status of the Group’s
environmental activities and formulates policies. In
accordance with these policies, Environmental
Improvement Promotion Committees within Kurita’s
administrative and business divisions, as well as busi-
ness sites and Group companies each formulate and
pursue their own measures and targets, and execute
them. To check on the progress and achievement of
these targets and measures, environmental improve-
ment activity facilitators from each business site and
subsidiaries convene an Environmental Improvement
Activity Promotion Meeting, at which they assess
the activities’ adequacy and effectiveness.
Activity Guidelines1. We will contribute to the realization of a
resource-recycling society by developing new
products and technologies conducive to environ-
mental improvement.
2. We will work with customers to improve the
environment by providing products, technologies,
and services that improve productivity, reduce
environmental impact, and offer innovative
energy solutions.
3. In conducting business activities, we will reduce
environmental impact by daily practicing the three
Rs (Reduce, Reuse, Recycle) through operational
improvement and innovation.
Environmental Improvement Promotion Committee
Environmental Improvement Activity Promotion Meeting
Environmental Improvement Promotion Committee
within operating divisions
Business sites(Environmental improvement
activity facilitators)
Group companies (Environmental improvement
activity facilitators)
Employees Employees Employees
President
Framework for Promoting Environmental Improvement Activities
Basic Environmental Improvement Activities PolicyThe Kurita Group will conduct business activities
based on its corporate philosophy and will
endeavor to solve water and environmental
issues with the aim of making broad contributions
to society.

Topics
In response to the Great East Japan Earthquake
that struck in March 2011, the Kurita Group
donated ¥100 million in assistance to support
victims of the disaster and to help recovery
efforts in affected areas. The Group also supplied
its own drinking water product Minerise Water to
stricken areas.
The Kurita Group will continue working to
support people in affected areas.
18 Kurita Water Industries Ltd. Annual Report 2011
Distinctive Environmental Improvement ActivitiesA distinctive aspect of Kurita’s environmental
improvement activities is their close links with the
Company’s business activities. Kurita’s main business
involves developing products and technologies that
help to improve the environment, then leveraging
them to help customers reduce their environmental
impact. For this reason, the Kurita Group approaches
environmental improvement activities from three
aspects: responding to societal needs, meeting cus-
tomer needs, and pursuing internal change.
To respond to societal needs, the Group devel-
ops new products and technologies that help to
improve the environment for society as a whole. To
meet customers’ needs, the Group works to make
customer sites and offices more environmentally-
friendly by formulating and providing solutions that
accurately meet the customers’ needs for reducing
their environmental impact. The Group measures its
performance here in terms of numbers of new
developments and effective environmental benefits
to customers. These environmental benefits are
calculated as an estimate (i.e., deemed effect) of the
reduction in the environmental impact after the
customer has adopted Kurita’s proposal.
With regard to internal change, the Group sets
targets for reduction of CO2 emissions and reduc-
tion of waste disposal volume, and strives to reduce
the environmental impact from its operations.
Results of Environmental Activities in the Year Ended March 31, 2011With respect to societal needs, in the Water Treat-
ment Chemicals business, the Kurita Group has
developed new products for reducing usage of
heavy oil and chemicals at customers’ plants. In
water treatment facilities, we have developed new
wastewater treatment systems that reduce elec-
tricity usage and the volume of sludge generated
by customers.
Regarding customer needs, Kurita helped cus-
tomers to realize environmental benefits that sur-
passed Kurita’s initial targets for reducing CO2
emissions and water pollutants.
For internal change in addition to its previous
initiatives, Kurita formulated an integrated policy for
the entire Group that sets out water quality man-
agement and a response to emergency situations at
all levels. The policy was based on results of a risk
evaluation for wastewater treatment facilities man-
agement. Details and concrete data are scheduled
to be published in the Kurita Group Environmental
Report in October 2011.
Customers’ environmental improvement activities
Kurita’s own environmental
improvement activities
Aspect 1:Societal needs
Realizing a resource-recycling society through the development
of new products and technologies that
contribute to environmental improvement
Aspect 2:Customer needs
Products, technologies and services that will enable customers to
improve the environment
Aspect 3:Internal change
Reducing environmental impact by putting the 3Rs
into practice through operational improvement
and innovation
The Three Aspects of Kurita’s Environmental Improvement Activities
Directors
19Kurita Water Industries Ltd. Annual Report 2011
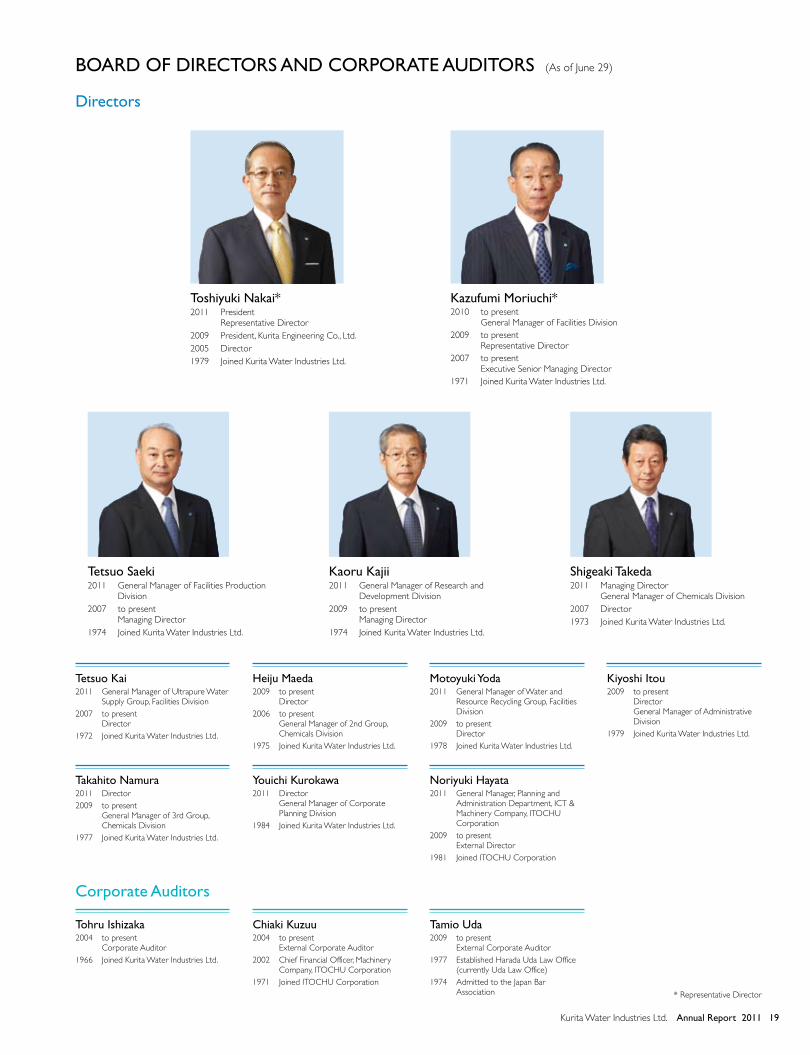
BOARD OF DIRECTORS AND CORPORATE AUDITORS (As of June 29)
Corporate Auditors
Toshiyuki Nakai*2011 President
Representative Director2009 President, Kurita Engineering Co., Ltd.2005 Director1979 Joined Kurita Water Industries Ltd.
Kazufumi Moriuchi*2010 to present
General Manager of Facilities Division2009 to present
Representative Director2007 to present
Executive Senior Managing Director1971 Joined Kurita Water Industries Ltd.
Tetsuo Saeki2011 General Manager of Facilities Production
Division2007 to present
Managing Director1974 Joined Kurita Water Industries Ltd.
Tetsuo Kai2011 General Manager of Ultrapure Water
Supply Group, Facilities Division2007 to present
Director1972 Joined Kurita Water Industries Ltd.
Takahito Namura2011 Director 2009 to present
General Manager of 3rd Group, Chemicals Division
1977 Joined Kurita Water Industries Ltd.
Tohru Ishizaka2004 to present
Corporate Auditor1966 Joined Kurita Water Industries Ltd.
Heiju Maeda2009 to present
Director2006 to present
General Manager of 2nd Group, Chemicals Division
1975 Joined Kurita Water Industries Ltd.
Youichi Kurokawa2011 Director
General Manager of Corporate Planning Division
1984 Joined Kurita Water Industries Ltd.
Chiaki Kuzuu2004 to present
External Corporate Auditor2002 Chief Financial Officer, Machinery
Company, ITOCHU Corporation1971 Joined ITOCHU Corporation
Kiyoshi Itou2009 to present
Director General Manager of Administrative Division
1979 Joined Kurita Water Industries Ltd.
* Representative Director
Motoyuki Yoda2011 General Manager of Water and
Resource Recycling Group, Facilities Division
2009 to present Director
1978 Joined Kurita Water Industries Ltd.
Noriyuki Hayata2011 General Manager, Planning and
Administration Department, ICT & Machinery Company, ITOCHU Corporation
2009 to present External Director
1981 Joined ITOCHU Corporation
Tamio Uda2009 to present
External Corporate Auditor1977 Established Harada Uda Law Office
(currently Uda Law Office)1974 Admitted to the Japan Bar
Association
Kaoru Kajii2011 General Manager of Research and
Development Division2009 to present
Managing Director1974 Joined Kurita Water Industries Ltd.
Shigeaki Takeda2011 Managing Director
General Manager of Chemicals Division2007 Director1973 Joined Kurita Water Industries Ltd.
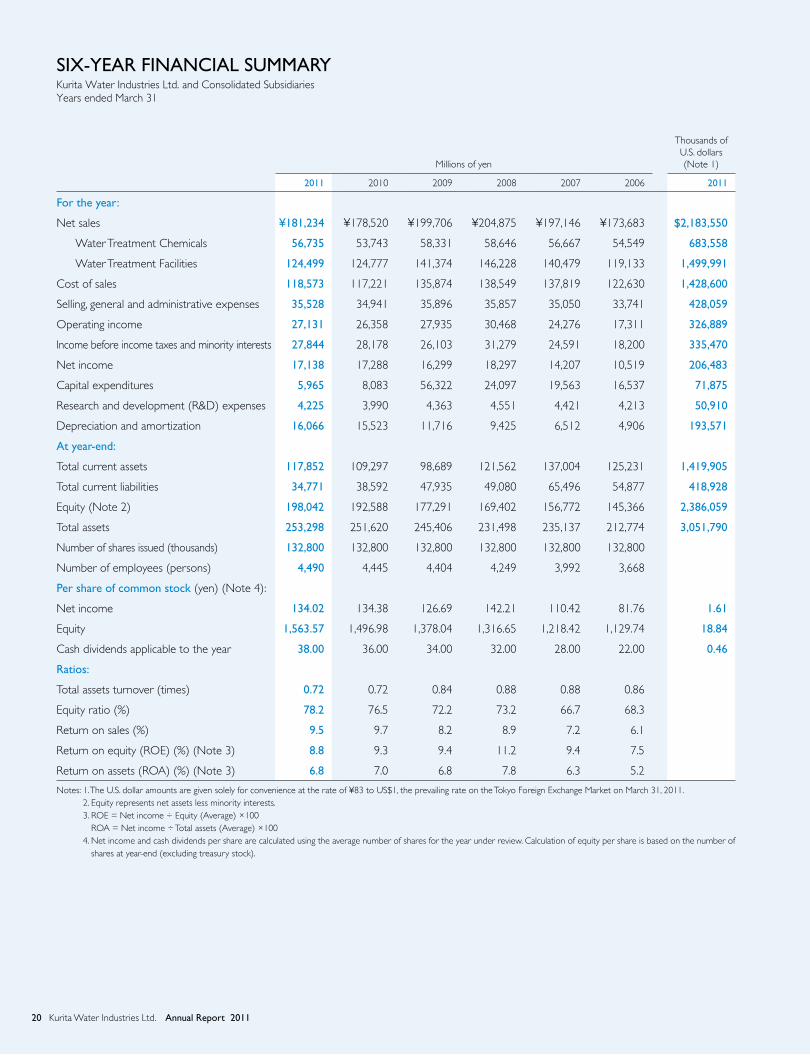
Six-Year Financial SummarYKurita Water Industries Ltd. and Consolidated SubsidiariesYears ended March 31
Millions of yen
Thousands of U.S. dollars (Note 1)
2011 2010 2009 2008 2007 2006 2011
For the year:
Net sales ¥181,234 ¥178,520 ¥199,706 ¥204,875 ¥197,146 ¥173,683 $2,183,550
Water Treatment Chemicals 56,735 53,743 58,331 58,646 56,667 54,549 683,558
Water Treatment Facilities 124,499 124,777 141,374 146,228 140,479 119,133 1,499,991
Cost of sales 118,573 117,221 135,874 138,549 137,819 122,630 1,428,600
Selling, general and administrative expenses 35,528 34,941 35,896 35,857 35,050 33,741 428,059
Operating income 27,131 26,358 27,935 30,468 24,276 17,311 326,889
Income before income taxes and minority interests 27,844 28,178 26,103 31,279 24,591 18,200 335,470
Net income 17,138 17,288 16,299 18,297 14,207 10,519 206,483
Capital expenditures 5,965 8,083 56,322 24,097 19,563 16,537 71,875
Research and development (R&D) expenses 4,225 3,990 4,363 4,551 4,421 4,213 50,910
Depreciation and amortization 16,066 15,523 11,716 9,425 6,512 4,906 193,571
at year-end:
Total current assets 117,852 109,297 98,689 121,562 137,004 125,231 1,419,905
Total current liabilities 34,771 38,592 47,935 49,080 65,496 54,877 418,928
Equity (Note 2) 198,042 192,588 177,291 169,402 156,772 145,366 2,386,059
Total assets 253,298 251,620 245,406 231,498 235,137 212,774 3,051,790
Number of shares issued (thousands) 132,800 132,800 132,800 132,800 132,800 132,800
Number of employees (persons) 4,490 4,445 4,404 4,249 3,992 3,668
Per share of common stock (yen) (Note 4):
Net income 134.02 134.38 126.69 142.21 110.42 81.76 1.61
Equity 1,563.57 1,496.98 1,378.04 1,316.65 1,218.42 1,129.74 18.84
Cash dividends applicable to the year 38.00 36.00 34.00 32.00 28.00 22.00 0.46
ratios:
Total assets turnover (times) 0.72 0.72 0.84 0.88 0.88 0.86
Equity ratio (%) 78.2 76.5 72.2 73.2 66.7 68.3
Return on sales (%) 9.5 9.7 8.2 8.9 7.2 6.1
Return on equity (ROE) (%) (Note 3) 8.8 9.3 9.4 11.2 9.4 7.5
Return on assets (ROA) (%) (Note 3) 6.8 7.0 6.8 7.8 6.3 5.2
Notes: 1. The U.S. dollar amounts are given solely for convenience at the rate of ¥83 to US$1, the prevailing rate on the Tokyo Foreign Exchange Market on March 31, 2011. 2. Equity represents net assets less minority interests. 3. ROE = Net income ÷ Equity (Average) ×100
ROA = Net income ÷ Total assets (Average) ×100 4. Net income and cash dividends per share are calculated using the average number of shares for the year under review. Calculation of equity per share is based on the number of
shares at year-end (excluding treasury stock).
20 Kurita Water Industries Ltd. annual report 2011
MANAGEMENT’S DISCUSSION AND ANALYSIS
Business Overview
Markets in which the Kurita Group operates were challenging on the whole
during the fiscal year ended March 31, 2011. In Japan, although customer facto-
ries’ capacity utilization rose moderately, capital expenditure levels in both the
electronics industry and general industries remain low, having yet to achieve a
full-fledged recovery.
Overseas business, on the other hand, was steady, particularly in Asia, which is
seeing continued economic growth.
The fiscal year ended March 31, 2011 was the second year of MP-11, our
three-year medium-term management plan. The basic objectives of the plan are
to strengthen customer trust, enhance business quality, and carve out new busi-
ness domains. Under the plan, the Group has worked to achieve sustained
growth by further expanding its service businesses and global operations and
developing new products and businesses.
In tandem with its sales activities, the entire Group also worked to imple-
ment rigorous risk management.
For the fiscal year ended March 31, 2011, the Kurita Group saw increases in
orders received, net sales, and operating income. Gain on liquidation due to
termination of contract declined, with the result that net income came in slightly
lower compared with the previous year.
The Kurita Group received only minor damage to some facilities in the Great
East Japan Earthquake of March 2011.
Operating Results
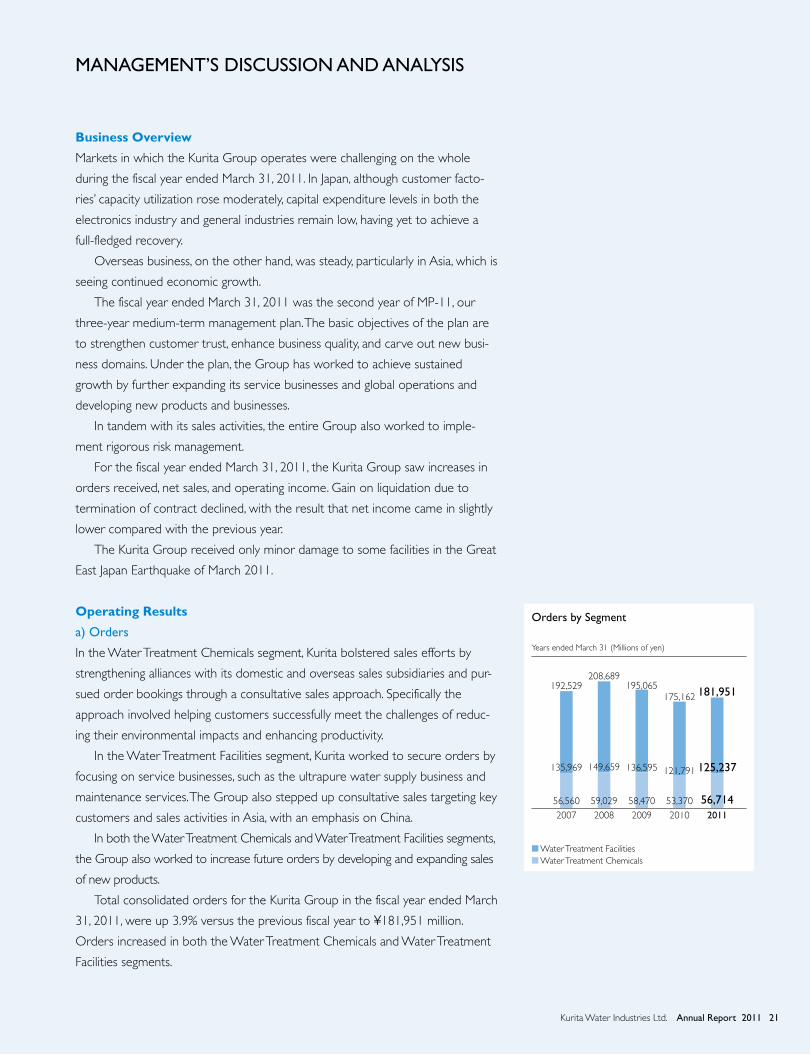
a) Orders
In the Water Treatment Chemicals segment, Kurita bolstered sales efforts by
strengthening alliances with its domestic and overseas sales subsidiaries and pur-
sued order bookings through a consultative sales approach. Specifically the
approach involved helping customers successfully meet the challenges of reduc-
ing their environmental impacts and enhancing productivity.
In the Water Treatment Facilities segment, Kurita worked to secure orders by
focusing on service businesses, such as the ultrapure water supply business and
maintenance services. The Group also stepped up consultative sales targeting key
customers and sales activities in Asia, with an emphasis on China.
In both the Water Treatment Chemicals and Water Treatment Facilities segments,
the Group also worked to increase future orders by developing and expanding sales
of new products.
Total consolidated orders for the Kurita Group in the fiscal year ended March
31, 2011, were up 3.9% versus the previous fiscal year to ¥181,951 million.
Orders increased in both the Water Treatment Chemicals and Water Treatment
Facilities segments.
2007
192,529208,689
195,065175,162
2008 2009 2010 2011
181,951
135,969 149,659 136,595 121,791 125,237
56,560 59,029 58,470 53,370 56,714
Orders by Segment
Years ended March 31 (Millions of yen)
n Water Treatment Facilitiesn Water Treatment Chemicals
21Kurita Water Industries Ltd. Annual Report 2011
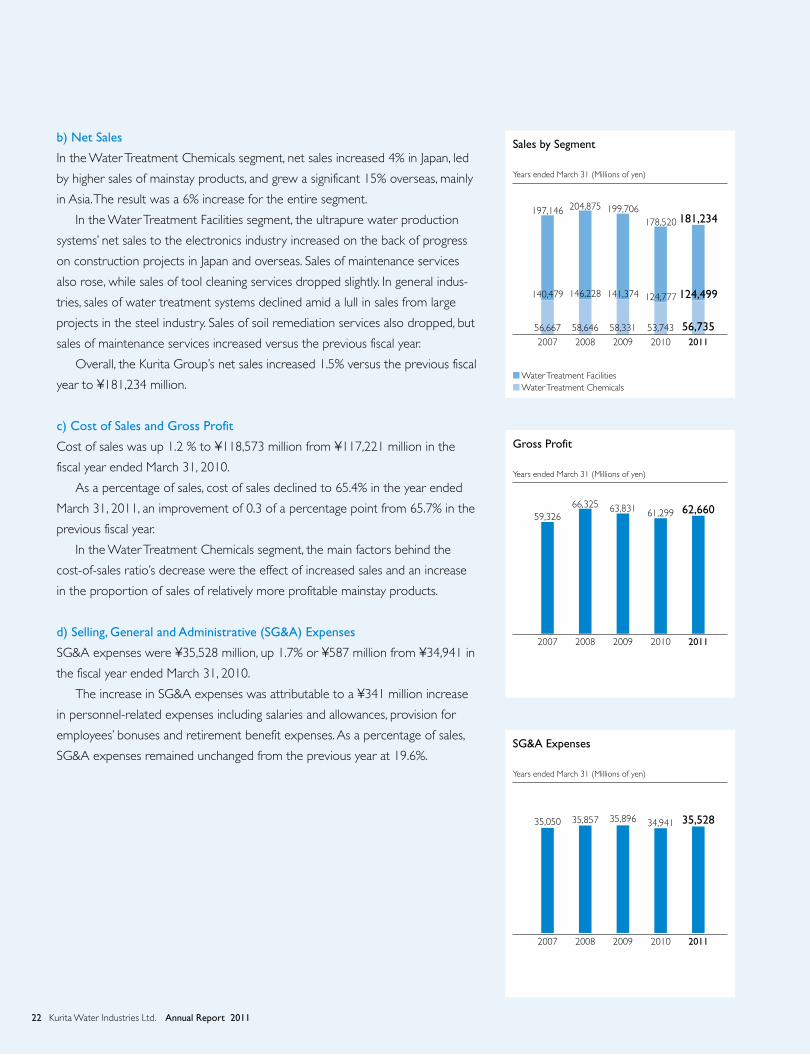
b) Net Sales
In the Water Treatment Chemicals segment, net sales increased 4% in Japan, led
by higher sales of mainstay products, and grew a significant 15% overseas, mainly
in Asia. The result was a 6% increase for the entire segment.
In the Water Treatment Facilities segment, the ultrapure water production
systems’ net sales to the electronics industry increased on the back of progress
on construction projects in Japan and overseas. Sales of maintenance services
also rose, while sales of tool cleaning services dropped slightly. In general indus-
tries, sales of water treatment systems declined amid a lull in sales from large
projects in the steel industry. Sales of soil remediation services also dropped, but
sales of maintenance services increased versus the previous fiscal year.
Overall, the Kurita Group’s net sales increased 1.5% versus the previous fiscal
year to ¥181,234 million.
c) Cost of Sales and Gross Profit
Cost of sales was up 1.2 % to ¥118,573 million from ¥117,221 million in the
fiscal year ended March 31, 2010.
As a percentage of sales, cost of sales declined to 65.4% in the year ended
March 31, 2011, an improvement of 0.3 of a percentage point from 65.7% in the
previous fiscal year.
In the Water Treatment Chemicals segment, the main factors behind the
cost-of-sales ratio’s decrease were the effect of increased sales and an increase
in the proportion of sales of relatively more profitable mainstay products.
d) Selling, General and Administrative (SG&A) Expenses
SG&A expenses were ¥35,528 million, up 1.7% or ¥587 million from ¥34,941 in
the fiscal year ended March 31, 2010.
The increase in SG&A expenses was attributable to a ¥341 million increase
in personnel-related expenses including salaries and allowances, provision for
employees’ bonuses and retirement benefit expenses. As a percentage of sales,
SG&A expenses remained unchanged from the previous year at 19.6%.
2007
197,146 204,875 199,706178,520
2008 2009 2010 2011
181,234
140,479 146,228 141,374 124,777 124,499
56,667 58,646 58,331 53,743 56,735
Sales by Segment
Years ended March 31 (Millions of yen)
n Water Treatment Facilitiesn Water Treatment Chemicals
2007
59,32666,325 63,831 61,299
2008 2009 2010 2011
62,660
Gross Profit
Years ended March 31 (Millions of yen)
2007
35,050 35,857 35,896 34,941
2008 2009 2010 2011
35,528
SG&A Expenses
Years ended March 31 (Millions of yen)
22 Kurita Water Industries Ltd. Annual Report 2011

e) Operating Income
Operating income increased to ¥27,131 million in the year ended March 31,
2011, up 2.9% from ¥26,358 million in the fiscal year ended March 31, 2010. The
operating margin improved to 15.0% from 14.8% in the previous fiscal year.
f) Segment Information
Water Treatment Chemicals
Orders and Sales
In Japan, orders for boiler water treatment chemicals, cooling water treatment
chemicals, and wastewater treatment chemicals, the Group’s mainstay products,
increased versus the previous fiscal year, due to stronger consultative sales efforts
and higher capacity utilization by customers.
Kurita focused on controlling rising raw materials and sales costs to
secure profits.
Regarding new products and technologies, Kurita has developed high-
performance chemicals for removing contaminants from the membranes used in
reverse osmosis (RO) membrane systems.
Overseas, orders and sales increased in Asia and Brazil. This increase was due
to recoveries in production activity in various industries, particularly in Asia. At
the same time, Kurita enhanced sales activities by acquiring more customers in
the process treatment chemicals field and providing technological support.
Operating Income
Operating income increased significantly as Kurita worked to control rises in cost
of sales and SG&A expenses while recording higher sales.
Overall, the Water Treatment Chemicals segment booked orders of ¥56,714
million (up 6.3 % versus the previous fiscal year) and earned operating income of
¥10,099 million (up 23.5%) on sales of ¥56,735 million (up 5.6%).
Water Treatment Facilities
Orders
In the electronics industry, orders for the ultrapure water supply business rose
slightly versus the previous fiscal year, while orders for ultrapure water produc-
tion systems increased overseas. Orders for maintenance services rose due to a
recovery in capacity utilization at customer plants in Japan. Orders for tool clean-
ing services were down slightly as stronger competition depressed prices.
Orders for hardware and soil remediation services for general industries in
Japan decreased due to a slump in capital expenditures and demand, and a
downturn in the real estate market. However, orders for maintenance services
for privately owned plants increased mainly due to a recovery in capacity utiliza-
tion and stronger consultative sales activities.
2007
24,276
30,46827,935
26,358
2008 2009 2010 2011
27,131
15,471 20,939 19,517 18,18117,032
8,806 9,525 8,417 8,177 10,099
Operating Income by Segment
Years ended March 31 (Millions of yen)
n Water Treatment Facilitiesn Water Treatment Chemicals
2007
15.5
16.2
14.4
15.2
2008 2009 2010 2011
17.8
12.3
14.9
14.014.8
15.0
11.0
14.3
13.814.6
13.7
Operating Margin by Segment
Years ended March 31 (%)
n Water Treatment Chemicalsn Totaln Water Treatment Facilities
23Kurita Water Industries Ltd. Annual Report 2011
Sales
The sales of ultrapure water production systems to the electronics industry
increased as construction projects in Japan and overseas made progress. Sales of
maintenance services also rose, primarily due to a recovery in capacity utilization
at customer plants in Japan, while sales of tool cleaning services dropped tracking
lower orders due to stronger competition and lower prices.
Sales of maintenance services to general industries recovered, but sales of hard-
ware decreased amid a lull in sales from large projects in the steel industry. Sales of
soil remediation services also declined due to a stagnating business environment.
In China, the Group responded swiftly to customer needs for water quality
analysis and moved to provide sales support by establishing a water quality
analysis team at Kurita Water Industries (Suzhou) Ltd. Moreover, the Group
continued building a completely local production framework in China for design-
ing, manufacturing, and testing the capacity of water treatment facilities.
In new products and services, Kurita developed a carrier-type anaerobic
treatment system applicable to low-concentration organic wastewater that has
previously not been treatable with such systems. The Group also expanded sales
of electrolyzed sulfuric acid generators for semiconductor manufacturers.
Operating Income
Segment operating income declined tracking lower sales of hardware to general
industries and soil remediation services. The effect was offset somewhat by a
recovery in hardware sales to the electronics industry and maintenance services
to clients in Japan.
Total Group orders for the Water Treatment Facilities segment were
¥125,237 million (up 2.8%) and earned operating income of ¥17,032 million
(down 6.3%) on sales of ¥124,499 million (down 0.2%).
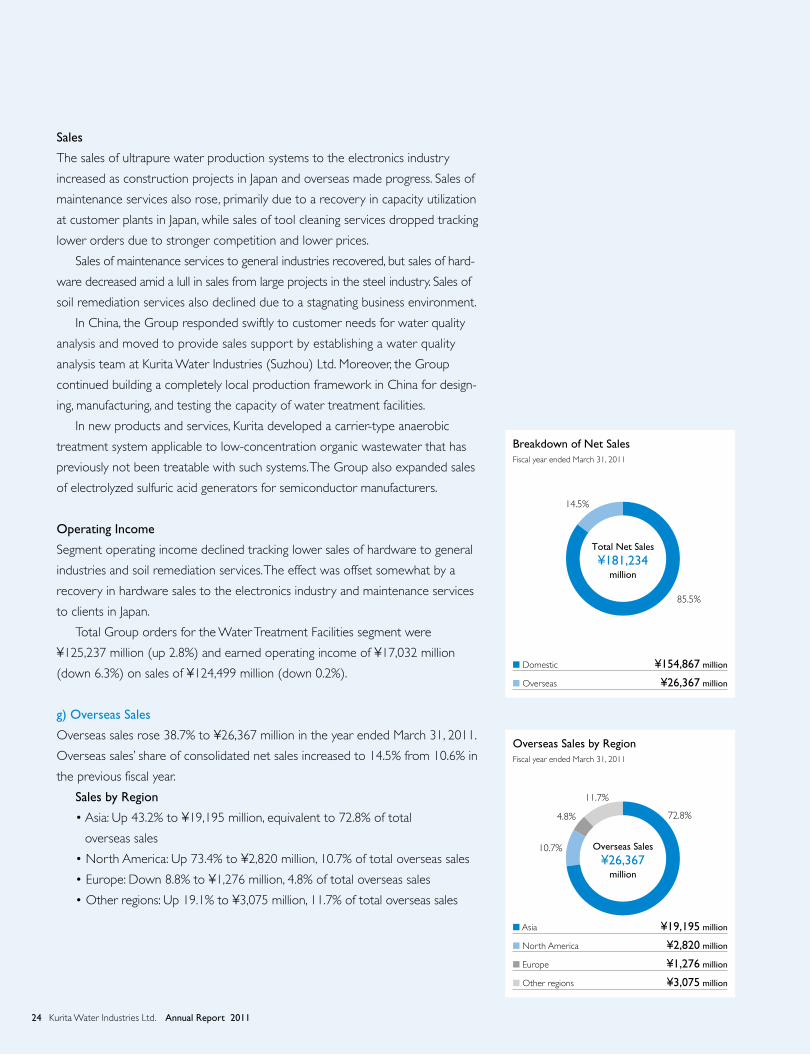
g) Overseas Sales
Overseas sales rose 38.7% to ¥26,367 million in the year ended March 31, 2011.
Overseas sales’ share of consolidated net sales increased to 14.5% from 10.6% in
the previous fiscal year.
Sales by Region
• Asia: Up 43.2% to ¥19,195 million, equivalent to 72.8% of total
overseas sales
• North America: Up 73.4% to ¥2,820 million, 10.7% of total overseas sales
• Europe: Down 8.8% to ¥1,276 million, 4.8% of total overseas sales
• Other regions: Up 19.1% to ¥3,075 million, 11.7% of total overseas sales
Total Net Sales
¥181,234million
Breakdown of Net SalesFiscal year ended March 31, 2011
n Domestic ¥154,867 million
n Overseas ¥26,367 million
Overseas Sales
¥26,367million
Overseas Sales by RegionFiscal year ended March 31, 2011
n Asia ¥19,195 million
n North America ¥2,820 million
n Europe ¥1,276 million
n Other regions ¥3,075 million
85.5%
72.8%
10.7%
4.8%
11.7%
14.5%
24 Kurita Water Industries Ltd. Annual Report 2011

h) Other Income and Expenses
The balance of other income and other expenses was net other income of ¥712
million, down from ¥1,820 million in the previous fiscal year.
This decline was mainly attributable to the absence of a gain on liquidation
due to termination of contracts of ¥1,507 million in the previous fiscal year.
The net balance of interest and dividend income and interest expense
increased to ¥390 million versus ¥305 million in the previous fiscal year.
The Group recorded loss on disaster of ¥124 million in connection with dam-
ages incurred at some business sites, and support expense of disaster restoration
of ¥115 million.
i) Income before Income Taxes and Minority Interests
Income before income taxes and minority interests decreased 1.2% to ¥27,844
million from ¥28,178 million in the previous fiscal year.
The pretax profit margin consequently decreased to 15.4% from 15.8% in
the previous fiscal year.
j) Net Income
After deducting income taxes and income from minority interests, Kurita earned
net income of ¥17,138 million for the fiscal year ended March 31, 2011, a 0.9%
decrease from ¥17,288 million in the previous fiscal year.
Net income per share decreased to ¥134.02 from ¥134.38 in the previous
fiscal year, and the net margin fell to 9.5% from 9.7% in the previous fiscal year.
Return on equity decreased to 8.8% from 9.3% in the previous fiscal year.
k) Returns to Shareholders
Kurita’s basic policy is to pay stable dividends on an ongoing basis. Kurita strives
to increase its dividends, taking into consideration earnings performance and
investment in its businesses.
In light of future business prospects and to reward shareholders for their
support, Kurita paid an annual dividend of ¥38 per share (of which ¥19 per
share was an interim dividend), an increase of ¥2 per share versus the previous
fiscal year’s ¥36 per share (of which ¥17 per share was an interim dividend).
The Company decided to acquire a portion of its own stock with the aim of
improving capital efficiency and ensuring a flexible capital strategy. Between
November 8, 2010 and December 22, 2010, the Company acquired 1,988,400
shares of its own stock at a cost of ¥4,776 million. The acquired shares represented
1.55% of the total issued shares of the Company, excluding treasury stock.
2007
110.42
142.21126.69
134.38
2008 2009 2010 2011
134.02
Net Income per ShareYears ended March 31
(Yen)
2007 2008 2009 2010 2011
9.411.2
9.4 9.3 8.8
Return on EquityYears ended March 31
(%)
Note: Return on equity = Net income ÷ Equity (Average) ×100
2007
28.0032.00
34.0036.00
2008 2009 2010 2011
38.00
Dividends per ShareYears ended March 31
(Yen)
25Kurita Water Industries Ltd. Annual Report 2011

Capital Expenditures
The Kurita Group is committed to making necessary investments in technologi-
cal innovation, expansion of production capacity, and competitiveness enhance-
ment in response to intensification of sales competition. In the year ended March
31, 2011, Capital expenditures totaled ¥5,965 million, a decrease of ¥2,118 mil-
lion year on year (Leased assets and leased obligations were included for trans-
actions for finance leases which do not transfer ownership).
The Water Treatment Chemicals segment invested a total of ¥1,183 million in
assets, an increase of ¥32 million from the previous fiscal year. Most of this was for
new installation and overhaul of chemical production equipment.
The Water Treatment Facilities segment invested a total of ¥4,781 million in
assets, primarily to newly install and expand facilities for the ultrapure water
supply business. This was a substantial ¥2,150 million decline from the previous
fiscal year.
Depreciation and amortization increased 3.5% year on year to ¥16,066 mil-
lion in the year ended March 31, 2011, reflecting an increase in depreciation on
facilities for the ultrapure water supply business.
Research and Development
Kurita conducts R&D through its Research and Development Division. In the
year ended March 31, 2011, total R&D expenses increased 5.9% to ¥4,225 mil-
lion, equivalent to 2.3% of net sales. The Kurita Group employs approximately
150 R&D personnel, equivalent to 3.3% of its total workforce (4,490 personnel
on a consolidated basis).
The Water Treatment Chemicals segment’s R&D activities predominantly
involved developing chemicals that help customers improve energy efficiency,
reduce their environmental impact, and boost productivity. Other developments
include technologies for systems that monitor water treatment effectiveness. The
segment’s R&D expenses for the fiscal year ended March 31, 2011 totaled
¥1,285 million, a 15.4% increase versus the previous fiscal year.
In the Water Treatment Facilities segment, Kurita endeavored to further
improve ultrapure water quality and develop wastewater treatment and soil
remediation technologies in anticipation of future environmental regulations.
Kurita also endeavored to develop technologies conducive to a recycling-based
economy, such as wastewater reclamation for reuse and sludge volume reduc-
tion. Segment R&D expenses totaled ¥2,940 million, a 2.3% increase versus the
previous fiscal year.
2007
19,56324,097
56,322
8,083
2008 2009 2010 2011
5,9656,5129,425
11,71615,523 16,066
Capital Expenditures and Depreciation and AmortizationYears ended March 31 (Millions of yen)
n Capital Expendituresn Depreciation and Amortization
2007
4,421 4,5514,363
3,990
2008 2009 2010 2011
4,225
R&D Expenses
Years ended March 31 (Millions of yen)
26 Kurita Water Industries Ltd. Annual Report 2011

Financial Position
a) Total Assets
At March 31, 2011, Kurita had total assets of ¥253,298 million, an increase of
¥1,678 million from ¥251,620 million at March 31, 2010.
Current Assets
Current assets at March 31, 2011 totaled ¥117,852 million, an increase of ¥8,555
million from ¥109,297 million at March 31, 2010.
The increase was mainly due to an increase of ¥18,710 million in cash and
time deposits, which was partially offset by declines of ¥2,128 million in notes
and accounts receivable, trade and ¥8,500 million in marketable securities.
Property, Plant and Equipment, Intangible Assets, and Investments and
Long-term Receivables
At March 31, 2011, property, plant and equipment totaled ¥106,608 million, a
decrease of ¥9,892 million from ¥116,500 million at March 31, 2010. This
occurred because depreciation on facilities for the ultrapure water supply busi-
ness for which capital expenditures were made up until the previous fiscal year
exceeded capital expenditures in the year under review.
Investments and long-term receivables were ¥26,897 million at March 31,
2011, an increase of ¥3,248 million from ¥23,649 million a year earlier. The
increase was mainly attributable to an increase in investment securities.
2007
235,137 231,498245,406 251,620
2008 2009 2010 2011
253,298
6.37.8
6.8 7.06.8
Total Assets and Return on Assets
As of March 31 (Millions of yen)
n Total Assetsn Return on Assets
Note: Return on assets = Net income ÷ Total assets (Average)×100
2007
67,288
81,984
126,063116,500
2008 2009 2010 2011
106,608
Property, Plant and Equipment, net
As of March 31 (Millions of yen)
27Kurita Water Industries Ltd. Annual Report 2011
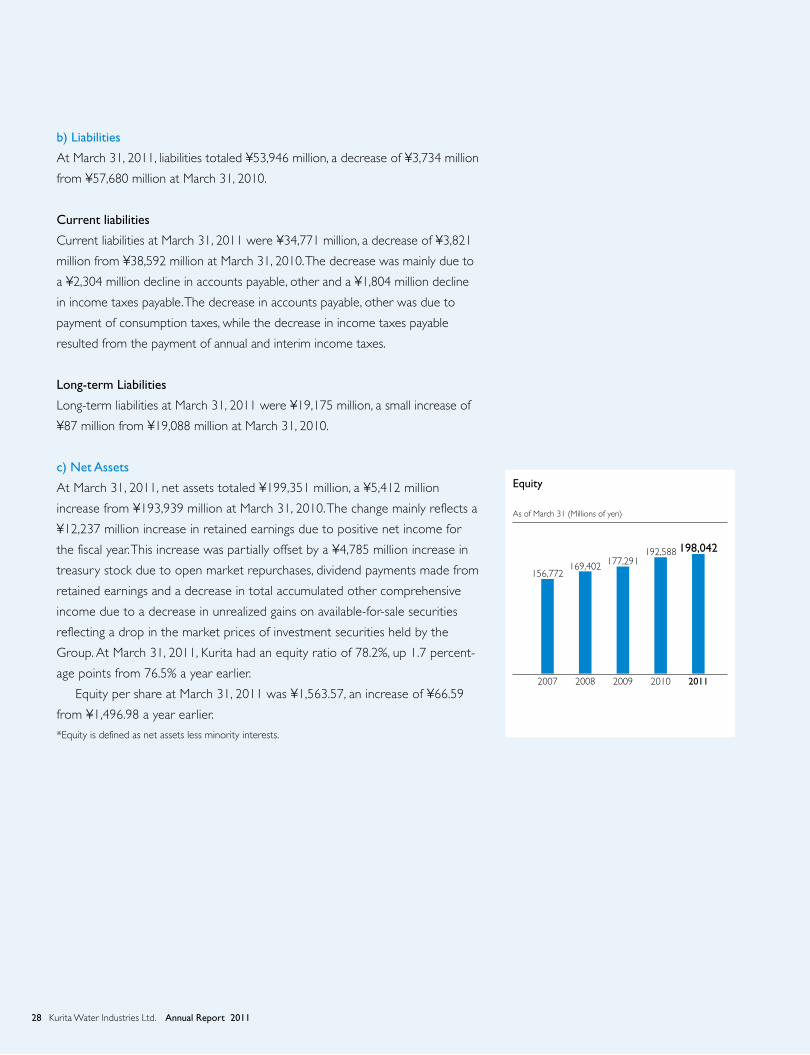
b) Liabilities
At March 31, 2011, liabilities totaled ¥53,946 million, a decrease of ¥3,734 million
from ¥57,680 million at March 31, 2010.
Current liabilities
Current liabilities at March 31, 2011 were ¥34,771 million, a decrease of ¥3,821
million from ¥38,592 million at March 31, 2010. The decrease was mainly due to
a ¥2,304 million decline in accounts payable, other and a ¥1,804 million decline
in income taxes payable. The decrease in accounts payable, other was due to
payment of consumption taxes, while the decrease in income taxes payable
resulted from the payment of annual and interim income taxes.
Long-term Liabilities
Long-term liabilities at March 31, 2011 were ¥19,175 million, a small increase of
¥87 million from ¥19,088 million at March 31, 2010.
c) Net Assets
At March 31, 2011, net assets totaled ¥199,351 million, a ¥5,412 million
increase from ¥193,939 million at March 31, 2010. The change mainly reflects a
¥12,237 million increase in retained earnings due to positive net income for
the fiscal year. This increase was partially offset by a ¥4,785 million increase in
treasury stock due to open market repurchases, dividend payments made from
retained earnings and a decrease in total accumulated other comprehensive
income due to a decrease in unrealized gains on available-for-sale securities
reflecting a drop in the market prices of investment securities held by the
Group. At March 31, 2011, Kurita had an equity ratio of 78.2%, up 1.7 percent-
age points from 76.5% a year earlier.
Equity per share at March 31, 2011 was ¥1,563.57, an increase of ¥66.59
from ¥1,496.98 a year earlier.
*Equity is defined as net assets less minority interests.
2007
156,772169,402 177,291
192,588
2008 2009 2010 2011
198,042
Equity
As of March 31 (Millions of yen)
28 Kurita Water Industries Ltd. Annual Report 2011
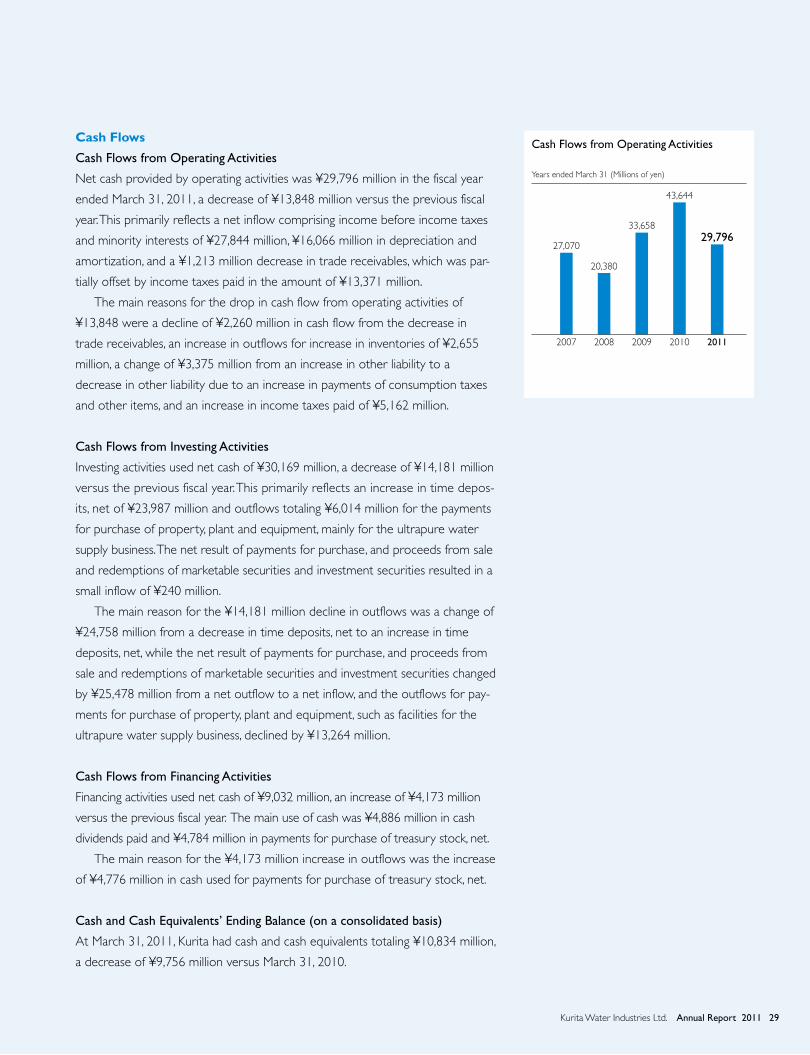
Cash Flows
Cash Flows from Operating Activities
Net cash provided by operating activities was ¥29,796 million in the fiscal year
ended March 31, 2011, a decrease of ¥13,848 million versus the previous fiscal
year. This primarily reflects a net inflow comprising income before income taxes
and minority interests of ¥27,844 million, ¥16,066 million in depreciation and
amortization, and a ¥1,213 million decrease in trade receivables, which was par-
tially offset by income taxes paid in the amount of ¥13,371 million.
The main reasons for the drop in cash flow from operating activities of
¥13,848 were a decline of ¥2,260 million in cash flow from the decrease in
trade receivables, an increase in outflows for increase in inventories of ¥2,655
million, a change of ¥3,375 million from an increase in other liability to a
decrease in other liability due to an increase in payments of consumption taxes
and other items, and an increase in income taxes paid of ¥5,162 million.
Cash Flows from Investing Activities
Investing activities used net cash of ¥30,169 million, a decrease of ¥14,181 million
versus the previous fiscal year. This primarily reflects an increase in time depos-
its, net of ¥23,987 million and outflows totaling ¥6,014 million for the payments
for purchase of property, plant and equipment, mainly for the ultrapure water
supply business. The net result of payments for purchase, and proceeds from sale
and redemptions of marketable securities and investment securities resulted in a
small inflow of ¥240 million.
The main reason for the ¥14,181 million decline in outflows was a change of
¥24,758 million from a decrease in time deposits, net to an increase in time
deposits, net, while the net result of payments for purchase, and proceeds from
sale and redemptions of marketable securities and investment securities changed
by ¥25,478 million from a net outflow to a net inflow, and the outflows for pay-
ments for purchase of property, plant and equipment, such as facilities for the
ultrapure water supply business, declined by ¥13,264 million.
Cash Flows from Financing Activities
Financing activities used net cash of ¥9,032 million, an increase of ¥4,173 million
versus the previous fiscal year. The main use of cash was ¥4,886 million in cash
dividends paid and ¥4,784 million in payments for purchase of treasury stock, net.
The main reason for the ¥4,173 million increase in outflows was the increase
of ¥4,776 million in cash used for payments for purchase of treasury stock, net.
Cash and Cash Equivalents’ Ending Balance (on a consolidated basis)
At March 31, 2011, Kurita had cash and cash equivalents totaling ¥10,834 million,
a decrease of ¥9,756 million versus March 31, 2010.
2007
27,070
20,380
33,658
43,644
2008 2009 2010 2011
29,796
Cash Flows from Operating Activities
Years ended March 31 (Millions of yen)
29Kurita Water Industries Ltd. Annual Report 2011
Business Risks
The following are summaries of major foreseeable risks present in the business
environments in which the Kurita Group operates. Forward-looking statements
herein are based on judgments made by management as of March 31, 2011.
1. Economic and Market Conditions
The Group’s Water Treatment Chemicals and Water Treatment Facilities busi-
nesses are affected by economic conditions in Japan and countries and regions
outside Japan where the Group operates. Demand in the Water Treatment
Chemicals business fluctuates in response to factory capacity utilization rates in
industries such as steel, petroleum refining and petrochemicals, and pulp and
paper—the main areas of demand for the business. Such demand fluctuations
may affect the Group’s financial results. Demand in the Water Treatment Facilities
business fluctuates in response to trends in capital expenditure in electronics—
the main areas of demand for the business—and other industries. Such demand
fluctuations may affect the Group’s financial results.
More intense competition with rivals in the Group’s business domains could
lead to declines in prices of products and services, which could lower the
Group’s profitability.
2. Materials and Parts Procurement
The Group procures raw materials and parts from outside the Group for the
manufacture of products and fabrication of facilities. The prices of raw materials
and parts fluctuate based on changes in market conditions, and this may affect
the Group’s financial results.
3. Overseas Business Development
The Group is striving to expand its business outside Japan. In contrast to the
Japanese market, doing business in overseas markets involves a number of
inherent, unforeseen risks, including the risk of changes to local laws and regu-
lations, the risk of political and economic instability, and the risk of foreign
exchange rate fluctuations. If such risks materialized, the Group’s financial
results could be affected.
30 Kurita Water Industries Ltd. Annual Report 2011

4. New Product Development
The Group continuously endeavors to develop new technology and appealing
new products.
The success of new technology and product development efforts cannot be
guaranteed. The Group may not be able to offer new technologies and products
that meet the needs of its customers or launch new products in a timely fashion.
The Group may also fail to keep pace with rapid changes in technological inno-
vation and changing customer needs. If the Group were to fail to develop
appealing new products, this could hamper its future growth and profitability or
otherwise affect its financial results.
5. Intellectual Property
The Group recognizes the importance of intellectual property and continually
seeks to register its own intellectual property while avoiding infringing the intel-
lectual property rights of third parties, both in Japan and overseas. Given the
wide scope of the Group’s business, however, there is potential for the Group’s
intellectual property rights to be infringed and potential for the Group to
infringe the rights of third parties. Such occurrences may affect the Group’s
financial results.
6. Dependence on Information Systems
The Group’s use of information systems is increasing, as is the importance of
information systems to the Group’s business. If a computer virus or some other
factor were to obstruct the functions of the Group’s information systems, the
Group’s business activities, financial results, and financial condition could be
negatively affected.
7. Large-Scale Natural Disasters
If an earthquake, typhoon, or other kind of natural disaster were to directly or
indirectly upset the Group’s business execution, the Group’s business activities,
financial results, and financial condition could be negatively affected.
31Kurita Water Industries Ltd. Annual Report 2011

CONSOLIDATED BALANCE SHEETSKurita Water Industries Ltd. and Consolidated Subsidiaries As of March 31, 2011 and 2010
Millions of yen
Thousands of U.S. dollars (Note 1)
Assets 2011 2010 2011
Current assets:
Cash and time deposits (Notes 3 and 4) . . . . . . . . . . . . . . . . . . . . . . . . . . . . . . . . . . . . . ¥ 35,073 ¥ 16,363 $ 422,567
Notes and accounts receivable, trade (Note 4) . . . . . . . . . . . . . . . . . . . . . . . . . . . . . . . 53,241 55,369 641,463
Allowance for doubtful accounts . . . . . . . . . . . . . . . . . . . . . . . . . . . . . . . . . . . . . . . . . . . . (40) (132) (491)
Marketable securities (Notes 4 and 5) . . . . . . . . . . . . . . . . . . . . . . . . . . . . . . . . . . . . . . . 20,000 28,500 240,963
Inventories (Note 6) . . . . . . . . . . . . . . . . . . . . . . . . . . . . . . . . . . . . . . . . . . . . . . . . . . . . . . 5,480 5,121 66,028
Deferred tax assets (Note 8) . . . . . . . . . . . . . . . . . . . . . . . . . . . . . . . . . . . . . . . . . . . . . . . 2,312 2,463 27,857
Other current assets . . . . . . . . . . . . . . . . . . . . . . . . . . . . . . . . . . . . . . . . . . . . . . . . . . . . . . 1,785 1,611 21,516
Total current assets . . . . . . . . . . . . . . . . . . . . . . . . . . . . . . . . . . . . . . . . . . . . . . . . . . . . . 117,852 109,297 1,419,905
Investments and long-term receivables:
Investment securities (Notes 4 and 5) . . . . . . . . . . . . . . . . . . . . . . . . . . . . . . . . . . . . . . . 15,987 14,443 192,616
Investments in unconsolidated subsidiaries and affiliates . . . . . . . . . . . . . . . . . . . . . . . . . 1,070 1,299 12,898
Deferred tax assets (Note 8) . . . . . . . . . . . . . . . . . . . . . . . . . . . . . . . . . . . . . . . . . . . . . . . 8,306 6,184 100,078
Other investments . . . . . . . . . . . . . . . . . . . . . . . . . . . . . . . . . . . . . . . . . . . . . . . . . . . . . . . . 1,717 1,926 20,694
Allowance for doubtful accounts . . . . . . . . . . . . . . . . . . . . . . . . . . . . . . . . . . . . . . . . . . . . (184) (205) (2,220)
Total investments and long-term receivables . . . . . . . . . . . . . . . . . . . . . . . . . . . . . . . . 26,897 23,649 324,067
Property, Plant and Equipment, at cost:
Land (Note 11) . . . . . . . . . . . . . . . . . . . . . . . . . . . . . . . . . . . . . . . . . . . . . . . . . . . . . . . . . . 14,072 13,981 169,546
Buildings and structures . . . . . . . . . . . . . . . . . . . . . . . . . . . . . . . . . . . . . . . . . . . . . . . . . . . 64,296 64,101 774,657
Machinery and equipment . . . . . . . . . . . . . . . . . . . . . . . . . . . . . . . . . . . . . . . . . . . . . . . . . 86,962 80,472 1,047,738
Construction in progress . . . . . . . . . . . . . . . . . . . . . . . . . . . . . . . . . . . . . . . . . . . . . . . . . . 3,001 5,273 36,164
Other facilities . . . . . . . . . . . . . . . . . . . . . . . . . . . . . . . . . . . . . . . . . . . . . . . . . . . . . . . . . . . 11,158 11,042 134,438
Leased assets . . . . . . . . . . . . . . . . . . . . . . . . . . . . . . . . . . . . . . . . . . . . . . . . . . . . . . . . . . . . 7,668 7,599 92,386
Total . . . . . . . . . . . . . . . . . . . . . . . . . . . . . . . . . . . . . . . . . . . . . . . . . . . . . . . . . . . . . . . . . 187,159 182,471 2,254,931
Accumulated depreciation . . . . . . . . . . . . . . . . . . . . . . . . . . . . . . . . . . . . . . . . . . . . . . . . . (80,550) (65,971) (970,488)
Property, plant and equipment, net . . . . . . . . . . . . . . . . . . . . . . . . . . . . . . . . . . . . . . . . 106,608 116,500 1,284,443
Intangible assets . . . . . . . . . . . . . . . . . . . . . . . . . . . . . . . . . . . . . . . . . . . . . . . . . . . . . . . . . . . . 1,939 2,173 23,373
Total assets . . . . . . . . . . . . . . . . . . . . . . . . . . . . . . . . . . . . . . . . . . . . . . . . . . . . . . . . . . . . ¥253,298 ¥251,620 $3,051,790
The accompanying notes are an integral part of these statements.
32 Kurita Water Industries Ltd. Annual Report 2011

Millions of yen
Thousands of U.S. dollars (Note 1)
Liabilities and Net Assets 2011 2010 2011
Current liabilities:
Short-term borrowings and current portion of long-term liabilities (Note 7) . . . . . . ¥ 1,607 ¥ 520 $ 19,363
Notes and accounts payable, trade (Note 4) . . . . . . . . . . . . . . . . . . . . . . . . . . . . . . . . . . 16,460 16,830 198,321
Accounts payable, other . . . . . . . . . . . . . . . . . . . . . . . . . . . . . . . . . . . . . . . . . . . . . . . . . . . 4,785 7,089 57,651
Income taxes payable . . . . . . . . . . . . . . . . . . . . . . . . . . . . . . . . . . . . . . . . . . . . . . . . . . . . . 5,626 7,430 67,794
Advances received . . . . . . . . . . . . . . . . . . . . . . . . . . . . . . . . . . . . . . . . . . . . . . . . . . . . . . . . 1,057 1,955 12,742
Accrued employees’ bonuses . . . . . . . . . . . . . . . . . . . . . . . . . . . . . . . . . . . . . . . . . . . . . . . 2,336 2,377 28,152
Provision for product warranties . . . . . . . . . . . . . . . . . . . . . . . . . . . . . . . . . . . . . . . . . . . . 927 546 11,172
Other current liabilities . . . . . . . . . . . . . . . . . . . . . . . . . . . . . . . . . . . . . . . . . . . . . . . . . . . . 1,969 1,841 23,730
Total current liabilities . . . . . . . . . . . . . . . . . . . . . . . . . . . . . . . . . . . . . . . . . . . . . . . . . . . 34,771 38,592 418,928
Long-term liabilities:
Lease obligations (Note 7) . . . . . . . . . . . . . . . . . . . . . . . . . . . . . . . . . . . . . . . . . . . . . . . . . 6,535 6,925 78,738
Accrued employees’ retirement benefits (Note 9) . . . . . . . . . . . . . . . . . . . . . . . . . . . . . 9,936 9,465 119,716
Accrued retirement benefits for directors and corporate auditors . . . . . . . . . . . . . . . 440 449 5,302
Deferred tax liabilities on revaluation of land (Note 11) . . . . . . . . . . . . . . . . . . . . . . . . 1,509 1,509 18,190
Other long-term liabilities (Note 7) . . . . . . . . . . . . . . . . . . . . . . . . . . . . . . . . . . . . . . . . . 754 737 9,086
Total long-term liabilities . . . . . . . . . . . . . . . . . . . . . . . . . . . . . . . . . . . . . . . . . . . . . . . . . 19,175 19,088 231,034
Total liabilities . . . . . . . . . . . . . . . . . . . . . . . . . . . . . . . . . . . . . . . . . . . . . . . . . . . . . . . . . . 53,946 57,680 649,963
Net assets:
Shareholders’ equity (Note 10):
Common stock, 2011 and 2010
Authorized: 531,000,000 shares
Issued: 2011—132,800,256 shares
2010—132,800,256 shares . . . . . . . . . . . . . . . . . . . . . . . . . . . . . . . . . . . . . . . . 13,450 13,450 162,057
Capital surplus . . . . . . . . . . . . . . . . . . . . . . . . . . . . . . . . . . . . . . . . . . . . . . . . . . . . . . . . . . . 11,426 11,426 137,672
Retained earnings . . . . . . . . . . . . . . . . . . . . . . . . . . . . . . . . . . . . . . . . . . . . . . . . . . . . . . . . 184,954 172,717 2,228,362
Treasury stock, at cost
2011—6,139,744 shares
2010—4,148,311 shares . . . . . . . . . . . . . . . . . . . . . . . . . . . . . . . . . . . . . . . . . . . . . . . . (9,640) (4,855) (116,147)
Total shareholders’ equity . . . . . . . . . . . . . . . . . . . . . . . . . . . . . . . . . . . . . . . . . . . . . . . . 200,191 192,738 2,411,944
Accumulated other comprehensive income:
Unrealized gains on available-for-sale securities . . . . . . . . . . . . . . . . . . . . . . . . . . . . . . . . 623 1,989 7,506
Unrealized losses on revaluation of land (Note 11) . . . . . . . . . . . . . . . . . . . . . . . . . . . . (764) (764) (9,213)
Foreign currency translation adjustments . . . . . . . . . . . . . . . . . . . . . . . . . . . . . . . . . . . . . (2,006) (1,374) (24,177)
Total accumulated other comprehensive income . . . . . . . . . . . . . . . . . . . . . . . . . . . . (2,148) (149) (25,885)
Minority interests . . . . . . . . . . . . . . . . . . . . . . . . . . . . . . . . . . . . . . . . . . . . . . . . . . . . . . . . . . 1,308 1,350 15,767
Total net assets . . . . . . . . . . . . . . . . . . . . . . . . . . . . . . . . . . . . . . . . . . . . . . . . . . . . . . . . 199,351 193,939 2,401,826
Liabilities and net assets . . . . . . . . . . . . . . . . . . . . . . . . . . . . . . . . . . . . . . . . . . . . . . . . . ¥253,298 ¥251,620 $3,051,790
33Kurita Water Industries Ltd. Annual Report 2011

CONSOLIDATED STATEMENTS OF INCOME AND CONSOLIDATED STATEMENTS OF COMPREHENSIVE INCOMEKurita Water Industries Ltd. and Consolidated Subsidiaries For the years ended March 31, 2011 and 2010
CONSOLIDATED STATEMENTS OF INCOME
Millions of Yen
Thousands of U.S. dollars (Note 1)
2011 2010 2011Net sales (Note 13) . . . . . . . . . . . . . . . . . . . . . . . . . . . . . . . . . . . . . . . . . . . . . . . . . . . . . . . . ¥181,234 ¥178,520 $2,183,550Cost of sales . . . . . . . . . . . . . . . . . . . . . . . . . . . . . . . . . . . . . . . . . . . . . . . . . . . . . . . . . . . . . . 118,573 117,221 1,428,600
Gross profit . . . . . . . . . . . . . . . . . . . . . . . . . . . . . . . . . . . . . . . . . . . . . . . . . . . . . . . . . . . . . 62,660 61,299 754,949
Selling, general and administrative expenses (Note 12) . . . . . . . . . . . . . . . . . . . . . . . . . . 35,528 34,941 428,059Operating income (Note 13) . . . . . . . . . . . . . . . . . . . . . . . . . . . . . . . . . . . . . . . . . . . . . . 27,131 26,358 326,889
Other income (expenses):Interest and dividend income . . . . . . . . . . . . . . . . . . . . . . . . . . . . . . . . . . . . . . . . . . . . . . . 424 331 5,116Interest expense . . . . . . . . . . . . . . . . . . . . . . . . . . . . . . . . . . . . . . . . . . . . . . . . . . . . . . . . . (34) (26) (411)Equity in earnings of unconsolidated subsidiaries and affiliates . . . . . . . . . . . . . . . . . . . 308 270 3,714Gain on liquidation due to termination of contracts . . . . . . . . . . . . . . . . . . . . . . . . . . . . — 1,507 —Loss on disposal of properties . . . . . . . . . . . . . . . . . . . . . . . . . . . . . . . . . . . . . . . . . . . . . . (28) (253) (343)Loss on disaster . . . . . . . . . . . . . . . . . . . . . . . . . . . . . . . . . . . . . . . . . . . . . . . . . . . . . . . . . . (124) — (1,504)Support expense of disaster restoration . . . . . . . . . . . . . . . . . . . . . . . . . . . . . . . . . . . . . (115) — (1,395)Other, net . . . . . . . . . . . . . . . . . . . . . . . . . . . . . . . . . . . . . . . . . . . . . . . . . . . . . . . . . . . . . . . 282 (9) 3,405Other income (expense), net . . . . . . . . . . . . . . . . . . . . . . . . . . . . . . . . . . . . . . . . . . . . . . . 712 1,820 8,580
Income before income taxes and minority interests . . . . . . . . . . . . . . . . . . . . . . . . . . . . 27,844 28,178 335,470
Income taxes (Note 8):Current . . . . . . . . . . . . . . . . . . . . . . . . . . . . . . . . . . . . . . . . . . . . . . . . . . . . . . . . . . . . . . . . . 11,653 12,197 140,406Deferred . . . . . . . . . . . . . . . . . . . . . . . . . . . . . . . . . . . . . . . . . . . . . . . . . . . . . . . . . . . . . . . . (1,069) (1,379) (12,888)Total income taxes . . . . . . . . . . . . . . . . . . . . . . . . . . . . . . . . . . . . . . . . . . . . . . . . . . . . . . . . 10,583 10,817 127,517
Income before minority interests . . . . . . . . . . . . . . . . . . . . . . . . . . . . . . . . . . . . . . . . . . . . 17,260 17,360 207,952
Minority interests in income . . . . . . . . . . . . . . . . . . . . . . . . . . . . . . . . . . . . . . . . . . . . . . . . . 121 72 1,468Net income . . . . . . . . . . . . . . . . . . . . . . . . . . . . . . . . . . . . . . . . . . . . . . . . . . . . . . . . . . . . . . . ¥ 17,138 ¥ 17,288 $ 206,483
CONSOLIDATED STATEMENTS OF COMPREHENSIVE INCOME
Millions of Yen
Thousands of U.S. dollars (Note 1)
2011 2010 2011Income before minority interests . . . . . . . . . . . . . . . . . . . . . . . . . . . . . . . . . . . . . . . . . . . . ¥17,260 ¥17,360 $207,952Other comprehensive income:
Unrealized gains (losses) on available-for-sale securities . . . . . . . . . . . . . . . . . . . . . . . . . (1,364) 1,817 (16,438)Foreign currency translation adjustments . . . . . . . . . . . . . . . . . . . . . . . . . . . . . . . . . . . . . (639) 574 (7,703)Share of other comprehensive income of associates accounted for using equity method . . . . . . . . . . . . . . . . . . . . . . . . . . . . . . . . . . . . . . . . . . . . . . . . . . . . . (46) 41 (560)
Total other comprehensive income . . . . . . . . . . . . . . . . . . . . . . . . . . . . . . . . . . . . . . . . . . (2,050) 2,434 (24,702)Comprehensive income . . . . . . . . . . . . . . . . . . . . . . . . . . . . . . . . . . . . . . . . . . . . . . . . . . . . . ¥15,209 ¥19,795 $183,250Comprehensive income attributable to
Comprehensive income attributable to owners of parent . . . . . . . . . . . . . . . . . . . . . . . ¥15,139 ¥19,682 $182,403Comprehensive income attributable to minority interests . . . . . . . . . . . . . . . . . . . . . . . 70 112 847
YenU.S. dollars (Note 1)
2011 2010 2011Per share of common stock:
Net income . . . . . . . . . . . . . . . . . . . . . . . . . . . . . . . . . . . . . . . . . . . . . . . . . . . . . . . . . . . . . ¥134.02 ¥134.38 $1.61Cash dividends applicable to the year . . . . . . . . . . . . . . . . . . . . . . . . . . . . . . . . . . . . . . . . 38.00 36.00 0.46
The accompanying notes are an integral part of these statements.
34 Kurita Water Industries Ltd. Annual Report 2011
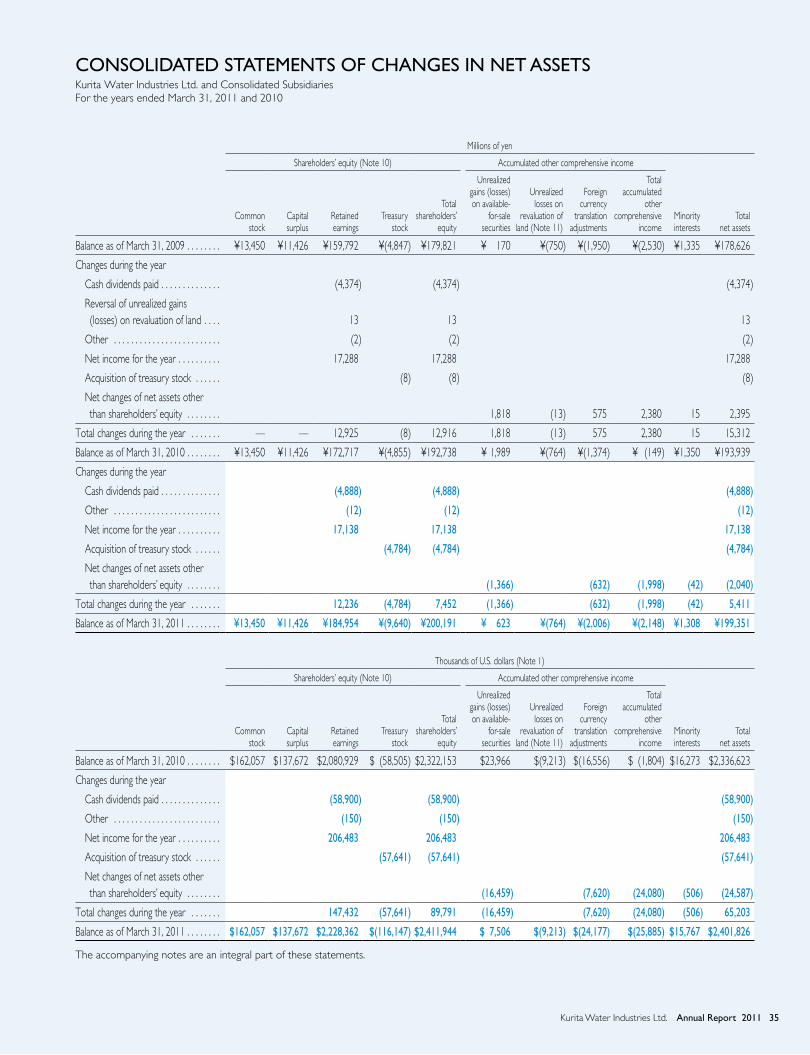
CONSOLIDATED STATEMENTS OF CHANGES IN NET ASSETSKurita Water Industries Ltd. and Consolidated Subsidiaries For the years ended March 31, 2011 and 2010
Millions of yen
Shareholders’ equity (Note 10) Accumulated other comprehensive income
Minority interests
Total net assets
Common stock
Capital surplus
Retained earnings
Treasury stock
Total shareholders’
equity
Unrealized gains (losses) on available-
for-sale securities
Unrealized losses on
revaluation of land (Note 11)
Foreign currency
translation adjustments
Total accumulated
other comprehensive
income
Balance as of March 31, 2009 . . . . . . . . ¥13,450 ¥11,426 ¥159,792 ¥(4,847) ¥179,821 ¥ 170 ¥(750) ¥(1,950) ¥(2,530) ¥1,335 ¥178,626
Changes during the year
Cash dividends paid . . . . . . . . . . . . . . (4,374) (4,374) (4,374)
Reversal of unrealized gains (losses) on revaluation of land . . . . 13 13 13
Other . . . . . . . . . . . . . . . . . . . . . . . . . (2) (2) (2)
Net income for the year . . . . . . . . . . 17,288 17,288 17,288
Acquisition of treasury stock . . . . . . (8) (8) (8)
Net changes of net assets other than shareholders’ equity . . . . . . . . 1,818 (13) 575 2,380 15 2,395
Total changes during the year . . . . . . . — — 12,925 (8) 12,916 1,818 (13) 575 2,380 15 15,312
Balance as of March 31, 2010 . . . . . . . . ¥13,450 ¥11,426 ¥172,717 ¥(4,855) ¥192,738 ¥ 1,989 ¥(764) ¥(1,374) ¥ (149) ¥1,350 ¥193,939
Changes during the year
Cash dividends paid . . . . . . . . . . . . . . (4,888) (4,888) (4,888)
Other . . . . . . . . . . . . . . . . . . . . . . . . . (12) (12) (12)
Net income for the year . . . . . . . . . . 17,138 17,138 17,138
Acquisition of treasury stock . . . . . . (4,784) (4,784) (4,784)
Net changes of net assets other than shareholders’ equity . . . . . . . . (1,366) (632) (1,998) (42) (2,040)
Total changes during the year . . . . . . . 12,236 (4,784) 7,452 (1,366) (632) (1,998) (42) 5,411
Balance as of March 31, 2011 . . . . . . . . ¥13,450 ¥11,426 ¥184,954 ¥(9,640) ¥200,191 ¥ 623 ¥(764) ¥(2,006) ¥(2,148) ¥1,308 ¥199,351
Thousands of U.S. dollars (Note 1)
Shareholders’ equity (Note 10) Accumulated other comprehensive income
Minority interests
Total net assets
Common stock
Capital surplus
Retained earnings
Treasury stock
Total shareholders’
equity
Unrealized gains (losses) on available-
for-sale securities
Unrealized losses on
revaluation of land (Note 11)
Foreign currency
translation adjustments
Total accumulated
other comprehensive
income
Balance as of March 31, 2010 . . . . . . . . $162,057 $137,672 $2,080,929 $ (58,505) $2,322,153 $23,966 $(9,213) $(16,556) $ (1,804) $16,273 $2,336,623
Changes during the year
Cash dividends paid . . . . . . . . . . . . . . (58,900) (58,900) (58,900)
Other . . . . . . . . . . . . . . . . . . . . . . . . . (150) (150) (150)
Net income for the year . . . . . . . . . . 206,483 206,483 206,483
Acquisition of treasury stock . . . . . . (57,641) (57,641) (57,641)
Net changes of net assets other than shareholders’ equity . . . . . . . . (16,459) (7,620) (24,080) (506) (24,587)
Total changes during the year . . . . . . . 147,432 (57,641) 89,791 (16,459) (7,620) (24,080) (506) 65,203
Balance as of March 31, 2011 . . . . . . . . $162,057 $137,672 $2,228,362 $(116,147) $2,411,944 $ 7,506 $(9,213) $(24,177) $(25,885) $15,767 $2,401,826
The accompanying notes are an integral part of these statements.
35Kurita Water Industries Ltd. Annual Report 2011

CONSOLIDATED STATEMENTS OF CASH FLOWSKurita Water Industries Ltd. and Consolidated Subsidiaries For the years ended March 31, 2011 and 2010
Millions of yen
Thousands of U.S. dollars (Note 1)
2011 2010 2011
I. Cash flows from operating activitiesIncome before income taxes and minority interests . . . . . . . . . . . . . . . . . . . . . . . . . . . . ¥ 27,844 ¥ 28,178 $ 335,470Depreciation and amortization (Note 13) . . . . . . . . . . . . . . . . . . . . . . . . . . . . . . . . . . . . 16,066 15,523 193,571Increase (decrease) in accrued employees’ retirement benefits . . . . . . . . . . . . . . . . . . 455 799 5,490Increase (decrease) in other allowances . . . . . . . . . . . . . . . . . . . . . . . . . . . . . . . . . . . . . . 225 (645) 2,714Equity in earnings of unconsolidated subsidiaries and affiliates . . . . . . . . . . . . . . . . . . . (308) (270) (3,714)Interest and dividend income . . . . . . . . . . . . . . . . . . . . . . . . . . . . . . . . . . . . . . . . . . . . . . . (424) (331) (5,116)Interest expense . . . . . . . . . . . . . . . . . . . . . . . . . . . . . . . . . . . . . . . . . . . . . . . . . . . . . . . . . 34 26 411Loss (gain) on sales and disposal of properties . . . . . . . . . . . . . . . . . . . . . . . . . . . . . . . . 18 245 224Changes in assets and liabilities:
Decrease (increase) in trade receivables . . . . . . . . . . . . . . . . . . . . . . . . . . . . . . . . . . . 1,213 3,473 14,625Decrease (increase) in inventories . . . . . . . . . . . . . . . . . . . . . . . . . . . . . . . . . . . . . . . . (461) 2,194 (5,565)Increase (decrease) in trade payables . . . . . . . . . . . . . . . . . . . . . . . . . . . . . . . . . . . . . . (573) (1,936) (6,907)Decrease (increase) in other assets . . . . . . . . . . . . . . . . . . . . . . . . . . . . . . . . . . . . . . . (350) (230) (4,228)Increase (decrease) in other liability . . . . . . . . . . . . . . . . . . . . . . . . . . . . . . . . . . . . . . . (1,430) 1,945 (17,236)
Others, net . . . . . . . . . . . . . . . . . . . . . . . . . . . . . . . . . . . . . . . . . . . . . . . . . . . . . . . . . . . . . . 182 (1,386) 2,19542,490 47,586 511,936
Interest and dividends received . . . . . . . . . . . . . . . . . . . . . . . . . . . . . . . . . . . . . . . . . . . . . . . 703 685 8,470Interest paid . . . . . . . . . . . . . . . . . . . . . . . . . . . . . . . . . . . . . . . . . . . . . . . . . . . . . . . . . . . . . . . (33) (38) (405)Income taxes paid . . . . . . . . . . . . . . . . . . . . . . . . . . . . . . . . . . . . . . . . . . . . . . . . . . . . . . . . . . (13,371) (8,209) (161,107)Others, net . . . . . . . . . . . . . . . . . . . . . . . . . . . . . . . . . . . . . . . . . . . . . . . . . . . . . . . . . . . . . . . . 8 3,621 101
Net cash provided by operating activities . . . . . . . . . . . . . . . . . . . . . . . . . . . . . . . . . . . . . 29,796 43,644 358,994
II. Cash flows from investing activitiesDecrease (increase) in time deposits, net . . . . . . . . . . . . . . . . . . . . . . . . . . . . . . . . . . . . . (23,987) 770 (289,006)Payments for purchase of property, plant and equipment . . . . . . . . . . . . . . . . . . . . . . . (6,014) (19,278) (72,461)Proceeds from sale of property, plant and equipment . . . . . . . . . . . . . . . . . . . . . . . . . . 30 56 367Payments for purchase of marketable securities and investment securities . . . . . . . . . (68,810) (30,108) (829,036)Proceeds from sale and redemption of marketable securities and investment securities . . . 69,050 4,870 831,929Others, net . . . . . . . . . . . . . . . . . . . . . . . . . . . . . . . . . . . . . . . . . . . . . . . . . . . . . . . . . . . . . . (438) (661) (5,285)
Net cash used in investing activities . . . . . . . . . . . . . . . . . . . . . . . . . . . . . . . . . . . . . . . (30,169) (44,350) (363,492)
III. Cash flows from financing activitiesIncrease (decrease) in short-term borrowings, net . . . . . . . . . . . . . . . . . . . . . . . . . . . . . 1,183 67 14,254Cash dividends paid . . . . . . . . . . . . . . . . . . . . . . . . . . . . . . . . . . . . . . . . . . . . . . . . . . . . . . . (4,886) (4,369) (58,872)Cash dividends paid to minority shareholders of consolidated subsidiaries . . . . . . . . . (64) (96) (771)Payments for lease obligations . . . . . . . . . . . . . . . . . . . . . . . . . . . . . . . . . . . . . . . . . . . . . . (480) (451) (5,792)Payments for purchase of treasury stock, net . . . . . . . . . . . . . . . . . . . . . . . . . . . . . . . . . . (4,784) (8) (57,641)
Net cash used in financing activities . . . . . . . . . . . . . . . . . . . . . . . . . . . . . . . . . . . . . . . (9,032) (4,859) (108,822)
IV. Effect of exchange rate changes on cash and cash equivalents . . . . . . . . . . . . . . . . (397) 832 (4,787)V. Net decrease in cash and cash equivalents . . . . . . . . . . . . . . . . . . . . . . . . . . . . . . . . . (9,802) (4,732) (118,107)VI. Cash and cash equivalents at beginning of year . . . . . . . . . . . . . . . . . . . . . . . . . . . . . 20,590 25,262 248,080VII. Cash and cash equivalents of newly consolidated subsidiaries,
net of excluded subsidiaries from consolidation . . . . . . . . . . . . . . . . . . . . . . . . . . . 46 60 560VIII. Cash and cash equivalents at end of year (Note 3) . . . . . . . . . . . . . . . . . . . . . . . . . ¥ 10,834 ¥ 20,590 $ 130,532
The accompanying notes are an integral part of these statements.
36 Kurita Water Industries Ltd. Annual Report 2011

NOTES TO CONSOLIDATED FINANCIAL STATEMENTSKurita Water Industries Ltd. and Consolidated Subsidiaries.
1. Basis of presentation of consolidated financial statements
Kurita Water Industries Ltd. (the “Company”) and its domestic subsidiaries maintain their books of account and prepare their financial statements in accordance with accounting principles and practices generally accepted in Japan, while its foreign subsidiaries maintain their books of account and prepare their financial statements in conformity with those of the countries of their domicile. Certain accounting principles and practices generally accepted in Japan are different from International Financial Reporting Standards and standards in other countries in certain respects as to application and disclosure requirements. Accordingly, the accompanying consolidated financial statements are intended for use by those who are informed about Japanese accounting principles and practices.
The Company’s consolidated financial statements, prepared in accordance with accounting principles and practices generally accepted in Japan, were originally filed with the Japanese Ministry of Finance and the Tokyo Stock Exchange as required by the Financial Instruments and Exchange Law of Japan.
Certain reclassifications of accounts and modifications have been made in the accompanying consoli-dated financial statements to facilitate understanding by readers outside Japan. In addition, certain reclas-sifications have been made in the 2010 financial statements to conform to the classification used in 2011.
All figures in the consolidated financial statements and notes are stated in millions of Japanese yen by discarding fractional amounts of less than ¥1 million. As a result, the totals shown in the consolidated financial statements and notes in yen do not necessarily agree with the sum of the individual amounts.
The translation of yen amounts as of or for the year ended March 31, 2011 into U.S. dollars is included solely for the convenience of readers and has been made, as a matter of arithmetical computa-tion only, at the rate of ¥83 to US$1, the prevailing rate on the Tokyo Foreign Exchange Market on March 31, 2011. The translation should not be construed as a representation that yen amounts have been, could have been or could in the future be converted into U.S. dollars at the above or any other rate.
2. Significant accounting policies
(1) ConsolidationScope of consolidationThe consolidated financial statements included the accounts of the Company and its significant subsidiar-ies (together, the “Group”). For the years ended March 31, 2011 and 2010, 37 subsidiaries were consoli-dated, respectively.
Under the control concept, those companies in which the Company, directly or indirectly, is able to exercise control over operations are fully consolidated.
All significant inter-company transactions and balances have been eliminated in consolidation.Names of principal consolidated subsidiaries: Kuritaz Co., Ltd. Kurita Engineering Co., Ltd. Kuritec Service Co. Ltd. Kurita Chemical Manufacturing Ltd.In the year ended March 31, 2011, Kurita Chemical Hokuriku Co., Ltd., which increased its materiality,
was newly consolidated, and one foreign subsidiary, which was liquidated, was excluded from consolidation.
Fiscal years of consolidated subsidiariesThe fiscal years of Kurita (Singapore) Pte. Ltd. and 12 other consolidated subsidiaries (14 in 2010) end on December 31. For these consolidated subsidiaries, the financial statements as of December 31 were used for consolidation purposes. However, material transactions that have occurred during the three-month period from January 1 to March 31 of the following year have been adjusted as necessary for consolidation.
37Kurita Water Industries Ltd. Annual Report 2011
Amortization of goodwillGoodwill is amortized using the straight-line method over practically estimated effective years where applicable, or otherwise, three years, except for minor amounts that are charged to income in the period of acquisition.
(2) Equity methodScope of equity method applicationUnder the influence concept, significant investments in unconsolidated subsidiaries and affiliates over which the Company has the ability to exercise significant influence with regard to the operating and financial policies of the investees are accounted for by the equity method. For the years ended March 31, 2011 and 2010, 3 companies were accounted for by the equity method.
Name of principal company applying the equity method: Kurita Sogo Service Co., Ltd.Investments in the remaining unconsolidated subsidiaries and affiliates were stated at cost. If the equity
method of accounting had been applied to the investments in these companies, the effect on the accom-panying consolidated financial statements would not be material.
Fiscal years of companies accounted for by the equity methodAdjustments were made to the financial statements of the companies accounted for by the equity method whose fiscal year-ends were not identical to the Company.
(3) Cash and cash equivalentsCash and cash equivalents in the consolidated statements of cash flows are composed of cash on hand, readily available bank deposits, and short-term investments with an original maturity of three months or less and subject to a minor risk of fluctuations in value.
(4) Available-for-sale securitiesAvailable-for-sale securities that have available fair values are stated at fair value at the balance sheet date, with resulting unrealized holding gains and losses reported as a separate component of net assets. Available-for-sale securities with no available fair values are stated at cost computed by the moving- average method. The cost of sold securities is computed by the moving-average method.
(5) InventoriesInventories held for sale in the ordinary course of business are stated at the lower of cost determined by the moving average method, except for work in process determined by the specific-identification method, or net selling value.
(6) Derivative transactionsDerivative transactions utilized by the Group are composed of only forward currency contracts entered into when necessary to hedge the risk, as the Company maintains the policy not to engage in speculative transactions. The Company believes that the risk of counterparty default is negligible because its forward currency contracts are entered into only with banks with high credit ratings. In addition, transactions in forward currency contracts are executed and managed by the finance and accounting department on a contract-by-contract basis after they have been approval by prescribed internal procedures.
(7) Depreciation of property, plant and equipmentProperty, plant and equipment is depreciated by the declining-balance method for the Company and its domestic consolidated subsidiaries, expect for buildings (other than building equipment) acquired on and
38 Kurita Water Industries Ltd. Annual Report 2011
after April 1, 1998, and ultrapure water supply equipment located at the clients’ sites, for which the straight-line method is applied. The straight-line method is applied by foreign consolidated subsidiaries.
The estimated useful lives of these assets are as follows: Buildings and structures 2–65 years Machinery and equipment 4–10 years
(8) Impairment of long-lived assetsThe Company reviews its long-lived assets for impairment in accordance with the accounting standards for impairment of fixed assets whenever events or changes in circumstances indicate the carrying amount of an asset or asset group may not be recoverable. An impairment loss would be recognized if the carrying amount of an asset or asset group exceeds the sum of the undiscounted future cash flows expected to result from the continued use and eventual disposition of the asset or asset group. The impairment loss would be measured as the amount by which the carrying amount of the asset exceeds its recoverable amount, which is the higher of the discounted cash flows from the continued use and eventual disposition of the asset or the net selling price at disposition.
(9) Accrued employees’ bonusesThe Company and its domestic consolidated subsidiaries accrue the amount of employees’ bonuses based on the anticipated bonus payments to employees.
(10) Accrued employees’ retirement benefitsAccrued employees’ retirement benefits are recorded based on the estimated amount of projected benefit obligation at the balance sheet date by the Company, certain of its domestic consolidated subsidiaries and certain consolidated foreign subsidiaries, and based on the estimated amounts of projected benefit obligation and pension plan assets, at the balance sheet date by other domestic consolidated subsidiaries. Actuarial differences are subject to amortization over a period of 1–2 years from the year when they are incurred.
(11) LeasesFinance leases which do not transfer ownership are capitalized to recognize leased assets and lease obliga-tions in the consolidated balance sheets. Leased assets are depreciated using the straight-line method over the respective lease periods without residual value.
(12) Consumption taxesConsumption taxes are accounted for separately from transaction prices and are not reflected in the consolidated statements of income.
(13) Construction contractsThe percentage-of-completion method has been applied to the contracts if the outcome of the construc-tion activity is deemed certain for the percentage of performance of the contractor’s obligation at the end of the balance sheet date and otherwise, the completed-contract method is applied. The percentage of completion is determined using the cost incurred to the estimated total cost.
(14) Foreign currency translationMonetary receivables and payables denominated in foreign currency are translated using the spot exchange rate prevailing at the balance sheet date, and the differences are charged to income as foreign exchange gains or losses.
Foreign subsidiaries’ assets and liabilities are translated using the spot exchange rate at their balance sheet date, and their income and expenses are translated using the average exchange rate during the year.
39Kurita Water Industries Ltd. Annual Report 2011
The translation differences are recorded in “Foreign currency translation adjustments” and “Minority inter-ests” in net assets.
(15) Appropriation of retained earningsThe accompanying consolidated statements of changes in net assets reflect the appropriations of retained earnings of the Company in the fiscal year in which the appropriations are approved at the general share-holders’ meeting.
(16) Earnings per shareEarnings per share are computed using the weighted-average number of common shares outstanding.
(17) Additional informationEffective the fiscal year ended March 31, 2011, the Group adopted the “Accounting Standard for Presen-tation of Comprehensive Income” (ASBJ Statement No. 25, June 30, 2010). The amounts of “Valuation and translation adjustments” and “Total valuation and translation adjustments” of the previous fiscal year are shown as those of “Accumulated other comprehensive income” and “Total accumulated other com-prehensive income.”
3. Reconciliation between cash and cash equivalents
The reconciliation between the fiscal year-end cash and cash equivalents (See Note 2 (3)) in the con-solidated statements of cash flows and cash and time deposits in the consolidated balance sheet items is as follows:
Millions of yen
Thousands of U.S. dollars (Note 1)
For the years ended March 31 2011 2010 2011
Cash and time deposits . . . . . . . . . . . . . . . . . . . . . . . . . . . . . . . . . ¥ 35,073 ¥16,363 $ 422,567Time deposits with original maturity of more than three months . . . . . . . . . . . . . . . . . . . . . . . . . . . . . . . . . . . . . . . . (24,238) (272) (292,035)
Certificates of deposits included in marketable securities, excluding deposits maturing over three months . . . . . . . . . . . — 4,500 —
Cash and cash equivalents . . . . . . . . . . . . . . . . . . . . . . . . . . . . . . ¥ 10,834 ¥20,590 $ 130,532
4. Financial instruments and related disclosures
On March 10, 2008, the ASBJ revised ASBJ Statement No. 10 “Accounting Standard for Financial Instru-ments” and issued ASBJ Guidance No. 19 “Guidance on Accounting Standard for Financial Instruments and Related Disclosures.” The Company applied the revised accounting standard and the new guidance effec-tive March 31, 2010.
(1) Policy for financial instrumentsThe Group invests its funds in low risk financial assets (deposits, etc.) in principle. The Group finances its working fund and capital investment fund internally and does not need external funds, but may raise nec-essary funds from external resources in case of special demand for significant capital investment, if any. In such cases, financing from external resources would be possible without any problem thanks to our sound financial position. With respect to derivatives, only forward foreign currency contracts are used if necessary to avoid foreign exchange risk, and not for speculative purposes.
40 Kurita Water Industries Ltd. Annual Report 2011
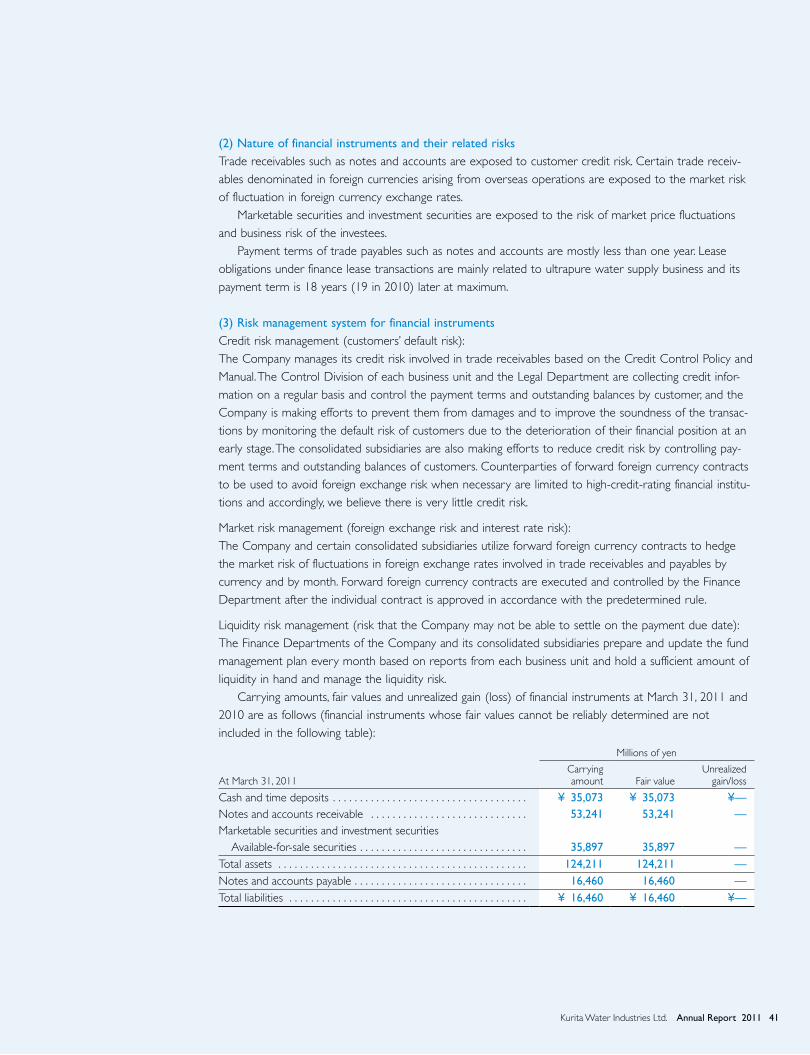
(2) Nature of financial instruments and their related risksTrade receivables such as notes and accounts are exposed to customer credit risk. Certain trade receiv-ables denominated in foreign currencies arising from overseas operations are exposed to the market risk of fluctuation in foreign currency exchange rates.
Marketable securities and investment securities are exposed to the risk of market price fluctuations and business risk of the investees.
Payment terms of trade payables such as notes and accounts are mostly less than one year. Lease obligations under finance lease transactions are mainly related to ultrapure water supply business and its payment term is 18 years (19 in 2010) later at maximum.
(3) Risk management system for financial instrumentsCredit risk management (customers’ default risk):The Company manages its credit risk involved in trade receivables based on the Credit Control Policy and Manual. The Control Division of each business unit and the Legal Department are collecting credit infor-mation on a regular basis and control the payment terms and outstanding balances by customer, and the Company is making efforts to prevent them from damages and to improve the soundness of the transac-tions by monitoring the default risk of customers due to the deterioration of their financial position at an early stage. The consolidated subsidiaries are also making efforts to reduce credit risk by controlling pay-ment terms and outstanding balances of customers. Counterparties of forward foreign currency contracts to be used to avoid foreign exchange risk when necessary are limited to high-credit-rating financial institu-tions and accordingly, we believe there is very little credit risk.
Market risk management (foreign exchange risk and interest rate risk):The Company and certain consolidated subsidiaries utilize forward foreign currency contracts to hedge the market risk of fluctuations in foreign exchange rates involved in trade receivables and payables by currency and by month. Forward foreign currency contracts are executed and controlled by the Finance Department after the individual contract is approved in accordance with the predetermined rule.
Liquidity risk management (risk that the Company may not be able to settle on the payment due date):The Finance Departments of the Company and its consolidated subsidiaries prepare and update the fund management plan every month based on reports from each business unit and hold a sufficient amount of liquidity in hand and manage the liquidity risk.
Carrying amounts, fair values and unrealized gain (loss) of financial instruments at March 31, 2011 and 2010 are as follows (financial instruments whose fair values cannot be reliably determined are not included in the following table):
Millions of yen
At March 31, 2011Carrying amount Fair value
Unrealized gain/loss
Cash and time deposits . . . . . . . . . . . . . . . . . . . . . . . . . . . . . . . . . . . . ¥ 35,073 ¥ 35,073 ¥—Notes and accounts receivable . . . . . . . . . . . . . . . . . . . . . . . . . . . . . 53,241 53,241 —Marketable securities and investment securities
Available-for-sale securities . . . . . . . . . . . . . . . . . . . . . . . . . . . . . . . 35,897 35,897 —Total assets . . . . . . . . . . . . . . . . . . . . . . . . . . . . . . . . . . . . . . . . . . . . . . 124,211 124,211 —Notes and accounts payable . . . . . . . . . . . . . . . . . . . . . . . . . . . . . . . . 16,460 16,460 —Total liabilities . . . . . . . . . . . . . . . . . . . . . . . . . . . . . . . . . . . . . . . . . . . . ¥ 16,460 ¥ 16,460 ¥—
41Kurita Water Industries Ltd. Annual Report 2011
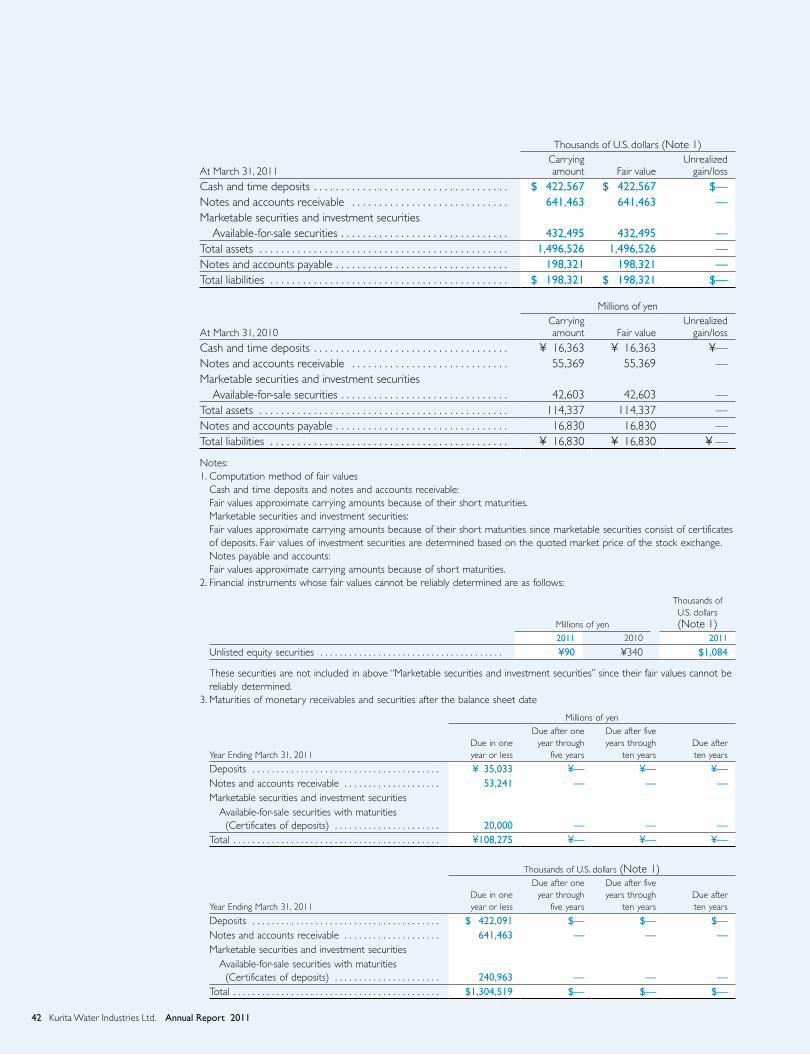
Thousands of U.S. dollars (Note 1)
At March 31, 2011Carrying amount Fair value
Unrealized gain/loss
Cash and time deposits . . . . . . . . . . . . . . . . . . . . . . . . . . . . . . . . . . . . $ 422,567 $ 422,567 $—Notes and accounts receivable . . . . . . . . . . . . . . . . . . . . . . . . . . . . . 641,463 641,463 —Marketable securities and investment securities
Available-for-sale securities . . . . . . . . . . . . . . . . . . . . . . . . . . . . . . . 432,495 432,495 —Total assets . . . . . . . . . . . . . . . . . . . . . . . . . . . . . . . . . . . . . . . . . . . . . . 1,496,526 1,496,526 —Notes and accounts payable . . . . . . . . . . . . . . . . . . . . . . . . . . . . . . . . 198,321 198,321 —Total liabilities . . . . . . . . . . . . . . . . . . . . . . . . . . . . . . . . . . . . . . . . . . . . $ 198,321 $ 198,321 $—
Millions of yen
At March 31, 2010Carrying amount Fair value
Unrealized gain/loss
Cash and time deposits . . . . . . . . . . . . . . . . . . . . . . . . . . . . . . . . . . . . ¥ 16,363 ¥ 16,363 ¥—Notes and accounts receivable . . . . . . . . . . . . . . . . . . . . . . . . . . . . . 55,369 55,369 —Marketable securities and investment securities
Available-for-sale securities . . . . . . . . . . . . . . . . . . . . . . . . . . . . . . . 42,603 42,603 —Total assets . . . . . . . . . . . . . . . . . . . . . . . . . . . . . . . . . . . . . . . . . . . . . . 114,337 114,337 —Notes and accounts payable . . . . . . . . . . . . . . . . . . . . . . . . . . . . . . . . 16,830 16,830 —Total liabilities . . . . . . . . . . . . . . . . . . . . . . . . . . . . . . . . . . . . . . . . . . . . ¥ 16,830 ¥ 16,830 ¥ —
Notes:1. Computation method of fair values Cash and time deposits and notes and accounts receivable: Fair values approximate carrying amounts because of their short maturities. Marketable securities and investment securities: Fair values approximate carrying amounts because of their short maturities since marketable securities consist of certificates
of deposits. Fair values of investment securities are determined based on the quoted market price of the stock exchange. Notes payable and accounts: Fair values approximate carrying amounts because of short maturities.2. Financial instruments whose fair values cannot be reliably determined are as follows:
Millions of yen
Thousands of U.S. dollars(Note 1)
2011 2010 2011
Unlisted equity securities . . . . . . . . . . . . . . . . . . . . . . . . . . . . . . . . . . . . . . ¥90 ¥340 $1,084
These securities are not included in above “Marketable securities and investment securities” since their fair values cannot be reliably determined.
3. Maturities of monetary receivables and securities after the balance sheet date
Millions of yen
Year Ending March 31, 2011Due in one year or less
Due after one year through
five years
Due after five years through
ten yearsDue after ten years
Deposits . . . . . . . . . . . . . . . . . . . . . . . . . . . . . . . . . . . . . . . ¥ 35,033 ¥— ¥— ¥—Notes and accounts receivable . . . . . . . . . . . . . . . . . . . . 53,241 — — —Marketable securities and investment securities Available-for-sale securities with maturities (Certificates of deposits) . . . . . . . . . . . . . . . . . . . . . . 20,000 — — —Total . . . . . . . . . . . . . . . . . . . . . . . . . . . . . . . . . . . . . . . . . . . ¥108,275 ¥— ¥— ¥—
Thousands of U.S. dollars (Note 1)
Year Ending March 31, 2011Due in one year or less
Due after one year through
five years
Due after five years through
ten yearsDue after ten years
Deposits . . . . . . . . . . . . . . . . . . . . . . . . . . . . . . . . . . . . . . . $ 422,091 $— $— $—Notes and accounts receivable . . . . . . . . . . . . . . . . . . . . 641,463 — — —Marketable securities and investment securities Available-for-sale securities with maturities (Certificates of deposits) . . . . . . . . . . . . . . . . . . . . . . 240,963 — — —Total . . . . . . . . . . . . . . . . . . . . . . . . . . . . . . . . . . . . . . . . . . . $1,304,519 $— $— $—
42 Kurita Water Industries Ltd. Annual Report 2011

5. Marketable securities and investment in securities
(1) Available-for-sale securities with fair value at March 31, 2011 and 2010 are summarized as follows:
Millions of yen
At March 31, 2011Carrying amount
Acquisition cost Difference
Carrying amount exceeding acquisition cost:Stocks . . . . . . . . . . . . . . . . . . . . . . . . . . . . . . . . . . . . . . . . . . . . . . . . ¥ 7,197 ¥ 5,076 ¥ 2,121Bonds:
Corporate bonds . . . . . . . . . . . . . . . . . . . . . . . . . . . . . . . . . . . . — — —Other . . . . . . . . . . . . . . . . . . . . . . . . . . . . . . . . . . . . . . . . . . . . . . — — —
Subtotal . . . . . . . . . . . . . . . . . . . . . . . . . . . . . . . . . . . . . . . . . . 7,197 5,076 2,121Carrying amount not exceeding acquisition cost:
Stocks . . . . . . . . . . . . . . . . . . . . . . . . . . . . . . . . . . . . . . . . . . . . . . . . 8,699 10,024 (1,325)Bonds:
Corporate bonds . . . . . . . . . . . . . . . . . . . . . . . . . . . . . . . . . . . . — — —Other . . . . . . . . . . . . . . . . . . . . . . . . . . . . . . . . . . . . . . . . . . . . . . — — —
Subtotal . . . . . . . . . . . . . . . . . . . . . . . . . . . . . . . . . . . . . . . . . . 8,699 10,024 (1,325)Total . . . . . . . . . . . . . . . . . . . . . . . . . . . . . . . . . . . . . . . . . . . . . . . ¥15,897 ¥15,100 ¥ 796
Millions of yen
At March 31, 2010Carrying amount
Acquisition cost Difference
Carrying amount exceeding acquisition cost:Stocks . . . . . . . . . . . . . . . . . . . . . . . . . . . . . . . . . . . . . . . . . . . . . . . . ¥10,839 ¥ 7,413 ¥3,425Bonds:
Corporate bonds . . . . . . . . . . . . . . . . . . . . . . . . . . . . . . . . . . . . — — —Other . . . . . . . . . . . . . . . . . . . . . . . . . . . . . . . . . . . . . . . . . . . . . . — — —
Subtotal . . . . . . . . . . . . . . . . . . . . . . . . . . . . . . . . . . . . . . . . . . 10,839 7,413 3,425Carrying amount not exceeding acquisition cost:
Stocks . . . . . . . . . . . . . . . . . . . . . . . . . . . . . . . . . . . . . . . . . . . . . . . . 3,264 3,657 (392)Bonds:
Corporate bonds . . . . . . . . . . . . . . . . . . . . . . . . . . . . . . . . . . . . — — —Other . . . . . . . . . . . . . . . . . . . . . . . . . . . . . . . . . . . . . . . . . . . . . . — — —
Subtotal . . . . . . . . . . . . . . . . . . . . . . . . . . . . . . . . . . . . . . . . . . 3,264 3,657 (392)Total . . . . . . . . . . . . . . . . . . . . . . . . . . . . . . . . . . . . . . . . . . . . . . . ¥14,103 ¥11,071 ¥3,032
Thousands of U.S. dollars (Note 1)
At March 31, 2011Carrying amount
Acquisition cost Difference
Carrying amount exceeding acquisition cost:Stocks . . . . . . . . . . . . . . . . . . . . . . . . . . . . . . . . . . . . . . . . . . . . . . . . $ 86,722 $ 61,156 $ 25,565Bonds:
Corporate bonds . . . . . . . . . . . . . . . . . . . . . . . . . . . . . . . . . . . . — — —Other . . . . . . . . . . . . . . . . . . . . . . . . . . . . . . . . . . . . . . . . . . . . . . — — —
Subtotal . . . . . . . . . . . . . . . . . . . . . . . . . . . . . . . . . . . . . . . . . . 86,722 61,156 25,565Carrying amount not exceeding acquisition cost:
Stocks . . . . . . . . . . . . . . . . . . . . . . . . . . . . . . . . . . . . . . . . . . . . . . . . 104,809 120,780 (15,970)Bonds:
Corporate bonds . . . . . . . . . . . . . . . . . . . . . . . . . . . . . . . . . . . . — — —Other . . . . . . . . . . . . . . . . . . . . . . . . . . . . . . . . . . . . . . . . . . . . . . — — —
Subtotal . . . . . . . . . . . . . . . . . . . . . . . . . . . . . . . . . . . . . . . . . . 104,809 120,780 (15,970)Total . . . . . . . . . . . . . . . . . . . . . . . . . . . . . . . . . . . . . . . . . . . . . . . $191,531 $181,936 $ 9,594
43Kurita Water Industries Ltd. Annual Report 2011

(2) Available-for-sale securities sold during the years ended March 31, 2011 and 2010 are summarized as follows:
Millions of yen
Thousands of U.S. dollars(Note 1)
2011 2010 2011
Sales amount . . . . . . . . . . . . . . . . . . . . . . . . . . . . . . . . . . . . . . . . . ¥50 ¥70 $603Total gains on sales . . . . . . . . . . . . . . . . . . . . . . . . . . . . . . . . . . . . . 26 16 324Total losses on sales . . . . . . . . . . . . . . . . . . . . . . . . . . . . . . . . . . . . — 0 —
6. Inventories
Inventories at March 31, 2011 and 2010 consist of the following:
Millions of yen
Thousands of U.S. dollars(Note 1)
2011 2010 2011
Finished products . . . . . . . . . . . . . . . . . . . . . . . . . . . . . . . . . . . . . . ¥1,303 ¥1,334 $15,704Raw materials . . . . . . . . . . . . . . . . . . . . . . . . . . . . . . . . . . . . . . . . . 1,533 1,186 18,473Work in process . . . . . . . . . . . . . . . . . . . . . . . . . . . . . . . . . . . . . . . 2,643 2,600 31,849
Total . . . . . . . . . . . . . . . . . . . . . . . . . . . . . . . . . . . . . . . . . . . . . . ¥5,480 ¥5,121 $66,028
7. Short-term borrowings and lease obligations
(1) Short-term borrowings and current portion of lease obligationsThe short-term borrowings and current portion of lease obligations at March 31, 2011 and 2010 consist of the following:
Millions of yen
Thousands of U.S. dollars(Note 1)
2011 2010 2011
Short-term borrowings . . . . . . . . . . . . . . . . . . . . . . . . . . . . . . . . . ¥1,128 ¥ 67 $13,594Current portion of lease obligations . . . . . . . . . . . . . . . . . . . . . . 478 453 5,768
Total . . . . . . . . . . . . . . . . . . . . . . . . . . . . . . . . . . . . . . . . . . . . . . ¥1,607 ¥520 $19,363
The weighted-average annual interest rate of short-term borrowings for the year ended March 31, 2011 and 2010 were 3.92% and 4.37%, respectively.
(2) Lease obligationsLease obligations at March 31, 2011 and 2010 are summarized as follows:
Millions of yen
Thousands of U.S. dollars(Note 1)
2011 2010 2011
Lease obligations . . . . . . . . . . . . . . . . . . . . . . . . . . . . . . . . . . . . . . ¥7,014 ¥7,378 $84,506Less current portion of lease obligations . . . . . . . . . . . . . . . . . . 478 453 5,768Lease obligations with maturing dates coming in 2013 and thereafter . . . . . . . . . . . . . . . . . . . . . . . . . . . . . . . . . . . . . . . . ¥6,535 ¥6,925 $78,738
Annual maturities of lease obligations at March 31, 2011 are as follows:
Years Ending March 31 Millions of yen
Thousands of U.S. dollars(Note 1)
2012 . . . . . . . . . . . . . . . . . . . . . . . . . . . . . . . . . . . . . . . . . . . . . . . . . . . . . . . . . . . . . . ¥ 478 $ 5,7682013 . . . . . . . . . . . . . . . . . . . . . . . . . . . . . . . . . . . . . . . . . . . . . . . . . . . . . . . . . . . . . . 468 5,6492014 . . . . . . . . . . . . . . . . . . . . . . . . . . . . . . . . . . . . . . . . . . . . . . . . . . . . . . . . . . . . . . 445 5,3662015 . . . . . . . . . . . . . . . . . . . . . . . . . . . . . . . . . . . . . . . . . . . . . . . . . . . . . . . . . . . . . . 387 4,6702016 and thereafter . . . . . . . . . . . . . . . . . . . . . . . . . . . . . . . . . . . . . . . . . . . . . . . . . 5,233 63,052Total . . . . . . . . . . . . . . . . . . . . . . . . . . . . . . . . . . . . . . . . . . . . . . . . . . . . . . . . . . . . . . ¥7,014 $84,506
44 Kurita Water Industries Ltd. Annual Report 2011
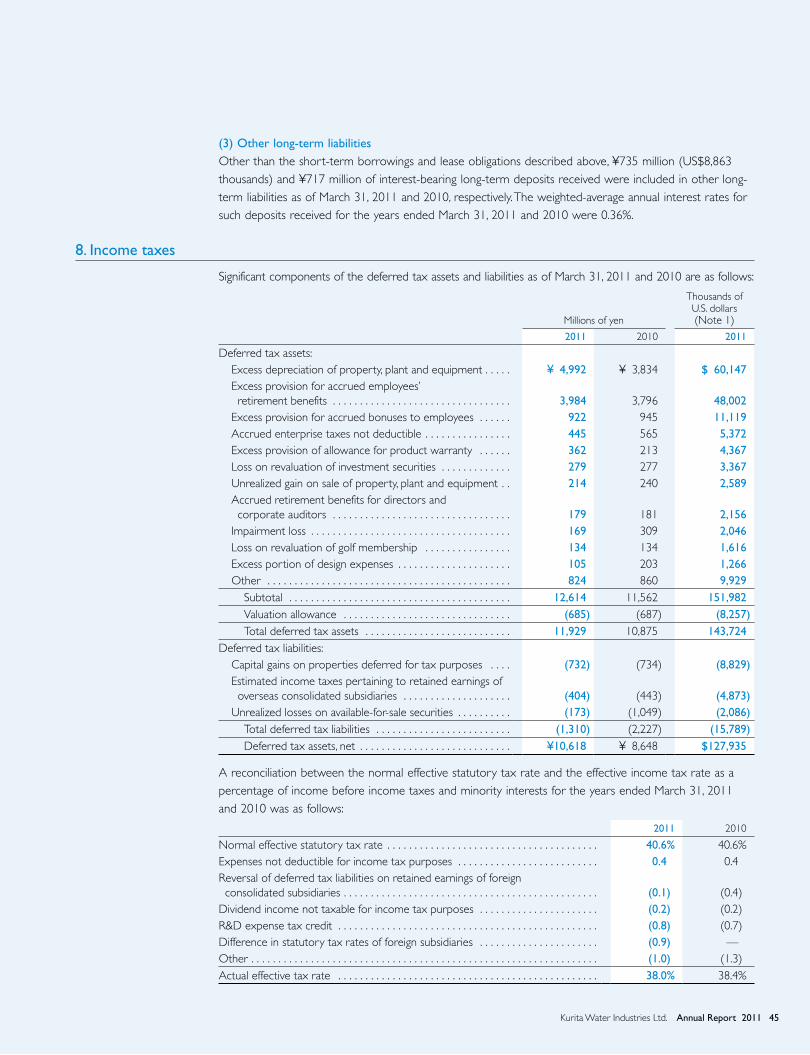
(3) Other long-term liabilitiesOther than the short-term borrowings and lease obligations described above, ¥735 million (US$8,863 thousands) and ¥717 million of interest-bearing long-term deposits received were included in other long-term liabilities as of March 31, 2011 and 2010, respectively. The weighted-average annual interest rates for such deposits received for the years ended March 31, 2011 and 2010 were 0.36%.
8. Income taxes
Significant components of the deferred tax assets and liabilities as of March 31, 2011 and 2010 are as follows:
Millions of yen
Thousands of U.S. dollars(Note 1)
2011 2010 2011
Deferred tax assets:Excess depreciation of property, plant and equipment . . . . . ¥ 4,992 ¥ 3,834 $ 60,147Excess provision for accrued employees’ retirement benefits . . . . . . . . . . . . . . . . . . . . . . . . . . . . . . . . . 3,984 3,796 48,002
Excess provision for accrued bonuses to employees . . . . . . 922 945 11,119Accrued enterprise taxes not deductible . . . . . . . . . . . . . . . . 445 565 5,372Excess provision of allowance for product warranty . . . . . . 362 213 4,367Loss on revaluation of investment securities . . . . . . . . . . . . . 279 277 3,367Unrealized gain on sale of property, plant and equipment . . 214 240 2,589Accrued retirement benefits for directors and corporate auditors . . . . . . . . . . . . . . . . . . . . . . . . . . . . . . . . . 179 181 2,156
Impairment loss . . . . . . . . . . . . . . . . . . . . . . . . . . . . . . . . . . . . . 169 309 2,046Loss on revaluation of golf membership . . . . . . . . . . . . . . . . 134 134 1,616Excess portion of design expenses . . . . . . . . . . . . . . . . . . . . . 105 203 1,266Other . . . . . . . . . . . . . . . . . . . . . . . . . . . . . . . . . . . . . . . . . . . . . 824 860 9,929
Subtotal . . . . . . . . . . . . . . . . . . . . . . . . . . . . . . . . . . . . . . . . . 12,614 11,562 151,982Valuation allowance . . . . . . . . . . . . . . . . . . . . . . . . . . . . . . . (685) (687) (8,257)Total deferred tax assets . . . . . . . . . . . . . . . . . . . . . . . . . . . 11,929 10,875 143,724
Deferred tax liabilities:Capital gains on properties deferred for tax purposes . . . . (732) (734) (8,829)Estimated income taxes pertaining to retained earnings of overseas consolidated subsidiaries . . . . . . . . . . . . . . . . . . . . (404) (443) (4,873)
Unrealized losses on available-for-sale securities . . . . . . . . . . (173) (1,049) (2,086)Total deferred tax liabilities . . . . . . . . . . . . . . . . . . . . . . . . . (1,310) (2,227) (15,789)Deferred tax assets, net . . . . . . . . . . . . . . . . . . . . . . . . . . . . ¥10,618 ¥ 8,648 $127,935
A reconciliation between the normal effective statutory tax rate and the effective income tax rate as a percentage of income before income taxes and minority interests for the years ended March 31, 2011 and 2010 was as follows:
2011 2010
Normal effective statutory tax rate . . . . . . . . . . . . . . . . . . . . . . . . . . . . . . . . . . . . . . . 40.6% 40.6%Expenses not deductible for income tax purposes . . . . . . . . . . . . . . . . . . . . . . . . . . 0.4 0.4Reversal of deferred tax liabilities on retained earnings of foreign consolidated subsidiaries . . . . . . . . . . . . . . . . . . . . . . . . . . . . . . . . . . . . . . . . . . . . . . . (0.1) (0.4)
Dividend income not taxable for income tax purposes . . . . . . . . . . . . . . . . . . . . . . (0.2) (0.2)R&D expense tax credit . . . . . . . . . . . . . . . . . . . . . . . . . . . . . . . . . . . . . . . . . . . . . . . . (0.8) (0.7)Difference in statutory tax rates of foreign subsidiaries . . . . . . . . . . . . . . . . . . . . . . (0.9) —Other . . . . . . . . . . . . . . . . . . . . . . . . . . . . . . . . . . . . . . . . . . . . . . . . . . . . . . . . . . . . . . . . (1.0) (1.3)Actual effective tax rate . . . . . . . . . . . . . . . . . . . . . . . . . . . . . . . . . . . . . . . . . . . . . . . . 38.0% 38.4%
45Kurita Water Industries Ltd. Annual Report 2011
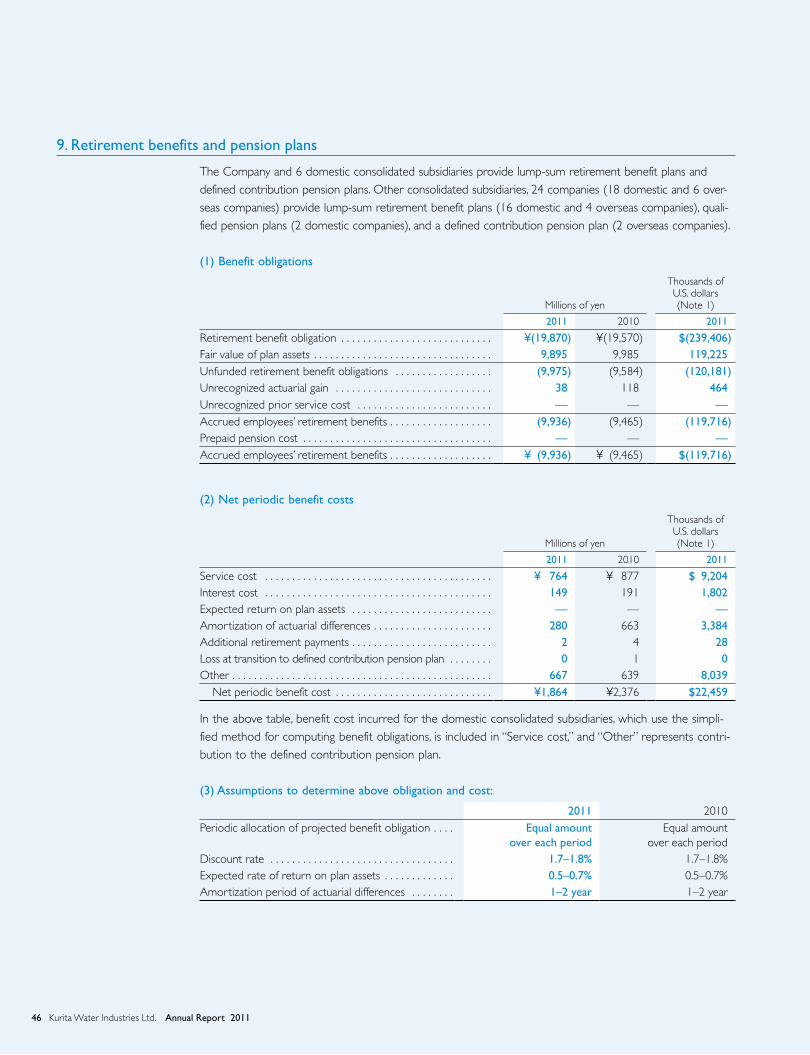
9. Retirement benefits and pension plans
The Company and 6 domestic consolidated subsidiaries provide lump-sum retirement benefit plans and defined contribution pension plans. Other consolidated subsidiaries, 24 companies (18 domestic and 6 over-seas companies) provide lump-sum retirement benefit plans (16 domestic and 4 overseas companies), quali-fied pension plans (2 domestic companies), and a defined contribution pension plan (2 overseas companies).
(1) Benefit obligations
Millions of yen
Thousands of U.S. dollars(Note 1)
2011 2010 2011
Retirement benefit obligation . . . . . . . . . . . . . . . . . . . . . . . . . . . . ¥(19,870) ¥(19,570) $(239,406)Fair value of plan assets . . . . . . . . . . . . . . . . . . . . . . . . . . . . . . . . . 9,895 9,985 119,225Unfunded retirement benefit obligations . . . . . . . . . . . . . . . . . . (9,975) (9,584) (120,181)Unrecognized actuarial gain . . . . . . . . . . . . . . . . . . . . . . . . . . . . . 38 118 464Unrecognized prior service cost . . . . . . . . . . . . . . . . . . . . . . . . . — — —Accrued employees’ retirement benefits . . . . . . . . . . . . . . . . . . . (9,936) (9,465) (119,716)Prepaid pension cost . . . . . . . . . . . . . . . . . . . . . . . . . . . . . . . . . . . — — —Accrued employees’ retirement benefits . . . . . . . . . . . . . . . . . . . ¥ (9,936) ¥ (9,465) $(119,716)
(2) Net periodic benefit costs
Millions of yen
Thousands of U.S. dollars(Note 1)
2011 2010 2011
Service cost . . . . . . . . . . . . . . . . . . . . . . . . . . . . . . . . . . . . . . . . . . ¥ 764 ¥ 877 $ 9,204Interest cost . . . . . . . . . . . . . . . . . . . . . . . . . . . . . . . . . . . . . . . . . . 149 191 1,802Expected return on plan assets . . . . . . . . . . . . . . . . . . . . . . . . . . — — —Amortization of actuarial differences . . . . . . . . . . . . . . . . . . . . . . 280 663 3,384Additional retirement payments . . . . . . . . . . . . . . . . . . . . . . . . . . 2 4 28Loss at transition to defined contribution pension plan . . . . . . . . 0 1 0Other . . . . . . . . . . . . . . . . . . . . . . . . . . . . . . . . . . . . . . . . . . . . . . . . 667 639 8,039
Net periodic benefit cost . . . . . . . . . . . . . . . . . . . . . . . . . . . . . ¥1,864 ¥2,376 $22,459
In the above table, benefit cost incurred for the domestic consolidated subsidiaries, which use the simpli-fied method for computing benefit obligations, is included in “Service cost,” and “Other” represents contri-bution to the defined contribution pension plan.
(3) Assumptions to determine above obligation and cost:
2011 2010Periodic allocation of projected benefit obligation . . . . Equal amount
over each periodEqual amount
over each periodDiscount rate . . . . . . . . . . . . . . . . . . . . . . . . . . . . . . . . . . 1.7–1.8% 1.7–1.8%Expected rate of return on plan assets . . . . . . . . . . . . . 0.5–0.7% 0.5–0.7%Amortization period of actuarial differences . . . . . . . . 1–2 year 1–2 year
46 Kurita Water Industries Ltd. Annual Report 2011
10. Shareholders’ equity
Japanese companies are subject to the Companies Act. A summary of the sections of the Companies Act that affect financial statements and accounting matters is as follows:
(1) Distribution of dividends to shareholdersUnder the Companies Act, if companies meet certain criteria, dividends can be paid at any time during the fiscal year in addition to the year-end dividend upon resolution at the shareholders’ meeting. Semiannual interim dividends may also be paid once a year upon resolution by the Board of Directors’ meeting if the articles of incorporation of the company so stipulate.
The Companies Act provides certain limitations on the amounts available for dividends and/or the purchase of treasury stock. The limitation is defined as the amount available for distribution to the share-holders, and it is calculated mainly based on capital surplus other than paid-in capital, retained earnings, and treasury stock, but the amount of net assets after dividends must be maintained at no less than ¥3 million.
(2) Increases/decreases; transfer of common stock, reserve, and surplusThe Companies Act requires that an amount equal to 10% of dividends must be appropriated as a legal reserve (a component of retained earnings) or as additional paid-in capital (a component of capital sur-plus) depending on the equity account charged upon the payment of such dividends. However, such appropriation may not be made if the aggregate amount of legal reserve and additional paid-in capital exceeds 25% of the common stock. Under the Companies Act, this legal reserve and additional paid-in capital may be reversed without limitation.
The Companies Act also provides that common stock, legal reserve, additional paid-in capital, other capital surplus, and retained earnings can be transferred among the accounts under certain conditions upon resolution of the shareholders.
(3) Treasury stockThe Companies Act provides that companies may purchase, hold or dispose of such treasury stock by resolution of the Board of Directors’ meetings. The amount of treasury stock purchased cannot exceed the amount available for distribution to the shareholders which is determined by a specific formula.
11. Unrealized gains on revaluation of land
The Company implemented a revaluation of land for business use in accordance with the Land Revaluation Law (enacted on March 31, 1998). The revaluation difference, net of taxes is stated as “ Unrealized gains (losses) on revaluation of land” in the valuation and translation account in net assets. The tax equivalent is stated as deferred tax assets or liabilities in long-term liabilities.
When any revaluated land is sold, the related unrealized gain or loss on revaluation of land is trans-ferred to retained earnings.
Revaluation method: The revaluation of land was computed in accordance with Article Two, Item One of the Land Revaluation Law Enforcement Order.
Revaluation date: March 31, 2002
47Kurita Water Industries Ltd. Annual Report 2011

12. Selling, general and administrative expenses
Selling, general and administrative expenses for the years ended March 31, 2011 and 2010 consisted of the following:
Millions of yen
Thousands of U.S. dollars(Note 1)
2011 2010 2011
Salaries and allowances . . . . . . . . . . . . . . . . . . . . . . . . . . . . . . . . . ¥13,986 ¥13,127 $168,511Provision for employees’ bonuses . . . . . . . . . . . . . . . . . . . . . . . . 1,356 1,492 16,340Retirement benefit expenses . . . . . . . . . . . . . . . . . . . . . . . . . . . . 1,033 1,415 12,457Travel expenses . . . . . . . . . . . . . . . . . . . . . . . . . . . . . . . . . . . . . . . 2,468 2,379 29,738Research and development expenses . . . . . . . . . . . . . . . . . . . . . 4,225 3,990 50,910Other . . . . . . . . . . . . . . . . . . . . . . . . . . . . . . . . . . . . . . . . . . . . . . . . 12,458 12,535 150,100
Total . . . . . . . . . . . . . . . . . . . . . . . . . . . . . . . . . . . . . . . . . . . . . . ¥35,528 ¥34,941 $428,059
13. Segment information
Effective the fiscal year ended March 31, 2011, the Company adopted the “Revised Accounting Standard for Disclosures about Segments of an Enterprise and Related Information” (ASBJ Statement No. 17, revised March 27, 2009) and its accompanying “Guidance on the Accounting Standard for Disclosures about Segments of an Enterprise and Related Information” (ASBJ Guidance No. 20, March 21, 2008).
For the year ended March 31, 2011(1) Overview of reportable segmentsThe Company’s reportable segments are the components of the Company about which separate financial information is available. These segments are subject to periodic examinations to enable the Company’s Board of Directors to decide how to allocate resources and assess performance.
The Company’s business divisions are based on product and service categories. Each of the divisions conducts business based on comprehensive strategies formulated for the products and services that they handle in domestic and overseas markets. The Company’s consolidated subsidiaries conduct business under the relevant business divisions’ supervision.
The Group’s operations are therefore segmented based on the products and services handled by each of the divisions. The Company’s reportable segments correspond to the segments it has used thus far, namely the Water Treatment Chemicals segment and Water Treatment Facilities segment.
The Water Treatment Chemicals segment manufactures and sells water treatment chemicals and equipment and provides maintenance services. The Water Treatment Facilities segment manufactures and sells water treatment equipment and facilities, provides ultrapure water, chemical cleaning, tool cleaning, soil and groundwater remediation services, and provides maintenance services that encompass operation, maintenance, and management of water treatment facilities.
(2) Accounting methods used to calculate sales, income, assets, liabilities, and other amounts by reportable segment
The accounting treatment and methods for the reportable segments are largely consistent with the Notes to the Consolidated Financial Statements. The segment income item represents figures for operating income. Intersegment transactions are measured based on prices that reflect actual market conditions, while inter-division sales at the Company are primarily based on cost.
The segment information of the Company and its consolidated subsidiaries for the years ended March, 31 2011 is outlined as follows:
48 Kurita Water Industries Ltd. Annual Report 2011

Millions of yen
Reportable segments
Adjustments ConsolidatedYear ended March 31, 2011
Water Treatment Chemicals
Water Treatment
Facilities Total
Sales1) Sales to outside customers . . . . ¥56,735 ¥124,499 ¥181,234 ¥ — ¥181,2342) Intersegment sales . . . . . . . . . . . . 349 180 530 (530) —
Total . . . . . . . . . . . . . . . . . . . . . . . ¥57,084 ¥124,680 ¥181,764 ¥ (530) ¥181,234Segment income . . . . . . . . . . . . . . . ¥10,099 ¥ 17,032 ¥ 27,131 ¥ 0 ¥ 27,131Segment assets . . . . . . . . . . . . . . . . . 36,444 158,414 194,859 58,439 253,298Segment liabilities . . . . . . . . . . . . . . . 16,919 37,155 54,075 (128) 53,946Other items
Depreciation and amortization . 1,539 14,527 16,066 — 16,066Increase in property, plant and equipment and intangible assets . . . . . . . . . . . . . 1,183 4,781 5,965 — 5,965
Amortization of goodwill . . . . . . 59 — 59 — 59Goodwill . . . . . . . . . . . . . . . . . . . . 44 — 44 — 44
Thousands of U.S. dollars (Note 1)
Reportable segments
Adjustments ConsolidatedYear ended March 31, 2011
Water Treatment Chemicals
Water Treatment
Facilities Total
Sales1) Sales to outside customers . . . . $683,558 $1,499,991 $2,183,550 $ — $2,183,5502) Intersegment sales . . . . . . . . . . . . 4,211 2,178 6,389 (6,389) —
Total . . . . . . . . . . . . . . . . . . . . . . . $687,770 $1,502,169 $2,189,939 $ (6,389) $2,183,550Segment income . . . . . . . . . . . . . . . $121,679 $ 205,206 $ 326,886 $ 3 $ 326,889Segment assets . . . . . . . . . . . . . . . . . 439,094 1,908,608 2,347,702 704,087 3,051,790Segment liabilities . . . . . . . . . . . . . . . 203,846 447,660 651,507 (1,544) 649,963Other items
Depreciation and amortization . 18,543 175,027 193,571 — 193,571Increase in property, plant and equipment and intangible assets . . . . . . . . . . . . . 14,263 57,611 71,875 — 71,875
Amortization of goodwill . . . . . . 722 — 722 — 722Goodwill . . . . . . . . . . . . . . . . . . . . 541 — 541 — 541
Note:“Adjustments” represents the following:1. Sales: Elimination of intersegment transactions.2. Segment income: Amount resulting from eliminations of intersegment transactions.3. Segment assets: Mainly corporate assets of ¥58,572 million (US$705,697 thousand) unallocated to reportable segment
assets (cash deposits, securities in trust, and long-term investments).4. Segment liabilities: Amount resulting from eliminations of intersegment claims and liabilities.
49Kurita Water Industries Ltd. Annual Report 2011
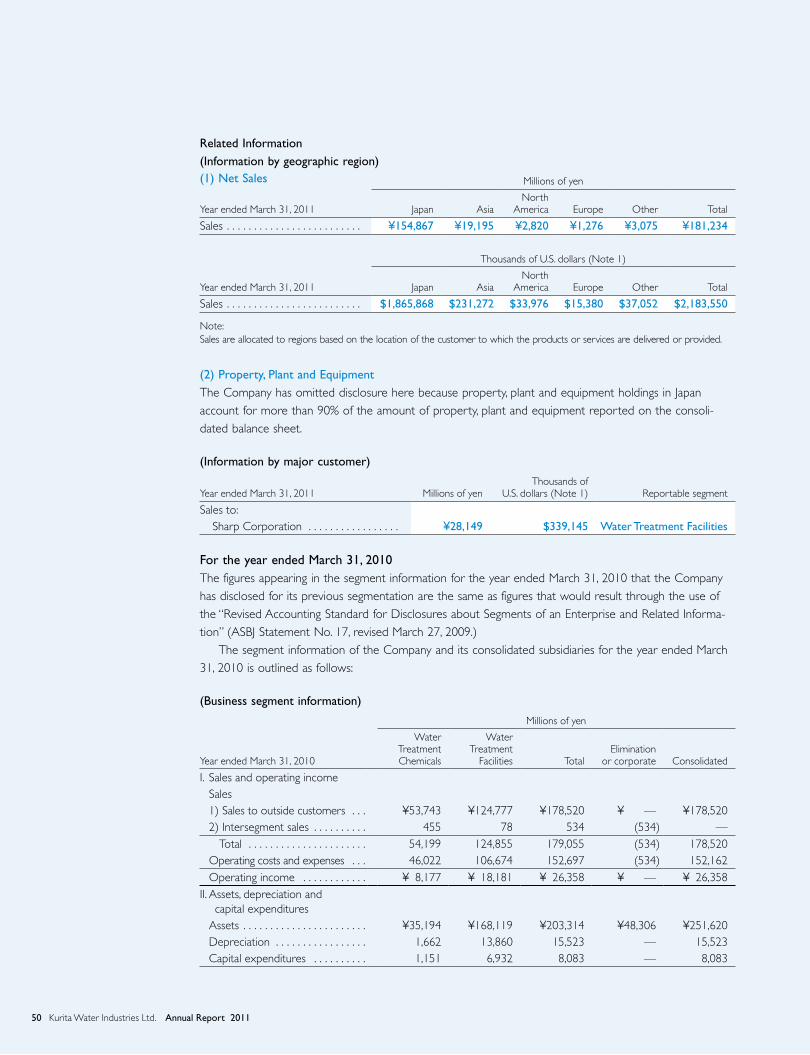
Related Information(Information by geographic region)(1) Net Sales Millions of yen
Year ended March 31, 2011 Japan AsiaNorth
America Europe Other Total
Sales . . . . . . . . . . . . . . . . . . . . . . . . . ¥154,867 ¥19,195 ¥2,820 ¥1,276 ¥3,075 ¥181,234
Thousands of U.S. dollars (Note 1)
Year ended March 31, 2011 Japan AsiaNorth
America Europe Other Total
Sales . . . . . . . . . . . . . . . . . . . . . . . . . $1,865,868 $231,272 $33,976 $15,380 $37,052 $2,183,550
Note:Sales are allocated to regions based on the location of the customer to which the products or services are delivered or provided.
(2) Property, Plant and EquipmentThe Company has omitted disclosure here because property, plant and equipment holdings in Japan account for more than 90% of the amount of property, plant and equipment reported on the consoli-dated balance sheet.
(Information by major customer)
Year ended March 31, 2011 Millions of yenThousands of
U.S. dollars (Note 1) Reportable segment
Sales to:Sharp Corporation . . . . . . . . . . . . . . . . . ¥28,149 $339,145 Water Treatment Facilities
For the year ended March 31, 2010The figures appearing in the segment information for the year ended March 31, 2010 that the Company has disclosed for its previous segmentation are the same as figures that would result through the use of the “Revised Accounting Standard for Disclosures about Segments of an Enterprise and Related Informa-tion” (ASBJ Statement No. 17, revised March 27, 2009.)
The segment information of the Company and its consolidated subsidiaries for the year ended March 31, 2010 is outlined as follows:
(Business segment information)
Millions of yen
Year ended March 31, 2010
Water Treatment Chemicals
Water Treatment
Facilities TotalElimination
or corporate Consolidated
I. Sales and operating income Sales 1) Sales to outside customers . . . ¥53,743 ¥124,777 ¥178,520 ¥ — ¥178,520 2) Intersegment sales . . . . . . . . . . 455 78 534 (534) — Total . . . . . . . . . . . . . . . . . . . . . . 54,199 124,855 179,055 (534) 178,520 Operating costs and expenses . . . 46,022 106,674 152,697 (534) 152,162 Operating income . . . . . . . . . . . . ¥ 8,177 ¥ 18,181 ¥ 26,358 ¥ — ¥ 26,358II. Assets, depreciation and
capital expenditures Assets . . . . . . . . . . . . . . . . . . . . . . . ¥35,194 ¥168,119 ¥203,314 ¥48,306 ¥251,620 Depreciation . . . . . . . . . . . . . . . . . 1,662 13,860 15,523 — 15,523 Capital expenditures . . . . . . . . . . 1,151 6,932 8,083 — 8,083
50 Kurita Water Industries Ltd. Annual Report 2011

Notes:1. Method of Classification of Business Segments The Group’s main operations include the manufacture and sales of water treatment chemicals, and the manufacture and
sales of water treatment equipment and facilities. The Group is therefore divided into two business segments based on the products and services handled by each of the divisions: the Water Treatment Chemicals segment and the Water Treatment Facilities segment.
2. Principal products and services of each segment are as follows:
Water Treatment Chemicals Business Boiler water treatment chemicals, cooling water treatment chemicals, wastewater treatment chemicals, process treatment
chemicals used in oil refining and pulp and paper incinerator chemicals, equipment and systems for water treatment chemi-cals, and packaged water treatment management, including a steam supply contract and blanket contracts for factories
Water Treatment Facilities Business For the electronics industry: Ultrapure water production systems, wastewater reclamation systems, wastewater treatment systems, wastewater reclama-
tion systems, tool cleaning services, maintenance services, and ultrapure water supply business For general industries: Pure water production systems, wastewater treatment systems, wastewater reclamation systems, operation and maintenance
services, soil remediation services, and chemical cleaning services3. There were no costs and expenses included in “Elimination or corporate” that cannot be allocated to business segments for
the years ended March 31, 2010.4. Total assets under “Elimination or corporate” include corporate assets, consisting primarily of deposits with banks, market-
able portfolio securities, and long-term investment funds (deposits, marketable securities and investment securities). Such corporate assets as of March 31, 2010 amounted to ¥48,369 million.
5. The Company adopted ASBJ Statement No. 19 “Partial Amendments to Accounting Standard for Retirement Benefits (Part 3)” effective from the year ended March 31, 2010. Accordingly, operating income of “Water Treatment Chemicals business” and “Water Treatment Facilities business” decreased by ¥290 million and ¥585 million, respectively.
6. The Company and certain consolidated subsidiaries adopted ASBJ Statement No. 15 “Accounting Standard for Construction Contracts” and Guidance No. 18 “Guidance on Accounting Standard for Construction Contracts.” Accordingly, net sales and operating income of “Water Treatment Facilities” increased by ¥6,265 million and ¥1,244 million, respectively.
(Geographic segment information)
Millions of yen
Year ended March 31, 2010 JapanOther
regions TotalElimination
or corporate Consolidated
I. Sales and operating income Sales 1) Sales to outside customers . . . ¥163,696 ¥14,824 ¥178,520 ¥ — ¥178,520 2) Intersegment sales . . . . . . . . . . 1,561 238 1,799 (1,799) — Total . . . . . . . . . . . . . . . . . . . . . . 165,257 15,063 180,320 (1,799) 178,520 Operating costs and expenses . . 140,733 13,544 154,278 (2,115) 152,162 Operating income . . . . . . . . . . . . ¥ 24,523 ¥ 1,518 ¥ 26,042 ¥ 315 ¥ 26,358II. Assets . . . . . . . . . . . . . . . . . . . . . . . ¥185,816 ¥ 8,116 ¥193,932 ¥57,687 ¥251,620
Notes:1. Countries and regions are classified into segments according to geography and proximity.2. “Other regions” are composed primarily of countries in Asia.3. There were no costs and expenses under “Elimination or corporate” that cannot be allocated to geographical segments.4. Assets under “Elimination or corporate” include corporate assets, the amount and components of which are the same as
those provided in Note 3 to the above “Business segment information.”5. The Company adopted ASBJ Statement No. 19 “Partial Amendments to Accounting Standard for Retirement Benefits (Part
3)” effective from the year ended March 31, 2010. Accordingly, operating income of “Japan” decreased by ¥876 million.6. The Company and certain consolidated subsidiaries adopted ASBJ Statement No. 15 “Accounting Standard for Construction
Contracts” and Guidance No. 18 “Guidance on Accounting Standard for Construction Contracts.” Accordingly, net sales and operating income of “Japan” increased by ¥6,265 million and ¥1,244 million, respectively.
51Kurita Water Industries Ltd. Annual Report 2011
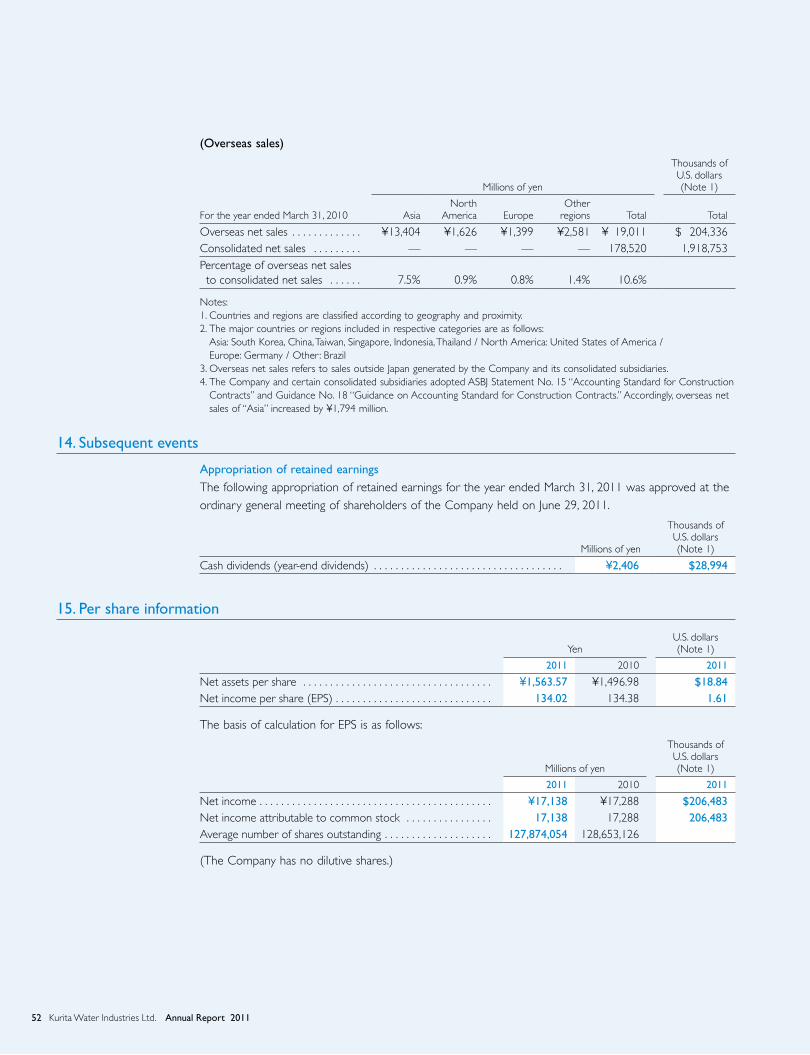
(Overseas sales)
Millions of yen
Thousands of U.S. dollars (Note 1)
For the year ended March 31, 2010 AsiaNorth
America EuropeOther
regions Total Total
Overseas net sales . . . . . . . . . . . . . ¥13,404 ¥1,626 ¥1,399 ¥2,581 ¥ 19,011 $ 204,336Consolidated net sales . . . . . . . . . — — — — 178,520 1,918,753Percentage of overseas net sales to consolidated net sales . . . . . . 7.5% 0.9% 0.8% 1.4% 10.6%
Notes:1. Countries and regions are classified according to geography and proximity.2. The major countries or regions included in respective categories are as follows: Asia: South Korea, China, Taiwan, Singapore, Indonesia, Thailand / North America: United States of America /
Europe: Germany / Other: Brazil3. Overseas net sales refers to sales outside Japan generated by the Company and its consolidated subsidiaries.4. The Company and certain consolidated subsidiaries adopted ASBJ Statement No. 15 “Accounting Standard for Construction
Contracts” and Guidance No. 18 “Guidance on Accounting Standard for Construction Contracts.” Accordingly, overseas net sales of “Asia” increased by ¥1,794 million.
14. Subsequent events
Appropriation of retained earningsThe following appropriation of retained earnings for the year ended March 31, 2011 was approved at the ordinary general meeting of shareholders of the Company held on June 29, 2011.
Millions of yen
Thousands of U.S. dollars (Note 1)
Cash dividends (year-end dividends) . . . . . . . . . . . . . . . . . . . . . . . . . . . . . . . . . . . ¥2,406 $28,994
15. Per share information
YenU.S. dollars (Note 1)
2011 2010 2011
Net assets per share . . . . . . . . . . . . . . . . . . . . . . . . . . . . . . . . . . . ¥1,563.57 ¥1,496.98 $18.84Net income per share (EPS) . . . . . . . . . . . . . . . . . . . . . . . . . . . . . 134.02 134.38 1.61
The basis of calculation for EPS is as follows:
Millions of yen
Thousands of U.S. dollars (Note 1)
2011 2010 2011
Net income . . . . . . . . . . . . . . . . . . . . . . . . . . . . . . . . . . . . . . . . . . . ¥17,138 ¥17,288 $206,483Net income attributable to common stock . . . . . . . . . . . . . . . . 17,138 17,288 206,483Average number of shares outstanding . . . . . . . . . . . . . . . . . . . . 127,874,054 128,653,126
(The Company has no dilutive shares.)
52 Kurita Water Industries Ltd. Annual Report 2011
REPORT OF INDEPENDENT CERTIFIED PUBLIC ACCOUNTANTS
53Kurita Water Industries Ltd. Annual Report 2011
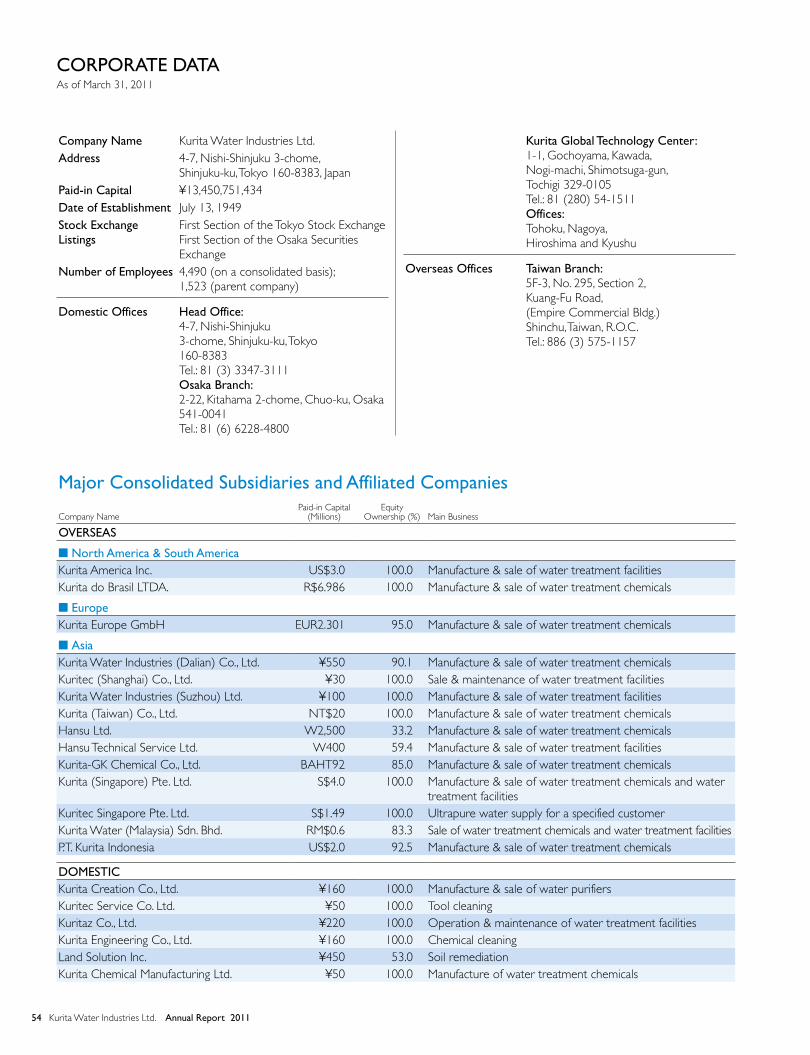
Company Name Kurita Water Industries Ltd.Address 4-7, Nishi-Shinjuku 3-chome,
Shinjuku-ku, Tokyo 160-8383, JapanPaid-in Capital ¥13,450,751,434Date of Establishment July 13, 1949Stock Exchange Listings
First Section of the Tokyo Stock ExchangeFirst Section of the Osaka Securities Exchange
Number of Employees 4,490 (on a consolidated basis); 1,523 (parent company)
Domestic Offices Head Office:4-7, Nishi-Shinjuku3-chome, Shinjuku-ku, Tokyo160-8383Tel.: 81 (3) 3347-3111Osaka Branch: 2-22, Kitahama 2-chome, Chuo-ku, Osaka541-0041Tel.: 81 (6) 6228-4800
Kurita Global Technology Center:1-1, Gochoyama, Kawada,Nogi-machi, Shimotsuga-gun,Tochigi 329-0105Tel.: 81 (280) 54-1511Offices:Tohoku, Nagoya,Hiroshima and Kyushu
Overseas Offices Taiwan Branch:5F-3, No. 295, Section 2,Kuang-Fu Road,(Empire Commercial Bldg.)Shinchu, Taiwan, R.O.C.Tel.: 886 (3) 575-1157
Major Consolidated Subsidiaries and Affiliated Companies
Company NamePaid-in Capital
(Millions)Equity
Ownership (%) Main Business
OVERSEAS
n North America & South AmericaKurita America Inc. US$3.0 100.0 Manufacture & sale of water treatment facilitiesKurita do Brasil LTDA. R$6.986 100.0 Manufacture & sale of water treatment chemicals
n EuropeKurita Europe GmbH EUR2.301 95.0 Manufacture & sale of water treatment chemicals
n AsiaKurita Water Industries (Dalian) Co., Ltd. ¥550 90.1 Manufacture & sale of water treatment chemicalsKuritec (Shanghai) Co., Ltd. ¥30 100.0 Sale & maintenance of water treatment facilitiesKurita Water Industries (Suzhou) Ltd. ¥100 100.0 Manufacture & sale of water treatment facilitiesKurita (Taiwan) Co., Ltd. NT$20 100.0 Manufacture & sale of water treatment chemicalsHansu Ltd. W2,500 33.2 Manufacture & sale of water treatment chemicalsHansu Technical Service Ltd. W400 59.4 Manufacture & sale of water treatment facilitiesKurita-GK Chemical Co., Ltd. BAHT92 85.0 Manufacture & sale of water treatment chemicalsKurita (Singapore) Pte. Ltd. S$4.0 100.0 Manufacture & sale of water treatment chemicals and water
treatment facilitiesKuritec Singapore Pte. Ltd. S$1.49 100.0 Ultrapure water supply for a specified customerKurita Water (Malaysia) Sdn. Bhd. RM$0.6 83.3 Sale of water treatment chemicals and water treatment facilitiesP.T. Kurita Indonesia US$2.0 92.5 Manufacture & sale of water treatment chemicals
DOMESTICKurita Creation Co., Ltd. ¥160 100.0 Manufacture & sale of water purifiersKuritec Service Co. Ltd. ¥50 100.0 Tool cleaningKuritaz Co., Ltd. ¥220 100.0 Operation & maintenance of water treatment facilitiesKurita Engineering Co., Ltd. ¥160 100.0 Chemical cleaningLand Solution Inc. ¥450 53.0 Soil remediationKurita Chemical Manufacturing Ltd. ¥50 100.0 Manufacture of water treatment chemicals
CORPORATE DATAAs of March 31, 2011
54 Kurita Water Industries Ltd. Annual Report 2011
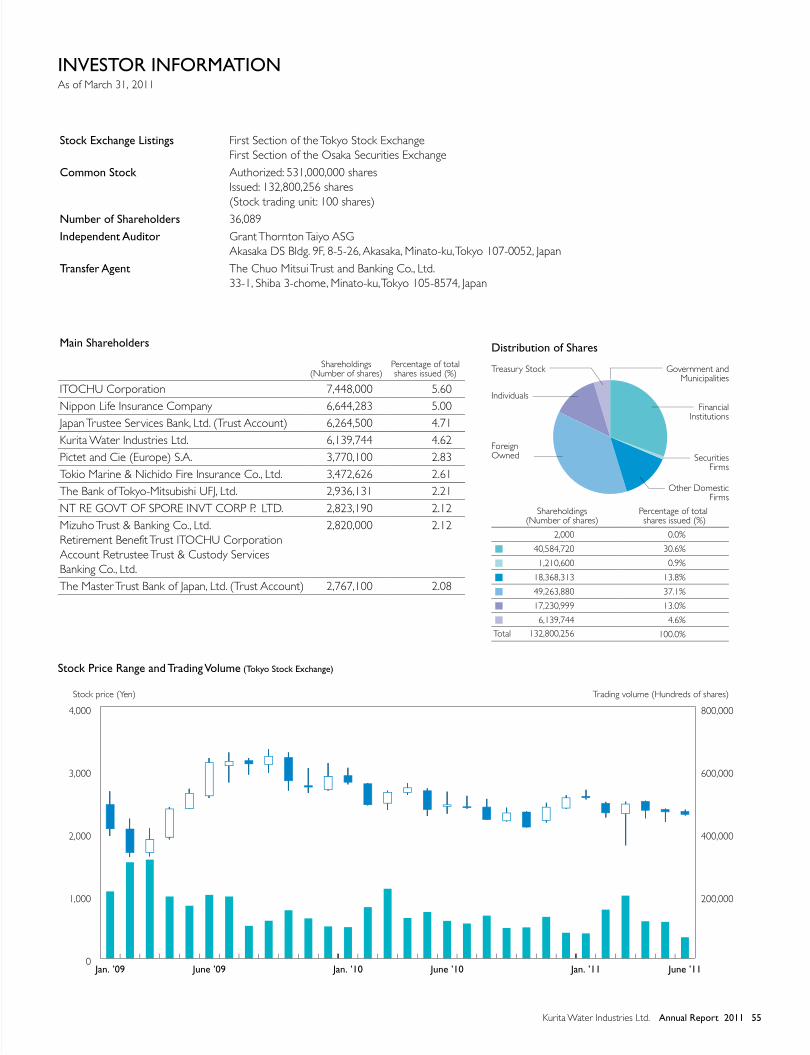
Cautionary Statement with Respect to Forward-Looking StatementsThis annual report contains forward-looking statements regarding forecasts, plans, strategies and business performance in the future. These forward-looking statements represent judgments made by the Company based on information currently available to it and involve a variety of risks and uncertainties.Actual results may be materially different from these forward-looking statements. Such risks and uncertainties include (but are not limited to) changes in the economic environment, business conditions, market, demand and currency exchange rates.
cover 2 PROFILE
01 CONSOLIDATED FINANCIAL HIGHLIGHTS
02 Water Solutions for Industry04 BUSINESS REVIEW
05 BUSINESS HIGHLIGHTS
06 TO ALL OUR STAKEHOLDERS
07 Feature: Kurita’s New President Talks about Kurita’s Strategy for Growth 09 Leading the Industry in Comprehensive Solutions
11 Stepping up the Global Expansion of the Kurita Group
13 RESEARCH AND DEVELOPMENT
14 SUSTAINABLE MANAGEMENT FRAMEWORK
14 Corporate Governance
17 Environmental Improvement Activities
19 BOARD OF DIRECTORS AND CORPORATE AUDITORS
PROFILE
CONTENTS
Guided by its corporate philosophy, “study the properties of water, master
them, and we will create an environment in which nature and man are in
harmony,” Kurita Water Industries Ltd. is a leader in the industrial water field.
Kurita provides quality products and high-value-added outsourcing and
maintenance services to customers in a wide range of industries.
Since its establishment in 1949, Kurita has accumulated a high level of
technical expertise and know-how. Today, Kurita leverages these assets in a
unique business portfolio that includes both chemicals and facilities to realize
its corporate vision of becoming an advanced water and environmental
management company. As our customers and society wrestle with improving
productivity and reducing environmental impact, we are working to help
create a sustainable society by recycling the limited resource that is water
and proposing comprehensive water treatment solutions.
WATER TREATMENT CHEMICALS
WATER TREATMENT FACILITIES
Distribution of Shares
Stock Exchange Listings First Section of the Tokyo Stock ExchangeFirst Section of the Osaka Securities Exchange
Common Stock Authorized: 531,000,000 sharesIssued: 132,800,256 shares(Stock trading unit: 100 shares)
Number of Shareholders 36,089
Independent Auditor Grant Thornton Taiyo ASGAkasaka DS Bldg. 9F, 8-5-26, Akasaka, Minato-ku, Tokyo 107-0052, Japan
Transfer Agent The Chuo Mitsui Trust and Banking Co., Ltd.33-1, Shiba 3-chome, Minato-ku, Tokyo 105-8574, Japan
Main Shareholders
Shareholdings (Number of shares)
Percentage of total shares issued (%)
ITOCHU Corporation 7,448,000 5.60Nippon Life Insurance Company 6,644,283 5.00Japan Trustee Services Bank, Ltd. (Trust Account) 6,264,500 4.71Kurita Water Industries Ltd. 6,139,744 4.62Pictet and Cie (Europe) S.A. 3,770,100 2.83Tokio Marine & Nichido Fire Insurance Co., Ltd. 3,472,626 2.61The Bank of Tokyo-Mitsubishi UFJ, Ltd. 2,936,131 2.21NT RE GOVT OF SPORE INVT CORP P. LTD. 2,823,190 2.12Mizuho Trust & Banking Co., Ltd.Retirement Benefit Trust ITOCHU Corporation Account Retrustee Trust & Custody Services Banking Co., Ltd.
2,820,000 2.12
The Master Trust Bank of Japan, Ltd. (Trust Account) 2,767,100 2.08
Stock price (Yen) Trading volume (Hundreds of shares)
Shareholdings (Number of shares)
Percentage of total shares issued (%)
2,000 0.0%
n 40,584,720 30.6%
n 1,210,600 0.9%
n 18,368,313 13.8%
n 49,263,880 37.1%
n 17,230,999 13.0%
n 6,139,744 4.6%
Total 132,800,256 100.0%
INVESTOR INFORMATIONAs of March 31, 2011
Treasury Stock
Individuals
ForeignOwned
Government and Municipalities
Financial Institutions
Securities Firms
Other Domestic Firms
0
1,000
2,000
3,000
4,000
200,000
400,000
600,000
800,000
June ’11Jan. ’11June ’10Jan. ’10June ’09Jan. ’09
Stock Price Range and Trading Volume (Tokyo Stock Exchange)
55Kurita Water Industries Ltd. Annual Report 2011

URL: http://www.kurita.co.jp/english/
4-7, Nishi-Shinjuku 3-chome, Shinjuku-ku, Tokyo 160-8383, JapanTel: 81 (3) 3347-3111
This report was printed on FSC-approved paper using vegetable oil ink.Printed in Japan
Kurita W
ater Industries Ltd. AN
NU
AL R
EPORT
2011
ANNUAL REPORT 2011For the year ended March 31, 2011
Kurita – Wherever Business Needs Water