

KubeCon EU 2016: Interactive Monitoring for Kubernetes
37
-
Upload
kubeacademy -
Category
Technology
-
view
358 -
download
0
Transcript of KubeCon EU 2016: Interactive Monitoring for Kubernetes

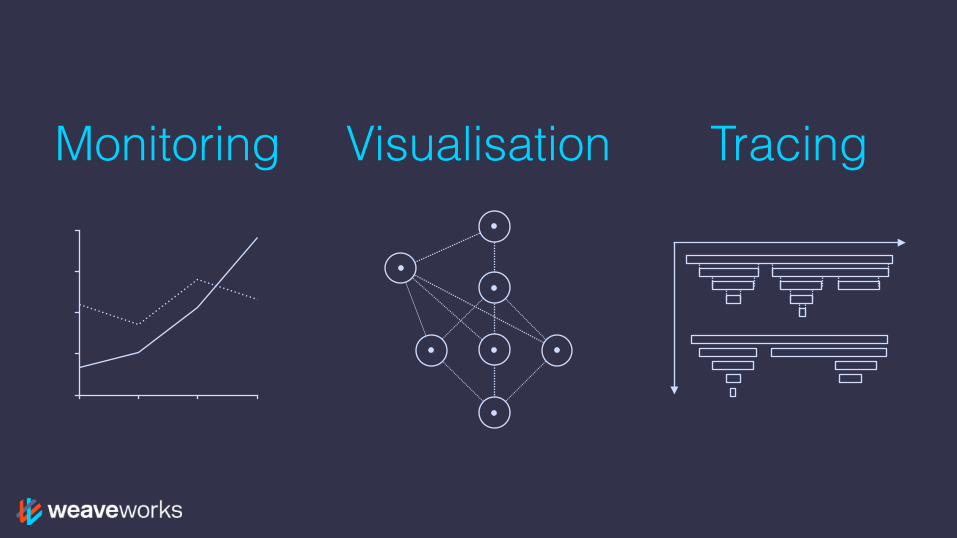
VisualisationMonitoring Tracing
0255075
100
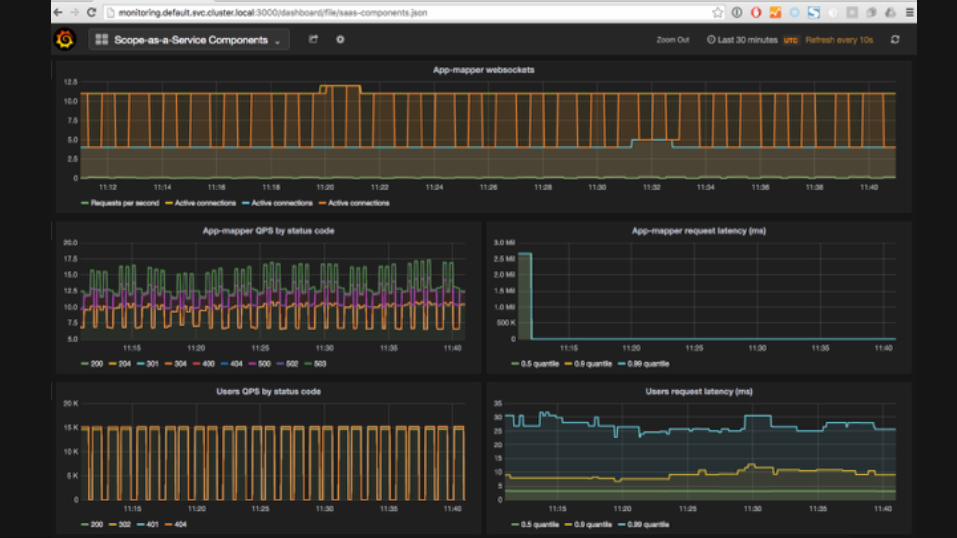
Monitoring
0255075
100
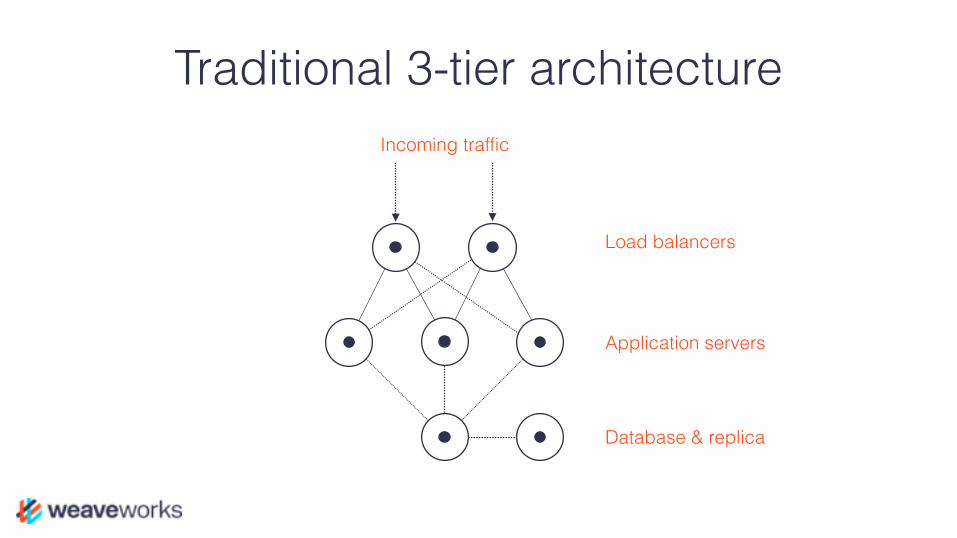
Traditional 3-tier architectureIncoming traffic
Load balancers
Application servers
Database & replica

Microservice architecture
Public APIWeb UI
NoSQL serversDatabase
Message Broker
Services


Microservices should be treated like cattle not pets
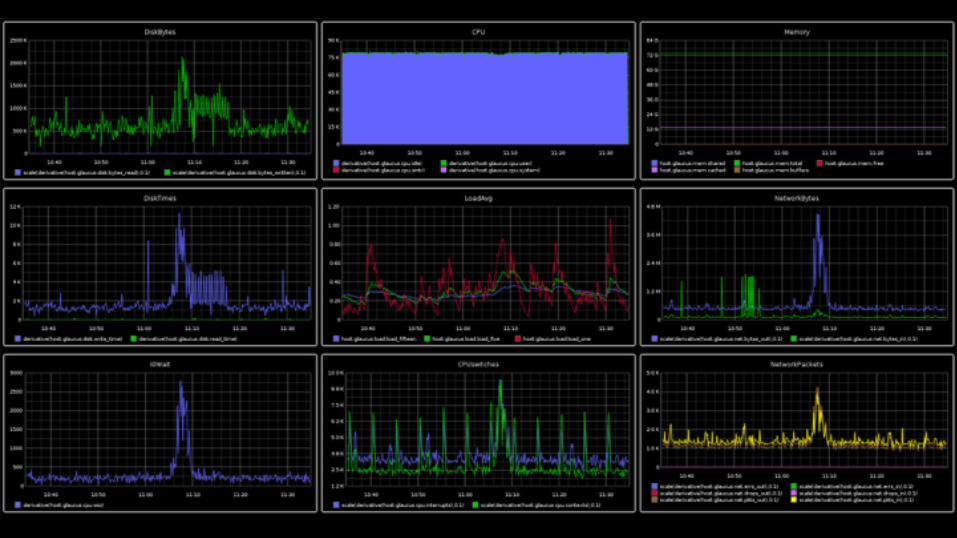

USE Method* - for every resource, check: • utilization, • saturation, and • errors
RED Method - for every service, check request: • rate, • error (rate), and • duration (distributions)
* http://www.brendangregg.com/usemethod.html
An alternative view
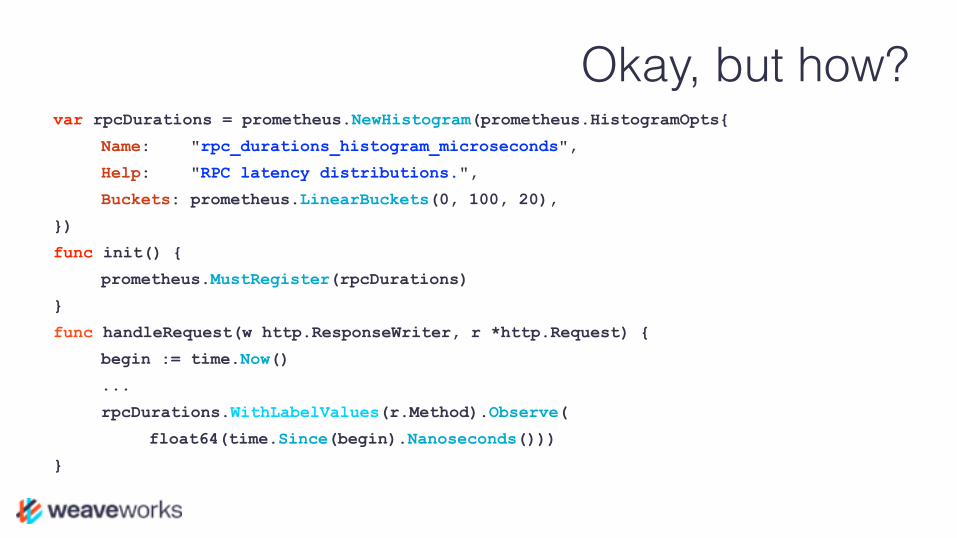
Okay, but how?var rpcDurations = prometheus.NewHistogram(prometheus.HistogramOpts{
Name: "rpc_durations_histogram_microseconds",
Help: "RPC latency distributions.",
Buckets: prometheus.LinearBuckets(0, 100, 20),
})
func init() {
prometheus.MustRegister(rpcDurations)
}
func handleRequest(w http.ResponseWriter, r *http.Request) {
begin := time.Now()
...
rpcDurations.WithLabelValues(r.Method).Observe(
float64(time.Since(begin).Nanoseconds()))
}
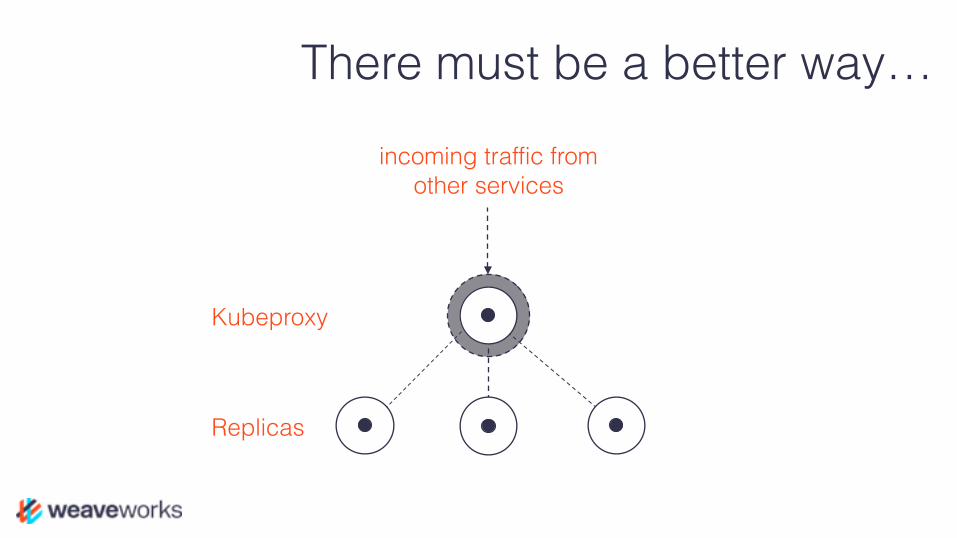
There must be a better way…
Kubeproxy
Replicas
incoming traffic from other services

Demo Time

Monitoring
0255075
100

Visualisation
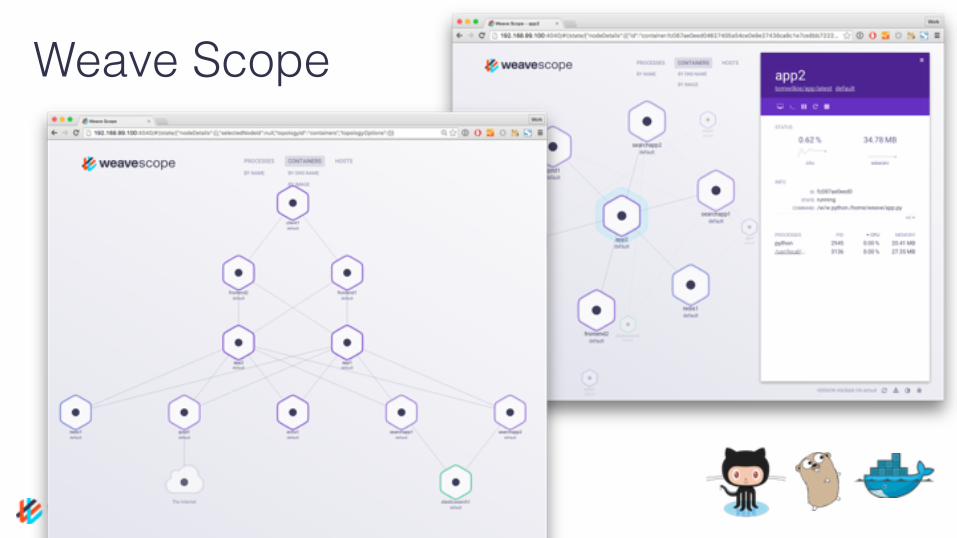
Weave Scope
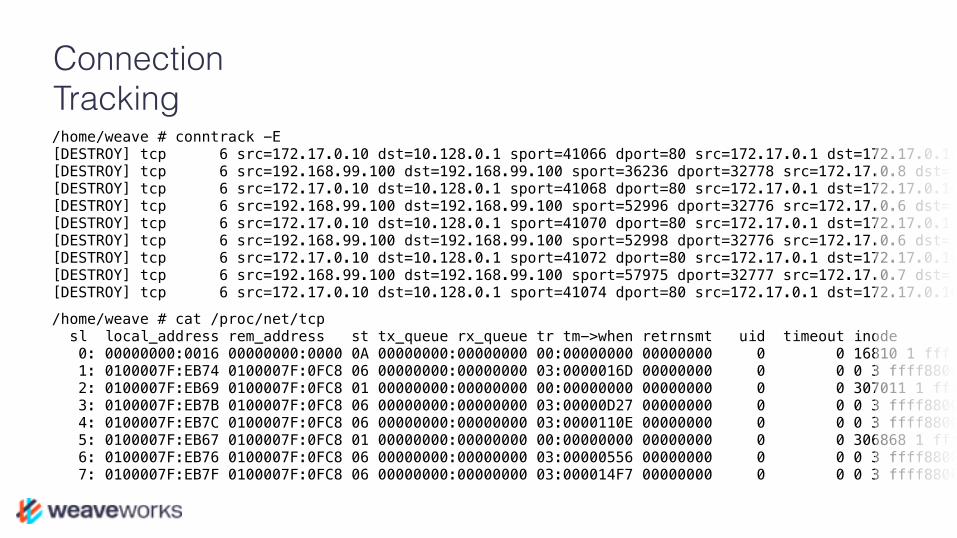
Connection Tracking/home/weave # conntrack -E [DESTROY] tcp 6 src=172.17.0.10 dst=10.128.0.1 sport=41066 dport=80 src=172.17.0.1 dst=172.17.0.10 sport=42525 dport=41066 [ASSURED] [DESTROY] tcp 6 src=192.168.99.100 dst=192.168.99.100 sport=36236 dport=32778 src=172.17.0.8 dst=192.168.99.100 sport=80 dport=36236 [ASSURED] [DESTROY] tcp 6 src=172.17.0.10 dst=10.128.0.1 sport=41068 dport=80 src=172.17.0.1 dst=172.17.0.10 sport=42525 dport=41068 [ASSURED] [DESTROY] tcp 6 src=192.168.99.100 dst=192.168.99.100 sport=52996 dport=32776 src=172.17.0.6 dst=192.168.99.100 sport=80 dport=52996 [ASSURED] [DESTROY] tcp 6 src=172.17.0.10 dst=10.128.0.1 sport=41070 dport=80 src=172.17.0.1 dst=172.17.0.10 sport=42525 dport=41070 [ASSURED] [DESTROY] tcp 6 src=192.168.99.100 dst=192.168.99.100 sport=52998 dport=32776 src=172.17.0.6 dst=192.168.99.100 sport=80 dport=52998 [ASSURED] [DESTROY] tcp 6 src=172.17.0.10 dst=10.128.0.1 sport=41072 dport=80 src=172.17.0.1 dst=172.17.0.10 sport=42525 dport=41072 [ASSURED] [DESTROY] tcp 6 src=192.168.99.100 dst=192.168.99.100 sport=57975 dport=32777 src=172.17.0.7 dst=192.168.99.100 sport=80 dport=57975 [ASSURED] [DESTROY] tcp 6 src=172.17.0.10 dst=10.128.0.1 sport=41074 dport=80 src=172.17.0.1 dst=172.17.0.10 sport=42525 dport=41074 [ASSURED]
/home/weave # cat /proc/net/tcp sl local_address rem_address st tx_queue rx_queue tr tm->when retrnsmt uid timeout inode 0: 00000000:0016 00000000:0000 0A 00000000:00000000 00:00000000 00000000 0 0 16810 1 ffff8800d79c1800 100 0 0 10 0 1: 0100007F:EB74 0100007F:0FC8 06 00000000:00000000 03:0000016D 00000000 0 0 0 3 ffff8800ae3f6e80 2: 0100007F:EB69 0100007F:0FC8 01 00000000:00000000 00:00000000 00000000 0 0 307011 1 ffff8800cf467040 21 4 30 10 -1 3: 0100007F:EB7B 0100007F:0FC8 06 00000000:00000000 03:00000D27 00000000 0 0 0 3 ffff8800d7a47538 4: 0100007F:EB7C 0100007F:0FC8 06 00000000:00000000 03:0000110E 00000000 0 0 0 3 ffff8800cf656c70 5: 0100007F:EB67 0100007F:0FC8 01 00000000:00000000 00:00000000 00000000 0 0 306868 1 ffff8800d79c1040 21 4 27 10 -1 6: 0100007F:EB76 0100007F:0FC8 06 00000000:00000000 03:00000556 00000000 0 0 0 3 ffff8800d37ac748 7: 0100007F:EB7F 0100007F:0FC8 06 00000000:00000000 03:000014F7 00000000 0 0 0 3 ffff8800d87f0c70
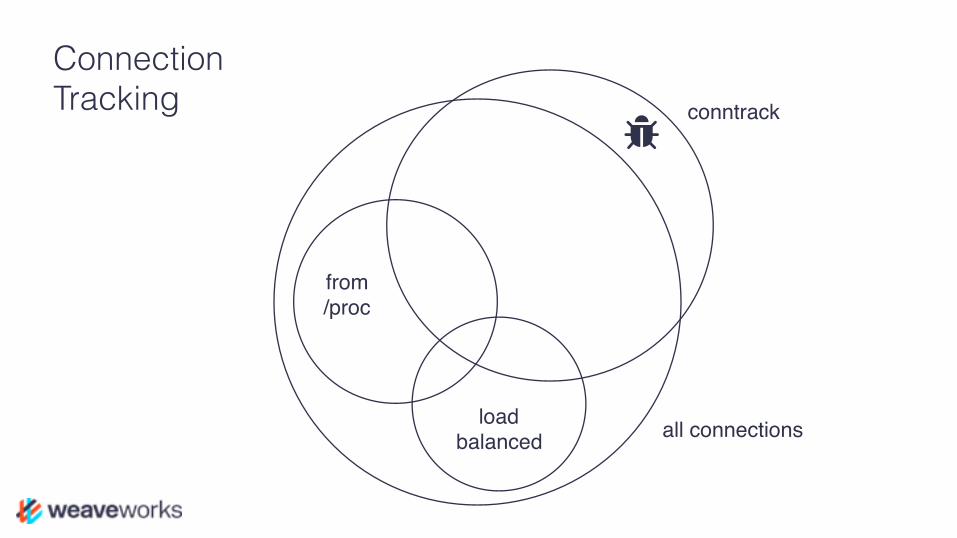
all connections
from /proc
conntrack!
Connection Tracking
load balanced
Demo Time
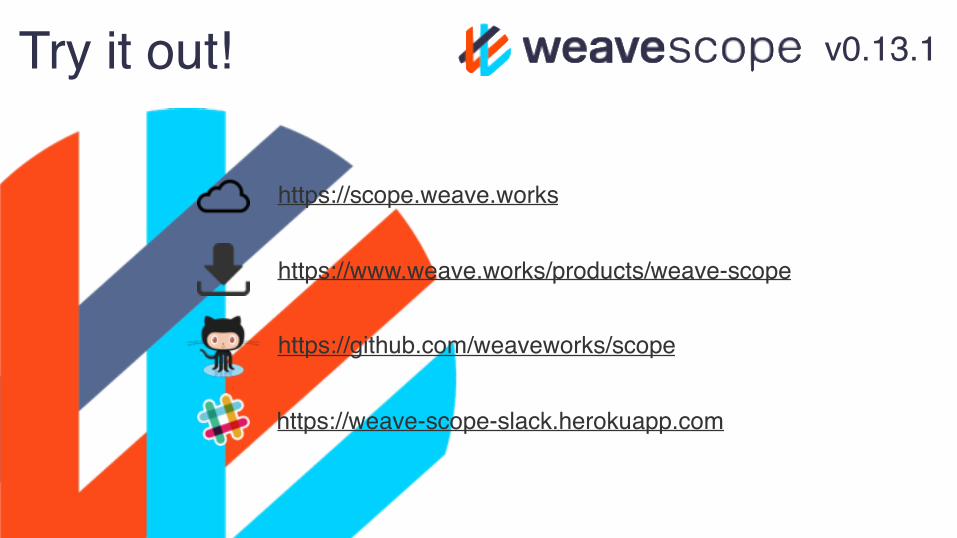
https://github.com/weaveworks/scope
Try it out!
https://weave-scope-slack.herokuapp.com
v0.13.1
https://www.weave.works/products/weave-scope
https://scope.weave.works
What does this look like with Kubernetes?
Visualisation
Tracing
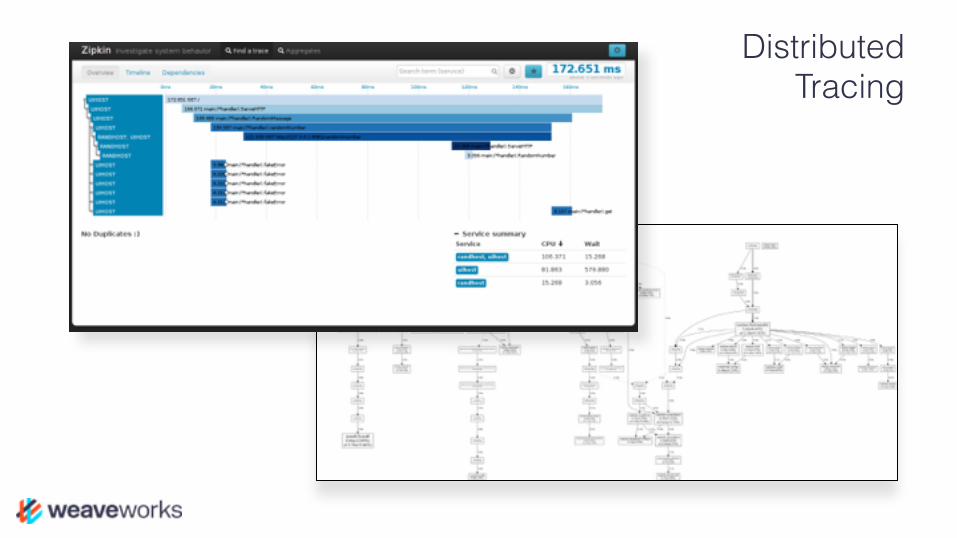
Distributed Tracing
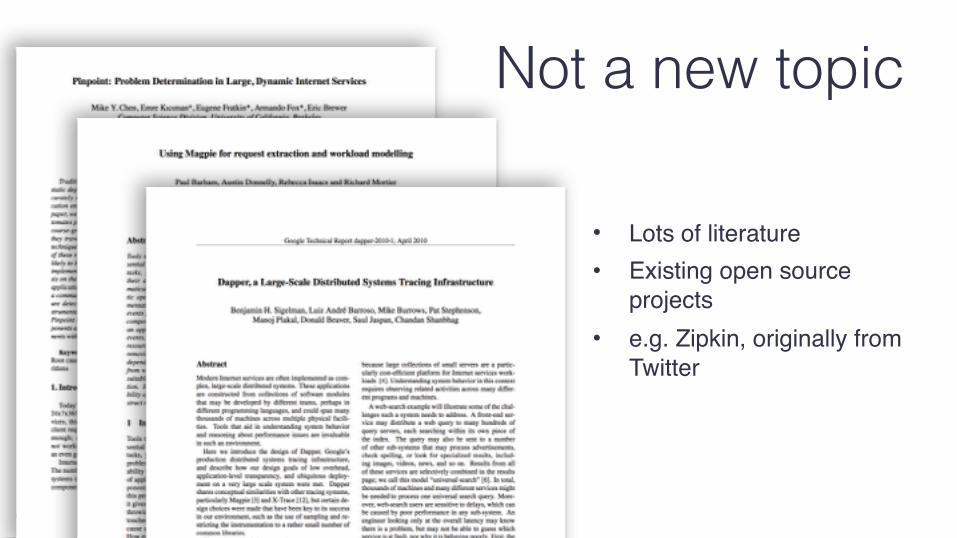
Not a new topic
• Lots of literature• Existing open source
projects• e.g. Zipkin, originally from
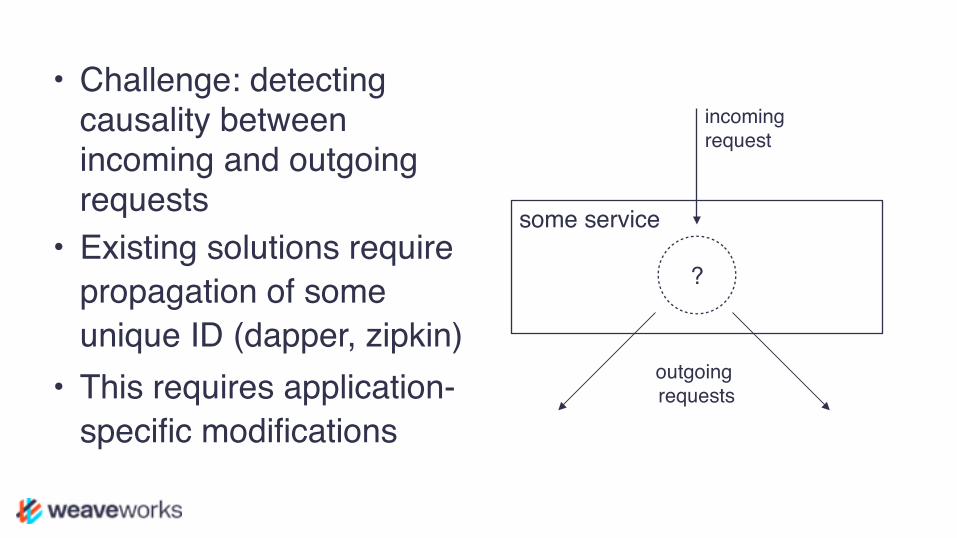
• Challenge: detecting causality between incoming and outgoing requests
• Existing solutions require propagation of some unique ID (dapper, zipkin)
• This requires application-specific modifications
some service
incomingrequest
outgoingrequests
?
Can this be done without application modifications?
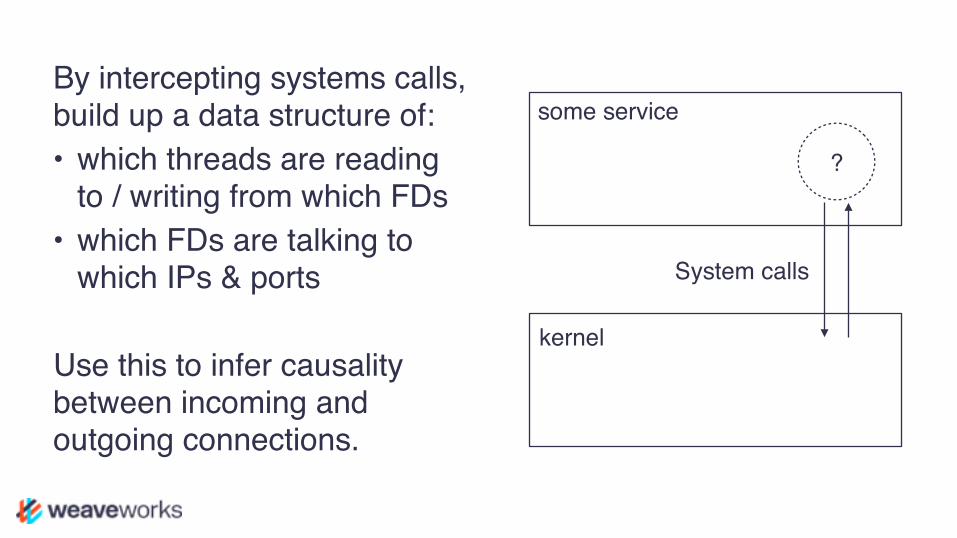
By intercepting systems calls, build up a data structure of:• which threads are reading
to / writing from which FDs• which FDs are talking to
which IPs & ports
Use this to infer causality between incoming and outgoing connections.
some service
kernel
?
System calls

Demo Time

Try it out!
https://github.com/weaveworks/scope/tree/master/experimental/tracer

Tracing

VisualisationMonitoring Tracing
0255075
100
https://weave-scope-slack.herokuapp.com
https://github.com/weaveworks/scope
https://github.com/weaveworks/flux
https://scope.weave.works
Links
https://github.com/weaveworks/scope/tree/master/experimental/tracer