KTH Industrial Engineering and Management - DiVA portal443320/FULLTEXT01.pdfSchool of Industrial...
80
KTH Industrial Engineering and Management
Transcript of KTH Industrial Engineering and Management - DiVA portal443320/FULLTEXT01.pdfSchool of Industrial...

KTH Industrial
Engineering and Management
i
Specific surface area of some
minerals commonly found in
granite
Isabelle E. Dubois
Licentiate thesis
Industrial Ecology
School of Industrial Engineering and Management
Royal Institute of Technology (KTH)
Stockholm, Sweden
2011
ii
Specific surface area of some minerals commonly found in
granite
© 2011 Isabelle Dubois
Oldenbourg Wissenschaftsverlag
Taylor & Francis Group
ISBN: 978-91-633-9472-0
ISSN: 1402-7615
TRITA-IM 2011:32
Contact info
Isabelle Dubois
Industrial Ecology
School of Industrial Engineering and Management
Royal Institute of Technology (KTH)
SE-100 44 Stockholm
Phone: +46 8 790 67 44
Mail: [email protected]
Printed in Sweden
Stockholm, 2011
Cover picture: SEM picture of a feature on a particle of Chlorite from the 2-4 mm fraction
iii
List of Appended Papers
This thesis is based on the following papers:
Paper I
Dubois I.E., Holgersson S., Allard S., Malmström M.E.:
Dependency of BET surface area on particle size for some granitic
materials
In the 4th Asian Pacific Symposium on RadioChemistry (APSORC ’09),
November 29 – December 4 2009, Napa, California, USA
Proc. Radiochim. Acta 1, 75–82 (2011)
Contribution: Main author, part of planning of the experiments, most of the
experimental work, part of the interpretation and review process
Paper II
Dubois I.E., Holgersson S., Allard S., Malmström M.E.:
Correlation between particle size and for chlorite and K-feldspar
In: P. Birkle & I.S. Torres-Alvorado (Eds), Water-Rock Interaction:
Proceedings of the 13th International Symposium on Water-Rock Interaction,
Guanajuato, Mexico, August 15-20 2010, Taylor & Francis group, London,
pp. 717-720.
Contribution: Main author, part of planning of the experiments, most of the
experimental work, part of the interpretation and review process

iv
v
Summary
The specific surface area, determined by the BET method, is a parameter often used to
scale results of mineral studies of surface reactions in terms of rate and capacity to the
field scale. Such extrapolations of results from small-scale laboratory experiments to the
field-scale are important within many environmental applications. An example of this is
for the prediction of radionuclide retention in the bedrock surrounding a deep repository
for radioactive waste, following failure of the engineered barriers, where radionuclides
may sorb onto minerals constituting the geological environment.
As a first step, the approach used in this work is to study the relationship between
specific surface area and the particle size (0.075-8 mm) and to approach the field scale via
measurements on large, centimetre-sized pieces, for seven natural minerals commonly
found in granite: apatite, biotite, chlorite, K-feldspar, hornblende, labradorite and
magnetite. The underlying assumption is that sorption of radionuclides can be related to
specific surface area of a particular mineral in a continuation of this project.
The results show that the phyllosilicates biotite and chlorite have a specific surface area
that is about 10 times larger than the other minerals. Over the range of particle size
fractions studied, the specific surface area varies between 0.1 and 1.2 m2g-1 for biotite and
chlorite. The other studied minerals have specific surface areas varying between 0.01 m2g-1
for the largest fraction and up to 0.06 - 0.12 m2g-1 for the smallest. Results show linear
relationships between the specific surface area and the inverse of the particle size for all
studied minerals for small particle sizes, as expected. For some minerals, however, the
data seemingly can be divided in two linear trends, where a change in internal surface
area, surface roughness and/or particle geometry as the particle size decreases may
explain this behaviour.
Interestingly, for larger particles, there is a deviation from the linearity observed for small
particles. Tentatively, this behaviour is attributed to a disturbed zone, created by the
mechanical treatment of the material during particle size reduction, extending throughout
small particles, but not altering an undisturbed core of the larger particles. In agreement
with this, measurements on large pieces show a surface area 5 to 150 times lower than
expected from the linear trends observed for the crushed material, implying an
overestimation of the surface area and possibly also of the sorption capacities of the rock
material from simple extrapolations of experimental results employing finely crushed
material to the field situation.

vi
Keywords: Granite, Mineral, Surface Area, BET, Sorption, Particle Size
vii
Résumé
La surface spécifique, déterminée par la méthode du BET, est fréquemment utilisée
comme facteur de normalisation pour les résultats d’études sur les réactions de surface,
pour relier à l’échelle du terrain. Ce genre d’extrapolations des résultats d’expérience en
laboratoire à l’échelle du terrain est important dans beaucoup d’applications
environnementales. Un exemple est pour la prédiction de la rétention de radionucléides
dans la roche entourant le site de stockage des déchets nucléaires, après défaillance des
différentes barrières, les radionucléides peuvent sorber à la surface des minéraux
constituant l’environnement géologique.
Dans un premier temps, l’approche utilisée dans cette thèse est d’étudier la relation entre
la surface spécifique et la taille des particules (0.075-8 mm) et d’approcher l’échelle du
terrain par des mesures sur de larges morceaux, pour sept minéraux naturels,
communément constitutifs du granite : apatite, biotite, chlorite, K-feldspath, hornblende,
labradorite et magnétite. L’hypothèse sous-jacente est que la sorption des radionucléides
peut être liée à la surface spécifique d’un minéral particulier dans la continuité de ce
projet.
Les résultats montrent que les phyllosilicates, biotite et chlorite, ont une surface
spécifique près de 10 fois supérieure à celle des autres minéraux. Sur la gamme de
fractions étudiées, la surface spécifique varie entre 0.1 et 1.2 m2g-1 pour la biotite et la
chlorite. Les autres minéraux étudiés ont une surface spécifique qui varie entre 0.01 m2g-1
pour la fraction la plus large et 0.06-0.12 m2g-1 pour la plus petite. Les résultats montrent
une relation linéaire entre la surface spécifique et l’inverse de la taille des particules,
comme il était prévisible. Cependant, pour certains minéraux, les données peuvent être
séparées en deux tendances, où une explication serait un changement dans la surface
interne, la rugosité de surface, et/ou la géométrie des particules lorsque la taille des
particules décroit. Une déviation à la linéarité observée pour les petites particules peut être
constatée pour les particules les plus larges. Cette tendance peut être attribuée à une zone
perturbée, créée par le traitement du matériel lors de la réduction en taille des particules,
mais sans altérer un centre intact pour les particules les plus larges.
En accord avec cela, les mesures sur les larges morceaux ont une surface spécifique 5 à
150 fois plus petite que ce qui pourrait être attendu à partir des droites tracées pour les
fractions de matériel broyé. Ceci implique une surestimation de la surface spécifique et
viii
probablement des capacités de sorption de la roche à partir d’extrapolation d’expériences
réalisées sur du matériel broyé en fine poudre.
ix
Sammanfattning
Den specifika ytan, som ofta bestäms enligt BET-metoden, är en parameter som ofta
används för att skala reaktionshastigheter och kapaciteter hos mineralytor mellan
observationsskalor. Sådana extrapoleringar av resultat från småskaliga
laboratorieexperiment till fältskalan är viktig inom många miljöapplikationer. Ett exempel
på detta är för prediktion av radionuklidretention i berggrunden kring ett djupförvar för
radioaktivt avfall, efter potentiell kollaps av de tekniska barriärerna, där radioaktiva ämnen
kan sorbera på de mineraler som utgör den geologiska miljön.
I detta arbete har sambandet mellan specifika ytan och partikelstorlek (0,075 till 8 mm)
studerats och ett steg mot fältskalan har tagits via mätningar på centimeterstora bitar för
sju naturliga mineraler vilka är vanligt förekommande i granit: biotit, klorit, K-fältspat,
hornblände, labradorit, magnetit och apatit. Det underliggande antagandet är att sorption
av radionuklider kan relateras till specifika ytan av ett visst mineral i en fortsättning av
projektet.
Resultaten visar att skiktsilikaterna biotit och klorit har en specifik yta som är ungefär 10
gånger större än de andra mineralernas. För de studerade storleksfraktioner varierar den
specifika ytan mellan 0,1 och 1,2 m2g-1 för biotit och klorit. De andra studerade
mineralerna har specifika ytor som varierar från 0,01 m2g-1 för den största fraktionen och
upp till 0,06 till 0,12 m2g-1 för de minsta. Som förväntat visar resultaten linjärt samband
mellan den specifika ytan och inversen av partikelstorleken för alla studerade mineraler
för små partikelstorlekar. För en del mineraler, kan data delas upp i två linjära trender, där
en förändring i inre yta, ytråhet och/eller partikelgeometri mellan partikelstorlekar kan
förklara detta beteende.
För större partiklar finns det en avvikelse från den linjäritet som observerats för små
partiklar. Preliminärt tillskriver vi detta beteende en störd zon, skapad av mekanisk
behandling av materialet under partikelstorleksreduktionen. För små partiklar sträcker sig
den störda zonen genom hela partikeln, medan store partiklar har en mer ostörd kärna,
med lägre specifik inre ytarea. Samstämmigt med denna hypotes visade mätningar på de
centimeterstora bitarna en specifik yta som är 5 till 150 gånger lägre än förväntat från den
linjära trenden för det krossade materialet. Detta innebär en överskattning av ytan och
eventuellt även av sorptionskapaciteten i bergmaterial från extrapoleringar av
experimentella resultat från det finfördelade materialet till fältskalan.

x
xi
Table of Contents
List of Appended Papers ...................................................................................... iii
Summary .................................................................................................................. v
Résumé ................................................................................................................... vii
Sammanfattning ..................................................................................................... ix
1. Introduction ............................................................................................... 1
1.1. Background ................................................................................................ 1
1.2. Nuclear power ........................................................................................... 2
1.3. Objective and scope .................................................................................. 4
2. Theory ........................................................................................................ 5
2.1. Particle model ............................................................................................ 5
2.2. Principles of the BET analysis ................................................................. 9
3. Minerals .................................................................................................... 15
3.1. Specimens ................................................................................................. 15
3.2. Sample preparation ................................................................................. 26
3.3. Characterisation ....................................................................................... 26
4. Results and Discussion ........................................................................... 41
4.1. Results ....................................................................................................... 41
4.2. Discussion ................................................................................................ 47
5. Conclusions .............................................................................................. 59
6. References ................................................................................................ 61
Appendix 1: Description of particle size analysis ............................................. 65

xii
1
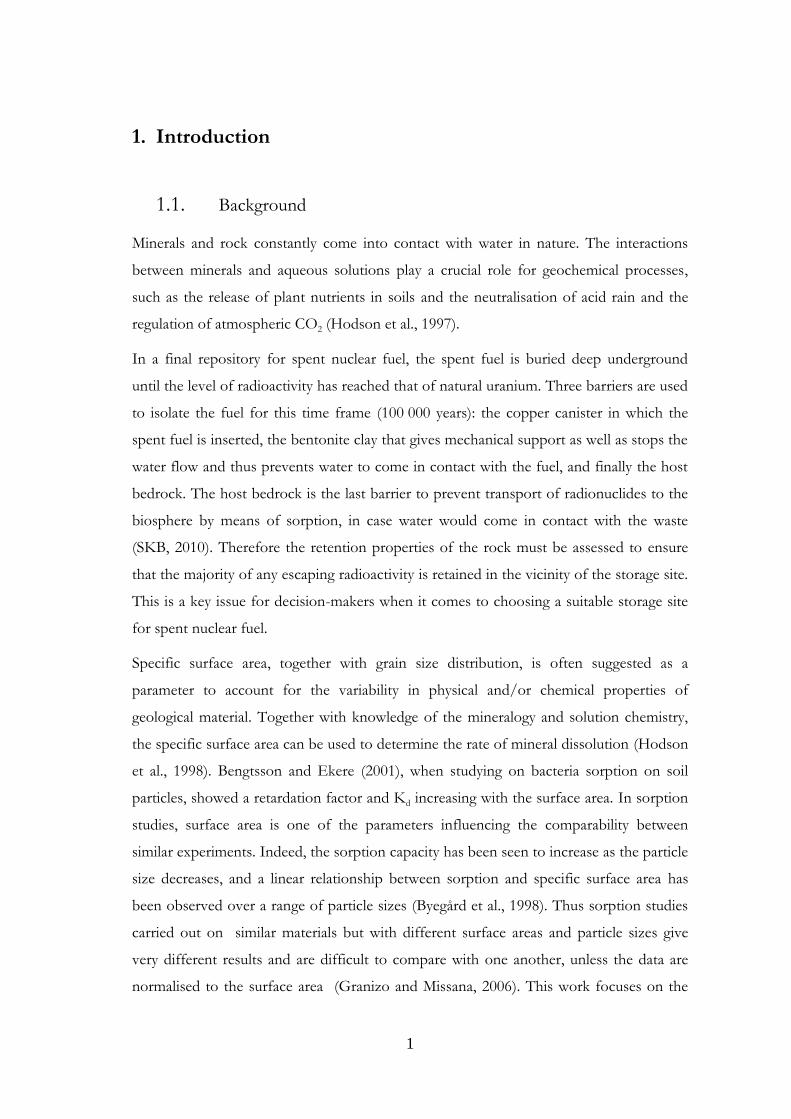
1. Introduction
1.1. Background
Minerals and rock constantly come into contact with water in nature. The interactions
between minerals and aqueous solutions play a crucial role for geochemical processes,
such as the release of plant nutrients in soils and the neutralisation of acid rain and the
regulation of atmospheric CO2 (Hodson et al., 1997).
In a final repository for spent nuclear fuel, the spent fuel is buried deep underground
until the level of radioactivity has reached that of natural uranium. Three barriers are used
to isolate the fuel for this time frame (100 000 years): the copper canister in which the
spent fuel is inserted, the bentonite clay that gives mechanical support as well as stops the
water flow and thus prevents water to come in contact with the fuel, and finally the host
bedrock. The host bedrock is the last barrier to prevent transport of radionuclides to the
biosphere by means of sorption, in case water would come in contact with the waste
(SKB, 2010). Therefore the retention properties of the rock must be assessed to ensure
that the majority of any escaping radioactivity is retained in the vicinity of the storage site.
This is a key issue for decision-makers when it comes to choosing a suitable storage site
for spent nuclear fuel.
Specific surface area, together with grain size distribution, is often suggested as a
parameter to account for the variability in physical and/or chemical properties of
geological material. Together with knowledge of the mineralogy and solution chemistry,
the specific surface area can be used to determine the rate of mineral dissolution (Hodson
et al., 1998). Bengtsson and Ekere (2001), when studying on bacteria sorption on soil
particles, showed a retardation factor and Kd increasing with the surface area. In sorption
studies, surface area is one of the parameters influencing the comparability between
similar experiments. Indeed, the sorption capacity has been seen to increase as the particle
size decreases, and a linear relationship between sorption and specific surface area has
been observed over a range of particle sizes (Byegård et al., 1998). Thus sorption studies
carried out on similar materials but with different surface areas and particle sizes give
very different results and are difficult to compare with one another, unless the data are
normalised to the surface area (Granizo and Missana, 2006). This work focuses on the
2
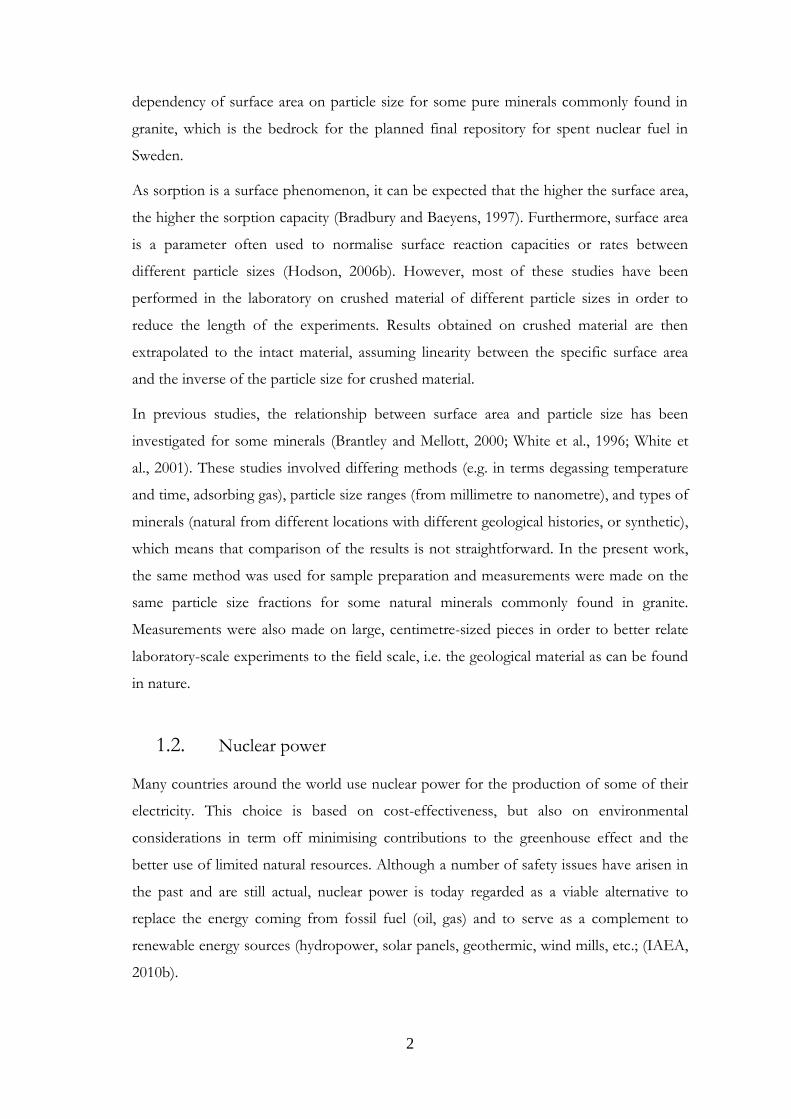
dependency of surface area on particle size for some pure minerals commonly found in
granite, which is the bedrock for the planned final repository for spent nuclear fuel in
Sweden.
As sorption is a surface phenomenon, it can be expected that the higher the surface area,
the higher the sorption capacity (Bradbury and Baeyens, 1997). Furthermore, surface area
is a parameter often used to normalise surface reaction capacities or rates between
different particle sizes (Hodson, 2006b). However, most of these studies have been
performed in the laboratory on crushed material of different particle sizes in order to
reduce the length of the experiments. Results obtained on crushed material are then
extrapolated to the intact material, assuming linearity between the specific surface area
and the inverse of the particle size for crushed material.
In previous studies, the relationship between surface area and particle size has been
investigated for some minerals (Brantley and Mellott, 2000; White et al., 1996; White et
al., 2001). These studies involved differing methods (e.g. in terms degassing temperature
and time, adsorbing gas), particle size ranges (from millimetre to nanometre), and types of
minerals (natural from different locations with different geological histories, or synthetic),
which means that comparison of the results is not straightforward. In the present work,
the same method was used for sample preparation and measurements were made on the
same particle size fractions for some natural minerals commonly found in granite.
Measurements were also made on large, centimetre-sized pieces in order to better relate
laboratory-scale experiments to the field scale, i.e. the geological material as can be found
in nature.
1.2. Nuclear power
Many countries around the world use nuclear power for the production of some of their
electricity. This choice is based on cost-effectiveness, but also on environmental
considerations in term off minimising contributions to the greenhouse effect and the
better use of limited natural resources. Although a number of safety issues have arisen in
the past and are still actual, nuclear power is today regarded as a viable alternative to
replace the energy coming from fossil fuel (oil, gas) and to serve as a complement to
renewable energy sources (hydropower, solar panels, geothermic, wind mills, etc.; (IAEA,
2010b).

3
However, one issue that remains to be resolved in many countries is the treatment and
storage of the highly radioactive spent nuclear fuel (ABU-KHADER, 2009). Each country
has to work out its own strategy, but a common solution is to bury the spent fuel deep
underground and to let it decay to the natural level of background radioactivity. Partial
reprocessing of the fuel is already an option used by some countries, as most of the
energy content of the fuel still remains after one run in a reactor (ABU-KHADER, 2009).
Selective separation makes it possible to sort out waste from fissile matter. A potentially
fruitful path for investigation would be to develop this selective separation further, so that
some waste material can be sorted out for irradiation, which would decrease the half-life
and long-term radiotoxicity. The aims are to reduce the volume and radiotoxicity of the
waste, as well as the storage time (Lidskog and Andersson, 2002).
Sweden obtains about 40-45% of its electricity from nuclear power. The rest mostly
comes from hydropower, while wind-mills produce only a few percent. In Sweden, the
choice has been made to not reprocess the spent fuel, but instead to store it in a final
repository in a deep underground facility after its removal from the reactor and
intermediate storage water pools (IAEA, 2010a).
The Swedish Nuclear Fuel and Waste Management Co. (SKB) is in charge of the
investigation, building of repositories and handling of the spent fuel in Sweden. On the
basis of extensive studies, SKB has proposed that the final repository should be located at
the site of Forsmark, on the Swedish east coast, north of Stockholm. The concept for
spent fuel storage is called KBS-3, and consists of three barriers surrounding the fuel: the
copper canister, in which the fuel assemblages will be sealed; a thick layer of bentonite, to
prevent groundwater to come in contact with the fuel and provide mechanical support;
and finally the host bedrock (SKB, 2010). It is important to provide scientific evidence to
authorities and decision-makers that the spent fuel will be safe under the considered
storage time, 104 to 105 years. The geological history of Sweden, and Scandinavia, shows
that the bedrock can be considered stable. The greatest threat to repository safety is the
intrusion of groundwater. In the event that the individual engineered barriers would fail,
groundwater in direct contact with the spent fuel would allow radionuclides to spread
beyond the engineered barriers of the repository and then possibly reach the biosphere
(Smith et al., 2008).
The Swedish bedrock consists mainly of granitic rock, such as diorite and granodiorite
(DRAKE et al., 2006). An underground laboratory has been built by SKB at Äspö, on the
4
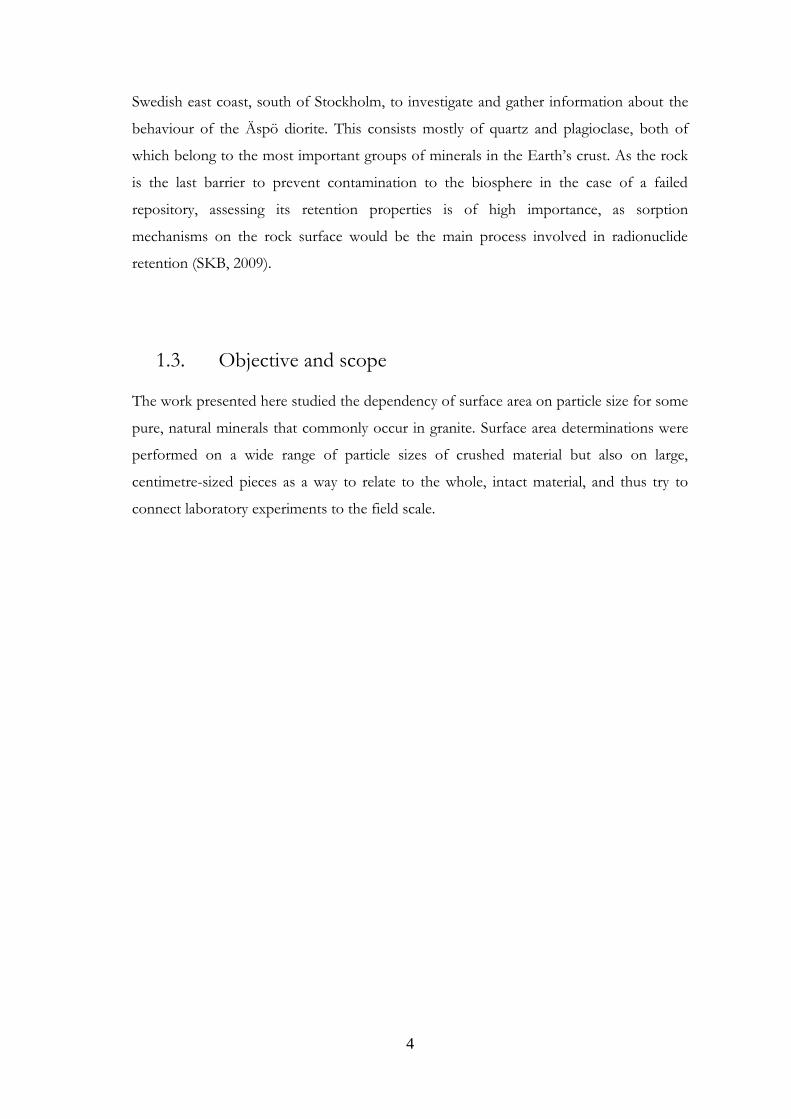
Swedish east coast, south of Stockholm, to investigate and gather information about the
behaviour of the Äspö diorite. This consists mostly of quartz and plagioclase, both of
which belong to the most important groups of minerals in the Earth’s crust. As the rock
is the last barrier to prevent contamination to the biosphere in the case of a failed
repository, assessing its retention properties is of high importance, as sorption
mechanisms on the rock surface would be the main process involved in radionuclide
retention (SKB, 2009).
1.3. Objective and scope
The work presented here studied the dependency of surface area on particle size for some
pure, natural minerals that commonly occur in granite. Surface area determinations were
performed on a wide range of particle sizes of crushed material but also on large,
centimetre-sized pieces as a way to relate to the whole, intact material, and thus try to
connect laboratory experiments to the field scale.
5
2. Theory
2.1. Particle model
The work consisted determining the specific surface area (SSA, m2g-1) for different
fractions of different minerals using the BET method where the external and internal
surface area of a particle are measured via adsorption of a measuring gas, called the
adsorbate (Brunauer et al., 1938). The external surface area (SSAext) includes the geometric
surface area and all prominences and surface of cracks that are wider than they are deep
(Gregg and Sing, 1982; Sing et al., 1985). Sayari et al. (1991) suggest that the external
surface area is the area available for multilayer physical adsorption. It is then the overall
BET surface area, without the contribution from micropores.
The internal surface area (SSAint), on the other hand, includes walls of cracks, pores and
fractures that are deeper than they are wide, and that are accessible to the measuring gas.
Since the accessibility depends on the size and shape of the gas molecules, the measurable
area (and also the volume) of the internal surface depends on the dimensions of the gas
molecules. It should be noted that the determination of internal surface area is not a
determination of porosity. In fact, the internal surface area measures the surface
accessible inside a particle, where layers of gas molecules cover the surfaces of pores,
cavities, cracks and fractures. In porosity measurements, the inside of the particle is filled
under rising pressure until the saturation pressure is (almost) reached. This allows pore
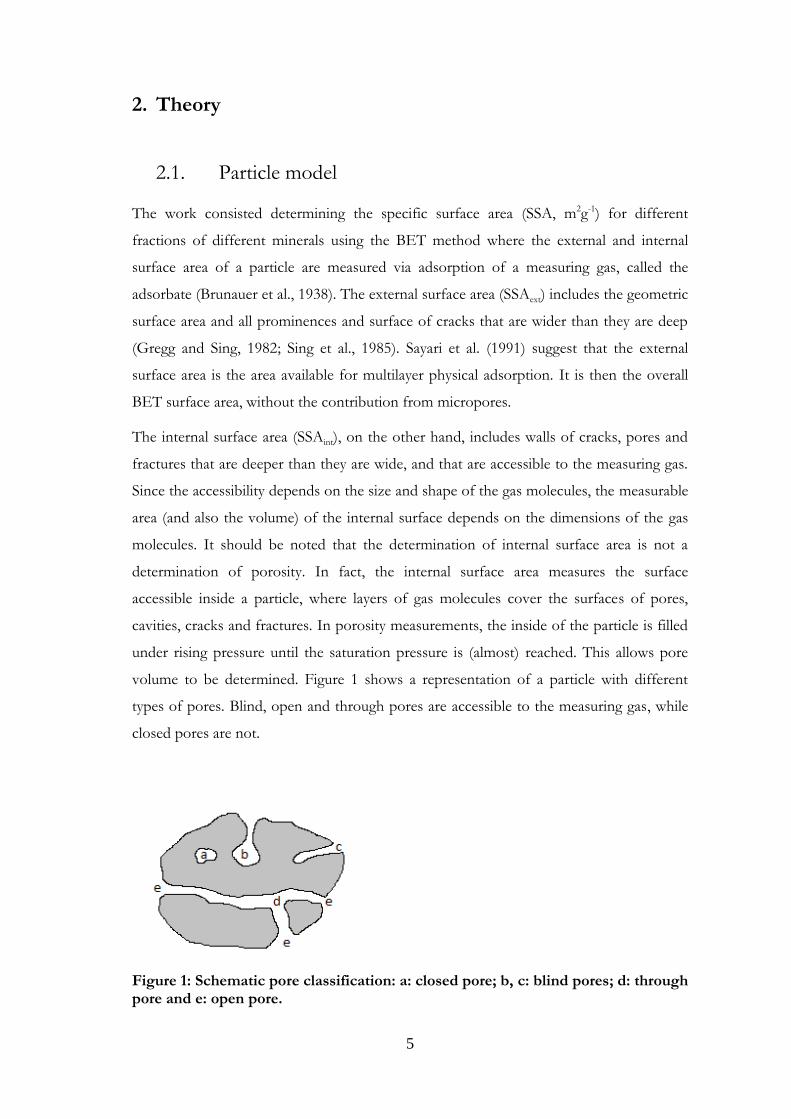
volume to be determined. Figure 1 shows a representation of a particle with different
types of pores. Blind, open and through pores are accessible to the measuring gas, while
closed pores are not.
Figure 1: Schematic pore classification: a: closed pore; b, c: blind pores; d: through pore and e: open pore.
6
The roughness of a solid, expressed via a roughness factor, , is the ratio of the external
surface to the chosen geometric surface. It is therefore important to assess the particle
geometry as accurately as possible, if particles can be approximated to spheres,
parallelepipeds, cylinders, etc.
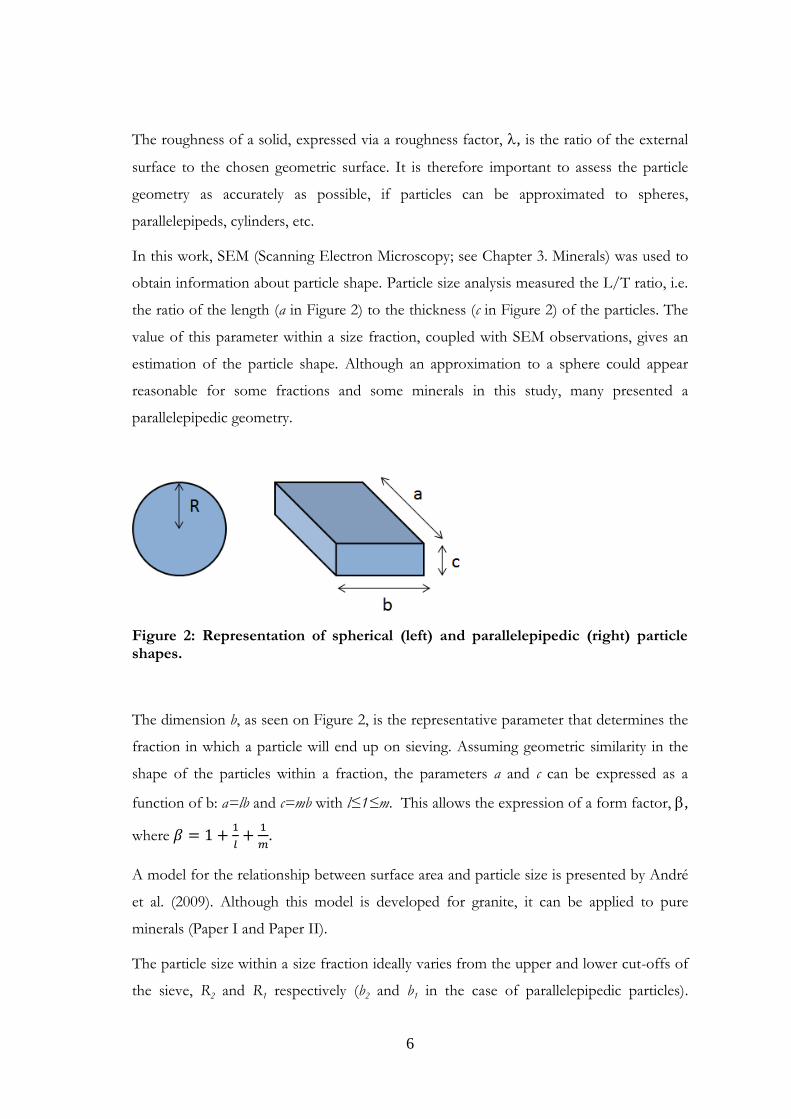
In this work, SEM (Scanning Electron Microscopy; see Chapter 3. Minerals) was used to
obtain information about particle shape. Particle size analysis measured the L/T ratio, i.e.
the ratio of the length (a in Figure 2) to the thickness (c in Figure 2) of the particles. The
value of this parameter within a size fraction, coupled with SEM observations, gives an
estimation of the particle shape. Although an approximation to a sphere could appear
reasonable for some fractions and some minerals in this study, many presented a
parallelepipedic geometry.
Figure 2: Representation of spherical (left) and parallelepipedic (right) particle shapes.
The dimension b, as seen on Figure 2, is the representative parameter that determines the
fraction in which a particle will end up on sieving. Assuming geometric similarity in the
shape of the particles within a fraction, the parameters a and c can be expressed as a
function of b: a=lb and c=mb with l≤1≤m. This allows the expression of a form factor, ,
where
.
A model for the relationship between surface area and particle size is presented by André
et al. (2009). Although this model is developed for granite, it can be applied to pure
minerals (Paper I and Paper II).
The particle size within a size fraction ideally varies from the upper and lower cut-offs of
the sieve, R2 and R1 respectively (b2 and b1 in the case of parallelepipedic particles).
7
Assuming that the distribution of particle size is rectangular in a fraction, the inverse of
the representative particle size is calculated as follows
for spherical particles; (1)
for parallelepipedic particles. (2)
The external specific surface area SSAext (m2.g-1) of a perfectly smooth particle is that
particle’s area divided by the volume times the density of the material.
, for spherical particles; (3)
, for parallelepipedic particles. (4)
The contribution from the internal surface area is noted aint (m2.m-3). The ratio of the
internal surface area to the density of the material gives the internal specific surface area,
SSAint.
(5)
The notion of a disturbed zone is introduced, to account for the changes created on a
surface layer by mechanical treatment of the material. The release from the weight of the
surrounding rock matrix and the mechanical treatment when drilling, sawing, crushing
and sieving create disturbances on the vicinity of the surface. New surfaces are created
and cracks may open, and the properties of these fresh surfaces may be different from
those originally present in the material. The disturbed zone can be assumed to have a
constant thickness, , around the particle and an additional surface area compared with
the undisturbed core of the particle.
8
a.
b.
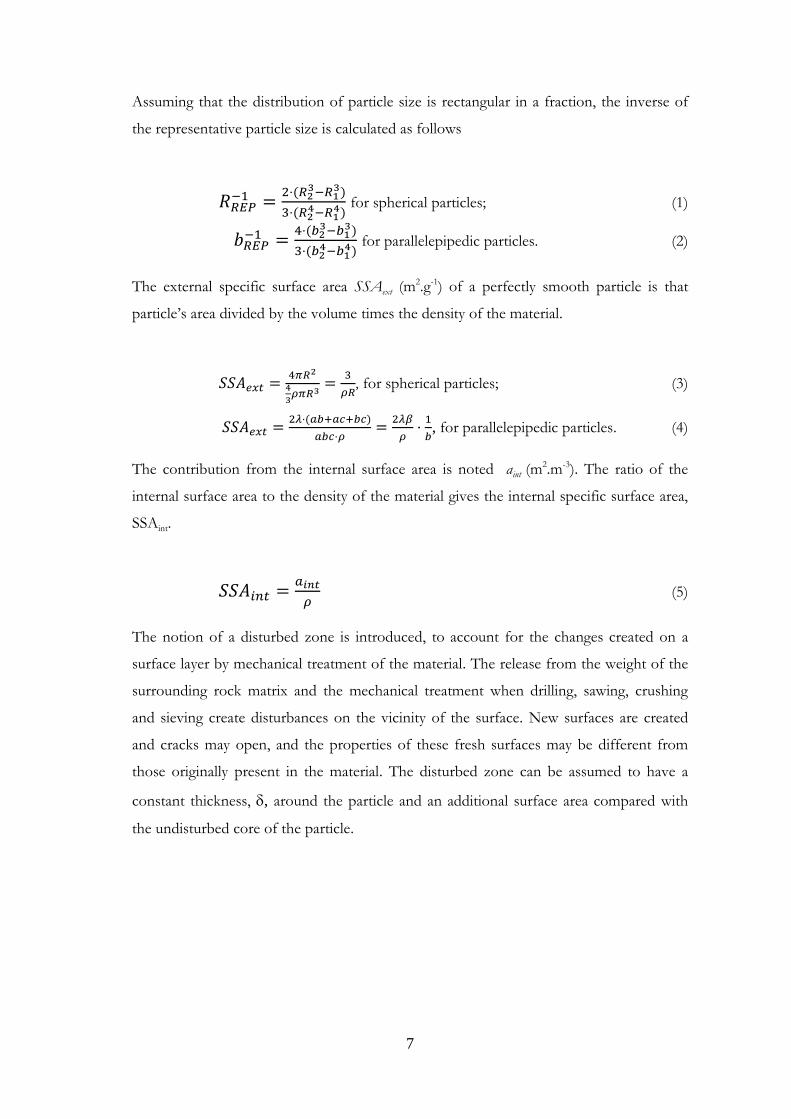
Figure 3: Conceptual view of a transverse section of a particle for four different particle sizes, for spherical (a) and parallelepipedic (b) particles. The large particles consist of a core of intact material, in grey, surrounded by a layer of disturbed zone, in black. Small particles only consist of disturbed zone.
For particles where the representative particle size is smaller than the thickness of the
disturbed zone (R≤ for spherical particles or c≤2 for parallelepipeds, see Figure 3), the
whole volume of the particle only consists of the disturbed zone, and the mathematical
expression is the ratio of the surface area of the disturbed zone, adist, to the density of the
material.
(6)
However, when particle size increases, a layer of disturbed zone surrounds a core of intact
material. The expression for the additional surface area within the disturbed zone
becomes (see Papers I and II)
for spheres where R>; (7)
[
(
) (
)
(
) (
)
] for
parallelepipeds where c>2. (8)
9
Thus, the total specific surface area measured has different expressions, depending on the
particle size. A linear relationship between the surface area and the inverse of the particle
size is expected for particles with size equal to or smaller than the disturbed layer.
for spheres where R≤; (9)
for parallelepipeds where c≤2. (10)
A deviation from linearity appears as the particle size increase and a core of intact
material becomes surrounded by a layer of disturbed material.
for spheres where R>; (11)
[
(
) (
)
(
) (
)
] for
parallelepipeds where c>2. (12)
2.2. Principles of the BET analysis
Theory 2.2.1.
In this study, surface area was determined using the Brunauer – Emmet – Teller (BET)
method (Brunauer et al., 1938). The method is based on the physical adsorption of gases
on the external and accessible internal surfaces of a porous material. This material is
surrounded by and in equilibrium with the measuring gas at a temperature T and a relative
vapour pressure, p/p0, and the material adsorbs a certain amount of gas. The amount of
adsorbed gas depends on its relative vapour pressure and is proportional to the external
and internal surface of the material (Fagerlund, 1973).
10
The BET method is the most widely used standard procedure for the determination of
the surface area of porous material The BET equation can be expressed as follows (Sing
et al., 1985):
(
) (13)
where p is the pressure and p0 the saturation pressure of the gas. The parameter
represents the amount adsorbed at the relative pressure p/p0 and is the monolayer
capacity, i.e. the quantity of gas needed for the surface to be covered with exactly a
completed physically adsorbed monolayer. The constant C is also called the BET
constant. It is related exponentially to the enthalpy (heat) of adsorption in the first
adsorbed layer. It is used to characterize the shape of the isotherm in the BET range, and
gives an indication of the magnitude of the adsorbate-adsorbent interaction energy (Sing
et al., 1985).
The BET equation requires linearity between
and p/p0, which is called the
BET plot. The range of linearity is limited to 0.05≤p/p0≤0.3. A linear regression can be
made where the slope s and the intercept i depend only on the constant C and the
monolayer capacity na.
and
(14 a, b)
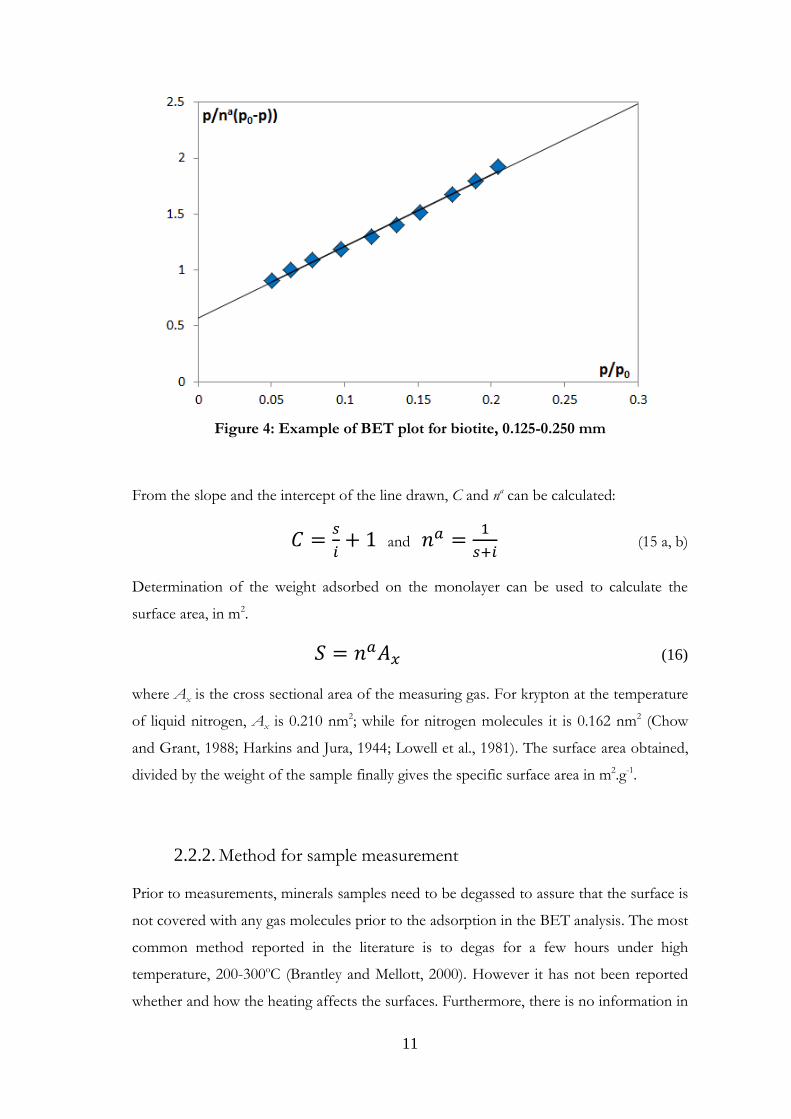
An example of a BET plot is presented in Figure 4.
11
Figure 4: Example of BET plot for biotite, 0.125-0.250 mm
From the slope and the intercept of the line drawn, C and na can be calculated:
and
(15 a, b)
Determination of the weight adsorbed on the monolayer can be used to calculate the
surface area, in m2.
(16)
where Ax is the cross sectional area of the measuring gas. For krypton at the temperature
of liquid nitrogen, Ax is 0.210 nm2; while for nitrogen molecules it is 0.162 nm2 (Chow
and Grant, 1988; Harkins and Jura, 1944; Lowell et al., 1981). The surface area obtained,
divided by the weight of the sample finally gives the specific surface area in m2.g-1.
Method for sample measurement 2.2.2.
Prior to measurements, minerals samples need to be degassed to assure that the surface is
not covered with any gas molecules prior to the adsorption in the BET analysis. The most
common method reported in the literature is to degas for a few hours under high
temperature, 200-300oC (Brantley and Mellott, 2000). However it has not been reported
whether and how the heating affects the surfaces. Furthermore, there is no information in
12
the literature on whether the minerals used in this study have a similar response to
heating. Therefore it was decided to degas at ambient temperature.
The time chosen for degassing all samples was set to 25h. It was concluded that 25h was
sufficient for all minerals studied since surface area measurements on fractions of
labradorite and magnetite gave similar results, within the error margin, showing that even
10h degassing time was sufficient to dry the surfaces. A simple method to see whether a
sample has been sufficiently degassed is to check the pressure after cutting off the
vacuum. If the pressure is stable over time (usually up to 1-2 minutes), the sample is
degassed. However the large pieces, however, needed much longer degassing time, from
one week to almost a month, until there no longer was an increase in the pressure after
cutting off the vacuum. The large pieces need longer time to degas because diffusion
processes in the material are involved to remove any molecule from the surface. Some
repeated measurements on crushed material were made, either directly after a previous
measurement or additional degassing. The results showed good compatibility, with similar
range of variation for all samples, irrespective of whether measurements were directly
sequential or interspersed with degassing.
Nitrogen gas is usually used for surface area determination by gas adsorption. However,
krypton is an alternative gas more suited to material with low surface area (Bishay, 1981;
Chow and Grant, 1988; Rothenberg et al., 1987; Youssef et al., 1979). Indeed, the
saturation pressure of krypton is much lower (2.5 torr for krypton against 760 torr for
nitrogen (Webb and Orr, 1997) than this of nitrogen. As the measurements are based on
measuring the difference between the dosed pressure (quantity of gas added at each step)
and the remaining pressure (after a certain proportion of gas molecules have sorbed on
the surface), a low saturation pressure makes it easier to detect small pressure changes.
Therefore a comparison was made here between measurements with nitrogen and
krypton for two minerals with an assumed low surface area, labradorite and magnetite,
and also one with an assumed higher surface area, chlorite. The results are presented in
Figure 5.
13
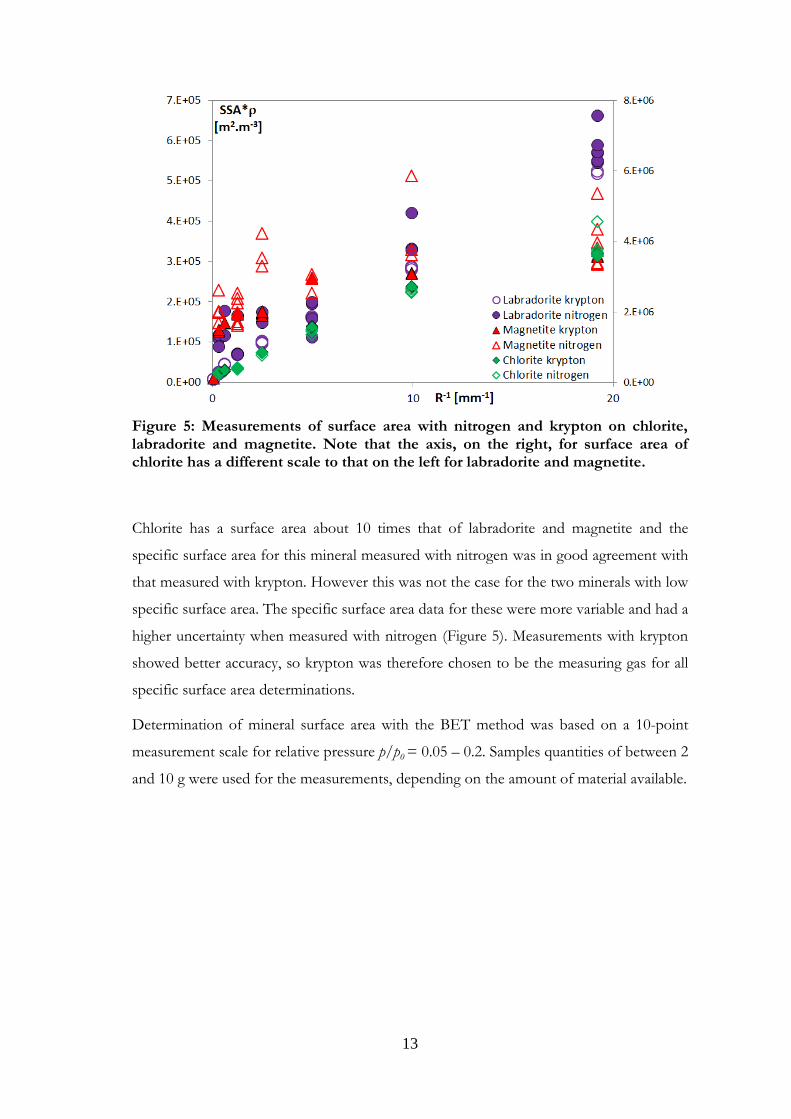
Figure 5: Measurements of surface area with nitrogen and krypton on chlorite, labradorite and magnetite. Note that the axis, on the right, for surface area of chlorite has a different scale to that on the left for labradorite and magnetite.
Chlorite has a surface area about 10 times that of labradorite and magnetite and the
specific surface area for this mineral measured with nitrogen was in good agreement with
that measured with krypton. However this was not the case for the two minerals with low
specific surface area. The specific surface area data for these were more variable and had a
higher uncertainty when measured with nitrogen (Figure 5). Measurements with krypton
showed better accuracy, so krypton was therefore chosen to be the measuring gas for all
specific surface area determinations.
Determination of mineral surface area with the BET method was based on a 10-point
measurement scale for relative pressure p/p0 = 0.05 – 0.2. Samples quantities of between 2
and 10 g were used for the measurements, depending on the amount of material available.

14
15
3. Minerals
3.1. Specimens
The specimens used in this study are natural minerals commonly found in granite. The
Äspö Hard Rock laboratory, on the Swedish east coast, is a demonstration and research
facility for a final repository for radioactive waste. The rock material from the Äspö site
was used as a reference for the mineralogical composition of granite. Many studies have
been conducted at the site and the mineralogy has been well documented, so using Äspö
material as the reference material for granite may also allow comparisons with previous
work.
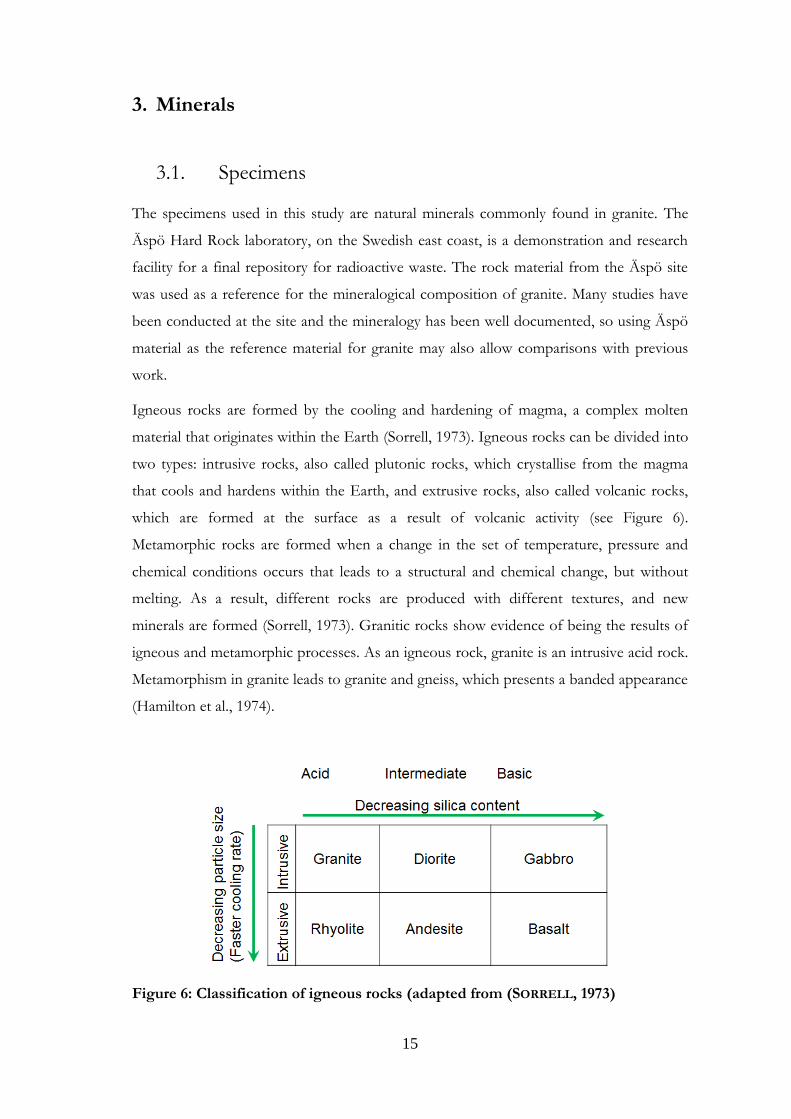
Igneous rocks are formed by the cooling and hardening of magma, a complex molten
material that originates within the Earth (Sorrell, 1973). Igneous rocks can be divided into
two types: intrusive rocks, also called plutonic rocks, which crystallise from the magma
that cools and hardens within the Earth, and extrusive rocks, also called volcanic rocks,
which are formed at the surface as a result of volcanic activity (see Figure 6).
Metamorphic rocks are formed when a change in the set of temperature, pressure and
chemical conditions occurs that leads to a structural and chemical change, but without
melting. As a result, different rocks are produced with different textures, and new
minerals are formed (Sorrell, 1973). Granitic rocks show evidence of being the results of
igneous and metamorphic processes. As an igneous rock, granite is an intrusive acid rock.
Metamorphism in granite leads to granite and gneiss, which presents a banded appearance
(Hamilton et al., 1974).
Figure 6: Classification of igneous rocks (adapted from (SORRELL, 1973)
16
The texture of granitic rocks can range from large (coarse) grained to fine-grained, but
they usually have quite a homogeneous grain size, i.e. the grains of millimetre size are
visible with the unaided eye. The main components are quartz, feldspars and plagioclase,
but many different minerals can be present in smaller amounts. Biotite and/or muscovite
are usually present, and hornblende may occur. Apatite, magnetite, sphene (titanite) and
zircon are commonly found (Hamilton et al., 1974).
Diorite is an intermediate intrusive igneous rock (see Figure 6) with typically lower
content in silica (55-65% silica), quartz and K-feldspar than granite. Granodiorite is
intermediate rock between granite and diorite (Nesse, 2000). The Äspö diorite consists of
30.6% quartz, 3.0% plagioclase with an additional 27.6% as aged plagioclase, 28.6% K-
feldspar, 5.8% biotite, 1.8% chlorite, 1.0% titanite, 0.6% epidote and 1.0% opaque,
consisting mostly of magnetite.
The seven minerals, belonging to different mineral families, were used in this work are
briefly described in the following.
The feldspars 3.1.1.
The feldspars are tectosilicates, which means that they are formed of a 3-D network of
tetrahedrons, and are also called framework silicates. They represent about 60% of the
Earth’s crust and amongst these silicates, quartz and feldspars are the most abundant
(Nesse, 2000). The minerals in this group are not stable at high pressure and are therefore
mostly encountered in the Earth’s shallow crust.
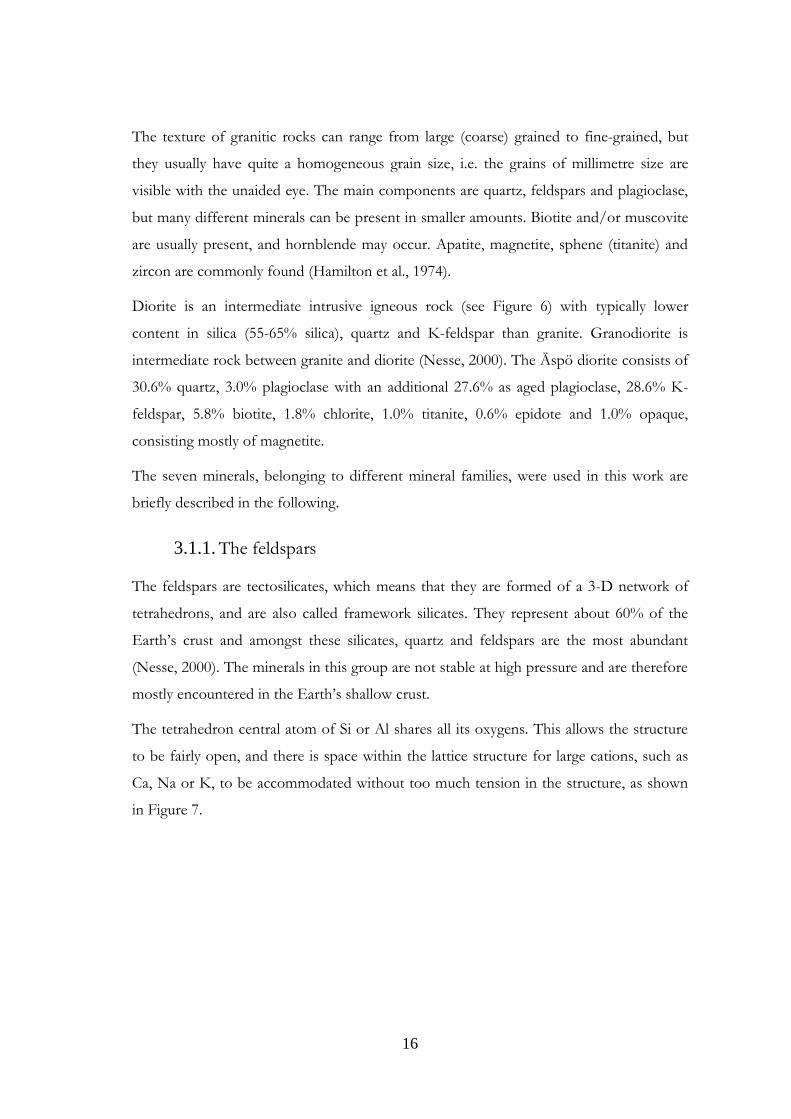
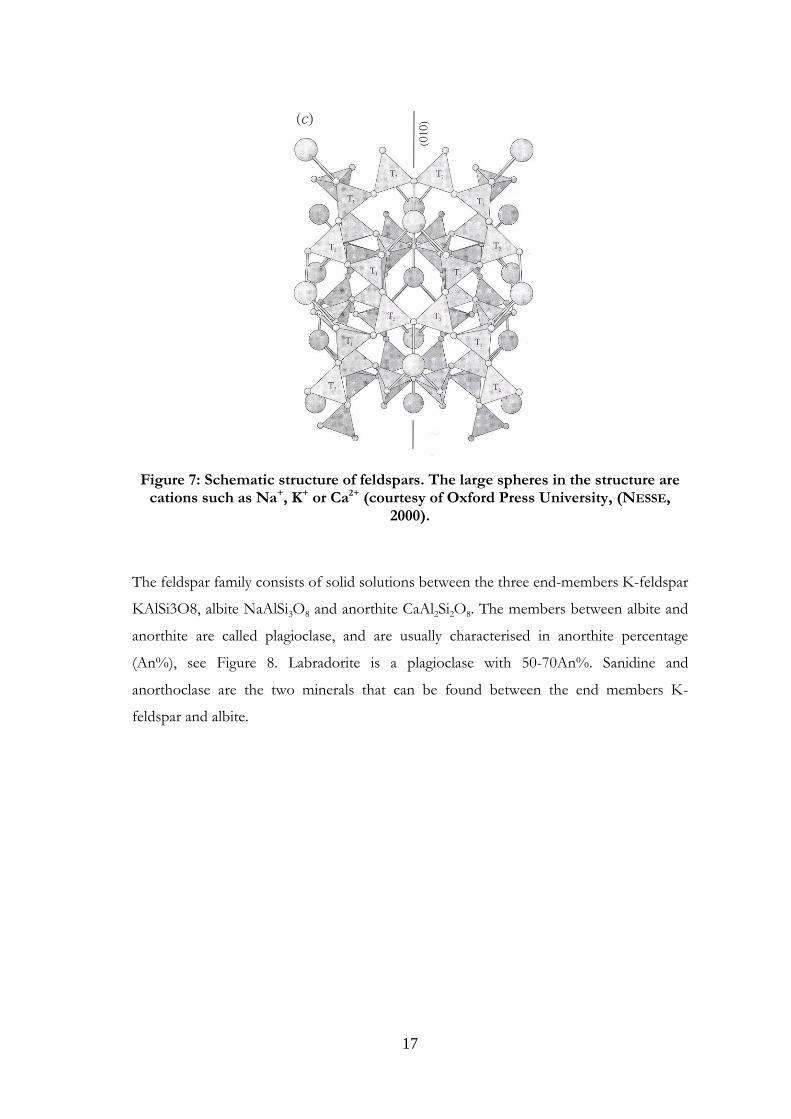
The tetrahedron central atom of Si or Al shares all its oxygens. This allows the structure
to be fairly open, and there is space within the lattice structure for large cations, such as
Ca, Na or K, to be accommodated without too much tension in the structure, as shown
in Figure 7.
17
Figure 7: Schematic structure of feldspars. The large spheres in the structure are cations such as Na+, K+ or Ca2+ (courtesy of Oxford Press University, (NESSE,
2000).
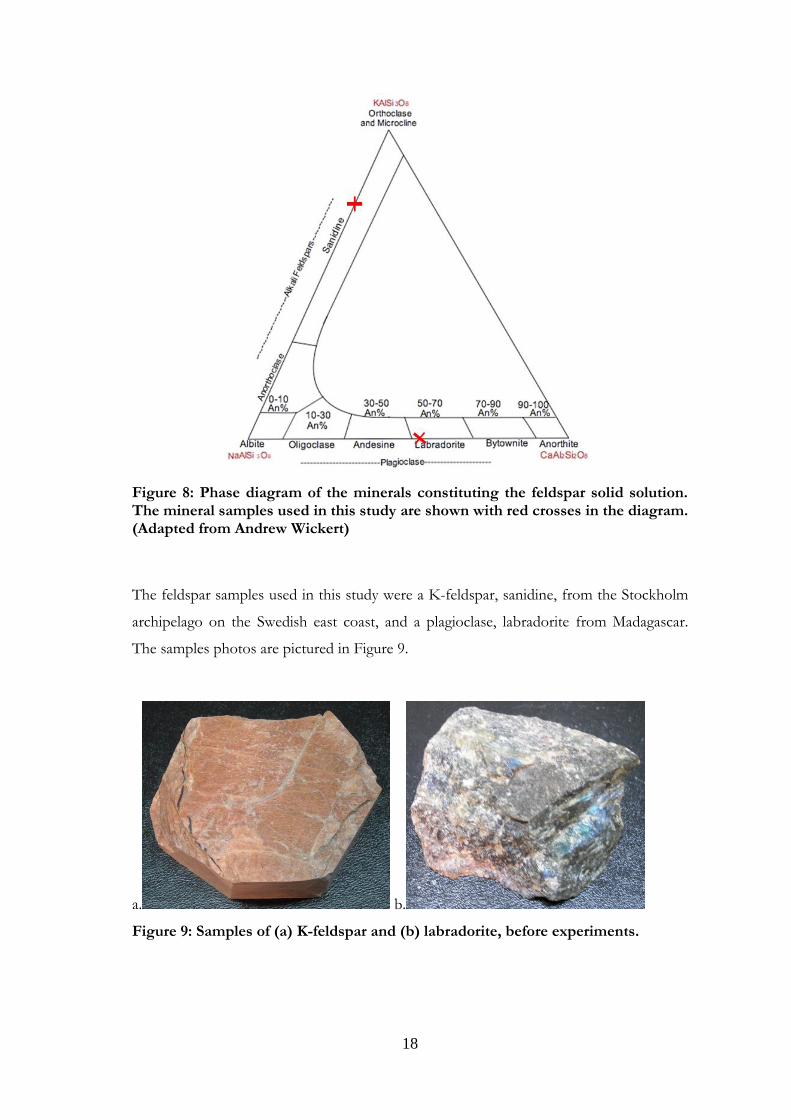
The feldspar family consists of solid solutions between the three end-members K-feldspar
KAlSi3O8, albite NaAlSi3O8 and anorthite CaAl2Si2O8. The members between albite and
anorthite are called plagioclase, and are usually characterised in anorthite percentage
(An%), see Figure 8. Labradorite is a plagioclase with 50-70An%. Sanidine and
anorthoclase are the two minerals that can be found between the end members K-
feldspar and albite.
18
Figure 8: Phase diagram of the minerals constituting the feldspar solid solution. The mineral samples used in this study are shown with red crosses in the diagram. (Adapted from Andrew Wickert)
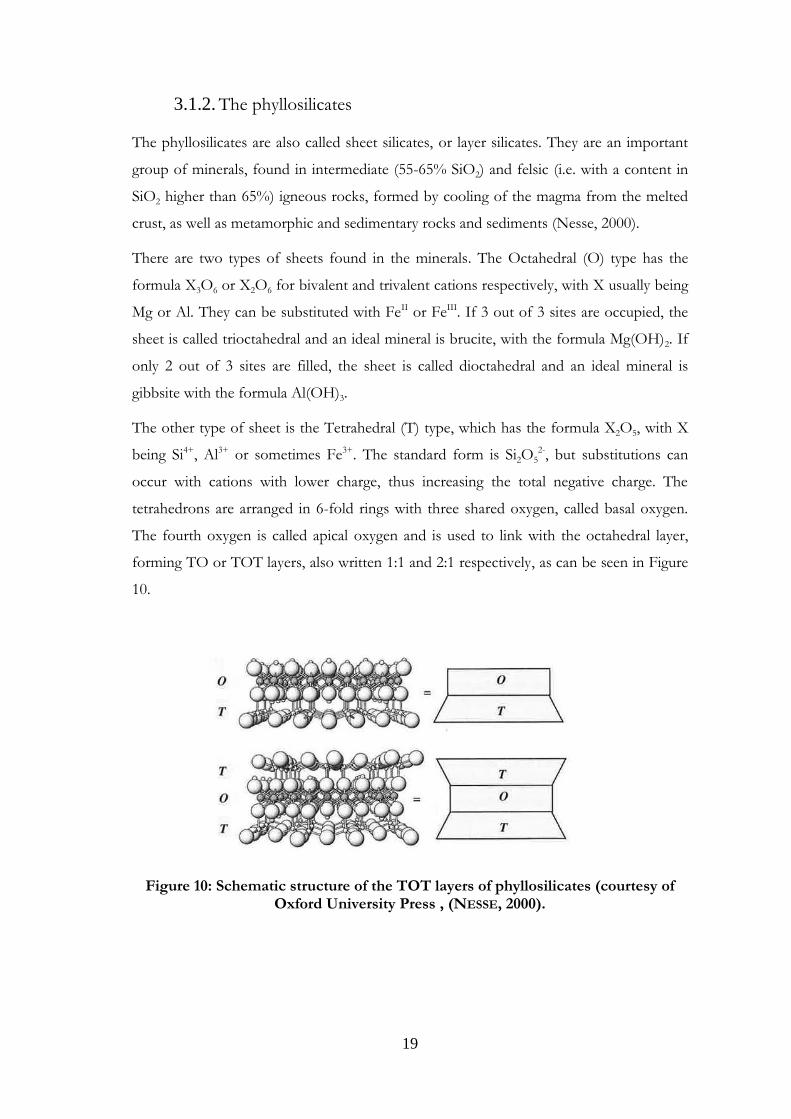
The feldspar samples used in this study were a K-feldspar, sanidine, from the Stockholm
archipelago on the Swedish east coast, and a plagioclase, labradorite from Madagascar.
The samples photos are pictured in Figure 9.
a. b.
Figure 9: Samples of (a) K-feldspar and (b) labradorite, before experiments.
19
The phyllosilicates 3.1.2.
The phyllosilicates are also called sheet silicates, or layer silicates. They are an important
group of minerals, found in intermediate (55-65% SiO2) and felsic (i.e. with a content in
SiO2 higher than 65%) igneous rocks, formed by cooling of the magma from the melted
crust, as well as metamorphic and sedimentary rocks and sediments (Nesse, 2000).
There are two types of sheets found in the minerals. The Octahedral (O) type has the
formula X3O6 or X2O6 for bivalent and trivalent cations respectively, with X usually being
Mg or Al. They can be substituted with FeII or FeIII. If 3 out of 3 sites are occupied, the
sheet is called trioctahedral and an ideal mineral is brucite, with the formula Mg(OH)2. If
only 2 out of 3 sites are filled, the sheet is called dioctahedral and an ideal mineral is
gibbsite with the formula Al(OH)3.
The other type of sheet is the Tetrahedral (T) type, which has the formula X2O5, with X
being Si4+, Al3+ or sometimes Fe3+. The standard form is Si2O52-, but substitutions can
occur with cations with lower charge, thus increasing the total negative charge. The
tetrahedrons are arranged in 6-fold rings with three shared oxygen, called basal oxygen.
The fourth oxygen is called apical oxygen and is used to link with the octahedral layer,
forming TO or TOT layers, also written 1:1 and 2:1 respectively, as can be seen in Figure
10.
Figure 10: Schematic structure of the TOT layers of phyllosilicates (courtesy of Oxford University Press , (NESSE, 2000).
20
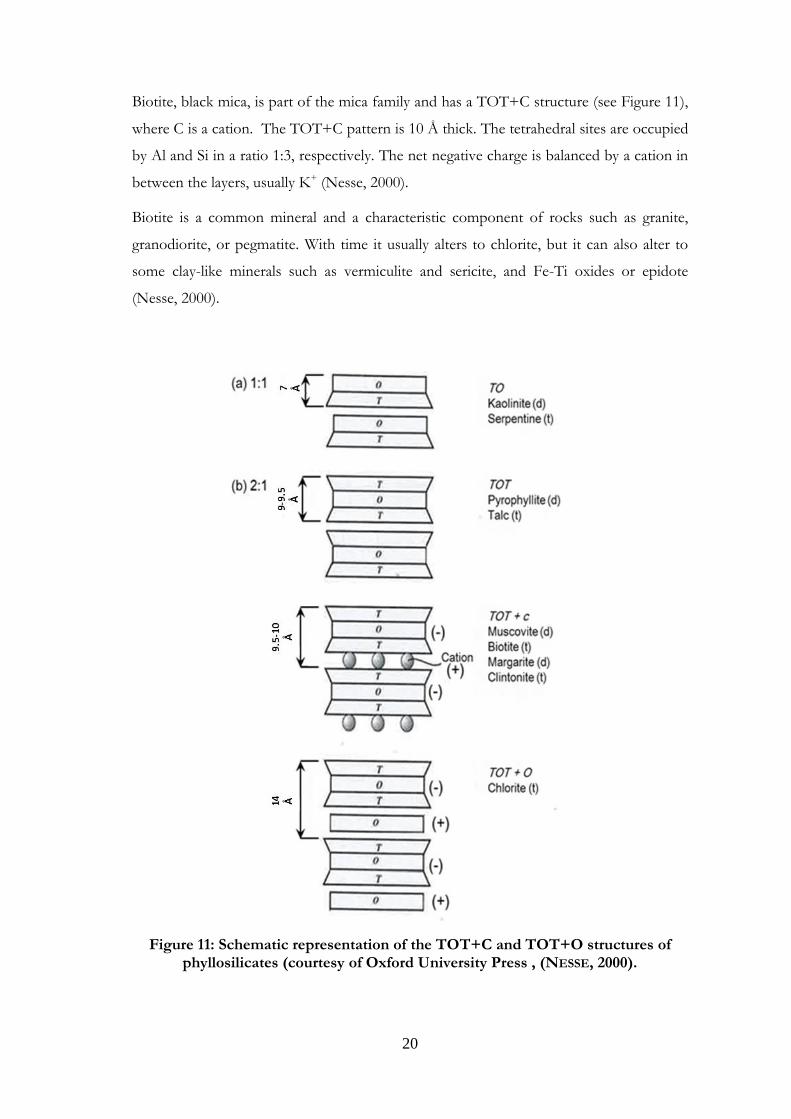
Biotite, black mica, is part of the mica family and has a TOT+C structure (see Figure 11),
where C is a cation. The TOT+C pattern is 10 Å thick. The tetrahedral sites are occupied
by Al and Si in a ratio 1:3, respectively. The net negative charge is balanced by a cation in
between the layers, usually K+ (Nesse, 2000).
Biotite is a common mineral and a characteristic component of rocks such as granite,
granodiorite, or pegmatite. With time it usually alters to chlorite, but it can also alter to
some clay-like minerals such as vermiculite and sericite, and Fe-Ti oxides or epidote
(Nesse, 2000).
Figure 11: Schematic representation of the TOT+C and TOT+O structures of phyllosilicates (courtesy of Oxford University Press , (NESSE, 2000).
21
Chlorite refers to an under-group of minerals with the characteristic TOT+O structure
(see Figure 11) where an octahedral sheet, also referred to as the brucite layer, is placed in
between the TOT layers. The TOT+O pattern is about 14Å thick, 9.5 Å for the TOT
layer and 4.5Å for the brucite-like layer. The net negative charge of the TOT is balanced
by the net positive charge of the brucite. The bonding is then stronger than if it only were
Van der Waals forces were present (Nesse, 2000).
The brucite layer is usually trioctahedral, occupied by Mg, Fe or Al. Si and Al are found at
tetrahedral sites and Mg, Fe and Al at octahedral sites. The chlorites form continuous
solid solutions between the Mg-rich member, clinochlore, and the Fe-rich member,
chamosite (Nesse, 2000).
Chlorite is abundant in igneous rocks, as an alteration product usually derived from
Mg/Fe bearing minerals, such as biotite and hornblende. It may weather to clay minerals,
but is otherwise fairly resistant (Nesse, 2000).
a
b
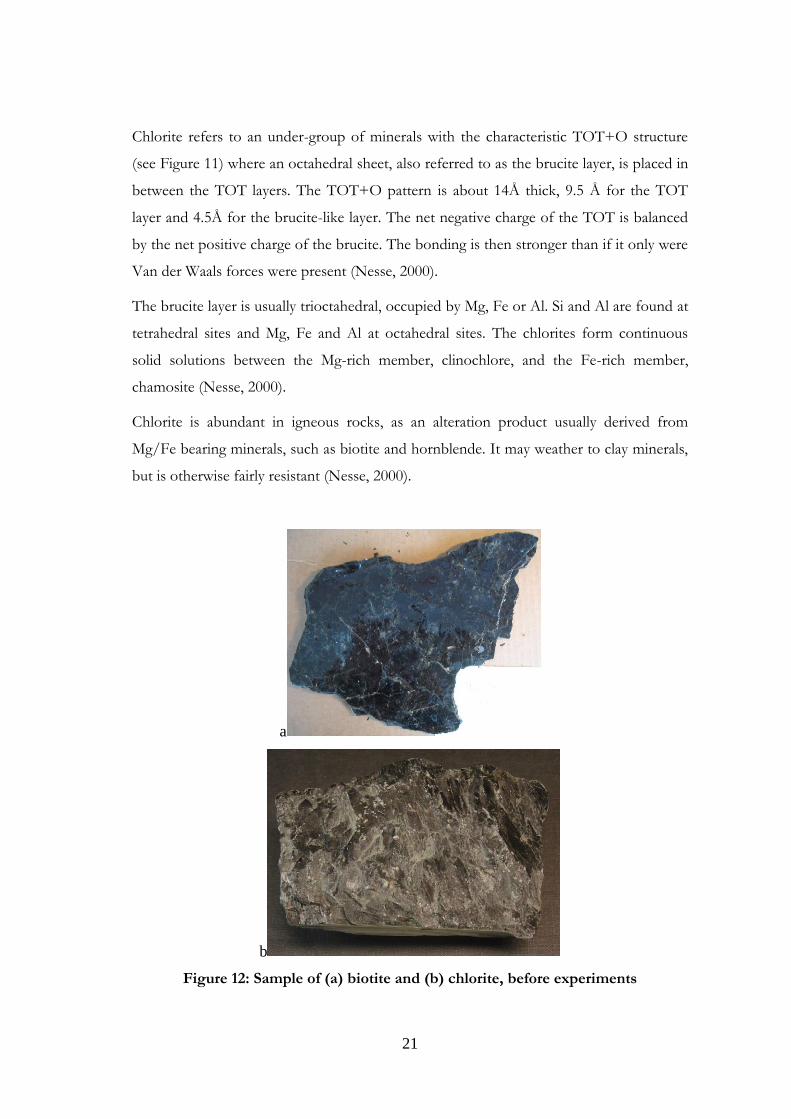
Figure 12: Sample of (a) biotite and (b) chlorite, before experiments
22
The samples used in this study were a biotite from Norway and a chlorite from Falun in
central Sweden. Figure 12a shows the appearance of the biotite sample and Figure 12b
the chlorite sample.
The inosilicates 3.1.3.
The inosilicates are silicates with a chain structure. Inosilicates with a simple chain are
called pyroxenes and those with a double chain are called amphiboles. Amphiboles
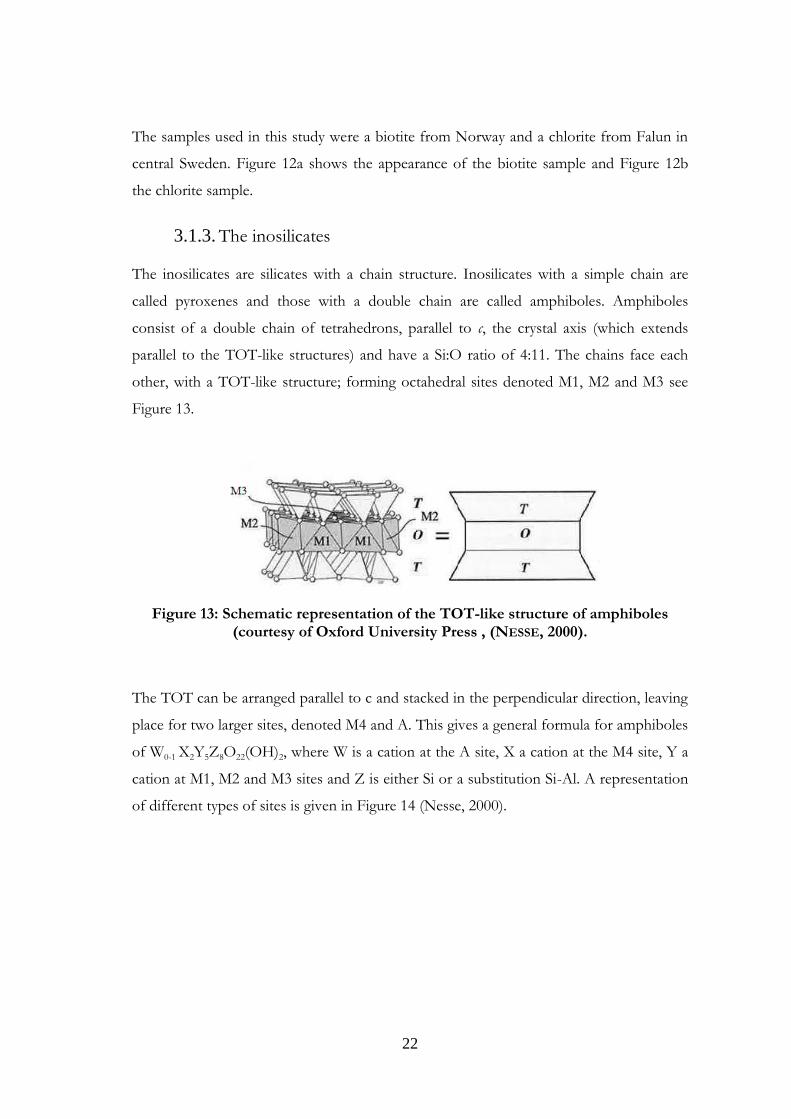
consist of a double chain of tetrahedrons, parallel to c, the crystal axis (which extends
parallel to the TOT-like structures) and have a Si:O ratio of 4:11. The chains face each
other, with a TOT-like structure; forming octahedral sites denoted M1, M2 and M3 see
Figure 13.
Figure 13: Schematic representation of the TOT-like structure of amphiboles (courtesy of Oxford University Press , (NESSE, 2000).
The TOT can be arranged parallel to c and stacked in the perpendicular direction, leaving
place for two larger sites, denoted M4 and A. This gives a general formula for amphiboles
of W0-1 X2Y5Z8O22(OH)2, where W is a cation at the A site, X a cation at the M4 site, Y a
cation at M1, M2 and M3 sites and Z is either Si or a substitution Si-Al. A representation
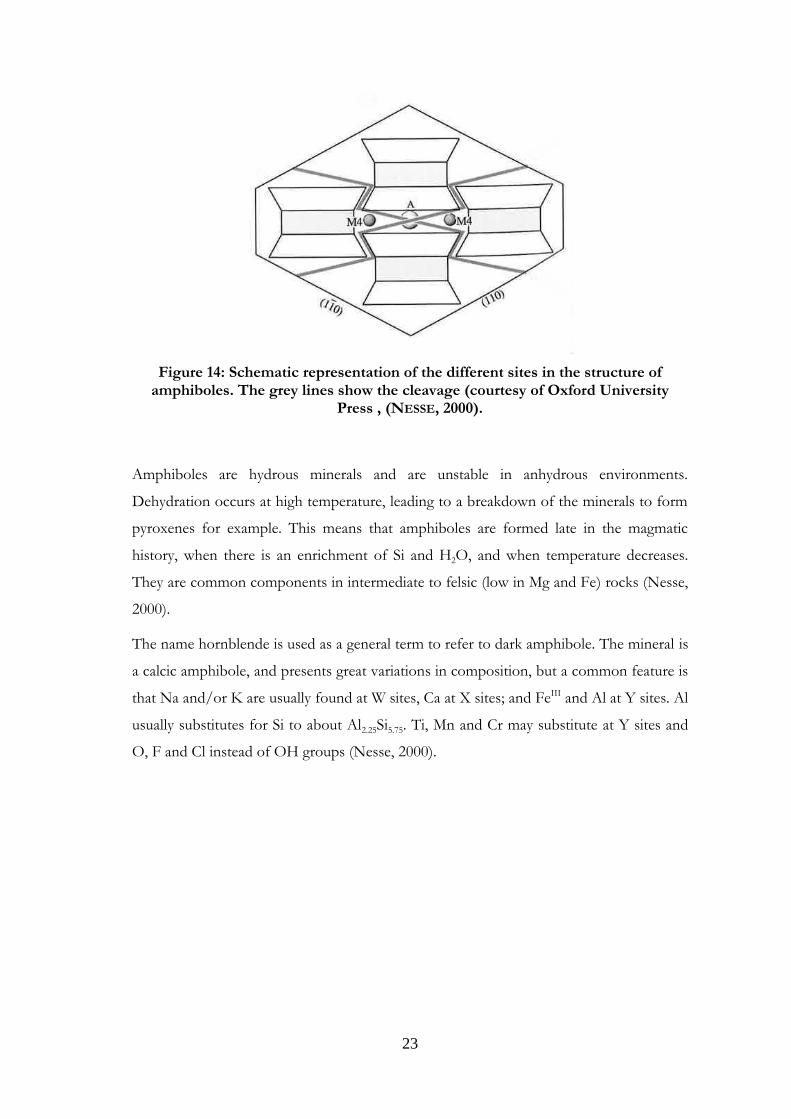
of different types of sites is given in Figure 14 (Nesse, 2000).
23
Figure 14: Schematic representation of the different sites in the structure of amphiboles. The grey lines show the cleavage (courtesy of Oxford University
Press , (NESSE, 2000).
Amphiboles are hydrous minerals and are unstable in anhydrous environments.
Dehydration occurs at high temperature, leading to a breakdown of the minerals to form
pyroxenes for example. This means that amphiboles are formed late in the magmatic
history, when there is an enrichment of Si and H2O, and when temperature decreases.
They are common components in intermediate to felsic (low in Mg and Fe) rocks (Nesse,
2000).
The name hornblende is used as a general term to refer to dark amphibole. The mineral is
a calcic amphibole, and presents great variations in composition, but a common feature is
that Na and/or K are usually found at W sites, Ca at X sites; and FeIII and Al at Y sites. Al
usually substitutes for Si to about Al2.25Si5.75. Ti, Mn and Cr may substitute at Y sites and
O, F and Cl instead of OH groups (Nesse, 2000).
24
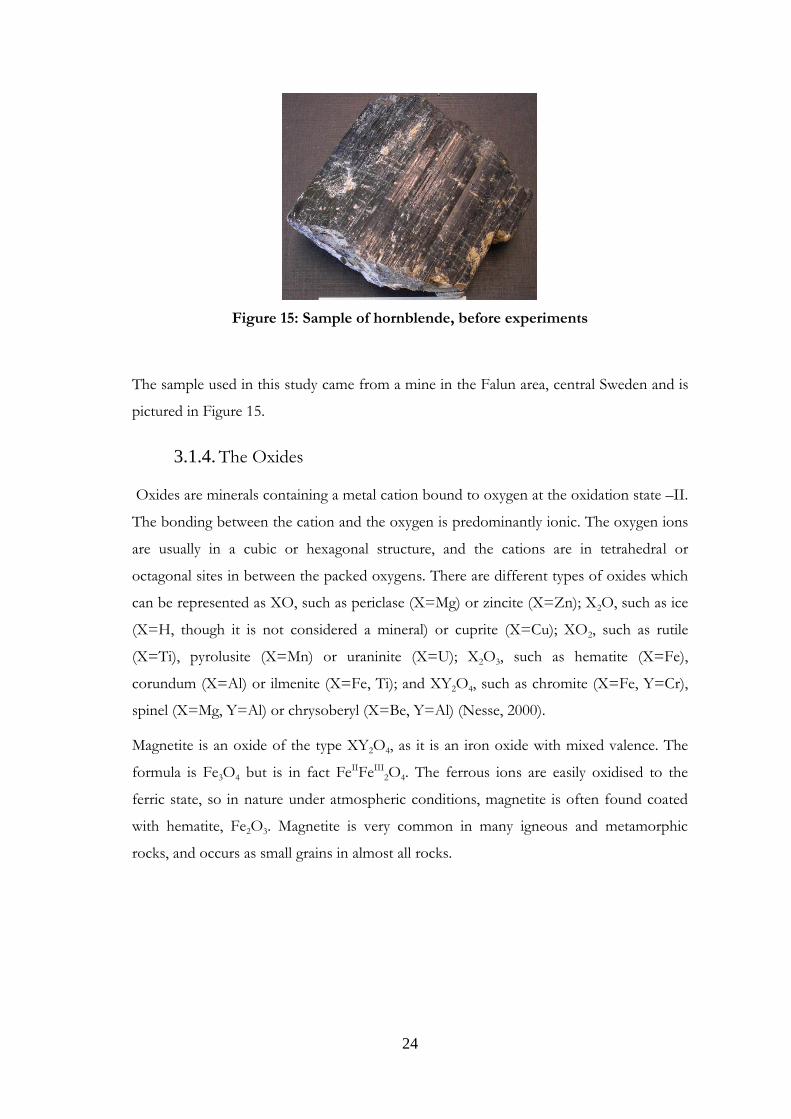
Figure 15: Sample of hornblende, before experiments
The sample used in this study came from a mine in the Falun area, central Sweden and is
pictured in Figure 15.
The Oxides 3.1.4.
Oxides are minerals containing a metal cation bound to oxygen at the oxidation state –II.
The bonding between the cation and the oxygen is predominantly ionic. The oxygen ions
are usually in a cubic or hexagonal structure, and the cations are in tetrahedral or
octagonal sites in between the packed oxygens. There are different types of oxides which
can be represented as XO, such as periclase (X=Mg) or zincite (X=Zn); X2O, such as ice
(X=H, though it is not considered a mineral) or cuprite (X=Cu); XO2, such as rutile
(X=Ti), pyrolusite (X=Mn) or uraninite (X=U); X2O3, such as hematite (X=Fe),
corundum (X=Al) or ilmenite (X=Fe, Ti); and XY2O4, such as chromite (X=Fe, Y=Cr),
spinel (X=Mg, Y=Al) or chrysoberyl (X=Be, Y=Al) (Nesse, 2000).
Magnetite is an oxide of the type XY2O4, as it is an iron oxide with mixed valence. The
formula is Fe3O4 but is in fact FeIIFeIII2O4. The ferrous ions are easily oxidised to the
ferric state, so in nature under atmospheric conditions, magnetite is often found coated
with hematite, Fe2O3. Magnetite is very common in many igneous and metamorphic
rocks, and occurs as small grains in almost all rocks.
25
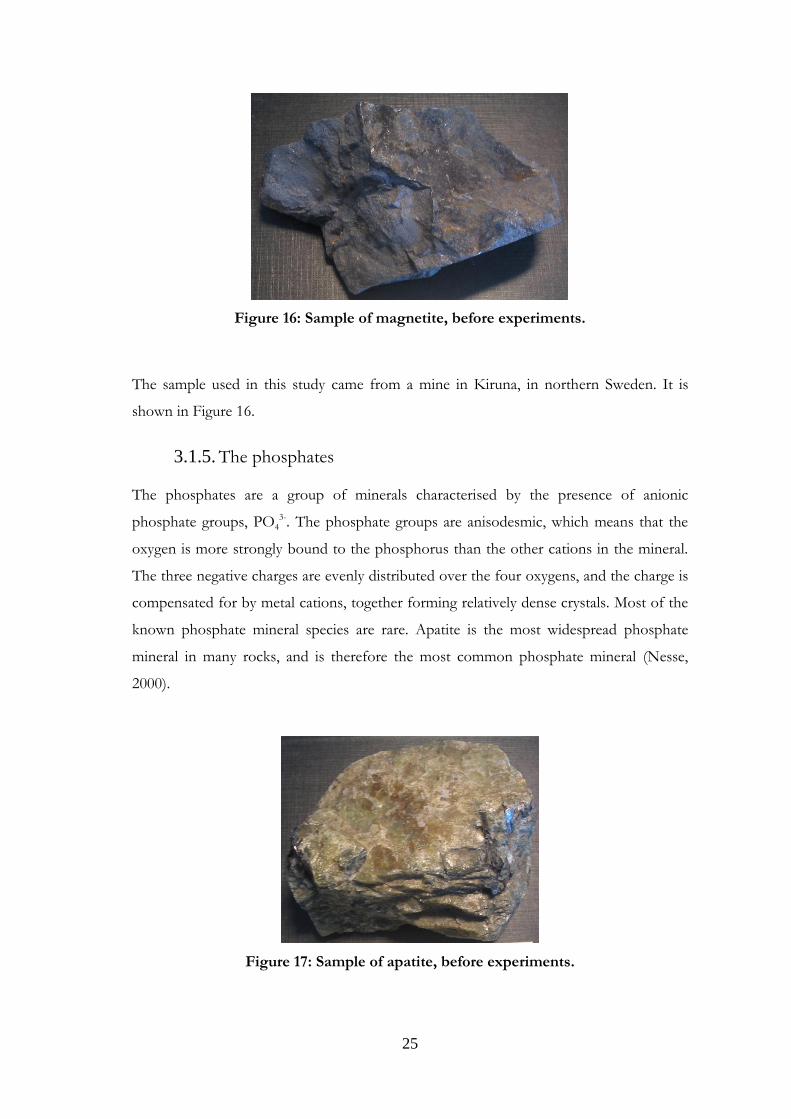
Figure 16: Sample of magnetite, before experiments.
The sample used in this study came from a mine in Kiruna, in northern Sweden. It is
shown in Figure 16.
The phosphates 3.1.5.
The phosphates are a group of minerals characterised by the presence of anionic
phosphate groups, PO43-. The phosphate groups are anisodesmic, which means that the
oxygen is more strongly bound to the phosphorus than the other cations in the mineral.
The three negative charges are evenly distributed over the four oxygens, and the charge is
compensated for by metal cations, together forming relatively dense crystals. Most of the
known phosphate mineral species are rare. Apatite is the most widespread phosphate
mineral in many rocks, and is therefore the most common phosphate mineral (Nesse,
2000).
Figure 17: Sample of apatite, before experiments.
26
Apatite can be found as three different forms, chloro-apatite, fluoro-apatite and hydroxyl-
apatite, with the two last-named the most common. The general formula is
Ca5(PO4)3(OH, F, Cl). The sample used in this study came from Risør, southern Norway,
and is shown in Figure 17.
3.2. Sample preparation
All mineral samples were handled the same way prior to measurements (Papers I and II).
After visual inspections with the help of a geologist, some impurities were removed.
Large chunks of minerals were then sawn up so that some large parallelepipeds could be
used later as a way to relate to the intact material. The parallelepipeds had basic
dimensions of 3x3cm and were as long as was possible from the particular specimen
(usually between 3 and 7 cm). For layer silicates, the large pieces were sawn so that the
length of the parallelepiped was in the direction of the layers. For hornblende, the length
of the parallelepiped followed the c axis, i.e. the axis of growth of the double chain.
The remaining mineral material was crushed, first roughly with a hammer in a plastic bag,
and then more finely in an agate mortar. The crushed material was then sieved (Retsch
stainless steel sieves, 200 mm Ø*250 and/or 500 mm) on a shaking machine, vigorously
for 20-30 minutes, and at lower speed for about one hour. It was not possible to crush
biotite properly in a mortar and collect enough material in each fraction studied, so the
‘crushing’ was done using a food-processor. The pieces were cut into small flakes without
destroying the structure of the mineral. Seven fractions were collected: 0.075-0.125;
0.125-0.250; 0.250-0.500; 0.500-1; 1-2; 2-4 and 4-8 mm, and these were washed with 95%
ethanol to remove ultrafine particles, as indicated by the clarity of the ethanol. The
different fractions were then dried and stored in a desiccator.
3.3. Characterisation
Chemical composition 3.3.1.
In order to confirm the nature of the minerals collected and to identify any impurities or
other phases, some characterisations were made. The chemical composition of the
minerals was determined by ALS Scandinavia, Luleå, Sweden. The samples were first
dissolved in HNO3 or in HF, HClO3 and HNO3 for sulphur detection) and then analysed
with Inductively Coupled Plasma – Optical Emission Spectroscopy, – Atomic Emission
27
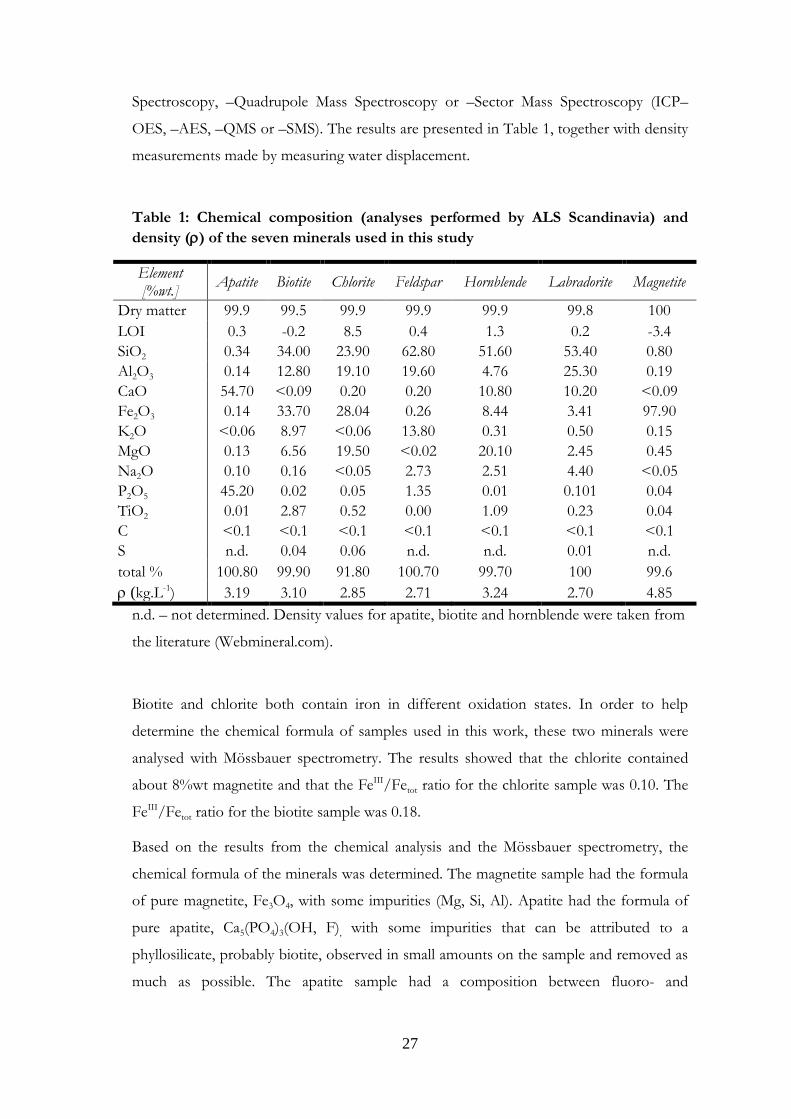
Spectroscopy, –Quadrupole Mass Spectroscopy or –Sector Mass Spectroscopy (ICP–
OES, –AES, –QMS or –SMS). The results are presented in Table 1, together with density
measurements made by measuring water displacement.
Table 1: Chemical composition (analyses performed by ALS Scandinavia) and
density () of the seven minerals used in this study
Element [%wt.]
Apatite Biotite Chlorite Feldspar Hornblende Labradorite Magnetite
Dry matter 99.9 99.5 99.9 99.9 99.9 99.8 100
LOI 0.3 -0.2 8.5 0.4 1.3 0.2 -3.4
SiO2 0.34 34.00 23.90 62.80 51.60 53.40 0.80
Al2O3 0.14 12.80 19.10 19.60 4.76 25.30 0.19
CaO 54.70 <0.09 0.20 0.20 10.80 10.20 <0.09
Fe2O3 0.14 33.70 28.04 0.26 8.44 3.41 97.90
K2O <0.06 8.97 <0.06 13.80 0.31 0.50 0.15
MgO 0.13 6.56 19.50 <0.02 20.10 2.45 0.45
Na2O 0.10 0.16 <0.05 2.73 2.51 4.40 <0.05
P2O5 45.20 0.02 0.05 1.35 0.01 0.101 0.04
TiO2 0.01 2.87 0.52 0.00 1.09 0.23 0.04
C <0.1 <0.1 <0.1 <0.1 <0.1 <0.1 <0.1
S n.d. 0.04 0.06 n.d. n.d. 0.01 n.d.
total % 100.80 99.90 91.80 100.70 99.70 100 99.6
(kg.L-1) 3.19 3.10 2.85 2.71 3.24 2.70 4.85
n.d. – not determined. Density values for apatite, biotite and hornblende were taken from
the literature (Webmineral.com).
Biotite and chlorite both contain iron in different oxidation states. In order to help
determine the chemical formula of samples used in this work, these two minerals were
analysed with Mössbauer spectrometry. The results showed that the chlorite contained
about 8%wt magnetite and that the FeIII/Fetot ratio for the chlorite sample was 0.10. The
FeIII/Fetot ratio for the biotite sample was 0.18.
Based on the results from the chemical analysis and the Mössbauer spectrometry, the
chemical formula of the minerals was determined. The magnetite sample had the formula
of pure magnetite, Fe3O4, with some impurities (Mg, Si, Al). Apatite had the formula of
pure apatite, Ca5(PO4)3(OH, F), with some impurities that can be attributed to a
phyllosilicate, probably biotite, observed in small amounts on the sample and removed as
much as possible. The apatite sample had a composition between fluoro- and
28
hydroxoapatite, but further analyses would be needed to precisely determine the F/OH
ratio.
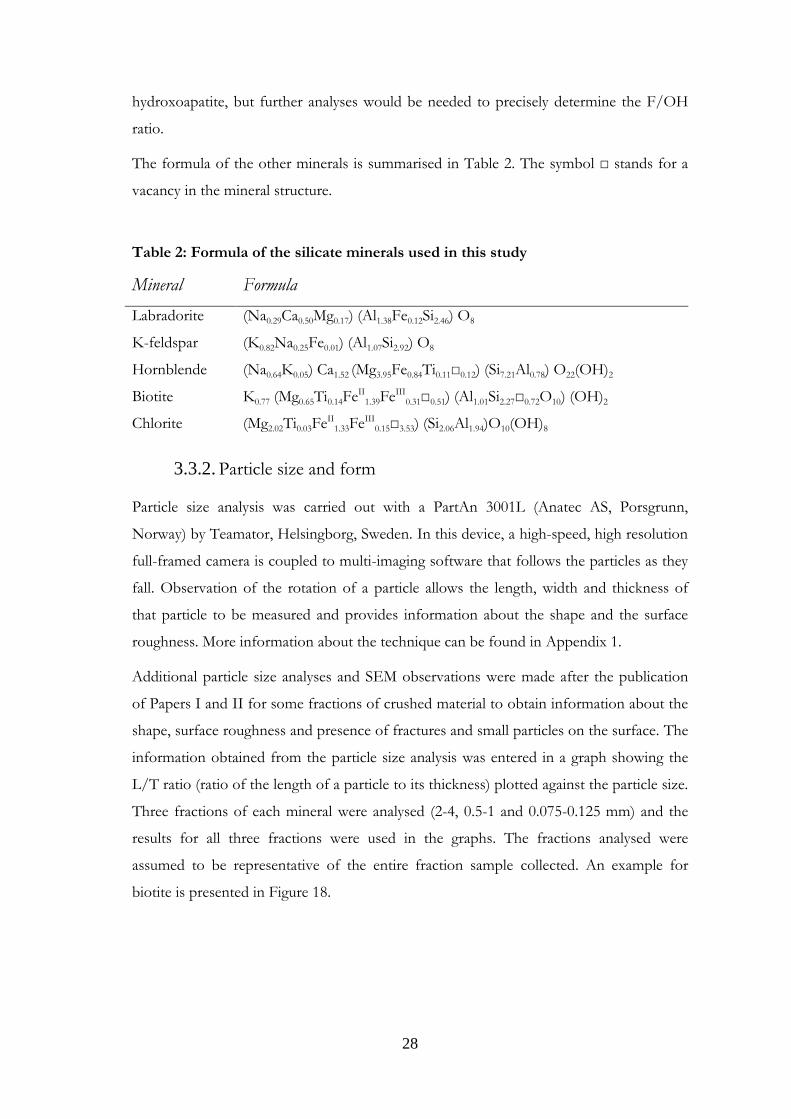
The formula of the other minerals is summarised in Table 2. The symbol □ stands for a
vacancy in the mineral structure.
Table 2: Formula of the silicate minerals used in this study
Mineral Formula
Labradorite (Na0.29Ca0.50Mg0.17) (Al1.38Fe0.12Si2.46) O8
K-feldspar (K0.82Na0.25Fe0.01) (Al1.07Si2.92) O8
Hornblende (Na0.64K0.05) Ca1.52 (Mg3.95Fe0.84Ti0.11□0.12) (Si7.21Al0.78) O22(OH)2
Biotite K0.77 (Mg0.65Ti0.14FeII1.39FeIII
0.31□0.51) (Al1.01Si2.27□0.72O10) (OH)2
Chlorite (Mg2.02Ti0.03FeII1.33FeIII
0.15□3.53) (Si2.06Al1.94)O10(OH)8
Particle size and form 3.3.2.
Particle size analysis was carried out with a PartAn 3001L (Anatec AS, Porsgrunn,
Norway) by Teamator, Helsingborg, Sweden. In this device, a high-speed, high resolution
full-framed camera is coupled to multi-imaging software that follows the particles as they
fall. Observation of the rotation of a particle allows the length, width and thickness of
that particle to be measured and provides information about the shape and the surface
roughness. More information about the technique can be found in Appendix 1.
Additional particle size analyses and SEM observations were made after the publication
of Papers I and II for some fractions of crushed material to obtain information about the
shape, surface roughness and presence of fractures and small particles on the surface. The
information obtained from the particle size analysis was entered in a graph showing the
L/T ratio (ratio of the length of a particle to its thickness) plotted against the particle size.
Three fractions of each mineral were analysed (2-4, 0.5-1 and 0.075-0.125 mm) and the
results for all three fractions were used in the graphs. The fractions analysed were
assumed to be representative of the entire fraction sample collected. An example for
biotite is presented in Figure 18.
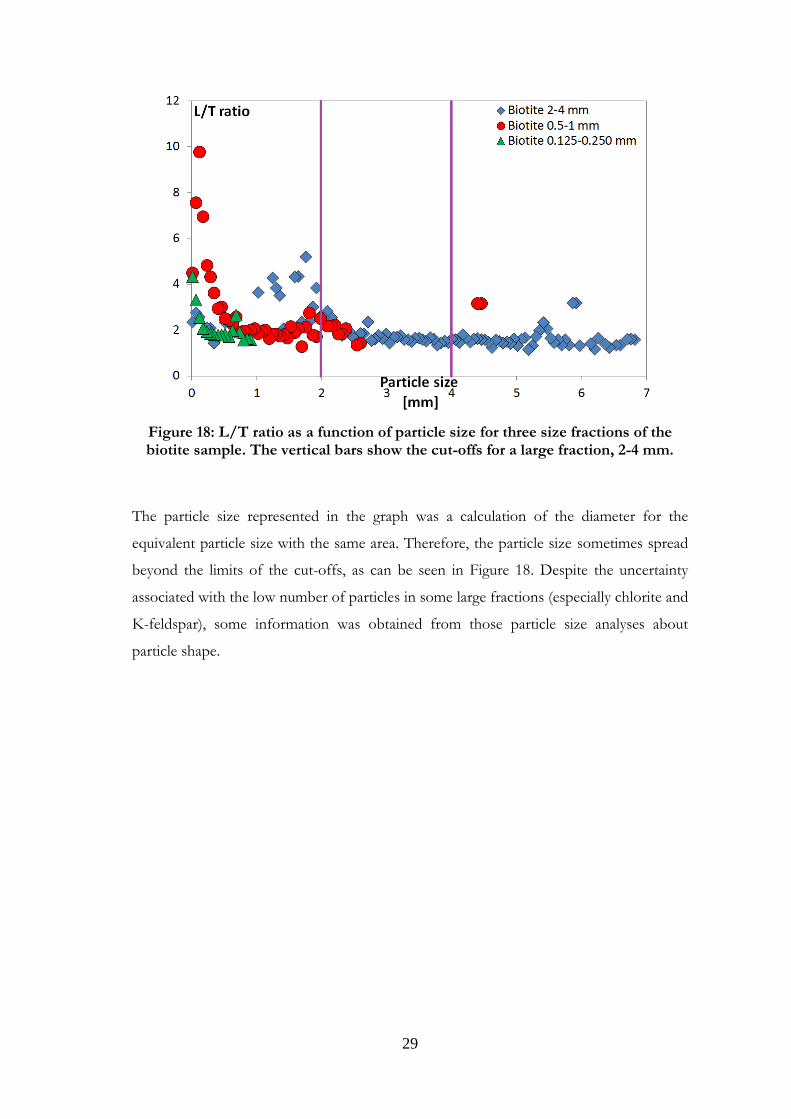
29
Figure 18: L/T ratio as a function of particle size for three size fractions of the biotite sample. The vertical bars show the cut-offs for a large fraction, 2-4 mm.
The particle size represented in the graph was a calculation of the diameter for the
equivalent particle size with the same area. Therefore, the particle size sometimes spread
beyond the limits of the cut-offs, as can be seen in Figure 18. Despite the uncertainty
associated with the low number of particles in some large fractions (especially chlorite and
K-feldspar), some information was obtained from those particle size analyses about
particle shape.
30
a1. a2.
b1. b2.
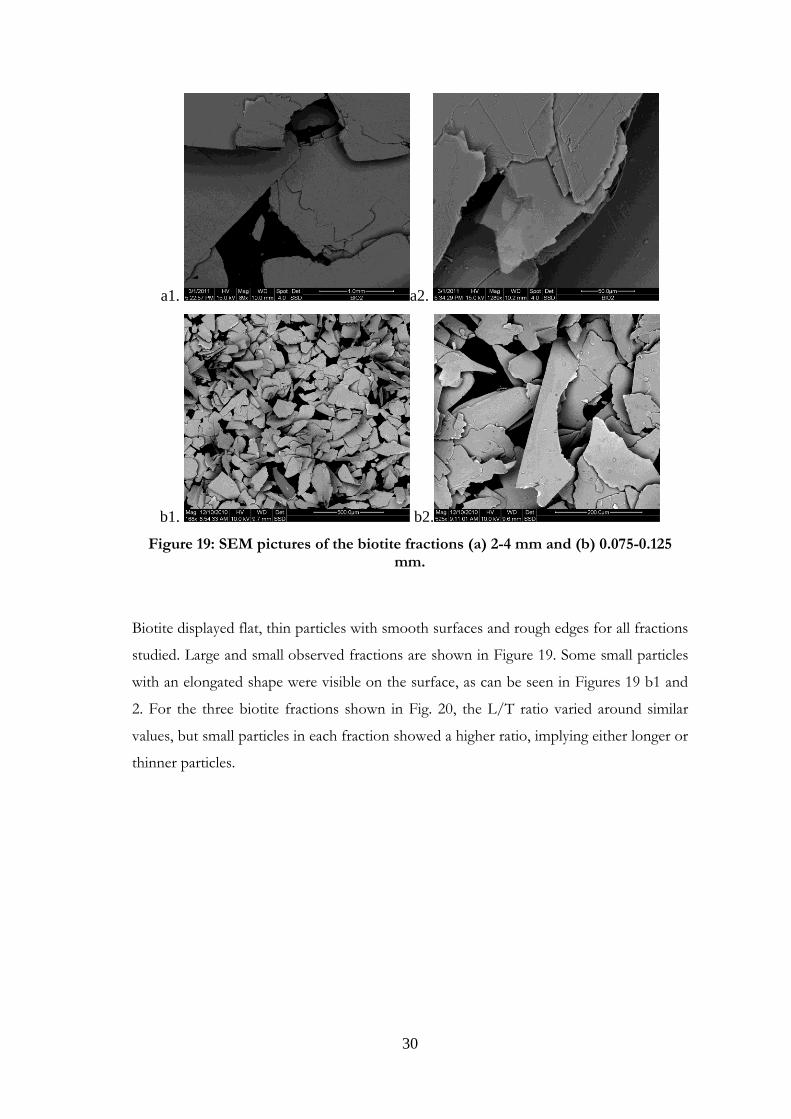
Figure 19: SEM pictures of the biotite fractions (a) 2-4 mm and (b) 0.075-0.125 mm.
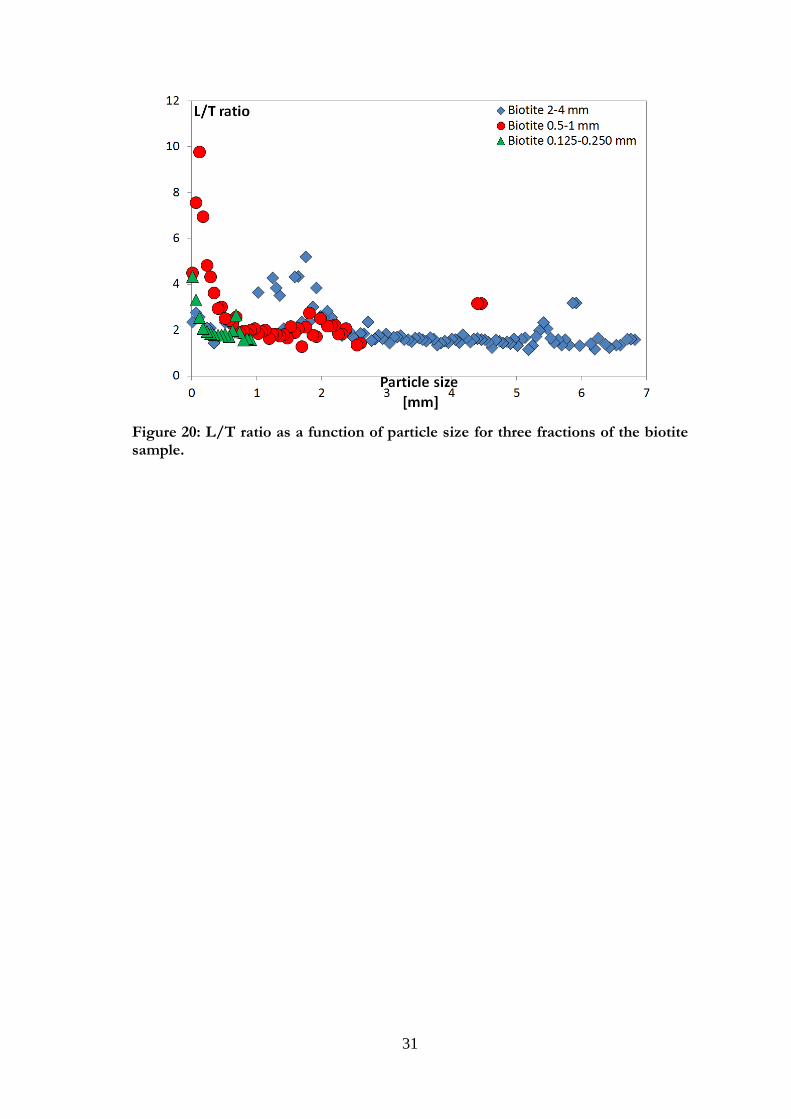
Biotite displayed flat, thin particles with smooth surfaces and rough edges for all fractions
studied. Large and small observed fractions are shown in Figure 19. Some small particles
with an elongated shape were visible on the surface, as can be seen in Figures 19 b1 and
2. For the three biotite fractions shown in Fig. 20, the L/T ratio varied around similar
values, but small particles in each fraction showed a higher ratio, implying either longer or
thinner particles.
31
Figure 20: L/T ratio as a function of particle size for three fractions of the biotite sample.
32
a1. a2.
b1. b2
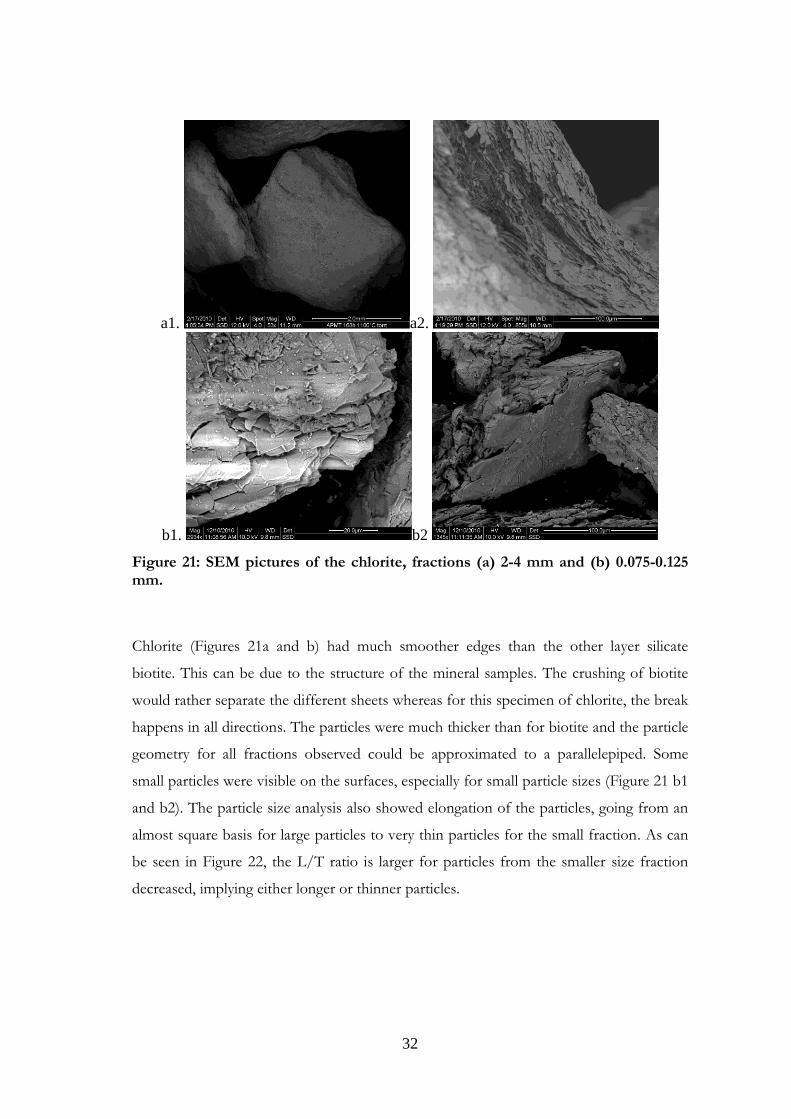
Figure 21: SEM pictures of the chlorite, fractions (a) 2-4 mm and (b) 0.075-0.125 mm.
Chlorite (Figures 21a and b) had much smoother edges than the other layer silicate
biotite. This can be due to the structure of the mineral samples. The crushing of biotite
would rather separate the different sheets whereas for this specimen of chlorite, the break
happens in all directions. The particles were much thicker than for biotite and the particle
geometry for all fractions observed could be approximated to a parallelepiped. Some
small particles were visible on the surfaces, especially for small particle sizes (Figure 21 b1
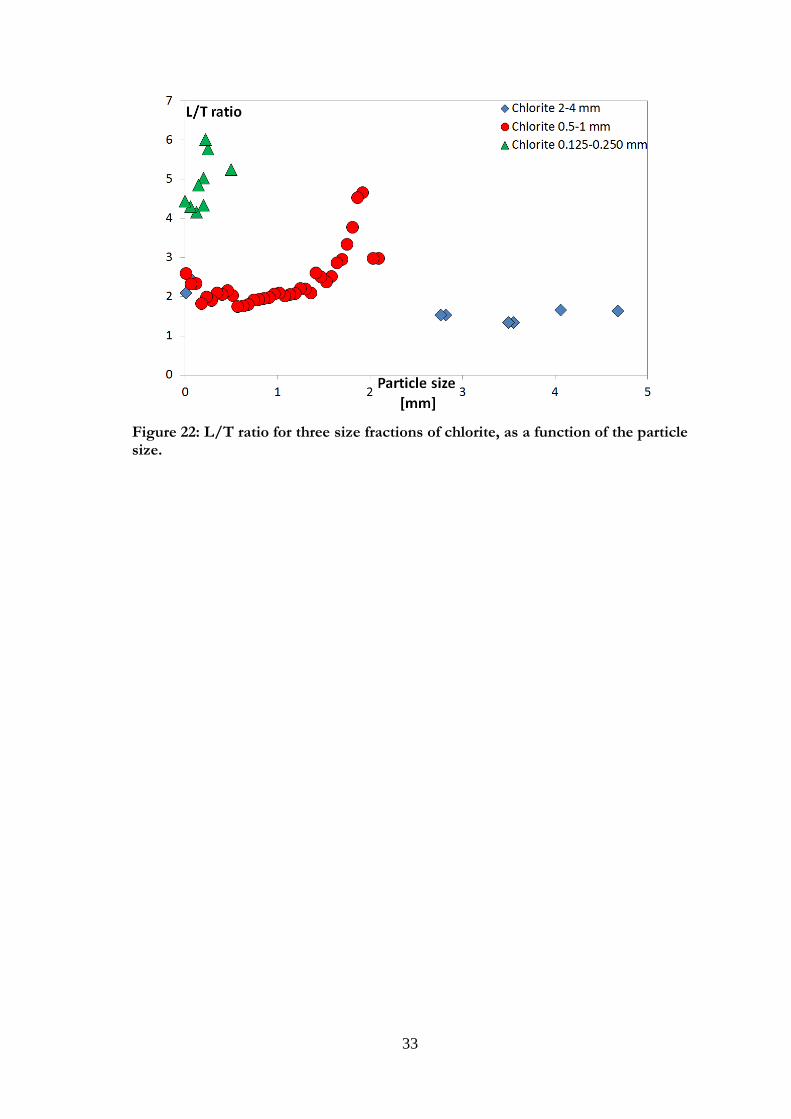
and b2). The particle size analysis also showed elongation of the particles, going from an
almost square basis for large particles to very thin particles for the small fraction. As can
be seen in Figure 22, the L/T ratio is larger for particles from the smaller size fraction
decreased, implying either longer or thinner particles.
33
Figure 22: L/T ratio for three size fractions of chlorite, as a function of the particle size.
34
a1. a2
b1. b2
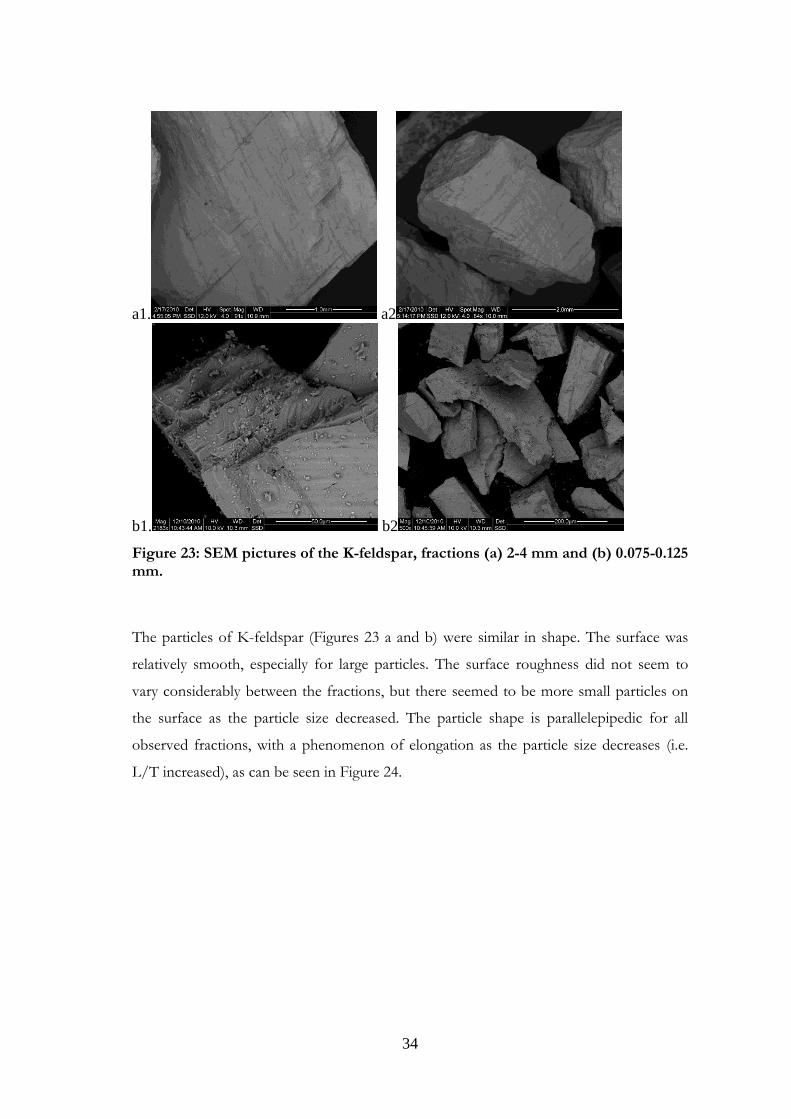
Figure 23: SEM pictures of the K-feldspar, fractions (a) 2-4 mm and (b) 0.075-0.125 mm.
The particles of K-feldspar (Figures 23 a and b) were similar in shape. The surface was
relatively smooth, especially for large particles. The surface roughness did not seem to
vary considerably between the fractions, but there seemed to be more small particles on
the surface as the particle size decreased. The particle shape is parallelepipedic for all
observed fractions, with a phenomenon of elongation as the particle size decreases (i.e.
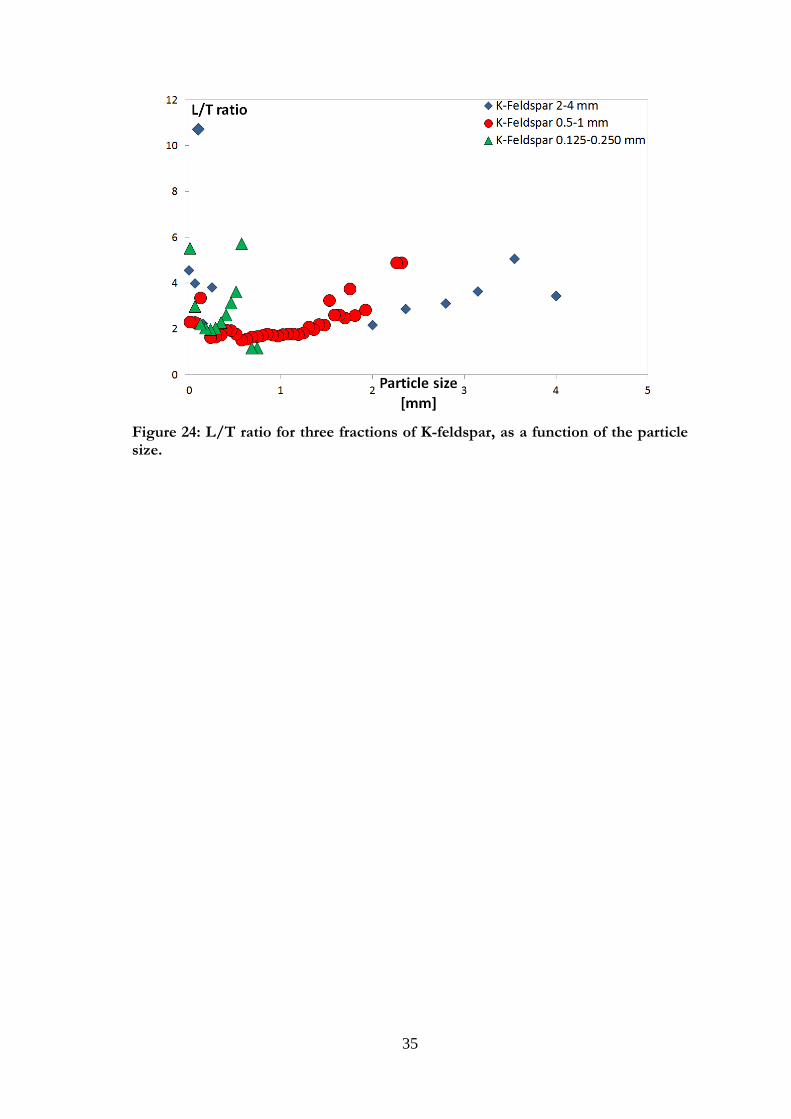
L/T increased), as can be seen in Figure 24.
35
Figure 24: L/T ratio for three fractions of K-feldspar, as a function of the particle size.
36
a1. a2
b1. b2
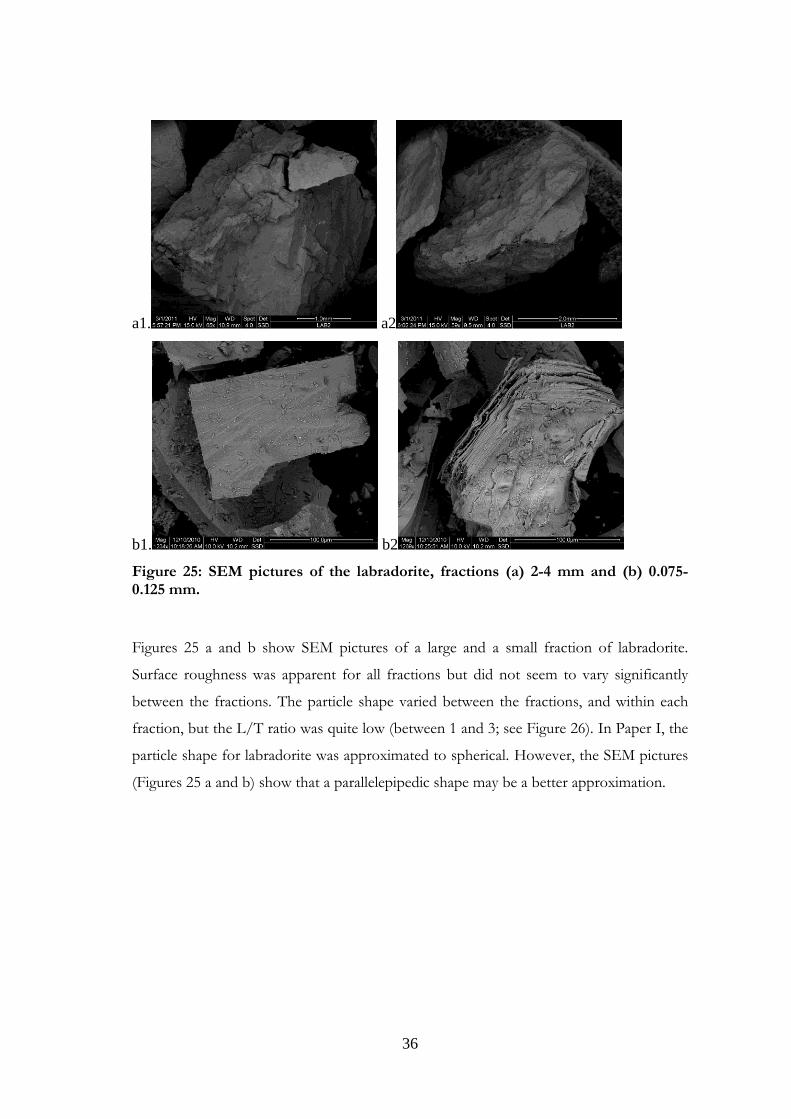
Figure 25: SEM pictures of the labradorite, fractions (a) 2-4 mm and (b) 0.075-0.125 mm.
Figures 25 a and b show SEM pictures of a large and a small fraction of labradorite.
Surface roughness was apparent for all fractions but did not seem to vary significantly
between the fractions. The particle shape varied between the fractions, and within each
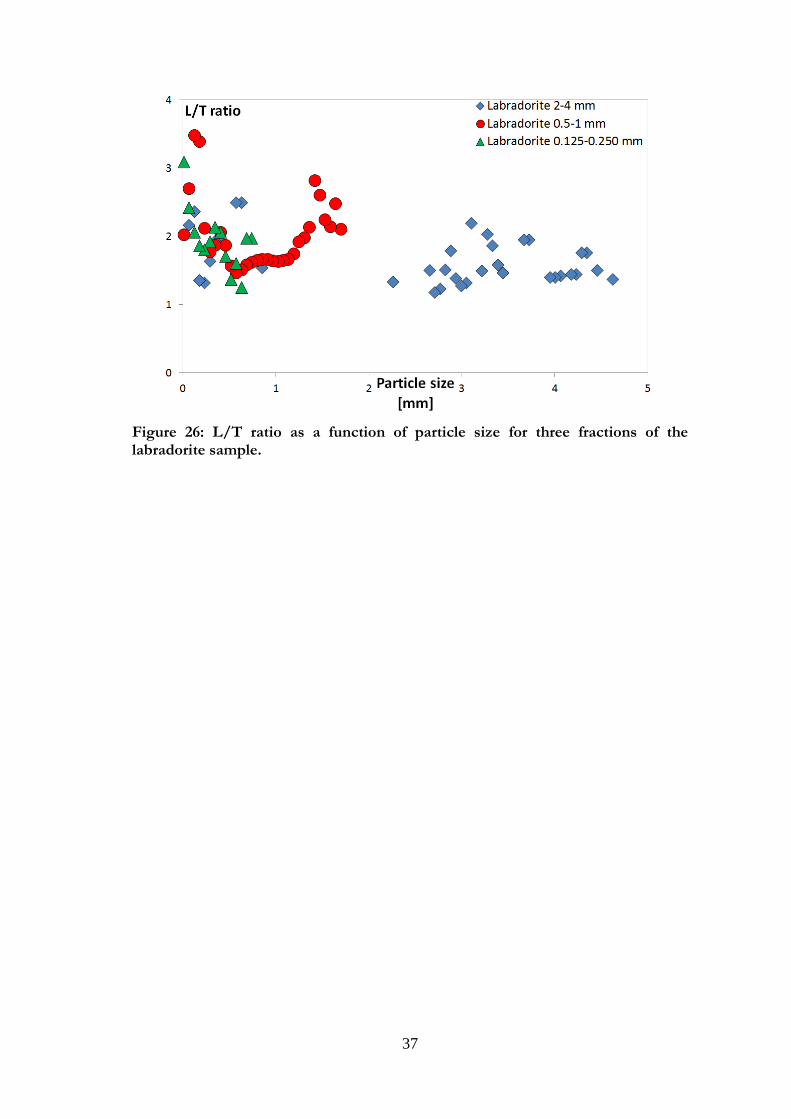
fraction, but the L/T ratio was quite low (between 1 and 3; see Figure 26). In Paper I, the
particle shape for labradorite was approximated to spherical. However, the SEM pictures
(Figures 25 a and b) show that a parallelepipedic shape may be a better approximation.
37
Figure 26: L/T ratio as a function of particle size for three fractions of the labradorite sample.
38
a1. a2
b1. b2
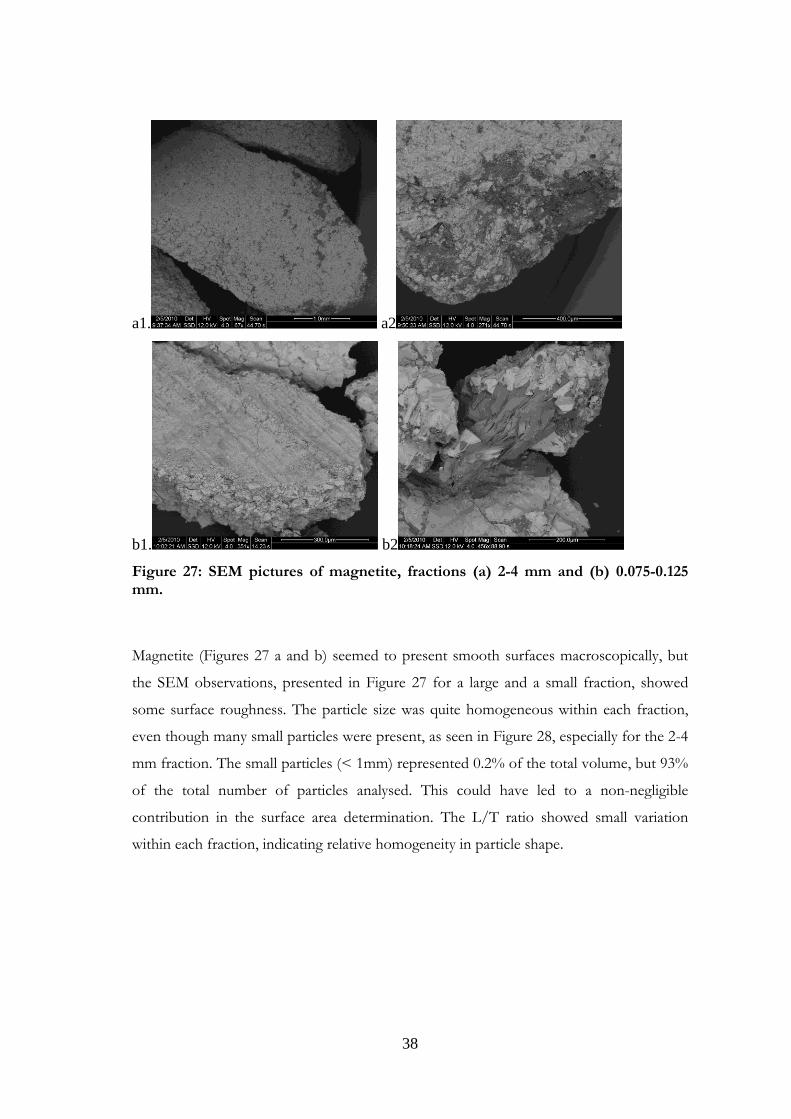
Figure 27: SEM pictures of magnetite, fractions (a) 2-4 mm and (b) 0.075-0.125 mm.
Magnetite (Figures 27 a and b) seemed to present smooth surfaces macroscopically, but
the SEM observations, presented in Figure 27 for a large and a small fraction, showed
some surface roughness. The particle size was quite homogeneous within each fraction,
even though many small particles were present, as seen in Figure 28, especially for the 2-4
mm fraction. The small particles (< 1mm) represented 0.2% of the total volume, but 93%
of the total number of particles analysed. This could have led to a non-negligible
contribution in the surface area determination. The L/T ratio showed small variation
within each fraction, indicating relative homogeneity in particle shape.
39
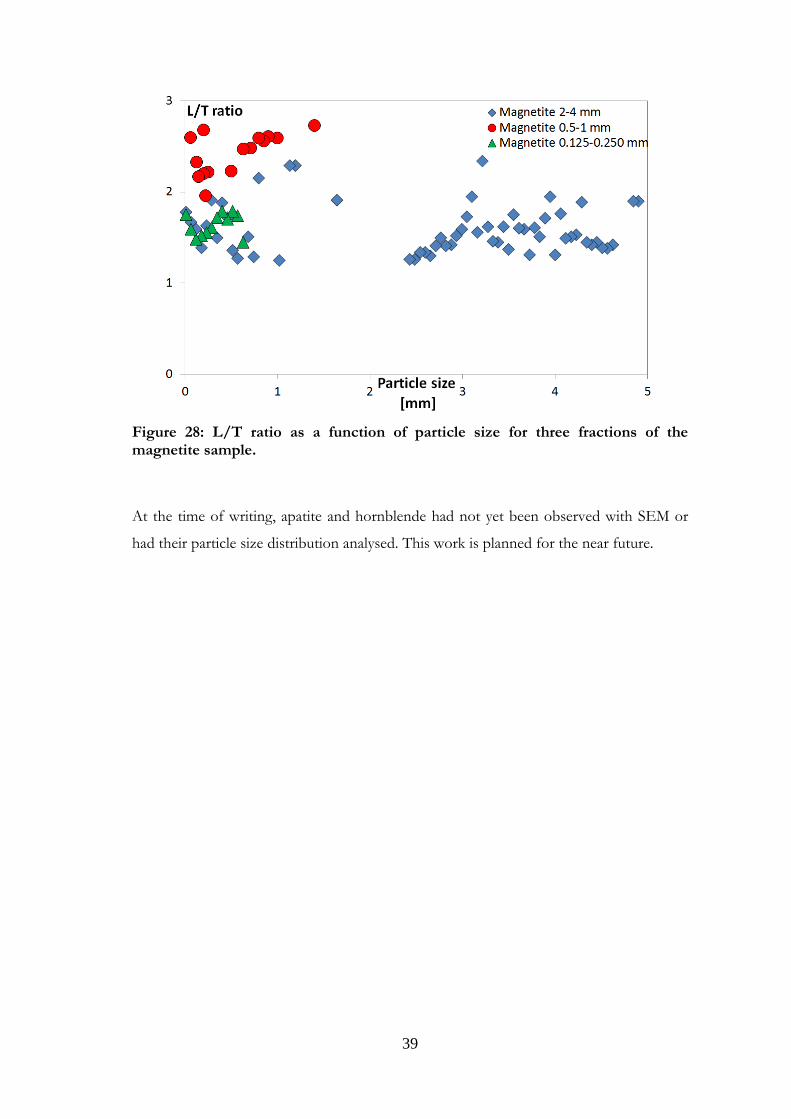
Figure 28: L/T ratio as a function of particle size for three fractions of the magnetite sample.
At the time of writing, apatite and hornblende had not yet been observed with SEM or
had their particle size distribution analysed. This work is planned for the near future.

40
41
4. Results and Discussion
4.1. Results
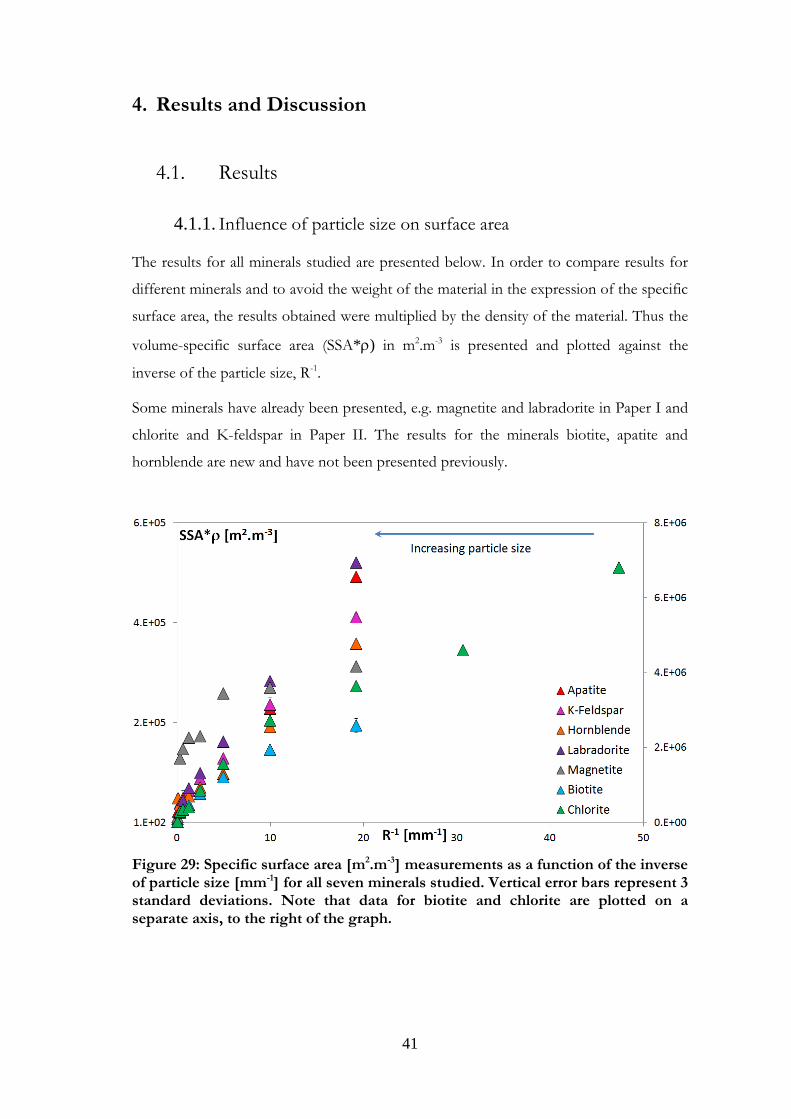
Influence of particle size on surface area 4.1.1.
The results for all minerals studied are presented below. In order to compare results for
different minerals and to avoid the weight of the material in the expression of the specific
surface area, the results obtained were multiplied by the density of the material. Thus the
volume-specific surface area (SSA*) in m2.m-3 is presented and plotted against the
inverse of the particle size, R-1.
Some minerals have already been presented, e.g. magnetite and labradorite in Paper I and
chlorite and K-feldspar in Paper II. The results for the minerals biotite, apatite and
hornblende are new and have not been presented previously.
Figure 29: Specific surface area [m2.m-3] measurements as a function of the inverse of particle size [mm-1] for all seven minerals studied. Vertical error bars represent 3
standard deviations. Note that data for biotite and chlorite are plotted on a separate axis, to the right of the graph.
42
For all minerals studied, there was a decrease in the specific surface area as the particle
size increased, as can be seen in Figure 29. However, each mineral type displayed
different behaviours, and therefore the results are presented below for similar minerals,
the feldspars (K-feldspar and labradorite), the phyllosilicates (biotite and chlorite) and
other minerals (magnetite, apatite and hornblende).
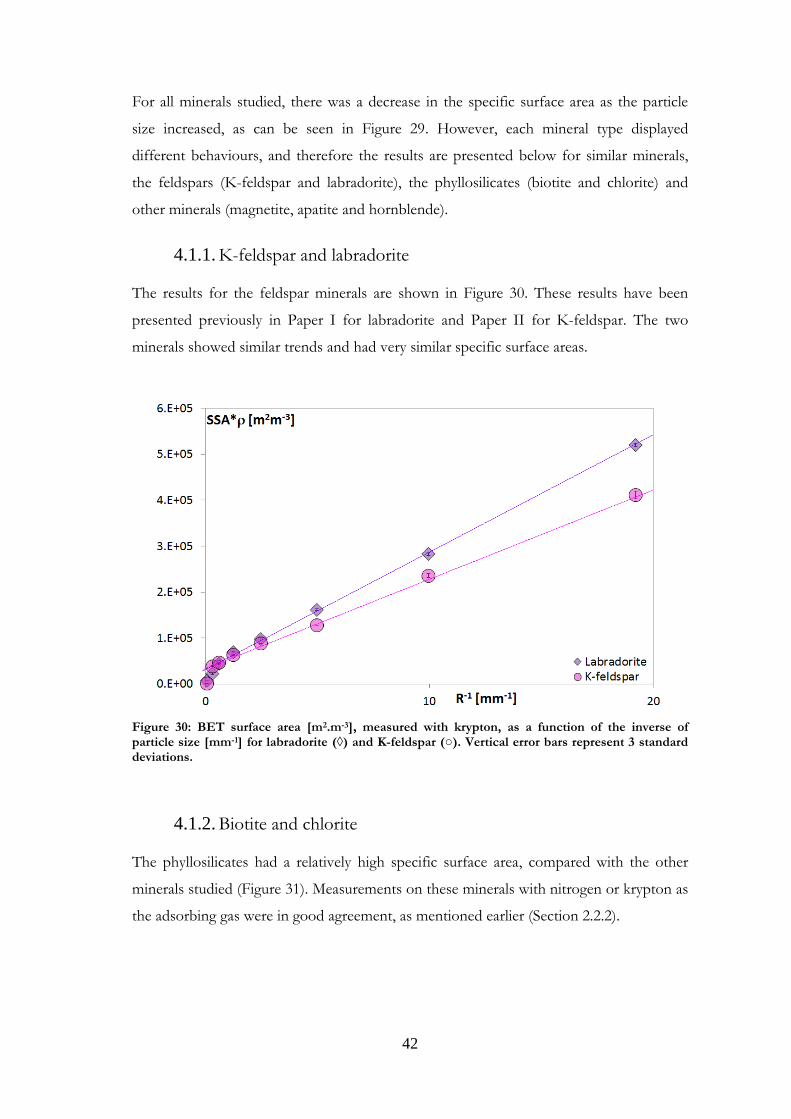
K-feldspar and labradorite 4.1.1.
The results for the feldspar minerals are shown in Figure 30. These results have been
presented previously in Paper I for labradorite and Paper II for K-feldspar. The two
minerals showed similar trends and had very similar specific surface areas.
Figure 30: BET surface area [m2.m-3], measured with krypton, as a function of the inverse of particle size [mm-1] for labradorite (◊) and K-feldspar (○). Vertical error bars represent 3 standard deviations.
Biotite and chlorite 4.1.2.
The phyllosilicates had a relatively high specific surface area, compared with the other
minerals studied (Figure 31). Measurements on these minerals with nitrogen or krypton as
the adsorbing gas were in good agreement, as mentioned earlier (Section 2.2.2).
43
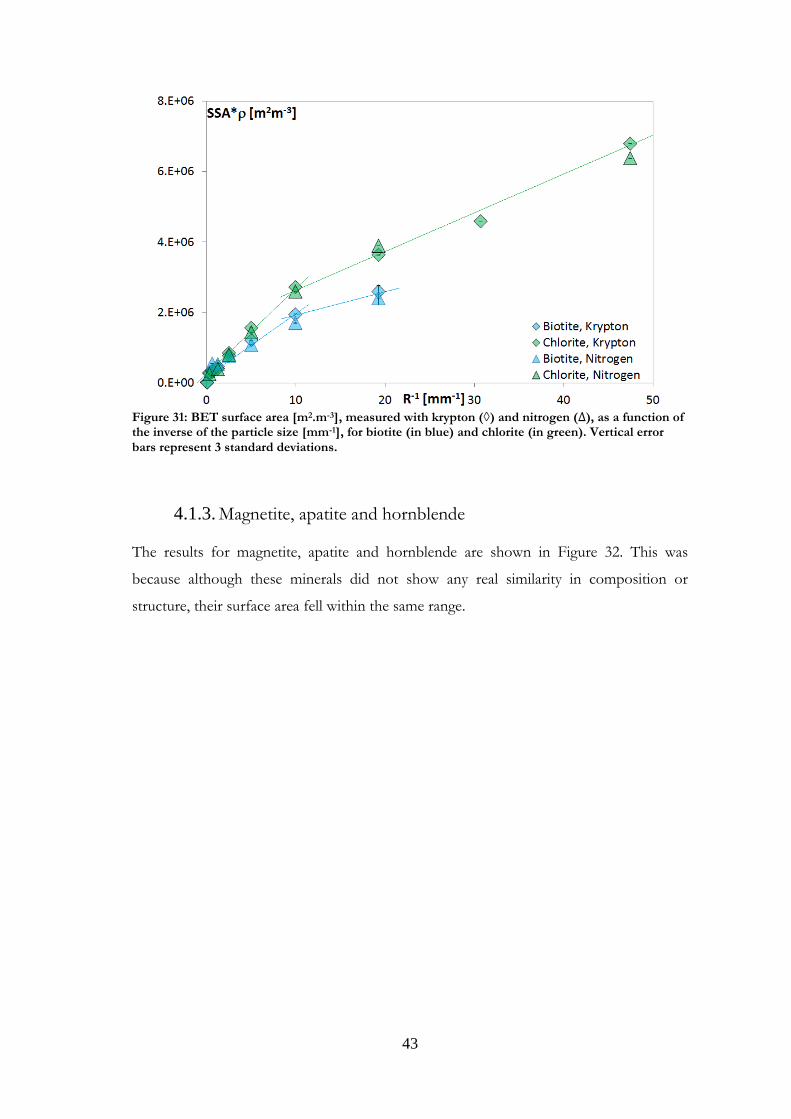
Figure 31: BET surface area [m2.m-3], measured with krypton (◊) and nitrogen ( ), as a function of the inverse of the particle size [mm-1], for biotite (in blue) and chlorite (in green). Vertical error bars represent 3 standard deviations.
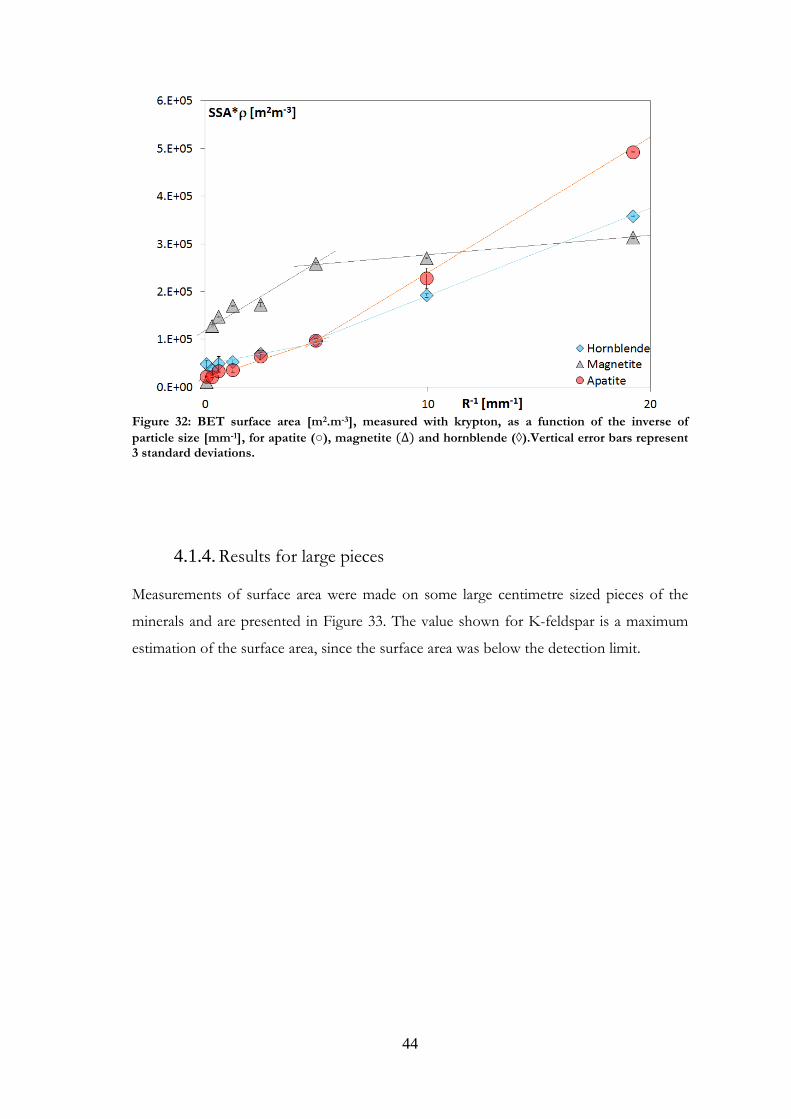
Magnetite, apatite and hornblende 4.1.3.
The results for magnetite, apatite and hornblende are shown in Figure 32. This was
because although these minerals did not show any real similarity in composition or
structure, their surface area fell within the same range.
44
Figure 32: BET surface area [m2.m-3], measured with krypton, as a function of the inverse of
particle size [mm-1], for apatite (○), magnetite and hornblende (◊).Vertical error bars represent 3 standard deviations.
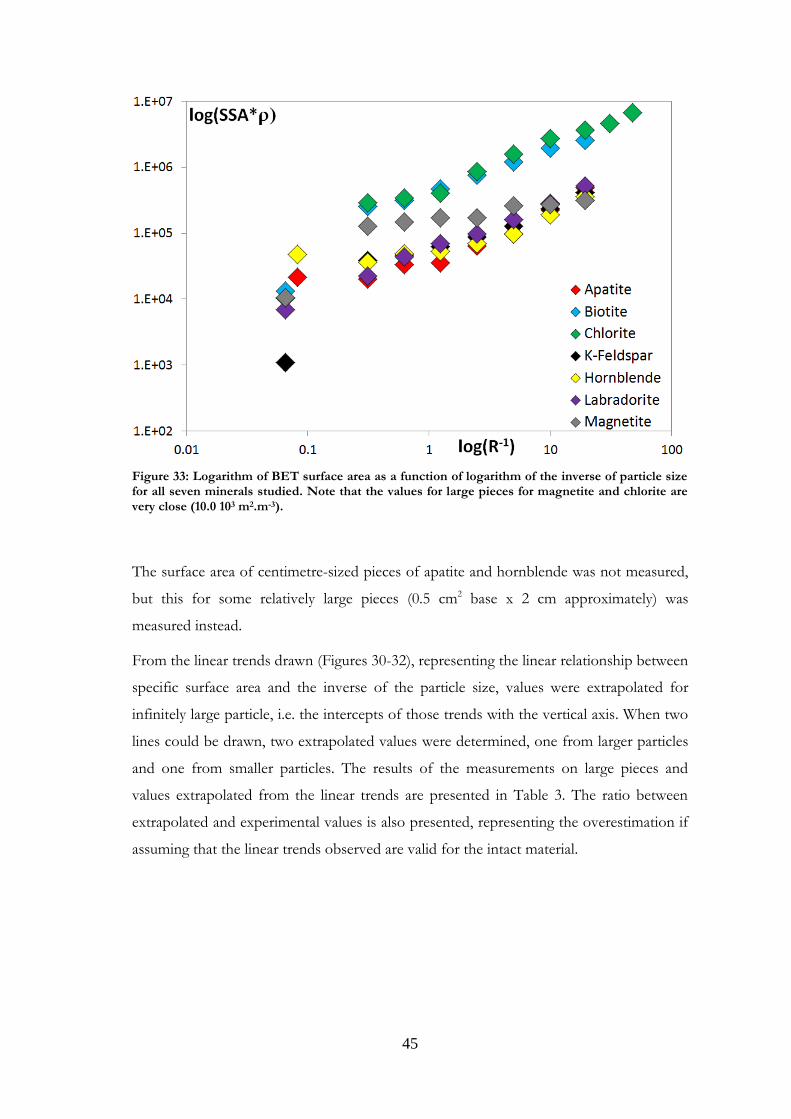
Results for large pieces 4.1.4.
Measurements of surface area were made on some large centimetre sized pieces of the
minerals and are presented in Figure 33. The value shown for K-feldspar is a maximum
estimation of the surface area, since the surface area was below the detection limit.
45
Figure 33: Logarithm of BET surface area as a function of logarithm of the inverse of particle size for all seven minerals studied. Note that the values for large pieces for magnetite and chlorite are very close (10.0 103 m2.m-3).
The surface area of centimetre-sized pieces of apatite and hornblende was not measured,
but this for some relatively large pieces (0.5 cm2 base x 2 cm approximately) was
measured instead.
From the linear trends drawn (Figures 30-32), representing the linear relationship between
specific surface area and the inverse of the particle size, values were extrapolated for
infinitely large particle, i.e. the intercepts of those trends with the vertical axis. When two
lines could be drawn, two extrapolated values were determined, one from larger particles
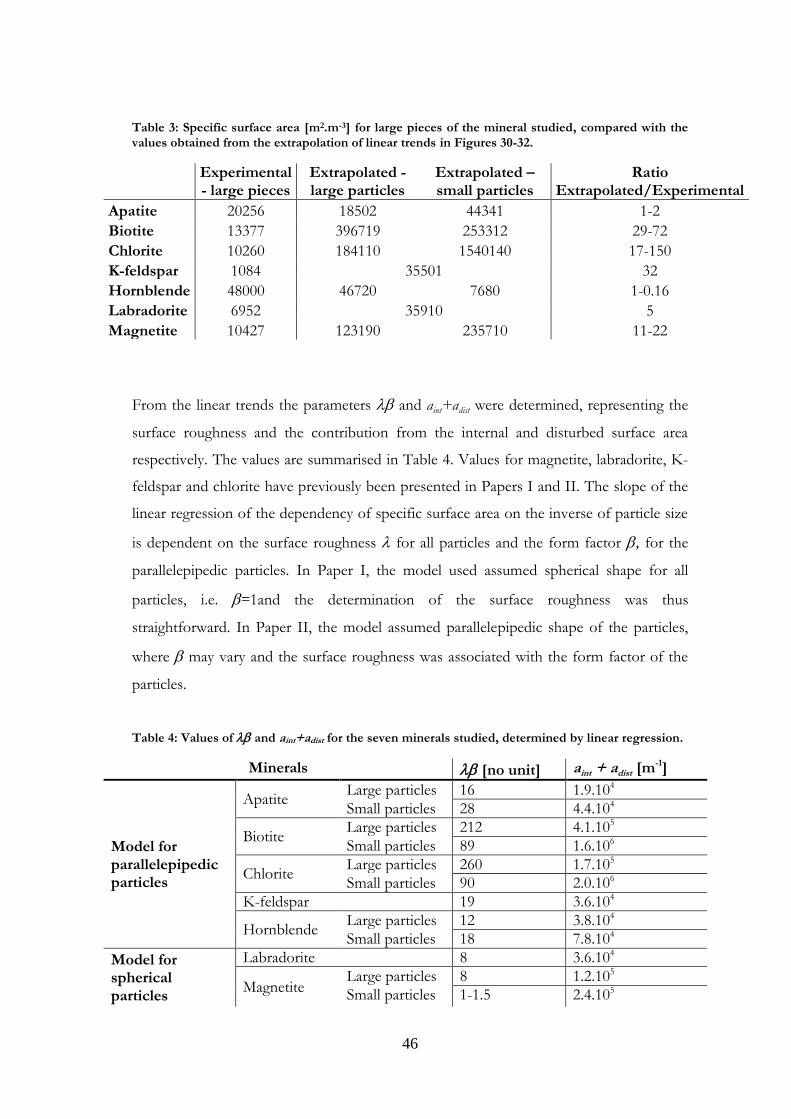
and one from smaller particles. The results of the measurements on large pieces and
values extrapolated from the linear trends are presented in Table 3. The ratio between
extrapolated and experimental values is also presented, representing the overestimation if
assuming that the linear trends observed are valid for the intact material.
46
Table 3: Specific surface area [m2.m-3] for large pieces of the mineral studied, compared with the values obtained from the extrapolation of linear trends in Figures 30-32.
Experimental - large pieces
Extrapolated - large particles
Extrapolated – small particles
Ratio Extrapolated/Experimental
Apatite 20256 18502 44341 1-2
Biotite 13377 396719 253312 29-72
Chlorite 10260 184110 1540140 17-150
K-feldspar 1084 35501 32
Hornblende 48000 46720 7680 1-0.16
Labradorite 6952 35910 5
Magnetite 10427 123190 235710 11-22
From the linear trends the parameters and aint+adist were determined, representing the
surface roughness and the contribution from the internal and disturbed surface area
respectively. The values are summarised in Table 4. Values for magnetite, labradorite, K-
feldspar and chlorite have previously been presented in Papers I and II. The slope of the
linear regression of the dependency of specific surface area on the inverse of particle size
is dependent on the surface roughness for all particles and the form factor , for the
parallelepipedic particles. In Paper I, the model used assumed spherical shape for all
particles, i.e. =1and the determination of the surface roughness was thus
straightforward. In Paper II, the model assumed parallelepipedic shape of the particles,
where may vary and the surface roughness was associated with the form factor of the
particles.
Table 4: Values of and aint+adist for the seven minerals studied, determined by linear regression.
Minerals [no unit] aint + adist [m-1]
Model for parallelepipedic particles
Apatite Large particles 16 1.9.104
Small particles 28 4.4.104
Biotite Large particles 212 4.1.105
Small particles 89 1.6.106
Chlorite Large particles 260 1.7.105
Small particles 90 2.0.106
K-feldspar 19 3.6.104
Hornblende Large particles 12 3.8.104
Small particles 18 7.8.104
Model for spherical particles
Labradorite 8 3.6.104
Magnetite Large particles 8 1.2.105
Small particles 1-1.5 2.4.105
47
4.2. Discussion
Surface area and particle size 4.2.1.
The model described in Section 2 showed a good fit to the feldspar minerals. For K-
feldspar and labradorite, a linear trend was obtained for small particles, up to a millimetre
particle size, beyond which a deviation from linearity was observed as the particle size
increased, as predicted in the model (see Figure 30). It can be pointed out that the K-
feldspar and labradorite had similar specific surface area for large size fractions and that
the slope for labradorite was steeper (by 30%) than that for K-feldspar. The underlying
reason can be either larger surface roughness, or larger form factor for labradorite. It can
be noted from the SEM observations (Figures 23 a. and 25 a.) that the labradorite had a
rounder shape than K-feldspar, which showed a parallelepipedic shape. It can also be
noted that the surface of the feldspar particles looked smoother than that of the
labradorite particles (Figures 23 and 25 a and b). Both these observations are in
agreement with the observed difference in slope of the curve between these two minerals.
The relationship between surface area and the inverse of particle size was very similar for
both biotite and chlorite (Figure 31), and it was possible to approximate it with two linear
trends with a break in trend around particle size 0.125-0.250 mm (i.e. R-1=9.9 ̅), as
reported in Paper II for chlorite. The trends were quite clear for chlorite, where some
more fractions were separated into lower particle sizes (0.025-0.053 and 0.053-0.075 mm).
Although those size fractions were not collected for biotite, the sample seemed to show
the same behaviour as chlorite. The trends showed a flatter slope for small particles
(0.025-0.053 mm or 0.075-0.125 mm to 0.250 mm) than for large particles (0.125-0.250
mm to 4-8 mm) for both minerals. This could either indicate a change in the surface
roughness (i.e. smoother particles as the particle size decreases), in the internal surface
area (i.e. comparatively fewer pores or fractures available as the particle size decreases) or
even in the particle geometry.
SEM observations (Figures 19 and 21 a and b), coupled with particle size analysis, showed
that the particles did not really change geometry between fractions, neither for biotite nor
for chlorite. Porosity measurements are currently underway. Changes in the porosity can
be associated with changes in the internal surface area.
48
Just as for the feldspars, it can be noted that there was a difference in the slopes for the
phyllosilicates minerals studied. The slope for chlorite was 25% steeper than that for
biotite, implying a higher surface roughness and/or form factor. Looking at the SEM
pictures of those minerals (Figures 19 and 21), it can be seen that biotite had smoother
surfaces than chlorite. Comparison of L/T ratio was difficult with different behaviours
between the different size fractions of the two minerals. Hence, it can not be excluded
that both differences in surface roughness and/ or form factor contributed to the
somewhat steeper curve of chlorite.
Apatite, hornblende and magnetite followed linear trends for small particles, and also
showed deviations for large particles. The behaviour of magnetite can be divided into two
trends: one for large particles with a deviation as the particle size increased, as previously
presented in Paper I. For particles <1 mm size, the surface area seemed to reach a
plateau; the specific surface area became independent of, or only weakly dependent on
the particle size.
For apatite, hornblende and magnetite, deviation in the linear trend was visible for
particle size >2 mm. However, a better fit was obtained by dividing the linear trend into
two, with a break of trend at the fraction 0.25 -0.50 mm. The slope of the linear trend for
small particles of magnetite was flatter than for large particles. However for apatite and
hornblende, the slope for small particles was steeper than for larger particles. This break
of trend, just as for the phyllosilicates, can be due to a change in particle shape, especially
for hornblende, where particles go from needle-shaped to rounder as the particle size
decreases. Alternatively, it can be due to an increase in the surface roughness, or a change
in the internal surface area. Particle size analyses, SEM investigations and porosity
measurements are needed to confirm these hypotheses.
The specific surface areas of the centimetre-sized pieces were very low for all minerals,
compared with what could be expected from most of the linear trends drawn for most of
the minerals. The extrapolation generally yielded a ratio of 5 to 150 in the overestimation
of the surface area, with higher overestimation from small particles than from large
particles (see Table 4). This is in accordance with the model developed and presented in
Section 2. According to this model, mechanical treatment of the material creates a
disturbed zone which contributes to an increase in the specific surface area. The
extrapolation to infinite particle size, i.e. the intact material, can be used as a way to
estimate the internal surface area. However, the values calculated then also include the
49
surface area for the disturbed zone, see Table 4. The surface area of the largest pieces
represented a few percent (30% for labradorite, 3-8% for the other minerals, surface areas
for largest pieces of apatite and hornblende not measurable) of the surface area of the
largest fraction, 4-8 mm. Even though the large pieces were used as a way to relate to the
intact material, mechanical disturbance can have caused their surface area to differ from
the actual surface area of the intact material.
As the specific surface area is a parameter often used to normalise rock and mineral
studies, an overestimation of the specific surface area could possibly lead to an
overestimation of other material characteristics and induce a bias. In the case of sorption
of radionuclides, this could involve an overestimation of the sorption and it also suggests
that sorption experiments on crushed material are dominated by properties of fresh
surfaces, not present in the original material.
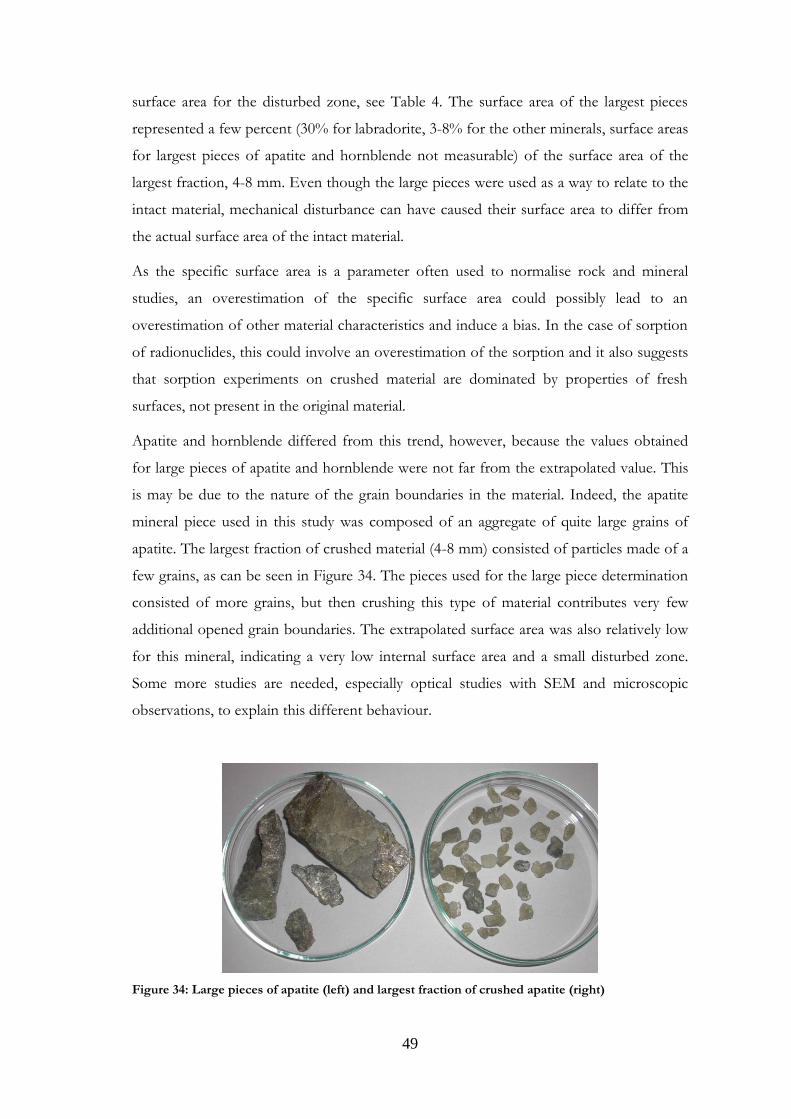
Apatite and hornblende differed from this trend, however, because the values obtained
for large pieces of apatite and hornblende were not far from the extrapolated value. This
is may be due to the nature of the grain boundaries in the material. Indeed, the apatite
mineral piece used in this study was composed of an aggregate of quite large grains of
apatite. The largest fraction of crushed material (4-8 mm) consisted of particles made of a
few grains, as can be seen in Figure 34. The pieces used for the large piece determination
consisted of more grains, but then crushing this type of material contributes very few
additional opened grain boundaries. The extrapolated surface area was also relatively low
for this mineral, indicating a very low internal surface area and a small disturbed zone.
Some more studies are needed, especially optical studies with SEM and microscopic
observations, to explain this different behaviour.
Figure 34: Large pieces of apatite (left) and largest fraction of crushed apatite (right)
50
In the case of hornblende too, data for the largest centimetre-sized pieces were missing,
but the specific surface area for somewhat smaller pieces was measured. The difference
between the extrapolated values from particles of crushed material and those measured
for the pieces was very low. The values obtained for the pieces were in fact larger than the
values for the largest fraction of crushed material (0.0150 and 0.0114 m2.g-1 respectively).
As for apatite, some optical observations are needed to explain why the extrapolation in
these two cases worked relatively well.
Comparison between minerals 4.2.2.
In order to determine changes in the specific surface area of the minerals relative to each
other, comparisons were made between the minerals for different size fractions. Three
fractions were selected for these comparisons, the largest (8-4 mm), an intermediate (1-0.5
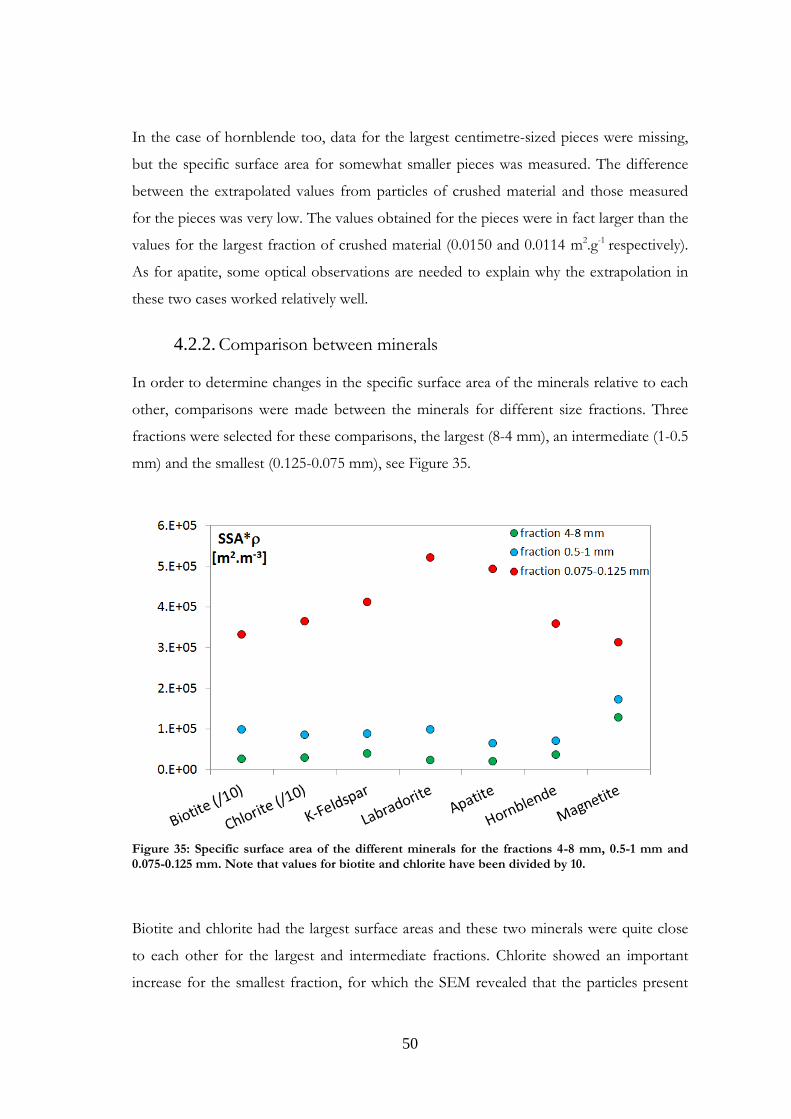
mm) and the smallest (0.125-0.075 mm), see Figure 35.
Figure 35: Specific surface area of the different minerals for the fractions 4-8 mm, 0.5-1 mm and 0.075-0.125 mm. Note that values for biotite and chlorite have been divided by 10.
Biotite and chlorite had the largest surface areas and these two minerals were quite close
to each other for the largest and intermediate fractions. Chlorite showed an important
increase for the smallest fraction, for which the SEM revealed that the particles present
51
had very rough surfaces and edges. The other minerals, on the other hand, had a three
dimensional network and did not contain such rough edges. They also displayed relatively
similar surface areas. It is interesting to note that feldspar minerals displayed the largest
surface area increase and that the surface area for magnetite varied the least. Hornblende,
however, had a structure reminding of phyllosilicates with TOT-like patterns, and could
be expected to have higher surface areas. SEM observations are needed to see if the
particles have smooth surfaces and smooth edges, which would explain the relatively low
surface area observed for hornblende.
Comparison with published data 4.2.3.
Comparisons were made with data published in the literature for the minerals studied.
Such comparisons are presented in Paper I for magnetite and labradorite and in Paper II
for K-feldspar and chlorite. However, the present comparison for the feldspars differs
from that in Papers I and II, where granite was used for comparisons with labradorite.
Other plagioclases and more relevant references have now been gathered. Comparisons
were also made for the other minerals studied, and are presented here for the first time.
It should be noted that samples may be very different from one study to another in terms
of structure, grain size or composition. Although most existing studies use nitrogen as the
adsorbing gas, argon has also been used for surface area determinations. Data based on
argon were not used in the present comparison, as this gas was not used in this study.
Biotite has been studied mostly for its weathering properties, and in such studies the
surface area is an important parameter. A comparison of data for biotite is presented in
Figure 36.
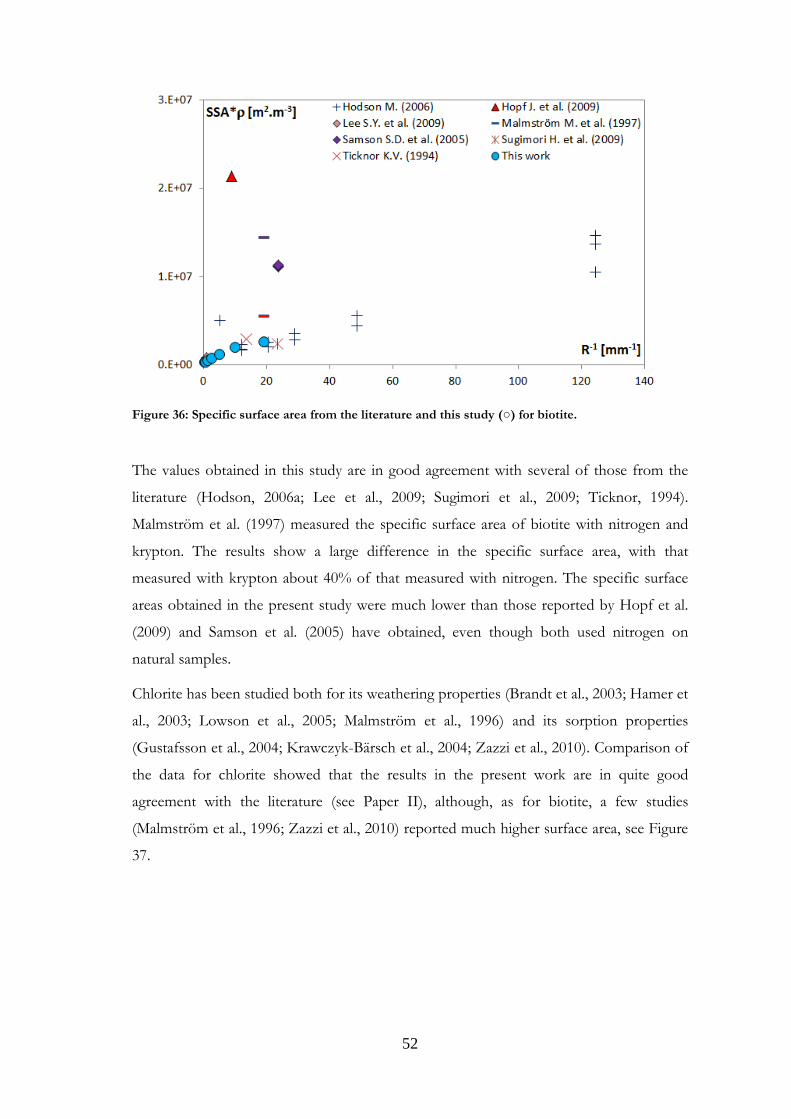
52
Figure 36: Specific surface area from the literature and this study (○) for biotite.
The values obtained in this study are in good agreement with several of those from the
literature (Hodson, 2006a; Lee et al., 2009; Sugimori et al., 2009; Ticknor, 1994).
Malmström et al. (1997) measured the specific surface area of biotite with nitrogen and
krypton. The results show a large difference in the specific surface area, with that
measured with krypton about 40% of that measured with nitrogen. The specific surface
areas obtained in the present study were much lower than those reported by Hopf et al.
(2009) and Samson et al. (2005) have obtained, even though both used nitrogen on
natural samples.
Chlorite has been studied both for its weathering properties (Brandt et al., 2003; Hamer et
al., 2003; Lowson et al., 2005; Malmström et al., 1996) and its sorption properties
(Gustafsson et al., 2004; Krawczyk-Bärsch et al., 2004; Zazzi et al., 2010). Comparison of
the data for chlorite showed that the results in the present work are in quite good
agreement with the literature (see Paper II), although, as for biotite, a few studies
(Malmström et al., 1996; Zazzi et al., 2010) reported much higher surface area, see Figure
37.
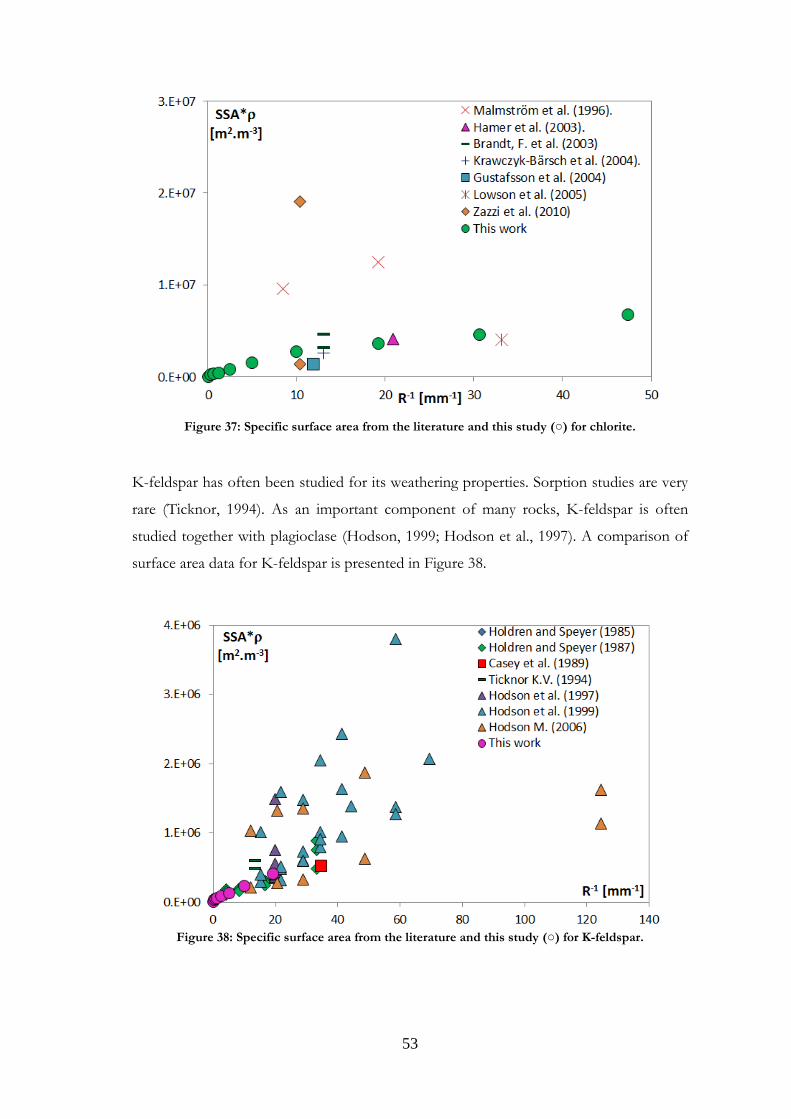
53
Figure 37: Specific surface area from the literature and this study (○) for chlorite.
K-feldspar has often been studied for its weathering properties. Sorption studies are very
rare (Ticknor, 1994). As an important component of many rocks, K-feldspar is often
studied together with plagioclase (Hodson, 1999; Hodson et al., 1997). A comparison of
surface area data for K-feldspar is presented in Figure 38.
Figure 38: Specific surface area from the literature and this study (○) for K-feldspar.
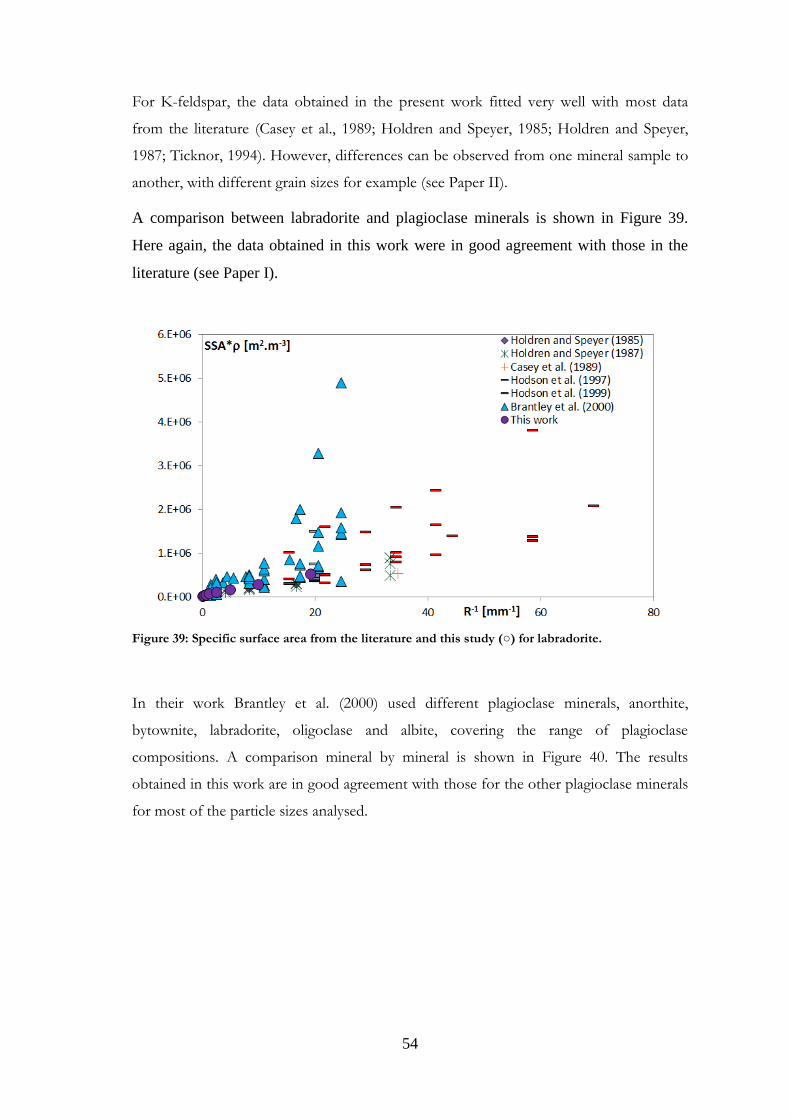
54
For K-feldspar, the data obtained in the present work fitted very well with most data
from the literature (Casey et al., 1989; Holdren and Speyer, 1985; Holdren and Speyer,
1987; Ticknor, 1994). However, differences can be observed from one mineral sample to
another, with different grain sizes for example (see Paper II).
A comparison between labradorite and plagioclase minerals is shown in Figure 39.
Here again, the data obtained in this work were in good agreement with those in the
literature (see Paper I).
Figure 39: Specific surface area from the literature and this study (○) for labradorite.
In their work Brantley et al. (2000) used different plagioclase minerals, anorthite,
bytownite, labradorite, oligoclase and albite, covering the range of plagioclase
compositions. A comparison mineral by mineral is shown in Figure 40. The results
obtained in this work are in good agreement with those for the other plagioclase minerals
for most of the particle sizes analysed.
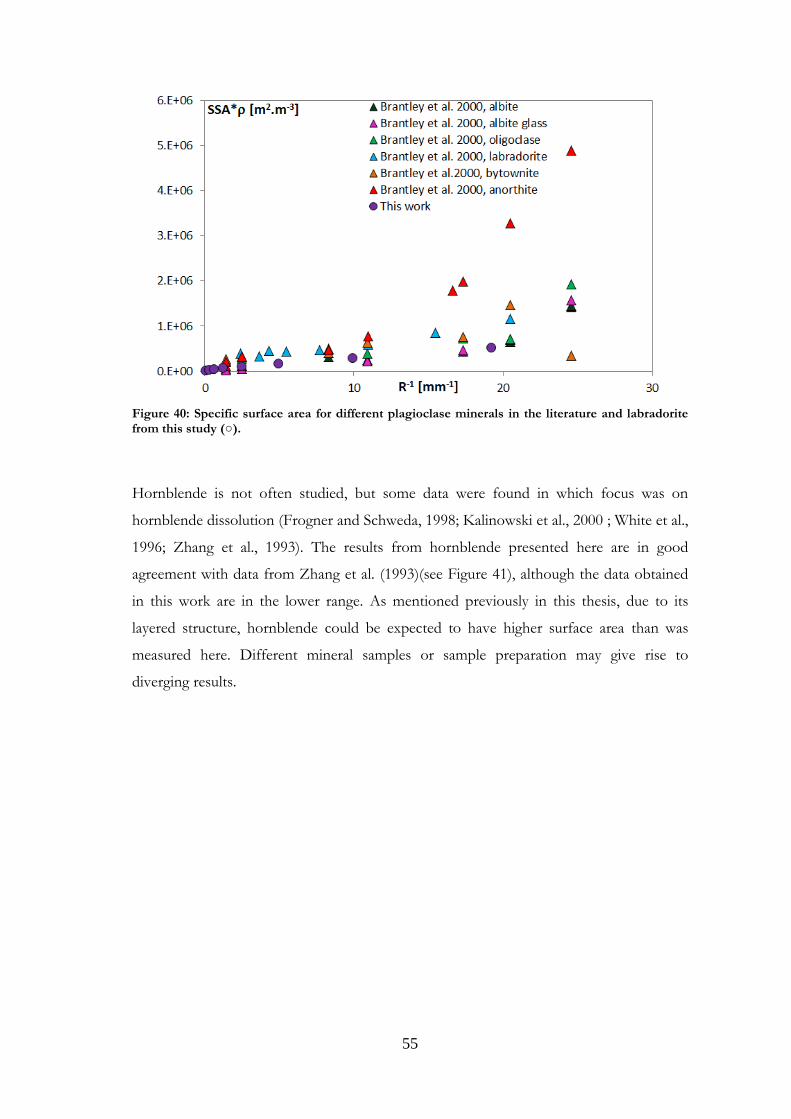
55
Figure 40: Specific surface area for different plagioclase minerals in the literature and labradorite from this study (○).
Hornblende is not often studied, but some data were found in which focus was on
hornblende dissolution (Frogner and Schweda, 1998; Kalinowski et al., 2000 ; White et al.,
1996; Zhang et al., 1993). The results from hornblende presented here are in good
agreement with data from Zhang et al. (1993)(see Figure 41), although the data obtained
in this work are in the lower range. As mentioned previously in this thesis, due to its
layered structure, hornblende could be expected to have higher surface area than was
measured here. Different mineral samples or sample preparation may give rise to
diverging results.
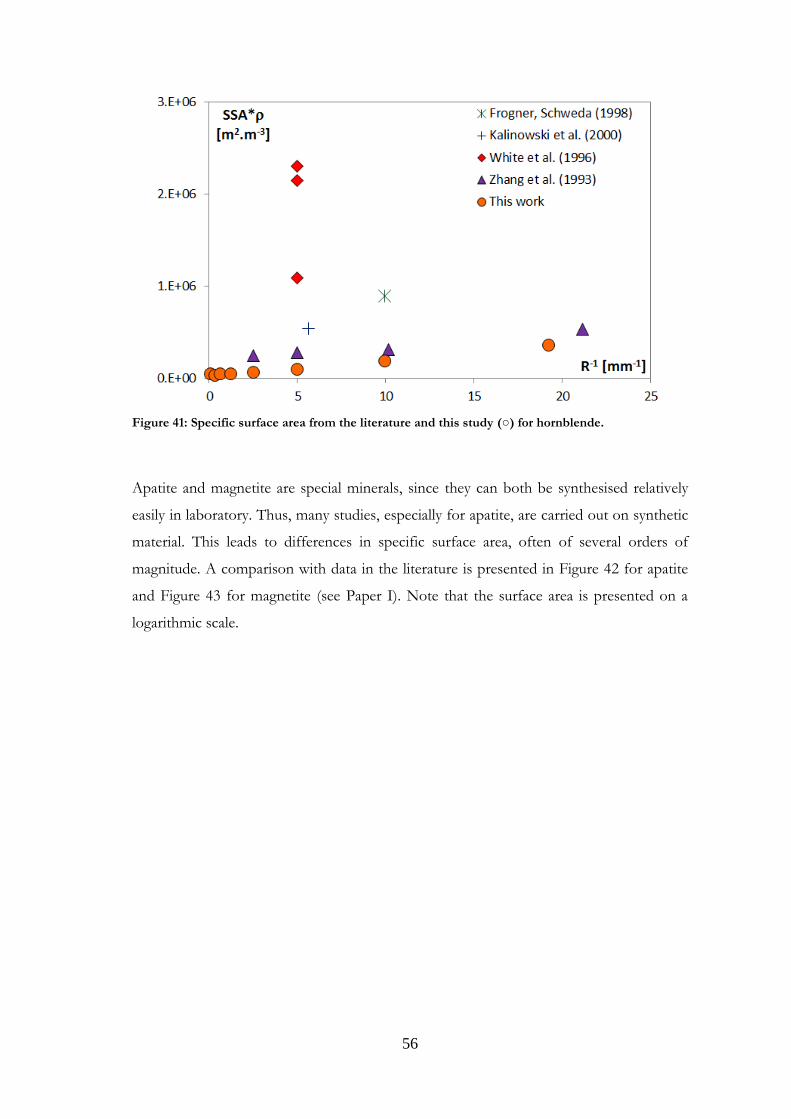
56
Figure 41: Specific surface area from the literature and this study (○) for hornblende.
Apatite and magnetite are special minerals, since they can both be synthesised relatively
easily in laboratory. Thus, many studies, especially for apatite, are carried out on synthetic
material. This leads to differences in specific surface area, often of several orders of
magnitude. A comparison with data in the literature is presented in Figure 42 for apatite
and Figure 43 for magnetite (see Paper I). Note that the surface area is presented on a
logarithmic scale.
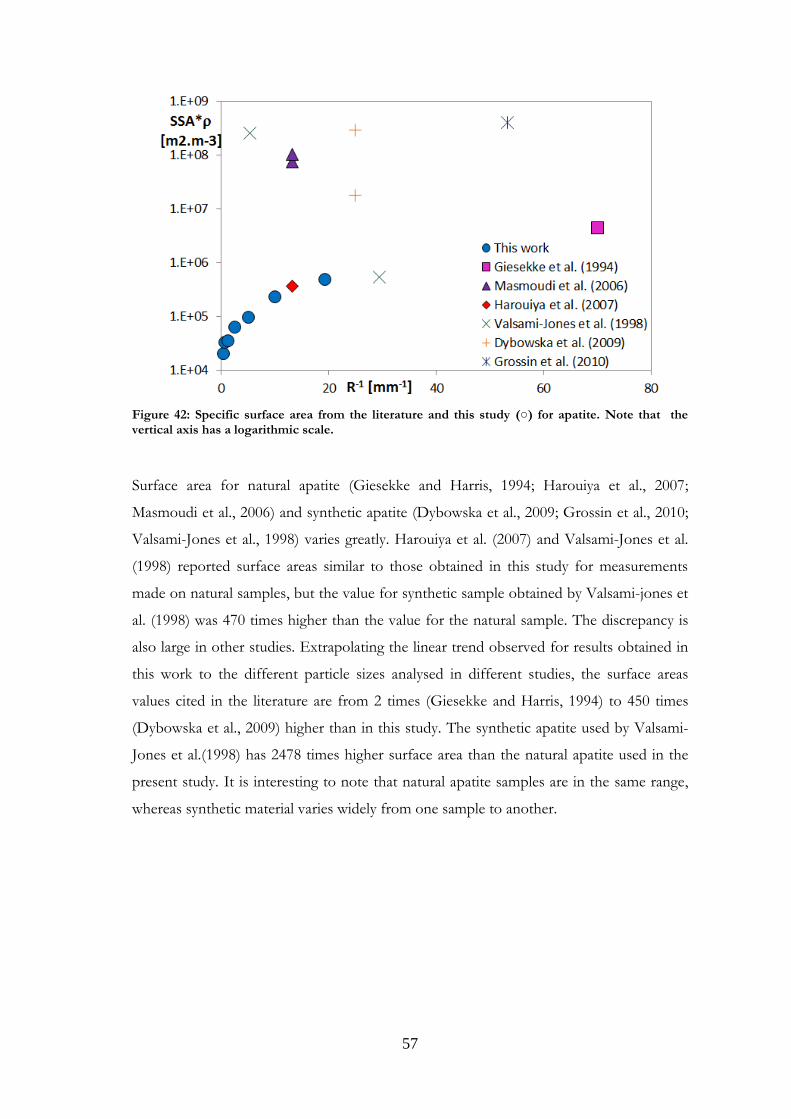
57
Figure 42: Specific surface area from the literature and this study (○) for apatite. Note that the vertical axis has a logarithmic scale.
Surface area for natural apatite (Giesekke and Harris, 1994; Harouiya et al., 2007;
Masmoudi et al., 2006) and synthetic apatite (Dybowska et al., 2009; Grossin et al., 2010;
Valsami-Jones et al., 1998) varies greatly. Harouiya et al. (2007) and Valsami-Jones et al.
(1998) reported surface areas similar to those obtained in this study for measurements
made on natural samples, but the value for synthetic sample obtained by Valsami-jones et
al. (1998) was 470 times higher than the value for the natural sample. The discrepancy is
also large in other studies. Extrapolating the linear trend observed for results obtained in
this work to the different particle sizes analysed in different studies, the surface areas
values cited in the literature are from 2 times (Giesekke and Harris, 1994) to 450 times
(Dybowska et al., 2009) higher than in this study. The synthetic apatite used by Valsami-
Jones et al.(1998) has 2478 times higher surface area than the natural apatite used in the
present study. It is interesting to note that natural apatite samples are in the same range,
whereas synthetic material varies widely from one sample to another.
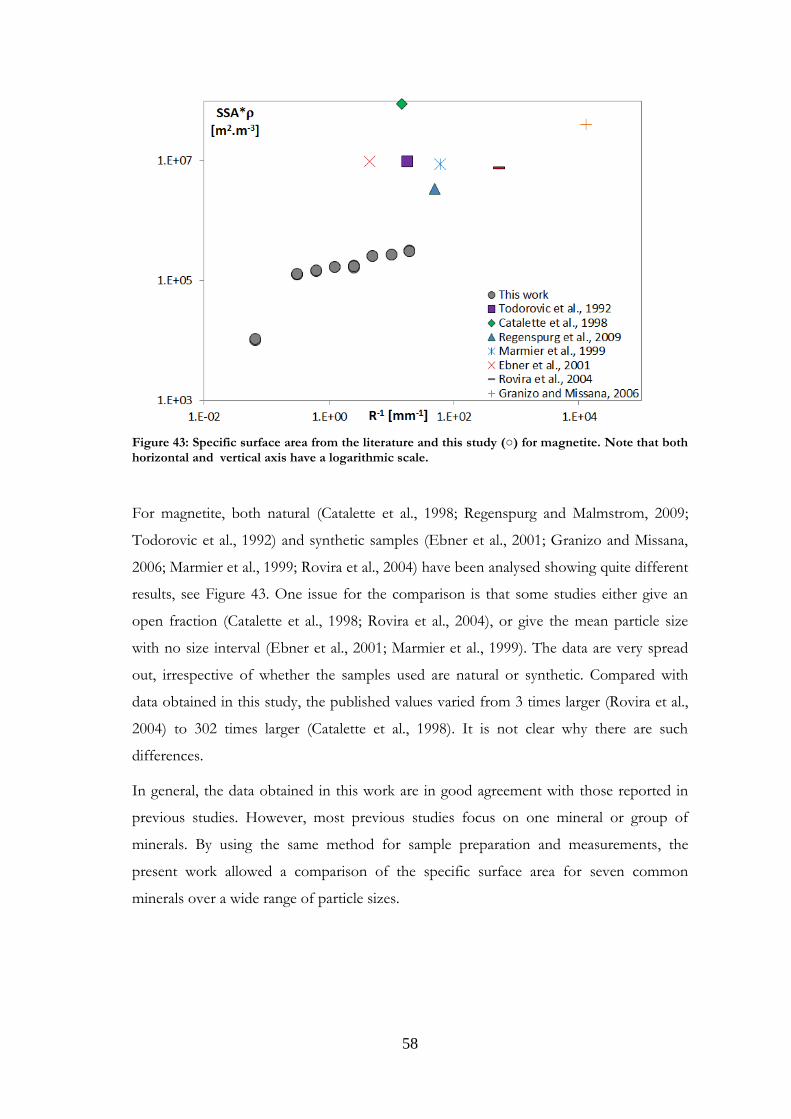
58
Figure 43: Specific surface area from the literature and this study (○) for magnetite. Note that both horizontal and vertical axis have a logarithmic scale.
For magnetite, both natural (Catalette et al., 1998; Regenspurg and Malmstrom, 2009;
Todorovic et al., 1992) and synthetic samples (Ebner et al., 2001; Granizo and Missana,
2006; Marmier et al., 1999; Rovira et al., 2004) have been analysed showing quite different
results, see Figure 43. One issue for the comparison is that some studies either give an
open fraction (Catalette et al., 1998; Rovira et al., 2004), or give the mean particle size
with no size interval (Ebner et al., 2001; Marmier et al., 1999). The data are very spread
out, irrespective of whether the samples used are natural or synthetic. Compared with
data obtained in this study, the published values varied from 3 times larger (Rovira et al.,
2004) to 302 times larger (Catalette et al., 1998). It is not clear why there are such
differences.
In general, the data obtained in this work are in good agreement with those reported in
previous studies. However, most previous studies focus on one mineral or group of
minerals. By using the same method for sample preparation and measurements, the
present work allowed a comparison of the specific surface area for seven common
minerals over a wide range of particle sizes.
59
5. Conclusions
The specific surface area was measured for seven pure minerals that typically occur in
granite. The measurements were made both on crushed material and large, centimetre-
sized pieces, the latter as a closer representative of the intact material. The results showed
an increase in the specific surface area as the particle size decreased. These results
conform with the model proposed by André et al. (2009) and the extended models
proposed in Papers I and II, where linear trends could be observed and a deviation
occurred with increasing particle sizes.
However, for some minerals, the model could not fit the data over the entire range of
particle size studied. Indeed, for biotite, chlorite, magnetite and also apatite and
hornblende, separate fits could be obtained by dividing the size fractions into two groups,
one for small and one for large particles. This behaviour is still unexplained and requires
further studies. However, some reasons can be suggested. There may be a change in the
internal surface area (i.e. the porosity), in the surface roughness, the particle geometry
over the particle sizes.
The deviation from linearity was confirmed with measurements made on large,
centimetre-sized pieces. These large pieces displayed considerably lower surface area than
could be expected from the linear extrapolation from crushed material, as previously
shown in Papers I and II. This supports the theory that mechanical treatment of the
samples creates new, internal surfaces.
In relation to radionuclide sorption properties of rocks and minerals, the results obtained
in this study indicate that the sorption by intact material may be greatly overestimated if it
is based solely on extrapolation from laboratory experiments on crushed material. The
results also suggest that the sorption results for crushed material may be dominated by
the properties of fresh, artificial surfaces that are not present in the original material.

60
61
6. References
Abu-Khader, M. M., 2009. Recent advances in nuclear power: A review. Progress in
Nuclear Energy 51, 225-235.
André, M., Malmström, M. E., and Neretnieks, I., 2009. Specific surface area
measurements on intact drillcores and evaluation of extrapolation methods for
rock matrix surfaces. Journal of Contaminant Hydrology 110, 1-8.
Bengtsson, G. and Ekere, L., 2001. Predicting sorption of groundwater bacteria from
size distribution, surface area, and magnetic susceptibility of soil particles.
Water Resources Research 37, 1795-1812.
Bishay, A. F., 1981. Low temperature krypton adsorption on porous solids. Surface
Technology 14, 167-175.
Bradbury, M. H. and Baeyens, B., 1997. N2-BET surface areameasurements on
crushed and intact minerals and rocks: A proposal for estamating sorption
transfer factors. Radioactive Waste Management and Disposal 122, 250-253.
Brandt, F., Bosbach, D., Krawczyk-Bärsch, E., Arnold, T., and Bernhard, G., 2003.
Chlorite dissolution in the acid pH-range: a combined microscopic and
macroscopic approach. Geochimica Et Cosmochimica Acta 67, 1451-1461.
Brantley, S. L. and Mellott, N. P., 2000. Surface area and porosity of primary silicate
minerals. American Mineralogist 85, 1767-1783.
Brunauer, S., Emmet, P. H., and Teller, E., 1938. Adsorption of Gases in
Multimolecular Layers. Journal of the American Chemical Society 60, 309-
319.
Byegård, J., Johansson, H., and Skålberg, M., 1998. The interaction of sorbing and
non-sorbing tracers with different Äspö rock types - Sorption and diffusion
experiments in the laboratory scale. Swedish Nuclear Fuel and Waste
Management Co., Stockholm, Sweden SKB Technical Report TR-98-18.
Casey, W. H., Westrich, H. R., Arnold, G. W., and Banfield, J. F., 1989. The surface
chemistry of dissolving labradorite feldspar. Geochimica Et Cosmochimica
Acta 53, 821-832.
Catalette, H., Dumonceau, J., and Ollar, P., 1998. Sorption of cesium, barium and
europium on magnetite. Journal of Contaminant Hydrology 35, 151-159.
Chow, K. Y. and Grant, D. J. W., 1988. Surface analysis of griseofulvin powders by
krypton adsorption: Evaluation of specific surface area, BET constant C and
polanyi adsorption potential. Powder Technology 56, 209-223.
Drake, H., Sandström, B., and Tullborg, E. L., 2006. Mineralogy and geochemistry of
rocks and fracture fillings from Forsmark and Oskarshamn: compilation of data
for SR-Can. Swedish Nuclear Fuel and Waste Management Co. SKB Report
R-06-109.
Dybowska, A., Manning, D. A. C., Collins, M. J., Wess, T., Woodgate, S., and
Valsami-Jones, E., 2009. An evaluation of the reactivity of synthetic and
natural apatites in the presence of aqueous metals. Science of the Total
Environment 407, 2953-2965.
Ebner, A. D., Ritter, J. A., and Navratil, J. D., 2001. Adsorption of cesium, strontium,
and cobalt ions on magnetite and a magnetite-silica composite. Industrial &
Engineering Chemistry Research 40, 1615-1623.
Fagerlund, G., 1973. Determination of specific surface by the BET method. Matériaux
et Constructions 6, 239-245.
62
Frogner, P. and Schweda, P., 1998. Hornblende dissolution kinetics at 25oC. Chemical
Geology 151, 169-179.
Giesekke, E. W. and Harris, P. J., 1994. The role of polyoxyethylene alkyl ethers in
apatite flotation at Foskor, Phalaborawa (South Africa). Minerals Engineering
7, 1345-1361.
Granizo, N. and Missana, T., 2006. Mechanisms of cesium sorption onto magnetite.
Radiochimica Acta 94, 671-677.
Gregg, S. J. and Sing, K. S. W., 1982. Adsorption, Surface Area and Porosity. 2nd
Edition. Academic Press Inc., London.
Grossin, D., Rollin-Martinet, S., Estournès, C., Rossignol, F., Champion, E., Combes,
C., Rey, C., Geoffroy, C., and Drouet, C., 2010. Biomimetic apatite sintered at
very low temperature by spark plasma sintering: Physico-chemistry and
microstructure aspects. Acta Biomaterialia 6, 577-585.
Gustafsson, Å., Molera, M., and Puigdomenech, I., 2004. Study of Ni(II) sorption on
chlorite - a fracture filling mineral in granites. Materials Research Society
Symposium Proceedings 824, art no CC7.3, 373-378.
Hamer, M., Graham, R. C., Amrhein, C., and Bozhilov, K. N., 2003. Dissolution of
Ripidolite (Mg, Fe-Chlorite) in Organic and Inorganic Acid Solutions. Soil
Science Society of America Journal 67, 654-661.
Hamilton, W. R., Wooley, A. R., and Bishop, A. C., 1974. Minerals, Rocks and
fossils. Reed international Books Limited.
Harkins, W. D. and Jura, G., 1944. Surfaces of Solids. XIII. A Vapor Adsorption
Method for the Determination of the Area of a Solid without the Assumption
of a Molecular Area, and the Areas Occupied by Nitrogen and Other
Molecules on the Surface of a Solid. journal of the American Chemical Society
66, 1366-1373.
Harouiya, N., Chaïrat, C., Köhler, S. J., Gout, R., and Oelkers, E. H., 2007. The
dissolution kinetics and apparent solubility of natural apatite in closed reactors
at temperatures from 5 to 50oC and pH from 1 to 6. Chemical Geology 244.
Hodson, M. E., 1999. Micropore surface area variation with grain size in unweathered
alkali feldspars: Implications for surface roughness and dissolution studies.
Geochimica Et Cosmochimica Acta 62, 3429-3435.
Hodson, M. E., 2006a. Does reactive surface area depend on grain size? Results from
pH3, 25oC far-from-equilibrium flow-through dissolution experiments on
anorthite and biotite. Geochimica Et Cosmochimica Acta 70, 1655-1667.
Hodson, M. E., 2006b. Searching for the perfect surface area normalizing term - a
comparison of BET surface area-, geometric surface area- and mass-
normalized dissolution rates of anorthite and biotite. Journal of Geochemical
Exploration 88, 288-291.
Hodson, M. E., Langan, S. J., and Meriau, S., 1998. Determination of mineral surface
area in relation to the calculation of weathering rates. Geoderma 83, 35-54.
Hodson, M. E., Lee, M. R., and Parsons, I., 1997. Origins of the surface roughness of
unweathered alkali feldspar grains. Geochimica Et Cosmochimica Acta 61,
3885-3896.
Holdren, G. R. J. and Speyer, P. M., 1985. pH dependent changes in the rates and
stoichiometry of dissolution of an alkali feldspar at room temperature.
American Journal of Science 285, 994-1026.
Holdren, G. R. J. and Speyer, P. M., 1987. Reaction rate-surface area relationships
during the early stages of weathering. II. Data on eight additional feldspars.
Geochimica Et Cosmochimica Acta 51, 2311-2318.
63
Hopf, J., Langenhorst, F., Pollok, K., Merten, D., and Kothe, E., 2009. Influence of
microorganisms on biotite dissolution: An experimental approach. Chemie der
Erde 69, 45-56.
IAEA, 2010a. Country Nuclear Power Profile - 2010 Edition. In: IAEA (Ed.), Vienna,
Austria.
IAEA, 2010b. Nuclear Technology Review 2010. In: IAEA (Ed.). IAEA, Vienna,
Austria.
Kalinowski, B. E., Liermann, L. J., Brantley, S. L., Barnes, A., and Pantano, C. G.,
2000 X-ray photoelectron evidence for bacteria-enhanced dissolution of
hornblende. Geochimica Et Cosmochimica Acta 64, 1331-1343.
Krawczyk-Bärsch, E., Arnold, T., Reuther, H., Brandt, F., Bosbach, D., and Bernhard,
G., 2004. Formation of secondary Fe-oxyhydroxide phases during the
dissolution of chlorite - effects on uranium sorption. Applied Geochemistry 19,
1403-1412.
Lee, S. Y., Baik, M. H., Lee, Y. J., and Lee, Y. B., 2009. Adsorption of U(VI) ions on
biotite from aqueous solutions. Applied Clay Science 46, 255-259.
Lidskog, R. and Andersson, A.-C., 2002. The management of radioactive waste. A
description of ten countries. In: Co, S. N. F. a. W. M. (Ed.), Stockholm,
Sweden.
Lowell, S., Shields, J., Charalambous, G., and Manzione, J., 1981. Adsorbate cross-
sectional area as a function of the BET C constant. Journal of Colloid and
Interface Science 86, 191-195.
Lowson, R. T., Comarmond, M.-C. J., Rajaratnam, G., and Brown, P. L., 2005. The
kinetics of the dissolution of chlorite as a function of pH and at 25oC.
Geochimica Et Cosmochimica Acta 69, 1687-1699.
Malmstrom, M. E. and Banwart, S. A., 1997. Biotite dissolution at 25oC: The pH
dependence of dissolution rate and stoichiometry. Geochimica Et
Cosmochimica Acta 61, 2779-2799.
Malmström, M., Banwart, S., Lewenhagen, J., Duro, L., and Bruno, J., 1996. The
dissolution of biotite and chlorite at 25°C in the near-neutral pH region.
Journal of Contaminant Hydrology 21, 201-213.
Marmier, N., Delisee, A., and Fromage, F., 1999. Surface complexation modeling of
Yb(III), Ni(II), and Cs(I) sorption on magnetite. Journal of Colloid and
Interface Science 211, 54-60.
Masmoudi, S., Larbot, A., El Feki, H., and Ben Amar, R., 2006. Elaboration and
properties of new ceramic microfiltration membranes from natural and
synthetised apatite. Desalination 190, 89-103.
Nesse, W. D., 2000. Introduction to Mineralogy. Oxford University Press, New York.
Regenspurg, S. and Malmstrom, M. E., 2009. Experimental quantification of
contaminant (im)mobilization kinetics - Uranyl sorption/desorption from iron
oxides. In prep.
Rothenberg, S. J., Flynn, D. K., Eidson, A. F., Mewhinney, J. A., and Newton, G. J.,
1987. Determination of specific surface area by krypton adsorption,
comparison of three different methods of determining surface area, and
evaluation of different specific surface area standards. Journal of Colloid and
Interface Science 116, 541-554.
Rovira, M., De Pablo, J., Casas, I., Giménez, J., and Clarens, F., 2004. Sorption of
Cesium on commercial magnetite with low silica content: Experimental and
modeling. Materials Research Society Symposium Proceedings 807, 677-682.
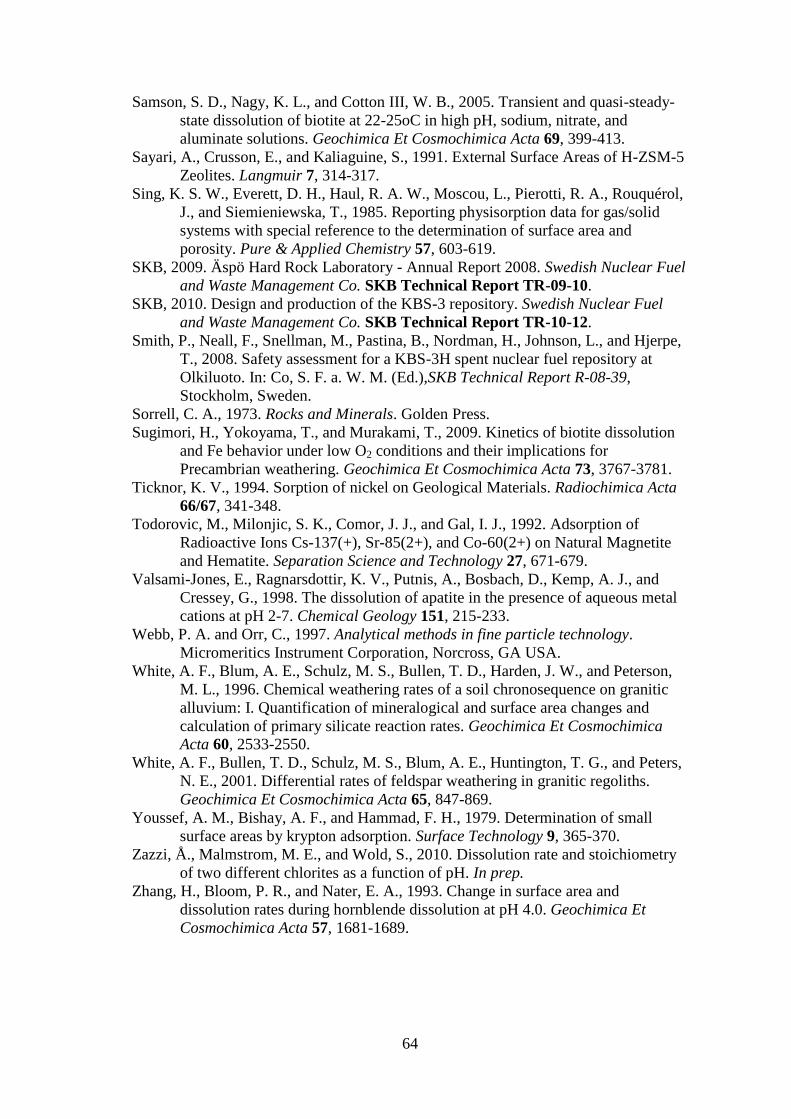
64
Samson, S. D., Nagy, K. L., and Cotton III, W. B., 2005. Transient and quasi-steady-
state dissolution of biotite at 22-25oC in high pH, sodium, nitrate, and
aluminate solutions. Geochimica Et Cosmochimica Acta 69, 399-413.
Sayari, A., Crusson, E., and Kaliaguine, S., 1991. External Surface Areas of H-ZSM-5
Zeolites. Langmuir 7, 314-317.
Sing, K. S. W., Everett, D. H., Haul, R. A. W., Moscou, L., Pierotti, R. A., Rouquérol,
J., and Siemieniewska, T., 1985. Reporting physisorption data for gas/solid
systems with special reference to the determination of surface area and
porosity. Pure & Applied Chemistry 57, 603-619.
SKB, 2009. Äspö Hard Rock Laboratory - Annual Report 2008. Swedish Nuclear Fuel
and Waste Management Co. SKB Technical Report TR-09-10.
SKB, 2010. Design and production of the KBS-3 repository. Swedish Nuclear Fuel
and Waste Management Co. SKB Technical Report TR-10-12.
Smith, P., Neall, F., Snellman, M., Pastina, B., Nordman, H., Johnson, L., and Hjerpe,
T., 2008. Safety assessment for a KBS-3H spent nuclear fuel repository at
Olkiluoto. In: Co, S. F. a. W. M. (Ed.),SKB Technical Report R-08-39,
Stockholm, Sweden.
Sorrell, C. A., 1973. Rocks and Minerals. Golden Press.
Sugimori, H., Yokoyama, T., and Murakami, T., 2009. Kinetics of biotite dissolution
and Fe behavior under low O2 conditions and their implications for
Precambrian weathering. Geochimica Et Cosmochimica Acta 73, 3767-3781.
Ticknor, K. V., 1994. Sorption of nickel on Geological Materials. Radiochimica Acta
66/67, 341-348.
Todorovic, M., Milonjic, S. K., Comor, J. J., and Gal, I. J., 1992. Adsorption of
Radioactive Ions Cs-137(+), Sr-85(2+), and Co-60(2+) on Natural Magnetite
and Hematite. Separation Science and Technology 27, 671-679.
Valsami-Jones, E., Ragnarsdottir, K. V., Putnis, A., Bosbach, D., Kemp, A. J., and
Cressey, G., 1998. The dissolution of apatite in the presence of aqueous metal
cations at pH 2-7. Chemical Geology 151, 215-233.
Webb, P. A. and Orr, C., 1997. Analytical methods in fine particle technology.
Micromeritics Instrument Corporation, Norcross, GA USA.
White, A. F., Blum, A. E., Schulz, M. S., Bullen, T. D., Harden, J. W., and Peterson,
M. L., 1996. Chemical weathering rates of a soil chronosequence on granitic
alluvium: I. Quantification of mineralogical and surface area changes and
calculation of primary silicate reaction rates. Geochimica Et Cosmochimica
Acta 60, 2533-2550.
White, A. F., Bullen, T. D., Schulz, M. S., Blum, A. E., Huntington, T. G., and Peters,
N. E., 2001. Differential rates of feldspar weathering in granitic regoliths.
Geochimica Et Cosmochimica Acta 65, 847-869.
Youssef, A. M., Bishay, A. F., and Hammad, F. H., 1979. Determination of small
surface areas by krypton adsorption. Surface Technology 9, 365-370.
Zazzi, Å., Malmstrom, M. E., and Wold, S., 2010. Dissolution rate and stoichiometry
of two different chlorites as a function of pH. In prep.
Zhang, H., Bloom, P. R., and Nater, E. A., 1993. Change in surface area and
dissolution rates during hornblende dissolution at pH 4.0. Geochimica Et
Cosmochimica Acta 57, 1681-1689.
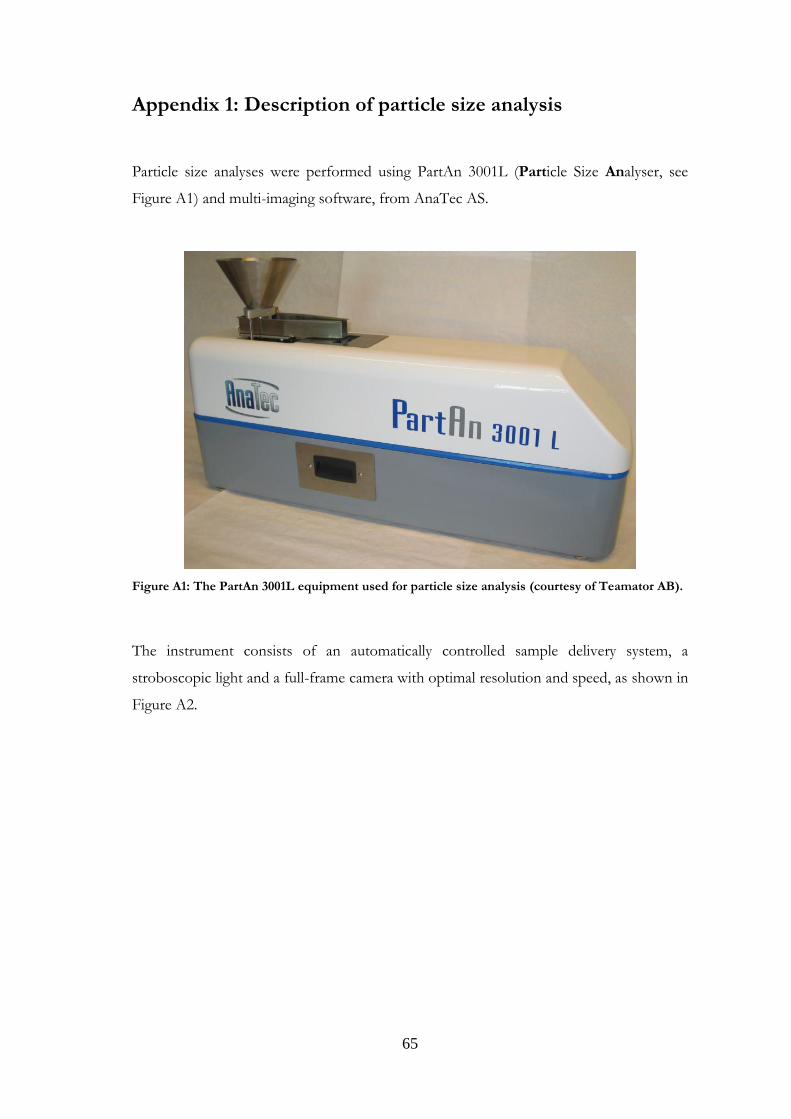
65
Appendix 1: Description of particle size analysis
Particle size analyses were performed using PartAn 3001L (Particle Size Analyser, see
Figure A1) and multi-imaging software, from AnaTec AS.
Figure A1: The PartAn 3001L equipment used for particle size analysis (courtesy of Teamator AB).
The instrument consists of an automatically controlled sample delivery system, a
stroboscopic light and a full-frame camera with optimal resolution and speed, as shown in
Figure A2.
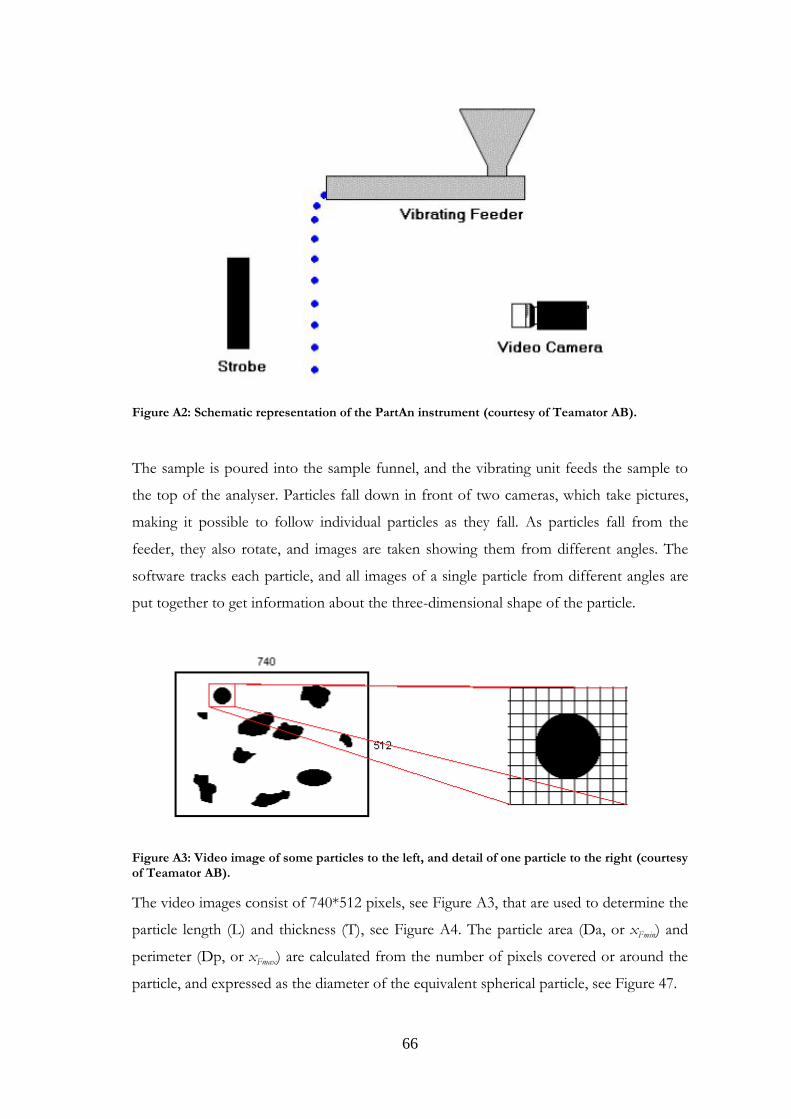
66
Figure A2: Schematic representation of the PartAn instrument (courtesy of Teamator AB).
The sample is poured into the sample funnel, and the vibrating unit feeds the sample to
the top of the analyser. Particles fall down in front of two cameras, which take pictures,
making it possible to follow individual particles as they fall. As particles fall from the
feeder, they also rotate, and images are taken showing them from different angles. The
software tracks each particle, and all images of a single particle from different angles are
put together to get information about the three-dimensional shape of the particle.
Figure A3: Video image of some particles to the left, and detail of one particle to the right (courtesy of Teamator AB).
The video images consist of 740*512 pixels, see Figure A3, that are used to determine the
particle length (L) and thickness (T), see Figure A4. The particle area (Da, or xFmin) and
perimeter (Dp, or xFmax) are calculated from the number of pixels covered or around the
particle, and expressed as the diameter of the equivalent spherical particle, see Figure 47.
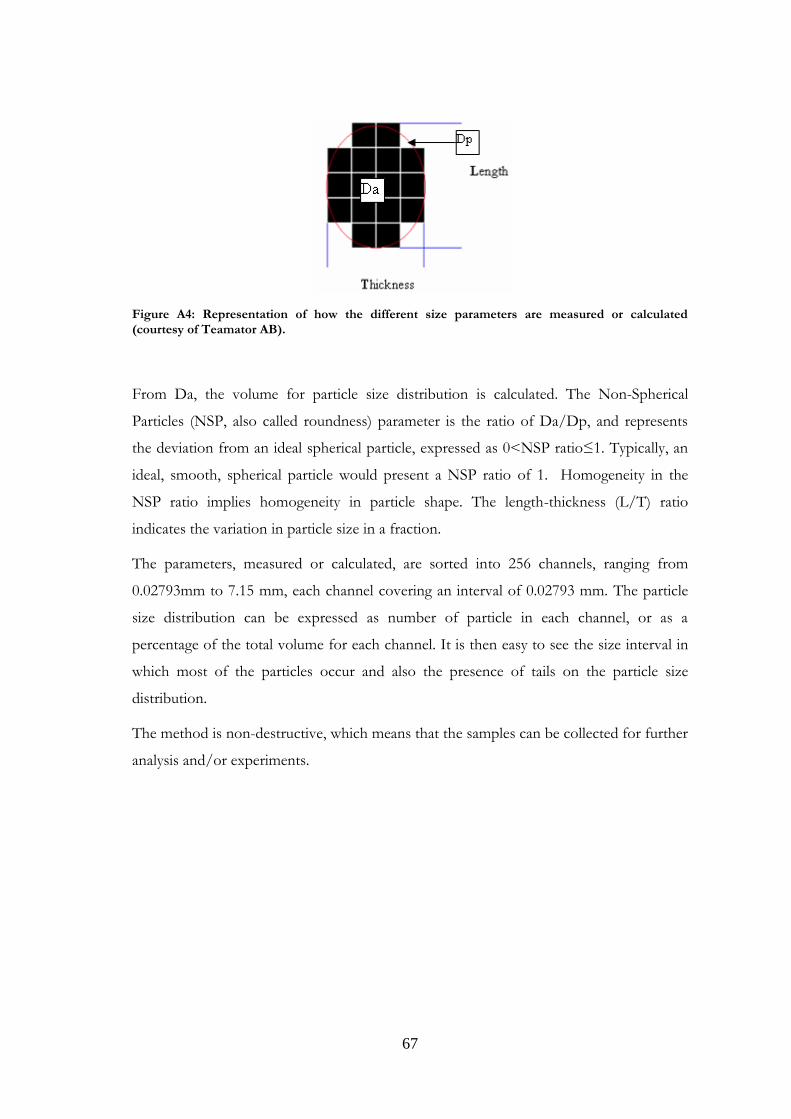
67
Figure A4: Representation of how the different size parameters are measured or calculated
(courtesy of Teamator AB).
From Da, the volume for particle size distribution is calculated. The Non-Spherical
Particles (NSP, also called roundness) parameter is the ratio of Da/Dp, and represents
the deviation from an ideal spherical particle, expressed as 0<NSP ratio≤1. Typically, an
ideal, smooth, spherical particle would present a NSP ratio of 1. Homogeneity in the
NSP ratio implies homogeneity in particle shape. The length-thickness (L/T) ratio
indicates the variation in particle size in a fraction.
The parameters, measured or calculated, are sorted into 256 channels, ranging from
0.02793mm to 7.15 mm, each channel covering an interval of 0.02793 mm. The particle
size distribution can be expressed as number of particle in each channel, or as a
percentage of the total volume for each channel. It is then easy to see the size interval in
which most of the particles occur and also the presence of tails on the particle size
distribution.
The method is non-destructive, which means that the samples can be collected for further
analysis and/or experiments.