
KSU Agriculture Today Radio Notes - AgManager.info · KSU Agriculture Today Radio Notes ......
21
1| Page KSU Agriculture Today Radio Notes Daniel O’Brien, Extension Agricultural Economist, Kansas State University For Radio Program to be aired 10:00-10:15 a.m., Friday, November 17, 2017 I. Grain Futures Closes, Changes & Carry on Thursday, November 16, 2017 Corn Futures Soybean Futures Kansas HRW Wheat Futures Month Close Change Carry /mo Month Close Change Carry /mo Month Close Change Carry /mo Dec 17 $3.36 ½ $0.0175 --- Jan 18 $ 9.72 $0.0425 --- Dec 17 $4.17 $0.0075 --- Mar 18 $3.49 $0.02 $0.04 167 Mar 18 $ 9.83 ¼ $0.04 $0.05 625 Mar 18 $4.34 ½ $0.0075 $0.05 83 May 18 $3.57 ½ $0.0175 $0.04 25 May 18 $ 9.92 ¾ $0.04 $0.04 75 May 18 $4.47 ¼ $0.0075 $0.06 375 July 18 $3.65 ½ $0.0175 $0.04 July 18 $10.01 ½ $0.0350 $0.04 375 July 18 $4.65 $0.0025 $0.08 875 Sept 18 $3.72 ½ $0.0175 $0.03 50 Aug 18 $10.03 $0.04 $0.01 50 Sept 18 $4.82 ¼ $0.0025 $0.08 625 Dec 18 $3.81 ½ $0.0150 $0.03 Sept 18 $ 9.93 ¼ $0.0350 No Carry Dec 18 $5.06 ¼ No Change $0.08 Mar 19 $3.90 ¾ $0.0125 $0.03 083 Nov 18 $ 9.85 ½ $0.0225 No Carry Mar 19 $5.21 ¾ No Change $0.05 167 May 19 $3.96 ½ $0.0150 $0.02 875 Jan 19 $ 9.91 ½ $0.0225 No Carry May 19 $5.31 ½ $0.025 $0.03 25 Price Soybean$ / Price Corn$ Ratios on November 9, 2017: “Current Crop 2017/18 ” $JAN 2018 Soybeans ÷ $DEC 2017 Corn = $ 9.73 ÷ $3.36 ½ = 2.89*** “Next Crop 2018/19 ” $NOV 2018 Soybeans ÷ $DEC 2018 Corn = $ 9.85 ½ ÷ $3.81 ½ = 2.58
Transcript of KSU Agriculture Today Radio Notes - AgManager.info · KSU Agriculture Today Radio Notes ......

1 | P a g e
KSU Agriculture Today Radio Notes
Daniel O’Brien, Extension Agricultural Economist, Kansas State University
For Radio Program to be aired 10:00-10:15 a.m., Friday, November 17, 2017
I. Grain Futures Closes, Changes & Carry on Thursday, November 16, 2017
Corn Futures Soybean Futures Kansas HRW Wheat Futures
Month Close Change Carry /mo Month Close Change Carry /mo Month Close Change Carry /mo
Dec 17 $3.36 ½ $0.0175 --- Jan 18 $ 9.72 $0.0425 --- Dec 17 $4.17 $0.0075 ---
Mar 18 $3.49 $0.02 $0.04167 Mar 18 $ 9.83 ¼ $0.04 $0.05625 Mar 18 $4.34 ½ $0.0075 $0.0583
May 18 $3.57 ½ $0.0175 $0.0425 May 18 $ 9.92 ¾ $0.04 $0.0475 May 18 $4.47 ¼ $0.0075 $0.06375
July 18 $3.65 ½ $0.0175 $0.04 July 18 $10.01 ½ $0.0350 $0.04375 July 18 $4.65 $0.0025 $0.08875
Sept 18 $3.72 ½ $0.0175 $0.0350 Aug 18 $10.03 $0.04 $0.0150 Sept 18 $4.82 ¼ $0.0025 $0.08625
Dec 18 $3.81 ½ $0.0150 $0.03 Sept 18 $ 9.93 ¼ $0.0350 No Carry Dec 18 $5.06 ¼ No Change $0.08
Mar 19 $3.90 ¾ $0.0125 $0.03083 Nov 18 $ 9.85 ½ $0.0225 No Carry Mar 19 $5.21 ¾ No Change $0.05167
May 19 $3.96 ½ $0.0150 $0.02875 Jan 19 $ 9.91 ½ $0.0225 No Carry May 19 $5.31 ½ $0.025 $0.0325
PriceSoybean$ / PriceCorn$ Ratios on November 9, 2017:
“Current Crop2017/18” $JAN2018 Soybeans ÷ $DEC2017 Corn = $ 9.73 ÷ $3.36 ½ = 2.89***
“Next Crop2018/19” $NOV2018 Soybeans ÷ $DEC2018 Corn = $ 9.85 ½ ÷ $3.81 ½ = 2.58
2 | P a g e

3 | P a g e

4 | P a g e
5 | P a g e
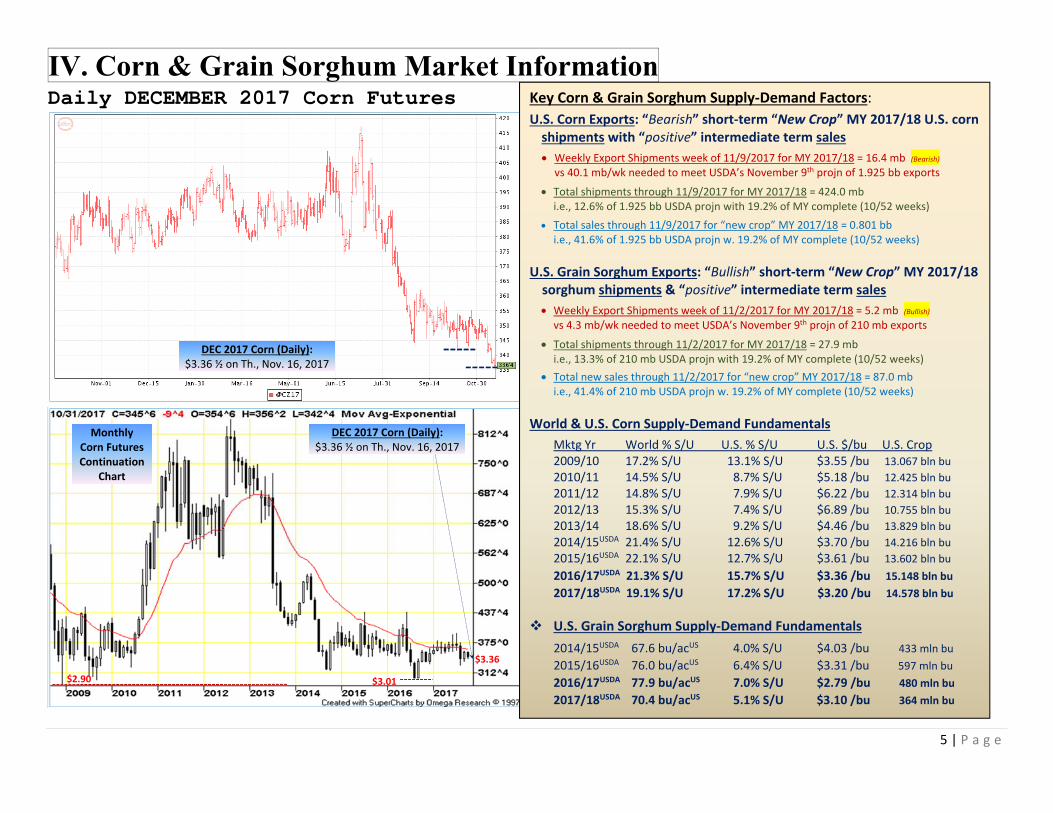
IV. Corn & Grain Sorghum Market Information Daily DECEMBER 2017 Corn Futures
Key Corn & Grain Sorghum Supply‐Demand Factors: U.S. Corn Exports: “Bearish” short‐term “New Crop” MY 2017/18 U.S. corn shipments with “positive” intermediate term sales Weekly Export Shipments week of 11/9/2017 for MY 2017/18 = 16.4 mb (Bearish)
vs 40.1 mb/wk needed to meet USDA’s November 9th projn of 1.925 bb exports
Total shipments through 11/9/2017 for MY 2017/18 = 424.0 mb i.e., 12.6% of 1.925 bb USDA projn with 19.2% of MY complete (10/52 weeks)
Total sales through 11/9/2017 for “new crop” MY 2017/18 = 0.801 bb i.e., 41.6% of 1.925 bb USDA projn w. 19.2% of MY complete (10/52 weeks)
U.S. Grain Sorghum Exports: “Bullish” short‐term “New Crop” MY 2017/18 sorghum shipments & “positive” intermediate term sales Weekly Export Shipments week of 11/2/2017 for MY 2017/18 = 5.2 mb (Bullish)
vs 4.3 mb/wk needed to meet USDA’s November 9th projn of 210 mb exports
Total shipments through 11/2/2017 for MY 2017/18 = 27.9 mb i.e., 13.3% of 210 mb USDA projn with 19.2% of MY complete (10/52 weeks)
Total new sales through 11/2/2017 for “new crop” MY 2017/18 = 87.0 mb i.e., 41.4% of 210 mb USDA projn w. 19.2% of MY complete (10/52 weeks)
World & U.S. Corn Supply‐Demand Fundamentals Mktg Yr World % S/U U.S. % S/U U.S. $/bu U.S. Crop 2009/10 17.2% S/U 13.1% S/U $3.55 /bu 13.067 bln bu 2010/11 14.5% S/U 8.7% S/U $5.18 /bu 12.425 bln bu 2011/12 14.8% S/U 7.9% S/U $6.22 /bu 12.314 bln bu 2012/13 15.3% S/U 7.4% S/U $6.89 /bu 10.755 bln bu 2013/14 18.6% S/U 9.2% S/U $4.46 /bu 13.829 bln bu 2014/15USDA 21.4% S/U 12.6% S/U $3.70 /bu 14.216 bln bu 2015/16USDA 22.1% S/U 12.7% S/U $3.61 /bu 13.602 bln bu
2016/17USDA 21.3% S/U 15.7% S/U $3.36 /bu 15.148 bln bu 2017/18USDA 19.1% S/U 17.2% S/U $3.20 /bu 14.578 bln bu
U.S. Grain Sorghum Supply‐Demand Fundamentals 2014/15USDA 67.6 bu/acUS 4.0% S/U $4.03 /bu 433 mln bu
2015/16USDA 76.0 bu/acUS 6.4% S/U $3.31 /bu 597 mln bu
2016/17USDA 77.9 bu/acUS 7.0% S/U $2.79 /bu 480 mln bu 2017/18USDA 70.4 bu/acUS 5.1% S/U $3.10 /bu 364 mln bu
DEC 2017 Corn (Daily): $3.36 ½ on Th., Nov. 16, 2017
Monthly Corn Futures Continuation
Chart
$3.36
$2.90
DEC 2017 Corn (Daily): $3.36 ½ on Th., Nov. 16, 2017
$3.01

6 | P a g e

7 | P a g e

8 | P a g e

9 | P a g e
10 | P a g e
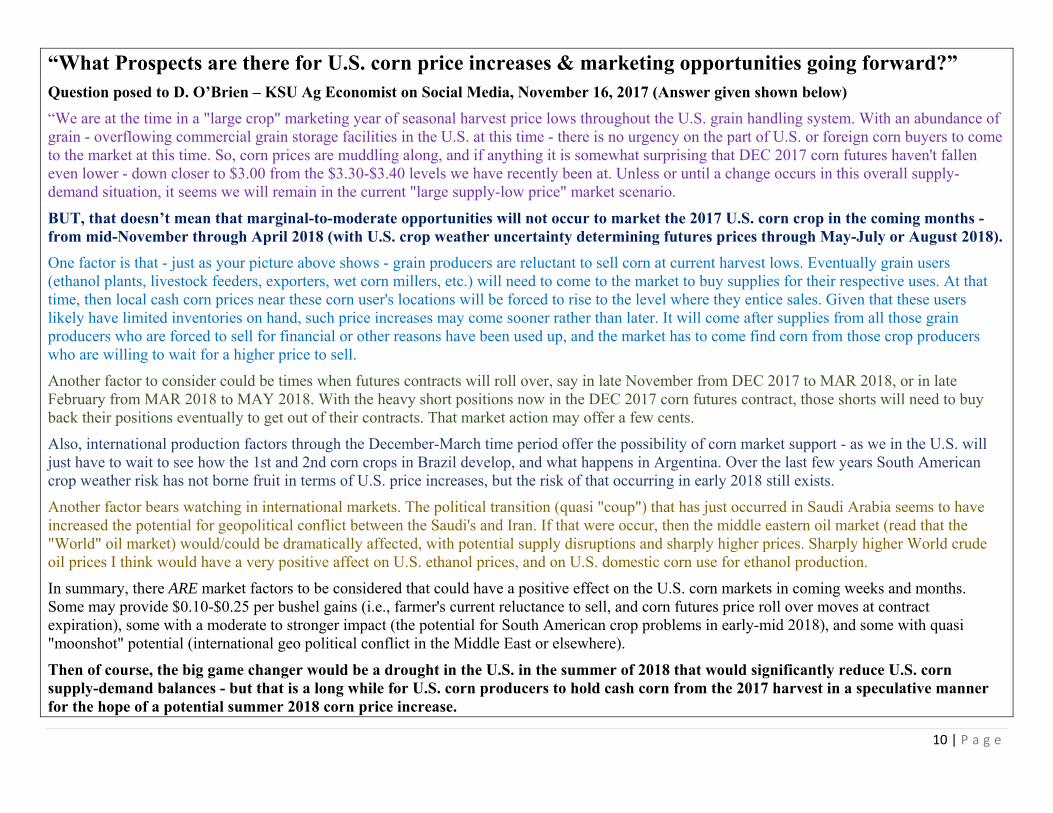
“What Prospects are there for U.S. corn price increases & marketing opportunities going forward?” Question posed to D. O’Brien – KSU Ag Economist on Social Media, November 16, 2017 (Answer given shown below)
“We are at the time in a "large crop" marketing year of seasonal harvest price lows throughout the U.S. grain handling system. With an abundance of grain - overflowing commercial grain storage facilities in the U.S. at this time - there is no urgency on the part of U.S. or foreign corn buyers to come to the market at this time. So, corn prices are muddling along, and if anything it is somewhat surprising that DEC 2017 corn futures haven't fallen even lower - down closer to $3.00 from the $3.30-$3.40 levels we have recently been at. Unless or until a change occurs in this overall supply-demand situation, it seems we will remain in the current "large supply-low price" market scenario.
BUT, that doesn’t mean that marginal-to-moderate opportunities will not occur to market the 2017 U.S. corn crop in the coming months - from mid-November through April 2018 (with U.S. crop weather uncertainty determining futures prices through May-July or August 2018).
One factor is that - just as your picture above shows - grain producers are reluctant to sell corn at current harvest lows. Eventually grain users (ethanol plants, livestock feeders, exporters, wet corn millers, etc.) will need to come to the market to buy supplies for their respective uses. At that time, then local cash corn prices near these corn user's locations will be forced to rise to the level where they entice sales. Given that these users likely have limited inventories on hand, such price increases may come sooner rather than later. It will come after supplies from all those grain producers who are forced to sell for financial or other reasons have been used up, and the market has to come find corn from those crop producers who are willing to wait for a higher price to sell.
Another factor to consider could be times when futures contracts will roll over, say in late November from DEC 2017 to MAR 2018, or in late February from MAR 2018 to MAY 2018. With the heavy short positions now in the DEC 2017 corn futures contract, those shorts will need to buy back their positions eventually to get out of their contracts. That market action may offer a few cents.
Also, international production factors through the December-March time period offer the possibility of corn market support - as we in the U.S. will just have to wait to see how the 1st and 2nd corn crops in Brazil develop, and what happens in Argentina. Over the last few years South American crop weather risk has not borne fruit in terms of U.S. price increases, but the risk of that occurring in early 2018 still exists.
Another factor bears watching in international markets. The political transition (quasi "coup") that has just occurred in Saudi Arabia seems to have increased the potential for geopolitical conflict between the Saudi's and Iran. If that were occur, then the middle eastern oil market (read that the "World" oil market) would/could be dramatically affected, with potential supply disruptions and sharply higher prices. Sharply higher World crude oil prices I think would have a very positive affect on U.S. ethanol prices, and on U.S. domestic corn use for ethanol production.
In summary, there ARE market factors to be considered that could have a positive effect on the U.S. corn markets in coming weeks and months. Some may provide $0.10-$0.25 per bushel gains (i.e., farmer's current reluctance to sell, and corn futures price roll over moves at contract expiration), some with a moderate to stronger impact (the potential for South American crop problems in early-mid 2018), and some with quasi "moonshot" potential (international geo political conflict in the Middle East or elsewhere).
Then of course, the big game changer would be a drought in the U.S. in the summer of 2018 that would significantly reduce U.S. corn supply-demand balances - but that is a long while for U.S. corn producers to hold cash corn from the 2017 harvest in a speculative manner for the hope of a potential summer 2018 corn price increase.

11 | P a g e
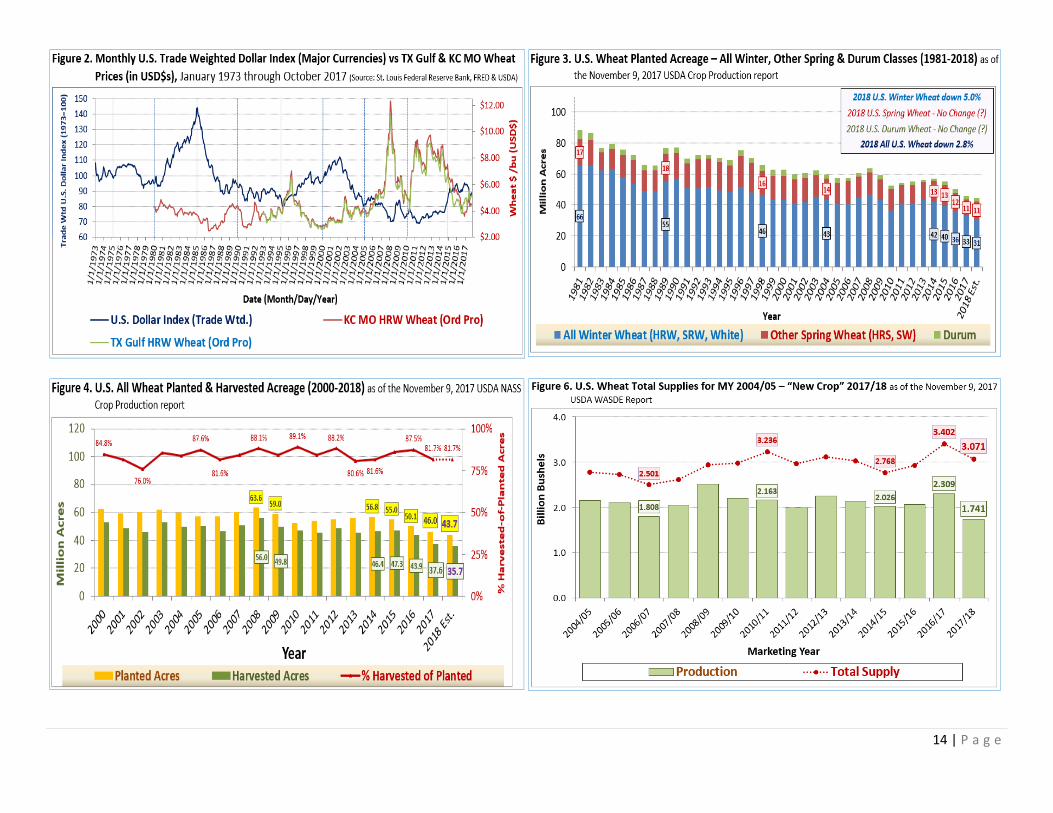
V. Wheat Market Outlook Daily DEC 2017 KS HRW Wheat Futures
Monthly Kansas HRW Wheat eFutures
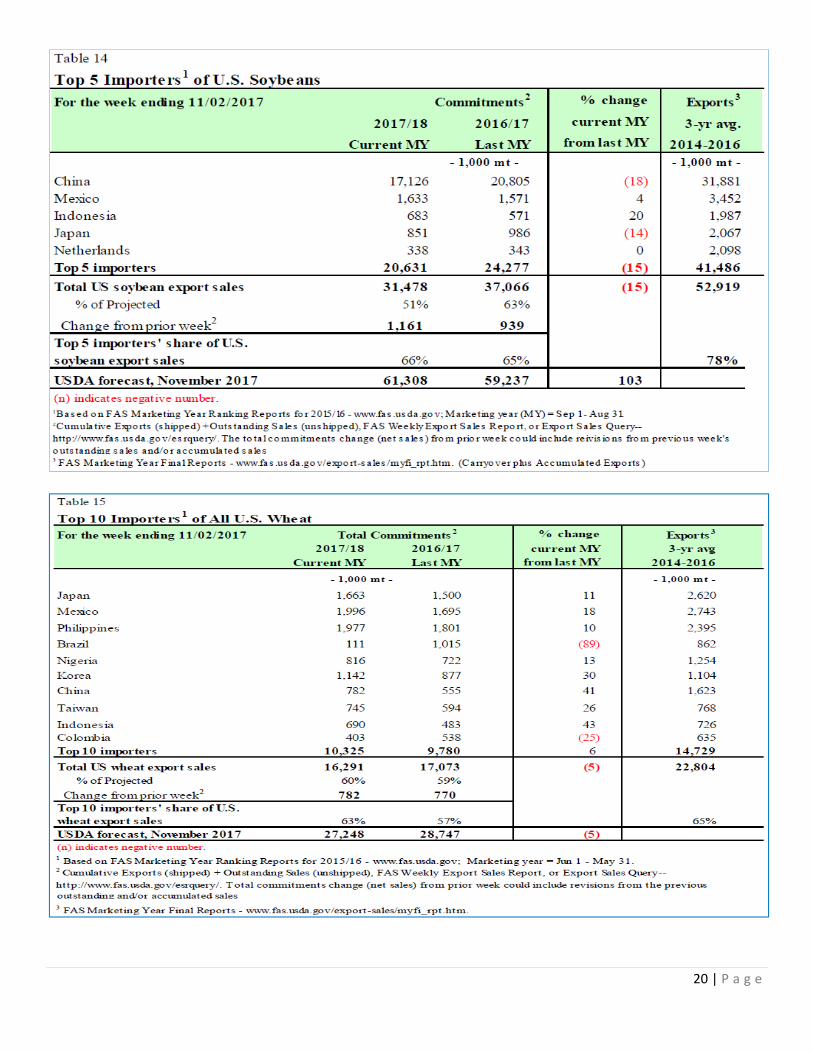
Wheat Export Situation:
U.S. All Wheat Exports: “Bearish” Short Term Export Shipments with “Neutral‐Positive” long run export prospects in “New Crop” MY 2017/18 total sales
– Weekly Export Shipments wk of 11/9/2017 for “new crop” MY 2017/18 = 10.9 mb (Bearish) vs 21.1 mb /wk needed to meet USDA’s November 9th projn of 1,000 bb exports
– Total shipments through 11/9/2017 for “new crop” MY 2017/18 = 408.3 mb i.e., 40.8% of 1,000 bb USDA projn with 46.15% of MY complete (24/52 weeks)
– Total shipments + new sales through 11/9/2017 for “new crop” MY 2017/18 = 616.6 mb i.e., 61.7% of 1,000 bb USDA projn with 46.15% of MY complete (24/52 weeks)
U.S. Hard Red Winter (HRW) Wheat Exports: “Bearish” Short Term Shipments with “Neutral” long run export prospects in “new crop” MY 2017/18 total sales
– Weekly Export Shipments wk of 11/9/2017 for “new crop” MY 2017/18 = 6.9 mb (Bearish) vs 8.9 mb /wk needed to meet USDA’s November 9th projn of 415 mb HRW wheat exports
– Total shipments through 11/9/2017 for “new crop” MY 2017/18 = 166.1 mb i.e., 40.0% of 415 mb USDA HRW wheat exports with 46.15% of MY complete (24/52 weeks)
– Total shipments + new sales 11/9/2017 for “new crop” MY 2017/18 = 239.2 mb i.e., 57.6% of 415 mb USDA HRW wheat with 46.15% of MY complete (24/52 weeks)
DEC 2017 KC Wheat (Daily) $4.17 on Th., Nov. 16, 2017
$4.17$4.71
$3.67 ¾
“Negative” World & U.S. Wheat S/D Fundamentals
Mktg Yr World % S/U World Crop U.S. % S/U U.S. $/bu U.S. Exports
2007/08 20.8% S/U 611.9 mmt 13.2% S/U $6.48 /bu 1,263 mln bu
2008/09 26.5% S/U 684.0 mmt 28.7% S/U $6.78 /bu 1,015 mln bu
2009/10 31.2% S/U 687.2 mmt 48.6% S/U $4.87 /bu 879 mln bu
2010/11 30.4% S/U 649.5 mmt 36.4% S/U $5.70 /bu 1,291 mln bu
2011/12 28.6% S/U 697.3 mmt 33.4% S/U $7.24 /bu 1,051 mln bu
2012/13 25.7% S/U 658.6 mmt 29.9% S/U $7.77 /bu 1,012 mln bu
2013/14 28.1% S/U 715.1 mmt 24.2% S/U $6.87 /bu 1,176 mln bu
2014/15 30.9% S/U 728.0 mmt 37.3% S/U $5.99 /bu 864 mln bu
2015/16USDA 33.9% S/U 735.3 mmt 50.0% S/U $4.89 /bu 778 mln bu
2016/17USDA 34.6% S/U 753.9 mmt 53.2% S/U $3.89 /bu 1,055 mln bu
2017/18USDA 36.2% S/U 752.0 mmt 43.8% S/U $4.60 /bu 1,000 mln bu
Monthly KS HRW Wheat
Futures Continuation
Chart
SEPT 2017 KC Wheat (Daily)$4.17 on Th., Nov. 16, 2017
12 | P a g e

13 | P a g e
14 | P a g e

15 | P a g e

16 | P a g e
VI. Soybean Market Outlook Daily JANUARY 2018 Soybean Futures
Monthly Soybean eFutures
Daily JAN 2018 Soybeans $9.72 on Th., Nov. 16, 2017
Key Soybean Supply‐Demand Issues:
U.S. Soybean Exports: “Positive” short run export shipments in “New Crop” MY 2017/18 and “positive” total sales Weekly Export Shipments week of 11/2/2017 for MY 2017/18 = 82.9 mb (Positive)
vs 38.7 mb/wk needed to meet USDA’s November 9th projn of 2.250 bb exports
Total shipments through 11/2/2017 for MY 2017/18 = 0.623 bb i.e., 27.7% of 2.250 bb USDA projn with 19.2% of MY complete (10/52 weeks)
Total sales through 11/2/2017 for “New Crop” MY 2017/18 = 1.197 bb i.e., 53.2% of 2.250 bb USDA projn w. 19.2% of MY complete (10/52 weeks)
U.S. Soybean Meal Exports: “Bullish” short run export shipments in “New Crop” MY 2016/17 and “neutral” total sales Export Shipments for week of 11/2/2017 for “New Crop” MY 2017/18 = 316,000 mt (Bullish)
vs 146,048 mt/wk needed to meet USDA’s November 9th projn of 11.070 mmt exports
Total shipments through 11/2/2017 for “New Crop” MY 2017/18 = 1.028.7 mmt i.e., 9.3% of 11.070 mmt USDA projn with 11.5% of MY complete (6/52 weeks)
Total shipments & new sales (11/2/2017) for “New Crop” MY 2017/18 = 4.352 mmt i.e., 39.3% of 11.070 mmt USDA projn with 11.5% of MY complete (6/52 weeks)
World & U.S. Soybean Supply‐Demand Fundamentals Mktg Yr World % S/U World Crop U.S. % S/U U.S. $/bu U.S. Exports
2009/10 25.2% S/U 260.5 mmt 4.5% S/U $ 9.59 /bu 1.499 bln bu
2010/11 27.7% S/U 264.3 mmt 6.6% S/U $11.30 /bu 1.505 bln bu
2011/12 20.3% S/U 240.6 mmt 5.4% S/U $12.50 /bu 1.365 bln bu
2012/13 21.0% S/U 268.6 mmt 4.5% S/U $14.40 /bu 1.328 bln bu
2013/14 22.4% S/U 282.5 mmt 2.7% S/U $13.00 /bu 1.638 bln bu
2014/15 25.7% S/U 319.6 mmt 4.9% S/U $10.10 /bu 1.842 bln bu
2015/16USDA 24.9% S/U 313.7 mmt 5.0% S/U $ 8.95 /bu 1.942 bln bu
2016/17USDA 29.2% S/U 351.3 mmt 7.1% S/U $ 9.47 /bu 2.174 bln bu 2017/18USDA 28.4% S/U 348.9 mmt 9.8% S/U $ 9.40 /bu 2.250 bln bu
$9.72
$8.44 ¼ $7.76 ¼
Daily NOV 2017 Soybeans $9.72 on Th., Nov. 16, 2017

17 | P a g e

18 | P a g e

19 | P a g e
20 | P a g e

21 | P a g e