
KSE: LISTED FINANCIAL SECTOR Presentation by Prof. Dr. Khawaja Amjad Saeed Founder Principal, Hailey...
16
KSE: LISTED FINANCIAL SECTOR Presentation by Prof. Dr. Khawaja Amjad Saeed Founder Principal, Hailey College of Banking & Finance, University of the Punjab, Lahore Pakistan (2003----), Member Governing Council, International Federation of Accountants (IFAC), New York (1997-2000), President, South Asian Federation of Accountants (SAFA) (1997), President, Institute of Cost and Management Accountants of Pakistan (1997-2000), President, Association of Management Development Institutions of South Asia (AMDISA) (1993-96), Pro Vice-Chancellor University of the Punjab, Lahore (1994-1996), Founder Director, Institute of Business Administration (IBA), University of the Punjab, Lahore (1973-1996). Email: [email protected] 1 Topic List Financial Sector Performance KARACHI STOCK EXCHANGE Focus Date and Value April 09, 2011, Sheraton Hotel, Karachi.
-
Upload
roderick-garrison -
Category
Documents
-
view
213 -
download
0
Transcript of KSE: LISTED FINANCIAL SECTOR Presentation by Prof. Dr. Khawaja Amjad Saeed Founder Principal, Hailey...
KSE: LISTED FINANCIAL SECTOR
Presentation byProf. Dr. Khawaja Amjad SaeedFounder Principal, Hailey College of Banking & Finance, University of the Punjab, Lahore Pakistan (2003----), Member Governing Council, International Federation of Accountants (IFAC), New York (1997-2000), President, South Asian Federation of Accountants (SAFA) (1997), President, Institute of Cost and Management Accountants of Pakistan (1997-2000), President, Association of Management Development Institutions of South Asia (AMDISA) (1993-96), Pro Vice-Chancellor University of the Punjab, Lahore (1994-1996), Founder Director, Institute of Business Administration (IBA), University of the Punjab, Lahore (1973-1996). Email: [email protected]
1
TopicList Financial Sector Performance
KARACHI STOCK EXCHANGEFocus
Date and Value
April 09, 2011, Sheraton Hotel, Karachi.

Sr. # PARTICULARS
1. KSE: Vital Facts
2. KSE: Pertinent Data
3. KSE: Market Capitalization
4.
KSE: Listed Banking Sector & Financial Services
Companies
5. KSE: Listed Banks
6. KSE: Listed Financial Services Companies
7. KSE: Listed Insurance Sector
8. KSE: Listed Life Insurance Companies
9. KSE: Listed Non-Life Insurance Companies
PRESENTATION FRAME
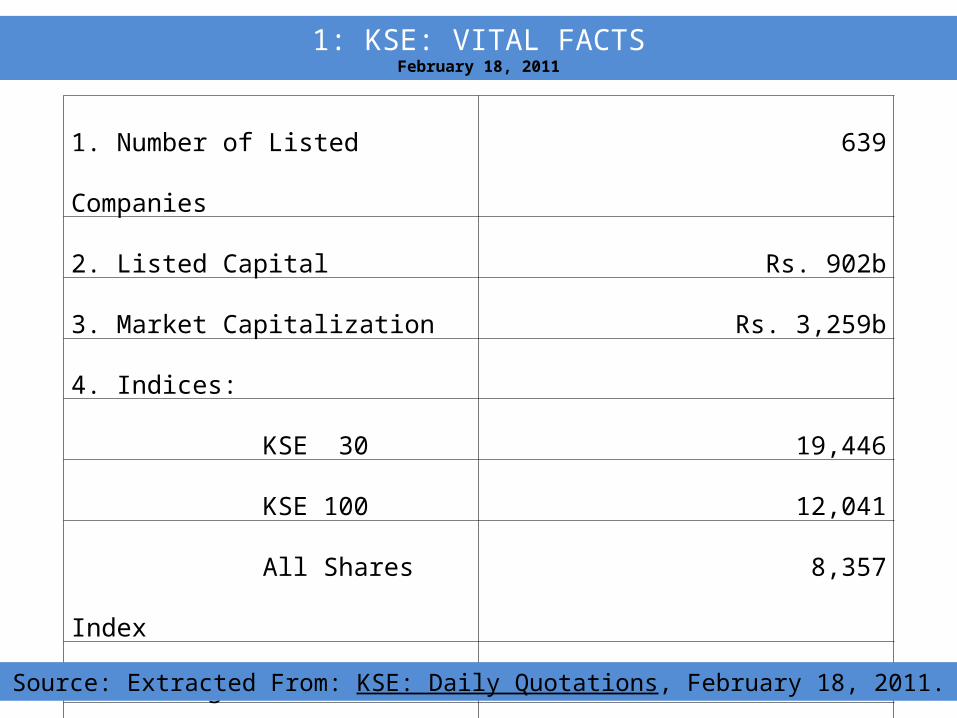
1. Number of Listed Companies 639
2. Listed Capital Rs. 902b
3. Market Capitalization Rs. 3,259b
4. Indices:
KSE 30 19,446
KSE 100 12,041
All Shares Index 8,357
5. Trading:
Volume 70m
Value Rs. 3,197m
1: KSE: VITAL FACTSFebruary 18, 2011
Source: Extracted From: KSE: Daily Quotations, February 18, 2011.
Source: Extracted From: KSE: Daily Quotations, February 18, 2011.
Month at the Close
Listed Capital Market Capitalization
KSE 100 Index
2010 Rs. b
% Rs. b % 100 Index
%
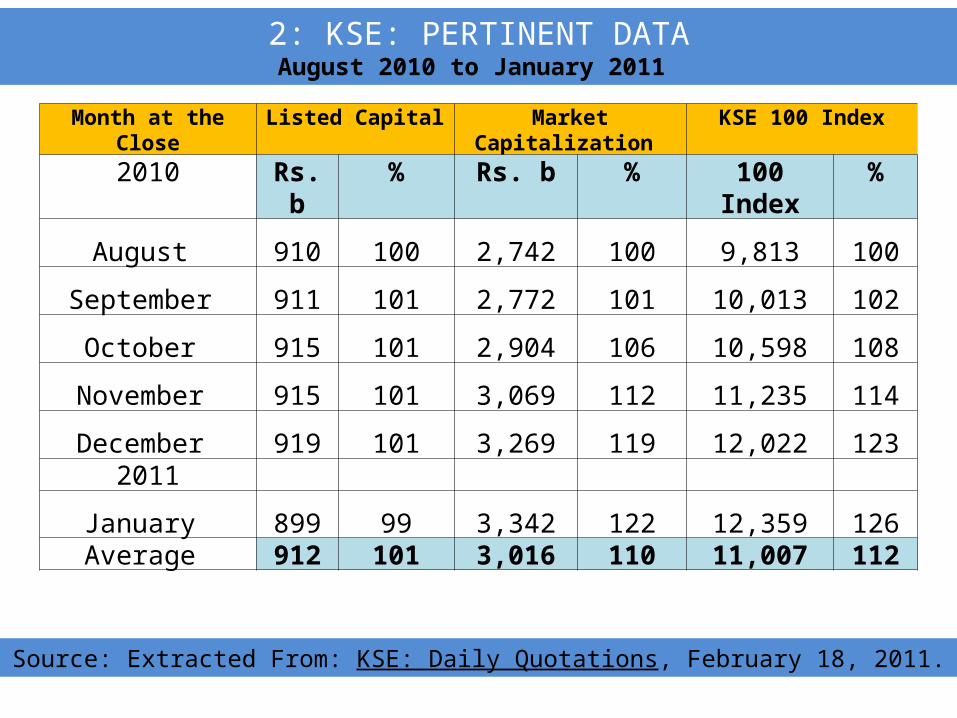
August 910 100 2,742 100 9,813 100
September 911 101 2,772 101 10,013 102
October 915 101 2,904 106 10,598 108
November 915 101 3,069 112 11,235 114
December 919 101 3,269 119 12,022 1232011
January 899 99 3,342 122 12,359 126Average 912 101 3,016 110 11,007 112
2: KSE: PERTINENT DATAAugust 2010 to January 2011

Source: Extracted From: KSE: Daily Quotations, February 18, 2011.
S. No. Segment Rs. Billion %
1. Oil Gas 1,164 36
2. Banks 680 21
3. Chemicals 355 112,199 68
4. Food Producers 286 08
5. Personal Goods 136 04
6. Electricity 108 032,729 83
7. Others 530 173,259 100
US $ (Rs. 87 = $ 1) $ 37b
3: KSE: MARKET CAPITALIZATIONFebruary 18, 2011

Source: Extracted From: KSE: Daily Quotations, February 18, 2011.
1. LISTED COMPANIES:Particulars Numbe
r%
KSE: Listed Companies 639 100Listed Banks and Financial Services Companies (25+33 = 58)
58 9.07
2. PAID UP CAPITAL: Particulars Rs. b %
Total Listed on KSE 902 100Listed Banks and Financial Services Companies (286+26 = 312)
312 34.58
3. YEAR ENDING:Particulars Numbe
r%
1. June 31 532. December 27 47
58 1004. PAR VALUE ANALYSIS:Particulars Rs. %
Par Value 10 100
4: KSE: LISTED BANKING SECTOR & FINANCIAL SERVICES COMPANIES
February 18, 2011Quantitative Analysis
Source: Extracted From: KSE: Daily Quotations, February 18, 2011.
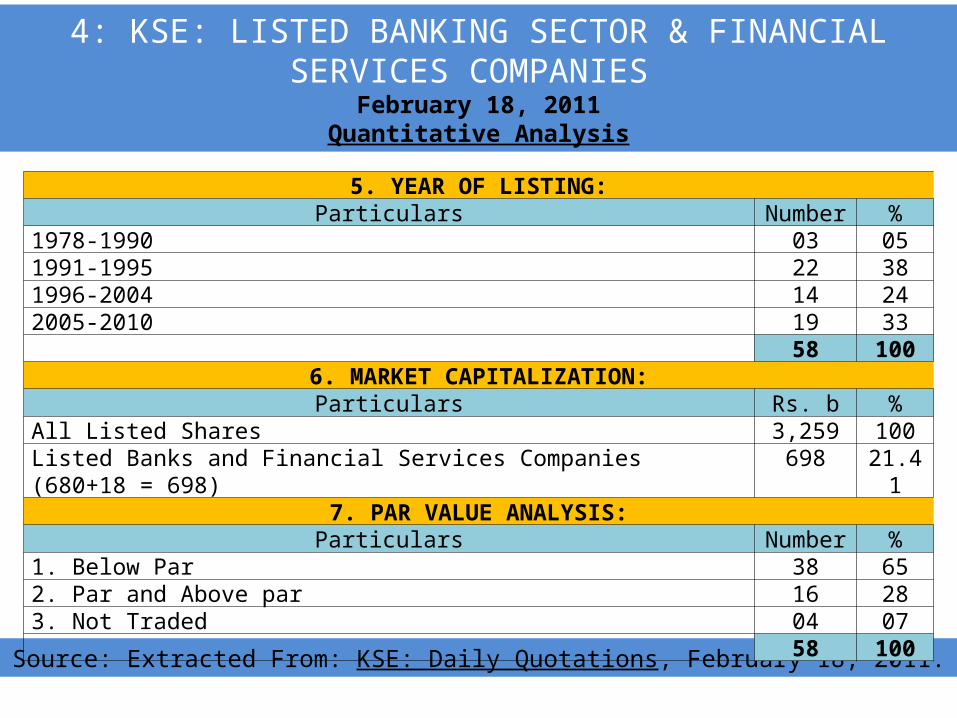
4: KSE: LISTED BANKING SECTOR & FINANCIAL SERVICES COMPANIES
February 18, 2011Quantitative Analysis
5. YEAR OF LISTING:Particulars Numbe
r%
1978-1990 03 051991-1995 22 381996-2004 14 242005-2010 19 33
58 1006. MARKET CAPITALIZATION:
Particulars Rs. b %All Listed Shares 3,259 100Listed Banks and Financial Services Companies (680+18 = 698)
698 21.41
7. PAR VALUE ANALYSIS:Particulars Numbe
r%
1. Below Par 38 652. Par and Above par 16 283. Not Traded 04 07
58 100
Source: Extracted From: KSE: Daily Quotations, February 18, 2011.
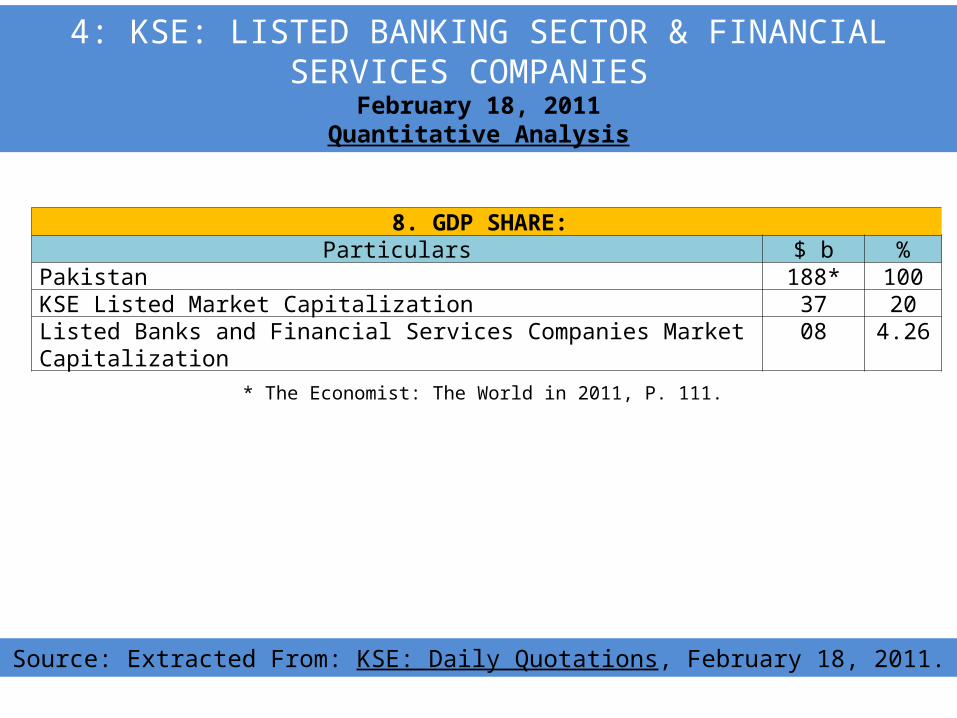
8. GDP SHARE: Particulars $ b %
Pakistan 188* 100KSE Listed Market Capitalization 37 20Listed Banks and Financial Services Companies Market Capitalization
08 4.26
4: KSE: LISTED BANKING SECTOR & FINANCIAL SERVICES COMPANIES
February 18, 2011Quantitative Analysis
* The Economist: The World in 2011, P. 111.
Source: Extracted From: KSE: Daily Quotations, February 18, 2011.
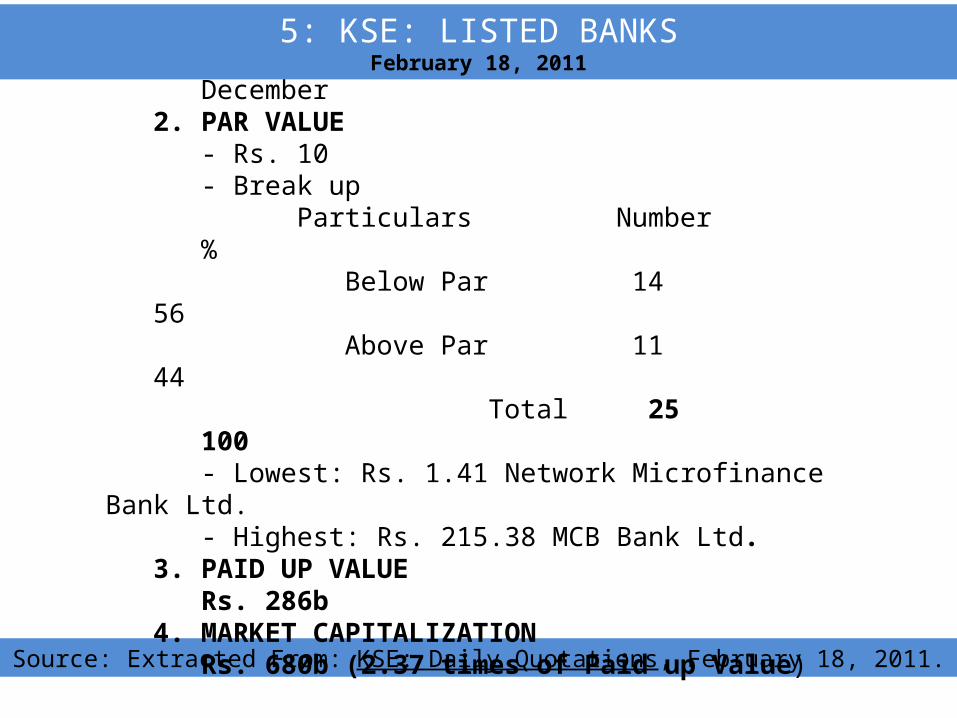
1. YEAR ENDED December
2. PAR VALUE- Rs. 10- Break up
Particulars Number %Below Par 14
56Above Par 11
44Total 25 100
- Lowest: Rs. 1.41 Network Microfinance Bank Ltd.
- Highest: Rs. 215.38 MCB Bank Ltd.3. PAID UP VALUE
Rs. 286b4. MARKET CAPITALIZATION
Rs. 680b (2.37 times of Paid up Value)
5: KSE: LISTED BANKSFebruary 18, 2011

6: KSE: LISTED FINANCIAL SERVICES COMPANIESFebruary 18, 2011
1. YEAR ENDED Month Number %June 31 94December 02 6
Total 33 1002. PAR VALUE
- Rs. 10- Break up
Particulars Number %Below par 24 72Above par 05 15Not Traded 04 13
Total 33 100- Lowest: Rs. 0.58 AMZ Venture Class A.- Highest: Rs 25.69 JS Global Capital.
3. PAID UP VALUERs. 26b
4. MARKET CAPITALIZATION Rs. 18b (0.69 times of Paid up Value)

7: KSE: LISTED INSURANCE SECTOR February 18, 2011
Quantitative Analysis
1. Listed CompaniesParticulars Numbe
r%
KSE Listed Companies 639 100Listed Insurance Companies(22 Non Life + Life 04=26) 639-26
26 4.07
2. Paid up Capital Particulars Rs.
(Billion)
%
Total Listed on KSE 902 100Listed Insurance Companies 14 1.553. Year of Ending (December)4. Par Value Analysis Particulars Rs. Numbe
r%
Paid up Value (Par Value) 10 24 9505 02 05
26 100

5. Year of Listing Year Number %1949 02 081952-1969
10 38
1980-1989
07 27
19 731990-2010
07 27
Total 26 1006. Market Capitalization Particulars Rs.
(Billion)%
All Listed Shares 3,259 100Listed Insurance Companies
50 1.53
7: KSE: LISTED INSURANCE SECTOR February 18, 2011
Quantitative Analysis
Source: Extracted From: KSE: Daily Quotations, February 18, 2011.
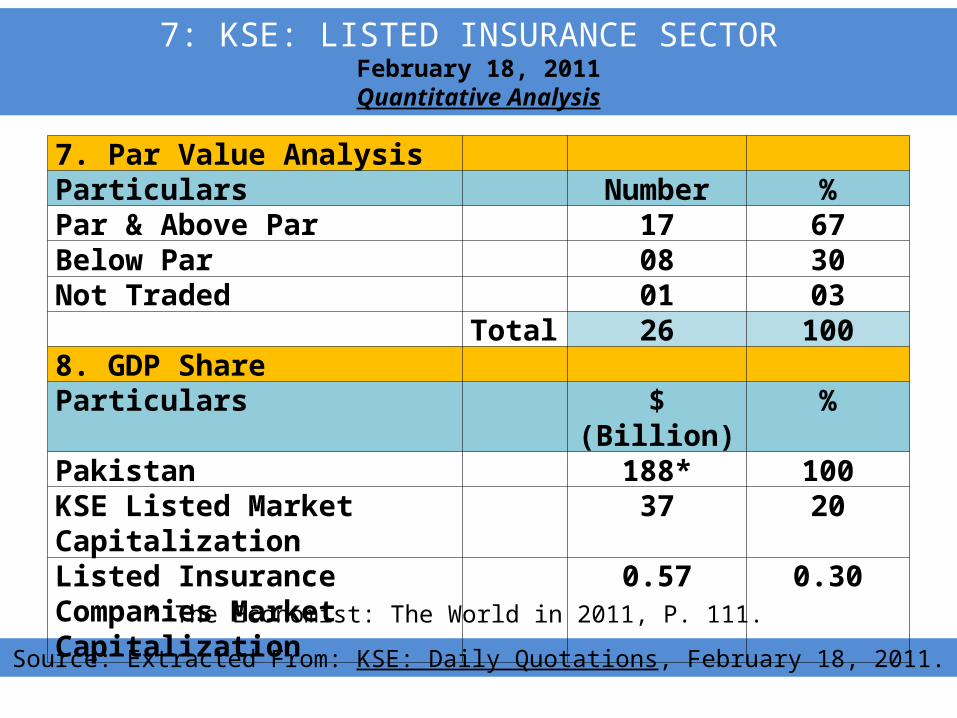
7. Par Value Analysis Particulars Number %Par & Above Par 17 67Below Par 08 30Not Traded 01 03
Total 26 1008. GDP ShareParticulars $ (Billion) %Pakistan 188* 100KSE Listed Market Capitalization
37 20
Listed Insurance Companies Market Capitalization
0.57 0.30
7: KSE: LISTED INSURANCE SECTOR February 18, 2011
Quantitative Analysis
* The Economist: The World in 2011, P. 111.
Source: Extracted From: KSE: Daily Quotations, February 18, 2011.
8: KSE: LISTED LIFE INSURANCE COMPANIES February 18, 2011
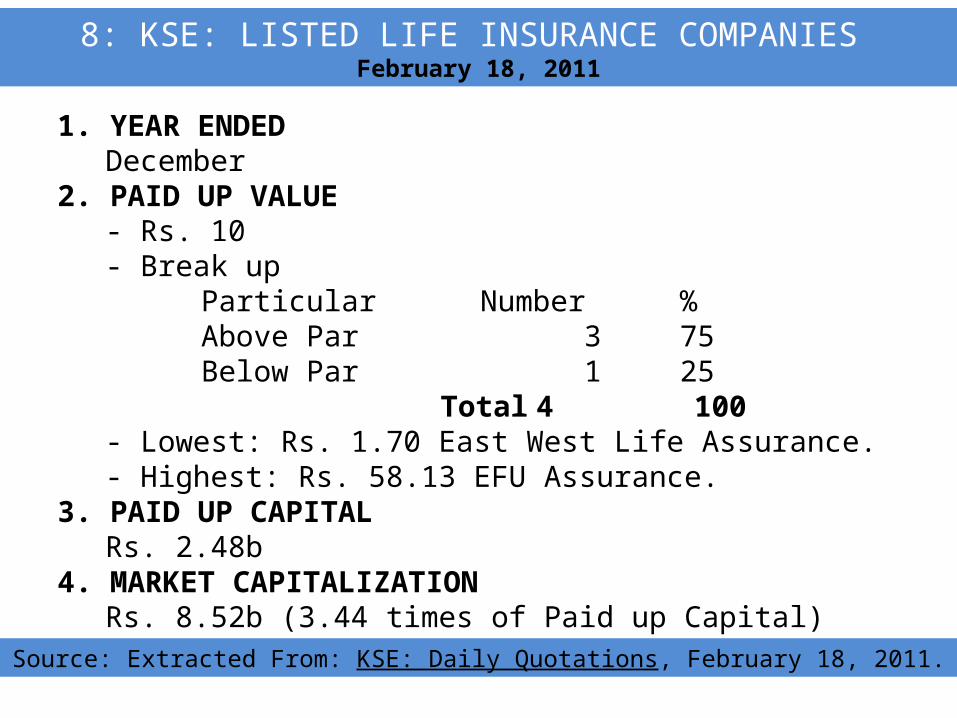
1. YEAR ENDED December
2. PAID UP VALUE- Rs. 10- Break up
Particular Number %Above Par 3 75Below Par 1 25
Total 4 100- Lowest: Rs. 1.70 East West Life Assurance.- Highest: Rs. 58.13 EFU Assurance.
3. PAID UP CAPITALRs. 2.48b
4. MARKET CAPITALIZATION Rs. 8.52b (3.44 times of Paid up Capital)

Source: Extracted From: KSE: Daily Quotations, February 18, 2011.
9: KSE: NON-LIFE INSURANCE COMPANIESFebruary 18, 2011
1. YEAR ENDED December
2. PAR VALUERs. Number %10 20 9002 10 10Total 22 100
- Break up Particulars Number %
Above Par 14 63Below Par 07 32Not Traded 01 05
Total 22 100- Lowest: Rs. 2.27 Universal Insurance.- Highest: Rs. 296.00 East West insurance.
3. PAID UP CAPITALRs. 11.77b4. MARKET CAPITALIZATION Rs. 41b (3.48 times of Paid up Capital)

16


