KSA Medical Healthcare Sector July 2013 Initiating · PDF fileKSA Medical Healthcare Sector...
24
1 © All rights reserved Please read Disclaimer on the back KSA Medical Healthcare Sector Initiating Coverage July 2013 Favorable demography & economy - Increasing demand for health care The evolution in the Kingdom’s healthcare industry was mainly associated with the increase in population. However, we cannot ignore the role of the Kingdom’s economic prosperity over the period of time which allowed the local government to increase spending on healthcare to GDP from 3.8% (SAR54.8bn) in 2007 to 4.0% (SAR86.5bn). According to EIU 1 , the Kingdom’s spending on healthcare is expected to reach 4.9% (SAR135.2bn) of the GDP in 2016; indicating an increase in spending on healthcare sector at 2011-16 CAGR of 9.3%. Besides these economic indicators, according to EIU, the country’s population is expected to increase at 2011-16 CAGR 3.2% and reach 32.8mn in 2016; where the life expectancy is believed to reach 75.3yrs in 2016 as compared 74.1yrs in 2011. Development toward privatization Over the years, most of the healthcare spending in the Kingdom has been government funded. The government is increasingly focusing on creating more public-private health partnerships. It has identified healthcare as one of the key sectors to target in its wide-ranging privatization program. The country’s increasing investment in healthcare infrastructure and focus on encouraging private participation in the healthcare system is expected to drive the demand for medical services and, in turn, support sales of pharmaceuticals. Additionally, the focus on health insurance has also increased. Moreover, with the facilitation of the Economic Cities, KSA is demonstrating its commitment to investing in science and business, besides expanding the technically skilled workforce in the healthcare segment. Changing lifestyle and increase in non communicable diseases 2 The local food consumption pattern and relaxed life style (lack of physical activities; where 68.8% population is inactive 3 ) are leading factors that lead to rise in the diseases. Thus, indicating an increase in requirement of hospitals with specialized clinics. According to Price Water House (PWC), NCDs contributes around 71% of deaths in KSA; where the death from heart diseases constitutes the most. Strategic outlook (for details please refer to our KSA Helth care thematic report- Healthy Outlook for Health Investors) Our strategic analysis on KSA healthcare industry has indicated the following key growth areas; • Geographical expansion – to improve proximity. • Infrastructure development – to improve availability of medical services. • Medical training – to train local talent (on a government level). • Wider insurance policies – to relief general public from high health care cost. Beside these factors, at present, our strategic analysis (using Porter’s generic competitive approach) indicated the ideal strategic move in the local industry is to focus more on mid-size hospitals and increase specialization units in hospitals. Initiation of coverage In this report we initiate our coverage on three listed medical service companies in the Saudi market, i.e. i) Mouwasat Medical Services Company (Mouwasat) with ‘Overweight’ recommendation and a 12-month weighted average price target price of SAR82.0/share. ii) Dallah Healthcare Company (Dallah) with ‘Overweight’ recommendation and a 12-month weighted average price target of SAR79.6/share. iii) National Medical Care Company (Care) with ‘Overweight’ recommendation and a 12-month weighted average target price of SAR68.5/share. Analyst Saleh AlQuati [email protected] +966-2-6618253 Senior Analyst Syed Taimure Akhtar [email protected] +966-2-6618271 KSA healthcare spending positioning KSA - Composition of deaths due to NCDs Source: EIU - KSA healthcare industry report Aug 2012 Source: PWC 4.4% 4.4% 4.0% 4.3% 4.8% 4.9% 4.9% 4.9% 3.8% 4.0% 4.2% 4.4% 4.6% 4.8% 5.0% 5.2% 50 60 70 80 90 100 110 120 130 140 2010 2011 2012 2012e 2013e 2014e 2015e 2016e Healthcare spending (SARbn) - LHS Healthcare spending % GDP - RHS Diabetes; 6.0% Respiratory disease; 3.0% Cancers; 9.0% Cardiovascular disease; 42.0% 1. Economic Intelligence Unit – KSA Healthcare sector August 2012 2. Non communicable diseases; those which are non-transmissible and non-infectious i.e. heart, lungs, cancers and so on. 3. As per press release in Arab News dated 26th Feb 2013
Transcript of KSA Medical Healthcare Sector July 2013 Initiating · PDF fileKSA Medical Healthcare Sector...

1 © All rights reserved
Please read Disclaimer on the back
KSA Medical Healthcare SectorInitiating Coverage
July 2013
Favorable demography & economy - Increasing demand for health care The evolution in the Kingdom’s healthcare industry was mainly associated with the increase in population. However, we cannot ignore the role of the Kingdom’s economic prosperity over the period of time which allowed the local government to increase spending on healthcare to GDP from 3.8% (SAR54.8bn) in 2007 to 4.0% (SAR86.5bn). According to EIU1, the Kingdom’s spending on healthcare is expected to reach 4.9% (SAR135.2bn) of the GDP in 2016; indicating an increase in spending on healthcare sector at 2011-16 CAGR of 9.3%. Besides these economic indicators, according to EIU, the country’s population is expected to increase at 2011-16 CAGR 3.2% and reach 32.8mn in 2016; where the life expectancy is believed to reach 75.3yrs in 2016 as compared 74.1yrs in 2011.
Development toward privatizationOver the years, most of the healthcare spending in the Kingdom has been government funded. The government is increasingly focusing on creating more public-private health partnerships. It has identified healthcare as one of the key sectors to target in its wide-ranging privatization program. The country’s increasing investment in healthcare infrastructure and focus on encouraging private participation in the healthcare system is expected to drive the demand for medical services and, in turn, support sales of pharmaceuticals. Additionally, the focus on health insurance has also increased. Moreover, with the facilitation of the Economic Cities, KSA is demonstrating its commitment to investing in science and business, besides expanding the technically skilled workforce in the healthcare segment.
Changing lifestyle and increase in non communicable diseases2
The local food consumption pattern and relaxed life style (lack of physical activities; where 68.8% population is inactive3) are leading factors that lead to rise in the diseases. Thus, indicating an increase in requirement of hospitals with specialized clinics. According to Price Water House (PWC), NCDs contributes around 71% of deaths in KSA; where the death from heart diseases constitutes the most.
Strategic outlook (for details please refer to our KSA Helth care thematic report-
Healthy Outlook for Health Investors)
Our strategic analysis on KSA healthcare industry has indicated the following key growth areas;
• Geographical expansion – to improve proximity.
• Infrastructure development – to improve availability of medical services.
• Medical training – to train local talent (on a government level).
• Wider insurance policies – to relief general public from high health care cost.
Beside these factors, at present, our strategic analysis (using Porter’s generic competitive approach) indicated the ideal strategic move in the local industry is to focus more on mid-size hospitals and increase specialization units in hospitals.
Initiation of coverageIn this report we initiate our coverage on three listed medical service companies in the Saudi market, i.e.
i) Mouwasat Medical Services Company (Mouwasat) with ‘Overweight’ recommendation and a 12-month weighted average price target price of SAR82.0/share.
ii) Dallah Healthcare Company (Dallah) with ‘Overweight’ recommendation and a 12-month weighted average price target of SAR79.6/share.
iii) National Medical Care Company (Care) with ‘Overweight’ recommendation and a 12-month weighted average target price of SAR68.5/share.
Analyst
Saleh [email protected]+966-2-6618253
Senior Analyst
Syed Taimure [email protected]+966-2-6618271
KSA healthcare spending positioning
KSA - Composition of deaths due to NCDs
Source: EIU - KSA healthcare industry report Aug 2012
Source: PWC
4.4% 4.4%
4.0%
4.3%
4.8%
4.9% 4.9% 4.9%
3.8%
4.0%
4.2%
4.4%
4.6%
4.8%
5.0%
5.2%
50
60
70
80
90
100
110
120
130
140
2010 2011 2012 2012e 2013e 2014e 2015e 2016e
Healthcare spending (SARbn) - LHS Healthcare spending % GDP - RHS
Diabetes; 6.0%
Respiratory disease; 3.0%
Cancers; 9.0%
Cardiovascular disease; 42.0%
1. Economic Intelligence Unit – KSA Healthcare sector August 20122. Non communicable diseases; those which are non-transmissible and non-infectious i.e. heart, lungs, cancers and so on. 3. As per press release in Arab News dated 26th Feb 2013

2 © All rights reserved
Please read Disclaimer on the back
KSA Medical Healthcare SectorInitiating Coverage
July 2013
KSA health care industry - OverviewDemand for healthcare in the Kingdom is expected to be primarily driven by a growing population. Saudi Arabia’s population increased at a CAGR of 2.3% during 2001–10, and is estimated to increase at 2011-16 CAGR of 3.2%. According to the EIU projections, the Kingdom’s population will reach 32.8mn by 2016; where, United Nations projects the Kingdom’s population to reach 54.7mn by 2050. Additionally, according to EIU, the life expectancy is estimated to rise from 73.9 years in 2010 to 75.3 years in 2016. The increase in life expectancy is indicative of a growing elderly society due to an improved healthcare system and also increase in requirement for medical healthcare facilities secondary demand driver for healthcare.
In addition, rising per capita income has led to an increase in expenditure on the healthcare sector. However, as per EIU the healthcare expenditure percentage to GDP in the Kingdom is still far below that of other developed nations; though it is similar to other GCC countries. As per EIU estimates, the kingdom’s health care expenditure will continue to remain lower than other developed nations; indicating high potential for huge developments in the kingdom’s healthcare sector.
On the other hand, the improvement in the healthcare system played a vital role to bring the mortality rate in KSA (per 1,000 births) down to 16.7 from 21.0 recorded in 1990; which is further expected to reduce to 13.6 in 2016, as per EIU.
Population of KSA (mn)
Healthcare spending % GDP 2011*
Life expectancy in KSA (yrs)
Healthcare spending % GDP 2016e
Source: EIU * Based on EIU estimate; where 2016 is forecasted
Source: EIU * Based on EIU estimates
Source: EIU * Based on EIU estimate; where 2012-2016 are forecasted
Source: EIU
15.0
17.0
19.0
21.0
23.0
25.0
27.0
29.0
31.0
33.0
35.0
���� ���� ���� 2016e2001 2010 * 2011 *
CAGR - 2.3%
CAGR - 3.2%
18.0%
11.5%
7.5%
5.3%
4.0%
3.0%
5.0%
7.0%
9.0%
11.0%
13.0%
15.0%
17.0%
19.0%
US Germany Japan China KSA
73.0
73.5
74.0
74.5
75.0
75.5
����* ���� 2012e2011 *2010 2013e 2014e 2015e 2016e
18.5%
11.7%
7.9%
5.9%
4.9%
3.0%
5.0%
7.0%
9.0%
11.0%
13.0%
15.0%
17.0%
19.0%
21.0%
US Germany Japan China KSA
4. United Nations – World Population to 23005. EIU – KSA Healthcare report August 2012 & August 2008
3 © All rights reserved
Please read Disclaimer on the back
KSA Medical Healthcare SectorInitiating Coverage
July 2013
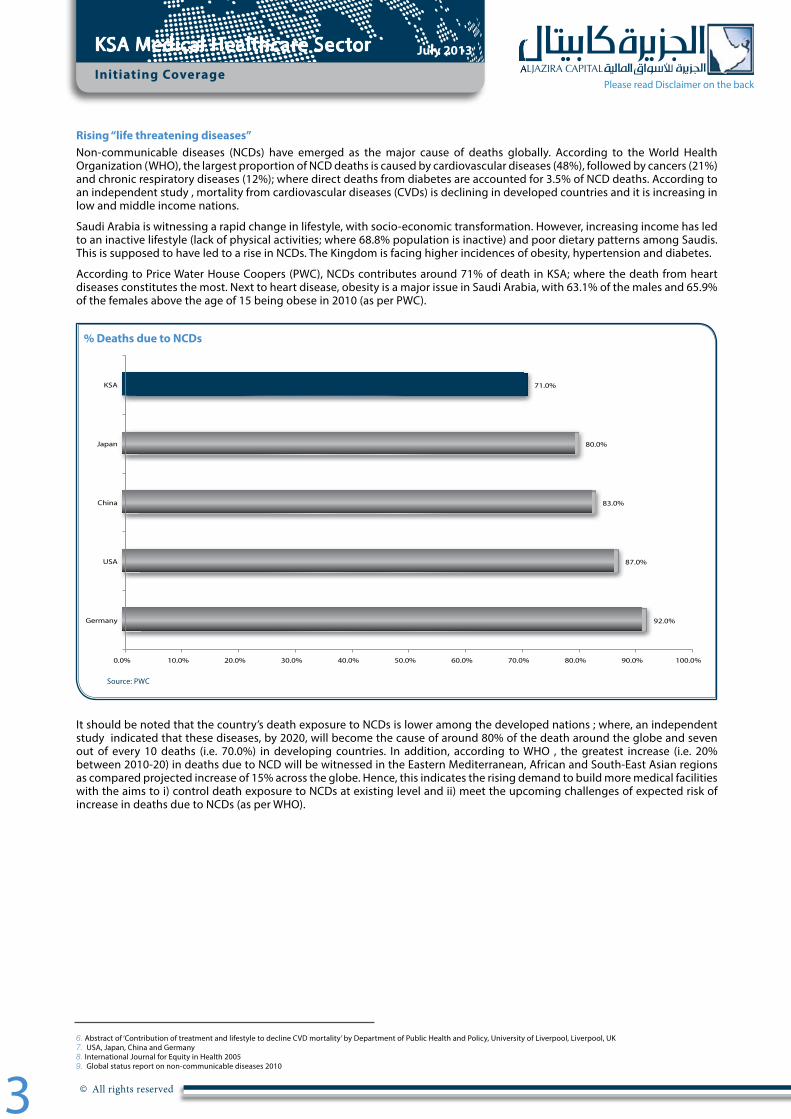
Rising “life threatening diseases”Non-communicable diseases (NCDs) have emerged as the major cause of deaths globally. According to the World Health Organization (WHO), the largest proportion of NCD deaths is caused by cardiovascular diseases (48%), followed by cancers (21%) and chronic respiratory diseases (12%); where direct deaths from diabetes are accounted for 3.5% of NCD deaths. According to an independent study , mortality from cardiovascular diseases (CVDs) is declining in developed countries and it is increasing in low and middle income nations.
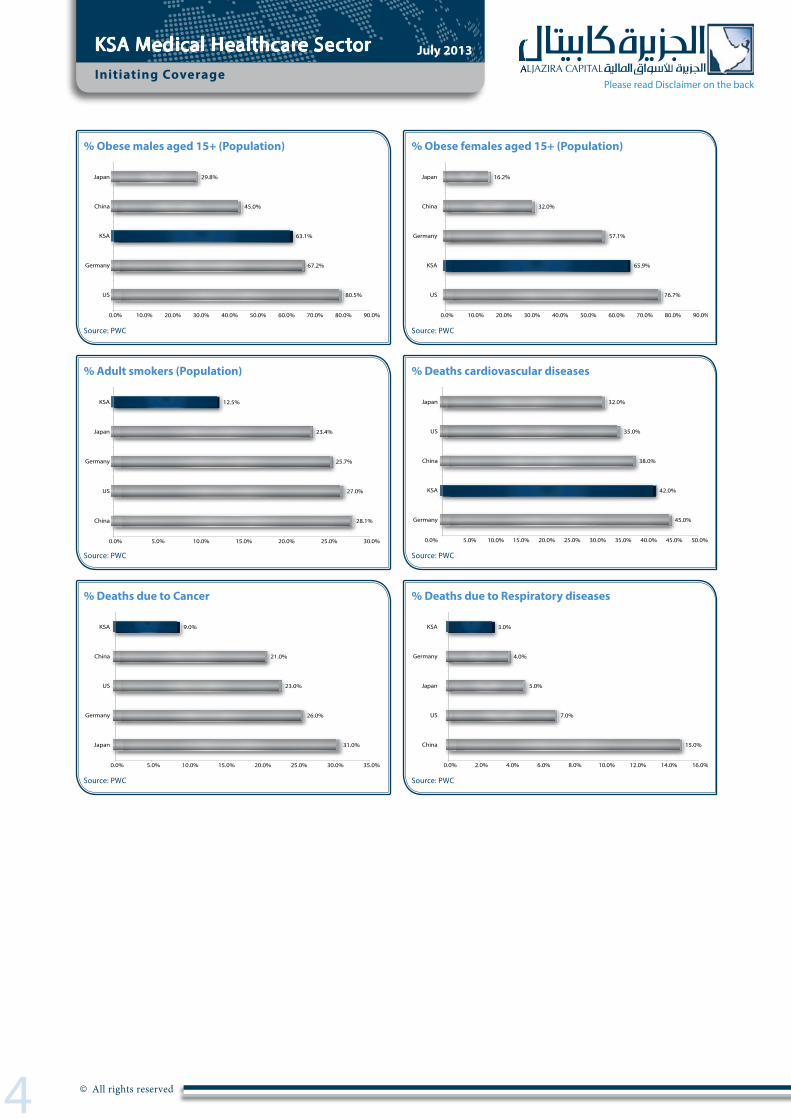
Saudi Arabia is witnessing a rapid change in lifestyle, with socio-economic transformation. However, increasing income has led to an inactive lifestyle (lack of physical activities; where 68.8% population is inactive) and poor dietary patterns among Saudis. This is supposed to have led to a rise in NCDs. The Kingdom is facing higher incidences of obesity, hypertension and diabetes.
According to Price Water House Coopers (PWC), NCDs contributes around 71% of death in KSA; where the death from heart diseases constitutes the most. Next to heart disease, obesity is a major issue in Saudi Arabia, with 63.1% of the males and 65.9% of the females above the age of 15 being obese in 2010 (as per PWC).
It should be noted that the country’s death exposure to NCDs is lower among the developed nations ; where, an independent study indicated that these diseases, by 2020, will become the cause of around 80% of the death around the globe and seven out of every 10 deaths (i.e. 70.0%) in developing countries. In addition, according to WHO , the greatest increase (i.e. 20% between 2010-20) in deaths due to NCD will be witnessed in the Eastern Mediterranean, African and South-East Asian regions as compared projected increase of 15% across the globe. Hence, this indicates the rising demand to build more medical facilities with the aims to i) control death exposure to NCDs at existing level and ii) meet the upcoming challenges of expected risk of increase in deaths due to NCDs (as per WHO).
% Deaths due to NCDs
Source: PWC
92.0%
87.0%
83.0%
80.0%
71.0%
0.0% 10.0% 20.0% 30.0% 40.0% 50.0% 60.0% 70.0% 80.0% 90.0% 100.0%
Germany
USA
China
Japan
KSA
6. Abstract of ‘Contribution of treatment and lifestyle to decline CVD mortality’ by Department of Public Health and Policy, University of Liverpool, Liverpool, UK7. USA, Japan, China and Germany8. International Journal for Equity in Health 20059. Global status report on non-communicable diseases 2010
4 © All rights reserved
Please read Disclaimer on the back
KSA Medical Healthcare SectorInitiating Coverage
July 2013
% Obese males aged 15+ (Population)
% Deaths due to Cancer
% Adult smokers (Population)
% Obese females aged 15+ (Population)
% Deaths due to Respiratory diseases
% Deaths cardiovascular diseases
Source: PWC
Source: PWC
Source: PWC
Source: PWC
Source: PWC
Source: PWC
80.5%
67.2%
63.1%
45.0%
29.8%
0.0% 10.0% 20.0% 30.0% 40.0% 50.0% 60.0% 70.0% 80.0% 90.0%
US
Germany
KSA
China
Japan
31.0%
26.0%
23.0%
21.0%
9.0%
0.0% 5.0% 10.0% 15.0% 20.0% 25.0% 30.0% 35.0%
Japan
Germany
US
China
KSA
28.1%
27.0%
25.7%
23.4%
12.5%
0.0% 5.0% 10.0% 15.0% 20.0% 25.0% 30.0%
China
US
Germany
Japan
KSA
76.7%
65.9%
57.1%
32.0%
16.2%
0.0% 10.0% 20.0% 30.0% 40.0% 50.0% 60.0% 70.0% 80.0% 90.0%
US
KSA
Germany
China
Japan
15.0%
7.0%
5.0%
4.0%
3.0%
0.0% 2.0% 4.0% 6.0% 8.0% 10.0% 12.0% 14.0% 16.0%
China
US
Japan
Germany
KSA
45.0%
42.0%
38.0%
35.0%
32.0%
0.0% 5.0% 10.0% 15.0% 20.0% 25.0% 30.0% 35.0% 40.0% 45.0% 50.0%
Germany
KSA
China
US
Japan

5 © All rights reserved
Please read Disclaimer on the back
KSA Medical Healthcare SectorInitiating Coverage
July 2013
Major concerns for KSA healthcare sector
High dependence on government for healthcare financing KSA’s healthcare spending depends majorly on government financing. According to the Kingdom’s Ministry of Health (MoH) figures, in 2010, government spending on health care accounted for 79.5% of the country’s total health expenditure. On the other hand, according to Dallah Health Care IPO prospectus, by the end of 2011 almost 51% of the hospitals in KSA are owned and operated by MoH; while 23% and 25% are owned by other government agencies and private groups; respectively.
Although Saudi government is encouraging private participation in the healthcare industry, the investment by private players remains a challenge due to huge capital requirement in the sector. Over the years, most of the healthcare spending in the Kingdom has been government funded. The government is increasingly focusing on creating more public-private health partnerships. It has identified healthcare as one of the key sectors to target in its wide-ranging privatization program. The country’s increasing investment in healthcare infrastructure and focus on encouraging private participation in the healthcare system is expected to drive the demand for pharmaceuticals and, in turn, support sales of pharmaceuticals. Additionally, the focus on health insurance has also increased. Moreover, with the facilitation of the Economic Cities, KSA is demonstrating its commitment to investing in science and business, besides expanding the technically skilled workforce in the healthcare segment.
Government’s share in KSA’s health expenditure
Source: WHO
-4%
-2%
0%
2%
4%
6%
8%
10%
12%
-
2,000
4,000
6,000
8,000
10,000
12,000
14,000
16,000
18,000
2007 2008 2009 2010 2011e
MoH - LHS Other government agencies - LHS Private hospitals - LHS Growth - RHS

6 © All rights reserved
Please read Disclaimer on the back
KSA Medical Healthcare SectorInitiating Coverage
July 2013
Lack of medical infrastructure Although the local government is increasing its spending on medical healthcare the sector is still lagging with;
i) 22 beds per 10,000 population10,
ii) 9.4 physicians available per 10,000 population11 and
iii) 21 nurses & midwives per 10,000 population.
The combination of these factors indicates the Kingdom has ample room to make further developments in these areas; while comparing with Global and region averages.
Even with all the challenges, Saudi healthcare industry is witnessing a strong growth. At present, according to a press release12, the king has allocated SAR15.1bn (USD4.0bn) for 22 new health projects across the Kingdom. Based on the given information, the fund will use to establish 22 new medical projects; of which 19 will be medical complexes and hospitals with a capacity of 7,400 beds in addition to the three centers for children treatments. Among these new medical the largest setups of two 200-beds and one 500-bed hospitals are planned for Makkah region; where, 100-bed medical facilities are planned for Riyadh & Jeddah in addition to 500-bed medical units will be established in Qatif, Al-Ahsa, Khamees Mushyat and West Dammam.
KSA healthcare medical services sector - Global & GCC positioning
Source: World Health Organization – Word health statistics 2012
Saudi Arabia
UAE
OmanKuwait
Bahrain
Qatar
Region of Americas
European region
Western Pacific regionWorld average
-
5.0
10.0
15.0
20.0
25.0
30.0
35.0
0 10 20 30 40 50 60 70
Ph
ysi
cia
ns
pe
r 1
0,0
00
p
op
ula
tio
n
Beds per 10 , 000 population
Saudi Arabia UAE Oman Kuwait Bahrain Qatar Region of Americas European region Western Pacific region World average
10. World Health Organization – World Health Statistic 201211. World Health Organization – World Health Statistic 201212. Arabian Business – Saudi king earmarks $4bn for healthcare projects; dated 04th April 2013

7 © All rights reserved
Please read Disclaimer on the back
Mouwasat Medical Services Company July 2013
Initiate with “Overweight” recommendation
Expanding strategically
• A leading medical service provider in Eastern region - Mouwasat medical services company (Mouwasat) has reasonable medical complexes (mid-size hospitals) in Dammam Qatif and Jubail; where, the largest among them is located in Dammam. The company also has a small medical set-up (a dispensary) with only 18 out-patient clinics in Al-Ahsa (Hofuf ), a specialized clinic in Al-Khobar and a mid-size hospital in Madinah; the company’s only medical complex in Western province. In addition, the company’s pharmacy operation is based on 11 pharmacies; where 10 are located in the Eastern province (including Khobar) and one in Madinah. We believe the company’s pharmacy segment complements its hospitals & dispensary operations i.e. undisrupted supply of medicines and required medical supplies.
• Committed to utilize opportunities in new areas - According to the given information, the company is building a new mid-size hospital in Riyadh with a designed capacity of 175 beds and 60 outpatient clinics. The construction of the complex was started in 2009 which is expected to complete by the end of 2013 and start commercial operation in 1Q2014. It should be noted that the company first entered in Riyadh through a management agreement with SUDC13 in 2002 to manage and operate NCH14. The agreement was terminated in 2010.
• Strengthen its existing foothold - Based on the given plans, the company’s key upcoming expansions (other than Riyadh) are mainly focusing to strengthen and expand its presence in Eastern province. These expansions are;
h At Jubail medical complex - to double the number of beds from 114 as of 2012 to 228. As per the company’s press release, expansion will take 30 months to complete; where the construction was started in July 2012. However, in our valuation, we have taken the impact this expansion from 2H2015.
h In Dhahran/Khobar - to establish new medical unit with 150 beds. According to the given information, the construction activities will start in 2Q2013 i.e. a year delay from the original plan. Moreover, the project is expected to complete in 3 years i.e. late 1H-2016; where, we assume the project will start commercial operation in late 2H-2016.
• Expansion to capitalize the identified strategic opportunities - It should be noted that the company’s existing expansion plans (as discussed earlier) are mainly focusing to establish mid-size medic units and increase the capacity in existing facilities. Hence, this indicates the company’s prospective operational enlargement is in line with the outcome of our industry analysis. Where, the mid-size hospitals have better payoffs between ‘cost & differentiation’ over large-size hospitals (Porter’s generic competitive model) and increase geographical coverage (Porter’s 5 forces) at low cost.
• Financial growth - Based on our expectations, the company’s revenue will increase at a CAGR of 15.6%, during 2012-16 with stable gross and operating margins. Consequently, this will lead the company’s net profitability to increase at a CAGR of 18.5%, during 2012-16.
• Investment consideration - We used weighted average approach and arrived at a 12-month price target of SAR82.0/share. This indicates the stock, at a current market price of SAR73.5/share (as of 02nd July 2013), is offering a potential upside of 11.6% and trading at prospective 2013 PE and PBV of 19.2x and 4.2x, , respectively. We, therefore, initiate our coverage on Mouwasat with ‘Overweight’ recommendation.
Key risks to valuationSince the industry has defensive nature against the rapid change in economic cycle so we believe the key risk associated with our valuation could be the company specific risk. Hence, we identified the following key risk associated with our valuation;
• Delay in expansions - The company’s growth in coming years is mainly based on the successful commencement of new medic units & expansion at the existing facility. Hence, any delay could lead us to make subsequent revision in our valuations and estimations.
Recommendation ‘Overweight’
12-month price target; SAR82.0
Current Price: SAR73.5
Upside / (downside): 11.6%
Reuters code: 4002.SEBloomberg code: MOUWASAT ABCountry: KSASector: Health carePrimary Listing: KSA exchangeM-Cap: SAR3,675mn52 Weeks H/L (SAR): 74.25 / 45.80
SAR mn (unless specified) 2012 2013e 2014e 2015e 2016eRevenues 797 878 1,103 1,270 1,422 Revenues growth - YoY 17.4% 10.3% 25.5% 15.2% 11.9%EBITDA 225 248 328 381 427 EBITDA growth - YoY 9.2% 10.1% 32.1% 16.4% 12.1%Net income 172 191 256 300 338 Net income growth - YoY 15.9% 11.4% 34.0% 17.3% 12.7%EPS (SAR) 3.4 3.8 5.1 6.0 6.8 P/E (x) 15.7 19.2 14.3 12.2 10.9P/BV (x) 3.5 4.2 3.5 3.0 2.6EV/EBITDA (x) 12.4 14.5 10.9 9.1 7.8
Source: AlJazira Capital* We have taken respective December closing prices for 2012, while for years 2013 & onwards we used closing price of 02nd July 2013.
Key information
Key financial indicators
40.0
45.0
50.0
55.0
60.0
65.0
70.0
75.0
6,400.0
6,600.0
6,800.0
7,000.0
7,200.0
7,400.0
7,600.0
Ma
y 1
2
Jun
12
Jul1
2
Au
g1
2
Se
pt
12
Oc
t 1
2
No
v 1
2
De
c 1
2
Jan
13
Fe
b 1
3
MA
r 1
3
Ap
r 1
3
MA
y 1
3
TASI - LHS Mouwasat (SAR) - RHS
Price Chart
13. Saudi United Development Company14. Najd Consultant Hospital; a hospital of SUDC
Initiation | KSA | Healthcare

8 © All rights reserved
Please read Disclaimer on the back
Mouwasat Medical Services Company July 2013
Valuation summary
Our weighted average valuation approach is based on the combination the company’s net worth derived by applying DCF based valuation methodology and relative valuation technique (peer group TTM EV/EBITDA matrix); where 80% weight is assigned to DCF and 20% relative valuation technique.
Key variables estimations• Terminal growth rate is taken at 3.0%.• 2-year weekly raw beta of 0.70 from Bloomberg.• Risk free rate is taken at 2.7%. The calculation of RFR is based on the summation of i) 10-year US government bond yield of 2.0%; and
ii) country default spread (CDS) of 0.7% for KSA, as per Damodaran’s Equity Risk Premium; determinants, estimations & implications - March 2012 edition.
• KSA total market risk premium (annual 2012) is taken at 13.15% from Bloomberg. Hence, the equity risk premium is calculated at 10.4%.
• Capital Assets Pricing Model (CAPM) is used to calculate cost of equity at 10.0%.• Cost of debt is taken at 3.5%.• Weighted average cost of capital (WACC) is taken at 9.3%.
Based on the company’s peer group 2013 TTM-EV/EBITDA, we arrived at a relative valuation based 12-month price target of SAR76.1/ share.
By employing weighted average valuation approach, we arrived at a 12-month price target of SAR82.0/share. This indicates the stock at current market price of SAR73.5/share (as of 02nd July 2013) is offering a potential upside of 11.6% and trading at a prospective 2013PE and PBV of 19.2x and 4.2x respectively. We therefore, initiate our coverage on Mouwasat with ‘Overweight’ recommendation.
All figures in SAR mn, unless specified 2012 2013e 2014e 2015e 2016e
Revenues 797 878 1,103 1,270 1,422 EBITDA 225 248 328 381 427 Margin (%) 28.3% 28.2% 29.7% 30.0% 30.1%EBIT 186 206 278 327 370 Margin (%) 23.4% 23.4% 25.2% 25.8% 26.0%Net Income 172 191 256 300 338 Margin (%) 21.5% 21.8% 23.2% 23.7% 23.8%Cash from operations 193 193 193 193 193 Total assets 1,225 1,375 1,505 1,636 1,784 Shareholders' equity 764 879 1,038 1,209 1,396 Total liabilities & equity 1,225 1,375 1,505 1,636 1,784 Free Cash Flow Analysis (FCF)NOPLAT 172 184 249 293 331 Depriciation & amortization 39 42 49 53 57 Change in net working capital (29) (18) 13 15 17 CAPEX (201) (106) (110) (114) (117)FCF (20) 102 200 247 288 Discount Factor 0.96 0.88 0.80 0.73 PV of FCF 97 175 198 211 Sum of PV of FCF 682 Terminal value 4,746 PV of Terminal value 3,480 Enterprise value 4,162 Add: Net debts 11 Total equity value 4,173 Shares (mn) 50.0 DCF based value (SAR/share) 83.5 Terminal growth 3.0%WACC 9.3%
Source: Aljazira capital research
All figures in SAR mn, unless otherwise specifiedSector EV/EBITDA 15.3 Implict enterprise value 3,792.2 Cash 294 Debt (283)Net worth of Mouwasat 3,803.14 Shares (Mn) 50Relative value (SAR/share) 76.1
Source: Aljazira capital
All figures in SAR mn, unlessotherwise specified Fair value Weights Weighted average
DCF based value 83.5 80% 66.8 Relative value 76.1 20% 15.2 Weighted average 12-month price target 82.0
Source: Aljazira capital
DCF based valuation methodology
Relative valuation
Weighted average 12-month price target

9 © All rights reserved
Please read Disclaimer on the back
Mouwasat Medical Services Company July 2013
Mouwasat Medical Services Company – Operational overview
The company was established with an aim to provide medical health care in 1979. The establishment of comprehensive medical facility in 1984 is considered as the key milestone achieved by the company; where the medical unit commenced its operation in 1988. Later on, the establishment of medical hospital in Jubail marked another success for the company; which was followed by the expansion in medical network in other areas of Eastern province like Al-Qatif and Al-Ahsa. Simultaneously, the company expanded its operational coverage in Madinah in 2001; Mouwasat’s only medical infrastructure in Western region.
By the end of 2012, the company was operating with 4 mid-size hospitals (>100 beds; but <300 beds) located in Dammam, Jubail, Al Qatif and Madinah; where, the largest medical setup is located in Dammam (with 240 beds, 100 out-patient clinics and 16 specialized clinics). Beside these mid-size hospitals, the company has small-size medical set-up in Al-Ahsa i.e. dispensary (with 18 out-patient clinics). In addition to these medical facilities, the company operates 11 pharmacies; of which 10 are located in Eastern province and one in Madinah.
It is worthy to mention that the company’s Dammam medical facility, in addition to general public, is serving i) SABIC staff & their families since 1988, ii) Aramco’s staffs and their families since 1996, iii) insurance companies licensed by Cooperative Council for Health Insurance & Government Organization for Social Insurance, iv) Saudi Arabian Airlines and v) Saudi Electric Company.
On the other hand, the company’s Jubail medical facility is mainly providing medical services to SABIC employees & their families; where 60% of the hospitals facilities are allocated for the same. The remaining 40% of the hospital services are assigned to meet the requirements of the other clients and general public. This, in itself, is a high concentration of clients that pose a threat to the stability of revenues in the future.
Shareholding pattern - 2012The company went public and offered 7.2mn share at SAR44.0/share (premium of SAR34.0/share) through an IPO completed in 2009. In April 2012, the company issued 100% bonus shares which raised the company’s total share capital to SAR500.0mn; where, by the end of 2012, general public owns 42.3%.
Evolution in Mouwasat operations throughout the years
Source: Mouwasat & Aljazira Capital Research
1975 - Established first polyclinic in Dammam
1979 - Undertook the operation & management of multi-specialty clinic in Jubail residential area.
1984 - Established first comprehensive medical facility in Dammam.
1999- Established Skin Care in Dammam.
2001 - Open polyclinic in Al-Ahsa
2006 - Expand medical network in Al-Qatif and acquired 51.0% stakes in Eastern Medical Service Company; which owns Gulf Specialized Hospital (known as Mouwasat Hospital – Al Qatif
2007 - Open skin care in Madinah2010 - Signed cooperation agreement with Care-Fertility-UK and established an in-Virto fertility center in Dammam.
2013 - Expected to open new hospital in Riyadh.
Mouwasat shareholding pattern - 2012
Source: Tadawul, Zawya
Mohammad Sultan Hammad Al Subaie;
Nasser Sultan Fahad Al Subaie; 17.50%
17.50%Others; 5.20%
Suleiman Mohammad Suleiman Al Subaie;
General public; 42.30%
17.50%

10 © All rights reserved
Please read Disclaimer on the back
Mouwasat Medical Services Company July 2013
Expansion to cater the existing opportunitiesBased on the given information, the company’s upcoming expansions are mainly based on the following projects;
i) Establish new mid-size hospital in Riyadh; with a capacity of 175 beds and 60 outpatient clinics. The construction work in Riyadh was started in 2009 and expected to start commercial operation in early 2014. The hospital will have the departments of pediatrics, gynecology, cardiology, psychiatry, dermatology, orthopedics, physiotherapy, dentistry, ophthalmology & ENT.
ii) Establish new mid-size medical facility in Dhahran/Khobar; which will accommodate 150 beds. According to the given information, the construction activities are expected to start after the delay of a year in 2Q2013 and complete in three years.
iii) Expansion at existing facility; the company is in a process to double the capacity of its existing Jubail hospital. The construction work was started in July 2012 and it will take 30 months to complete; but we have taken impact of this project from 2H-2015.
Upon the successful completion of these projects, we believe the company will be able to strategically align itself to utilize the opportunities (we identified in our thematic report of the sector); where, our assumption is based on the following rationale;
• Expansion in the existing province will lead to improve the company’s coverage in the respective province. Hence, this will translate into improvement in a) proximity, b) availability of physicians and c) infrastructure; including beds & medical services please refer to our KSA Health care thematic report- Healthy Outlook for Health Investors)
• The enhancement of existing operational facility in Dammam will lead the company to strengthen its economies. We believe the increase in medical facilities will widen the scope of hospital and potentially reduce the dependence of the company’s medic facility on designated clients. Consequently, this will lead to the diversion in the company’s Jubail medical unit from narrow market scope to broader market scope; where the potential size of Jubail hospital (after the completion of expansion) suggests it will remain mid-size. We, therefore, believe the company’s expansion plan to is still in line with the outcome of our Porter’s generic model (please refer to our KSA Health care thematic report- Healthy Outlook for Health Investors)
• The completion of medical facility in Riyadh will help the company to cater the opportunities in Central Region. It should be noted that Riyadh hospital would be the company’s first comprehensive fully-owned medical complex in the area of Riyadh.
Beside the above mentioned strategic advantages; the expansion projects will lead the company’s overall number of beds to more than 1,000 in 2016 increase at a CAGR of 14.1% during 2012-16; where the company’s total number of hospital is expected to reach at six by the end of 2016. It should be noted that the company over the period of time reduced its focus to establish and run small-size polyclinics (the company, recently, transferred its Dammam dispensary to the hospital) with an exception of small-sized polyclinic in Al-Ahsa (Hofuf ).
In addition, the company’s cumulative (in-patient + out-patient)13 per bed revenue is expected to reach SAR3,084.3/bed per day in 2016 as compared to SAR2,778.8/bed per day calculated in 2012. This will translate positively on the company’s overall revenue which is expected to increase at a CAGR of 15.6%, during 2012-16. Based on the given information, the company is mainly focusing to establish and expand its hospital business rather than pharmacy (directly). Consequently, we expect the contribution in overall sale revenue from hospital segment will increase to 86.1% in 2016 as compared to 79.4% calculated in 2012.
Growth in number of beds – 2012-16
Source: Company annual reports, press releases and Aljazira Capital Research
27.7%
14.1%
16.3%
10.0%
12.0%
14.0%
16.0%
18.0%
20.0%
22.0%
24.0%
26.0%
28.0%
30.0%
-
200
400
600
800
1,000
1,200
2012 2013e 2014e 2015e 2016e
In-paitient - Number of beds - LHS Out-paitient - Number of beds - LHS Growth - RHS
Start of new hospital in Riyadh with
175 beds.
Comple-tion of
expansion at Dammam and add
114 additional beds
Comple-tion of
new hospital at Dhahran with 150
beds
13. In-patient: patients who are admitted to a hospital, while out-patient: a patient who is not hospitalized overnight but who visits a hospital

11 © All rights reserved
Please read Disclaimer on the back
Mouwasat Medical Services Company July 2013
Profitability growth
We expect the company will post net profit of SAR191.2mn (EPS; SAR3.8); indicating YoY growth of 11.4% in 2013. However, the successful completion of new medical facility in Riyadh & Dhahran and expansion in Dammam (as explained earlier) will lead the company’s net profitability to increase at 2012-16CAGR of 18.5%; where, the respective profitability margins are expected to hover around 21.5%-24.0%, during 2013-16. In addition, the company’s ROAA and ROAE are expected to show improvement and reach 19.0% and 24.3%, respectively, in 2016.
Sales revenue growth - 2012-16
Net profitability growth
Source: Company’s annual report & Aljazira Capital
Source: Company annual reports, & Aljazira Capital
15.5%
17.4%
10.3%
25.5%
15.2%
11.9%
5.0%
10.0%
15.0%
20.0%
25.0%
30.0%
300.0
500.0
700.0
900.0
1,100.0
1,300.0
1,500.0
2011 2012 2013e 2014e 2015e 2016e
Sales revenue (SARmn) - LHS Growth - RHS
21.8%
21.5%
21.8%
23.2%
23.7%
23.8%
21.3%
21.8%
22.3%
22.8%
23.3%
23.8%
24.3%
-
50.0
100.0
150.0
200.0
250.0
300.0
350.0
400.0
���� ���� 2013e 2014e 2015e 2016e
Net profitability (SARmn) - LHS Net profit margin - RHS
Hospital business;79.4%
Pharmacy business;20.6%
Pharmacy business;13.9%
Hospital business; 86.1%
Sales revenue composition 2012
Sales revenue composition 2016e

12 © All rights reserved
Please read Disclaimer on the back
Mouwasat Medical Services Company July 2013
Amount in SARmn, unless otherwise specified 2012 2013e 2014e 2015e 2016e Income statement Revenues 796.5 878.4 1,102.7 1,270.2 1,421.8 YoY growth 17.4% 10.3% 25.5% 15.2% 11.9% Cost (423.8) (463.5) (571.0) (655.1) (732.0) Gross profit 372.7 414.9 531.6 615.2 689.8 Selling & distribution expense (98.9) (115.6) (140.1) (159.2) (177.0) General & administration expense (87.2) (93.0) (112.8) (127.7) (142.2) Amortization of intengible assets (0.5) (0.6) (0.7) (0.8) (0.8) Operating profit 186.0 205.7 278.1 327.5 369.7 YoY growth 9.9% 10.6% 35.2% 17.8% 12.9% Other income 8.7 9.2 9.3 9.4 9.5 Financial charges (1.1) (1.3) (1.2) (1.2) (1.1) Profit before zakat & minority interest 193.6 213.7 286.1 335.7 378.1 Non-controlling interest (13.4) (14.2) (19.0) (22.3) (25.2) Income before zakat 180.1 199.4 267.1 313.4 352.9 Zakat (8.6) (8.2) (10.9) (12.9) (14.4) Net income 171.6 191.2 256.2 300.5 338.5 YoY growth 15.9% 11.4% 34.0% 17.3% 12.7% Balance sheet Assets Cash & bank balance 158 266 330 396 479 Other current assets 354 331 335 340 344 Property plant & equipment 688 752 814 875 935 Other non-current assets 25 26 26 26 27 Total assets 1,225 1,375 1,505 1,636 1,784 Liabilities & owners' equity Total current liabilities 218 267 266 272 285 Long-term loans 163 147 117 70 18 Total other non-current liabilities 31 33 33 33 34 Non-controlling interest 50 50 51 51 52 Paid -up capital 500 500 500 500 500 Statutory reserves 79 99 124 154 188 Proposed dividend 75 96 128 150 169 Retained earnings 109 184 285 404 538 Total owners' equity 764 879 1,038 1,209 1,396 Total equity & liabilities 1,225 1,375 1,505 1,636 1,784 Cashflow statement Operating activities 193 208 311 362 406 Investing activities (267) (49) (104) (108) (111) Financing activities 40 (51) (143) (188) (212) Change in cash (35.0) 108 64 66 83 Ending cash balance 158 266 330 396 479 Key fundamental ratios Liquidty ratios Current ratio (x) 2.4 2.2 2.5 2.7 2.9 Cash ratio (x) 0.7 1.0 1.2 1.5 1.7 Profitability ratios Gross profit margin 46.8% 47.2% 48.2% 48.4% 48.5% Operating margin 23.4% 23.4% 25.2% 25.8% 26.0% EBITDA margin 28.3% 28.2% 29.7% 30.0% 30.1% Net profit margin 21.5% 21.8% 23.2% 23.7% 23.8% Return on assets 14.0% 13.9% 17.0% 18.4% 19.0% Return on equity 22.5% 21.8% 24.7% 24.9% 24.3% Leverage ratio Debt / equity (x) 0.32 0.30 0.22 0.14 0.08 Market/valuation ratios EV/sales (x) 3.50 4.2 3.25 2.72 2.33 EV/EBITDA (x) 12.38 14.89 10.93 9.07 7.75 EPS (SAR) 3.43 3.82 5.12 6.01 6.77 BVPS (SAR) - Adjusted 15.27 17.57 20.75 24.17 27.91 Market price (SAR)* 53.75 73.50 73.50 73.50 73.50 Market-Cap (SAR mn) 2,687.5 3,675.0 3,675.0 3,675.0 3,675.0 Dividend yield 2.8% 2.6% 3.5% 4.1% 4.6% P/E ratio (x) 15.66 19.22 14.35 12.23 10.86 P/BV ratio (x) 3.52 4.18 3.54 3.04 2.63
Source: Company financial reports & Aljazira Capital * We have taken respective Dec end prices for 2012, while for years 2013 & onwards we used closing price of 02nd July 2013.
Key financial data

13 © All rights reserved
Please read Disclaimer on the back
Dallah Healthcare Holding Company July 2013
Balanced expansion strategy - “Overweight” Recommendation
• Focusing on the Central region – Dallah Healthcare (Dallah)’s hospital (Dallah Hospital) is known for its quality services; it is their only hospital and is located in Riyadh which offers a variety of specialties in various fields of medicine (especially in the obstetrics & gynecology & pediatrics departments). According to the given information, the plan is to convert the areas surrounding the hospital into supporting medical services in variety of specialties so that the location of the hospital becomes a medical complex with integrated services. The Company is more concerned with improving its quality rather than engaging only in expansions, and their focus on ‘specialization’ gives them an edge over their competitors.
• Pediatrics clinic expansion – The company recognizes that pediatric clinics are among the main segments with a potential for growth in the kingdom, hence, the company is planning to open a new wing for pediatrics near the main building of the hospital (it is also the first hospital to provide specialized emergency care for children), the new wing will accommodate 26 new outpatient clinics and 70 new beds, the project started its outpatient clinics in 1Q2013; whereas, inpatient facility is expected to commence operation in late 3Q2013.
• New hospital & out-patient clinics- Based on the given information, the company is building a new large-size hospital in west of Riyadh with a designed capacity of 300 beds and 80 outpatient clinics covering an area. The company recently announced that the construction of the new hospital is expected to commence during 2Q-2014 and the project will be completed by 2Q-2017, hence, we expect it to come online by late 3Q-2017, and will take this into consideration for our valuation. In addition to this, the company, recently, signed a contract to add 65 new out-patient clinics at Dallah Hospital Complex in Riyadh. The expansion project is expected to complete in late 4Q-2014.
• Increase profitability through other improvements – The company plans to improve profitability by increasing the average income per bed and decrease the time of stay in the hospital (in line with our KSA health care Tematic report - Healthy Outlook for Health Investor), also the plan is to increase the number of surgical operations as compared to medical procedures.
• Catering for the patient’s needs: The company tends to increase the income from outpatient clinics by focusing on daily care procedures within one day, which in turn increases the flow of patients who prefer to get everything done in one day rather than coming back for other days, this also helps in building up a reputation of the hospital through word of mouth.
• Financial growth - Based on our expectations, the company’s revenue will increase at a CAGR of 19.5%, during 2012-18; where, the expected increase in specialization and the impact of the new hospital will improve gross and operating margins to 46.0% and 29% in 2018, respectively. Consequently, this will lead the company’s net profitability to increase at a CAGR of 26.1%, during 2012-18.
• Investment consideration - We used weighted average approach and arrived at a 12-month price target of SAR79.6/share. This indicates the stock, at a current market price of SAR64.50/share (as of 02nd July 2013), is offering a potential upside of 23.4% and trading at prospective 2013PE and PBV of 18.4x and 2.5x, respectively. We, therefore, initiate our coverage on Dallah with ‘Overweight’ recommendation.
Recommendation ‘Overweight’
12-month price target; SAR79.6
Current Price: SAR64.5
Upside / (downside): 23.4%
Reuters code: 4004.SEBloomberg code: DALLAH ABCountry: KSASector: Health carePrimary Listing: KSA exchangeM-Cap: SAR3,044.4mn52 Weeks H/L (SAR): 96.75/51.0
SARmn (unless specified) 2012 2013e 2014e 2015e 2016e 2017e 2018e
Revenues 637.1 776.5 909.1 1,054.5 1,098.7 1,360.6 1,862.4 Growth % n/a 21.9% 17.1% 16.0% 4.2% 23.8% 36.9%EBITDA 189.2 226.8 283.6 346.5 365.2 471.4 654.5 Growth % n/a 19.9% 25.0% 22.2% 5.4% 29.1% 38.8%Net Income 133.4 165.9 216.2 274.5 290.6 382.4 536.0 Growth % n/a 24.4% 30.4% 26.9% 5.9% 31.6% 40.2%EPS (SAR) 3.88 3.51 4.58 5.81 6.16 8.10 11.36 P/E 16.96 18.35 14.08 11.09 10.48 7.96 5.68P/BV 2.78 2.52 2.29 2.05 1.85 1.60 1.34EV/EBITDA 13.47 12.09 9.51 7.58 7.00 5.40 3.78
Source: AlJazira Capital* We have taken respective December closing prices for 2012, while for years 2013 & onwards we used closing price of 02nd July 2013.
Key information
Key financial indicators
22.5
24.5
26.5
28.5
30.5
32.5
34.5
36.5
6000
6200
6400
6600
6800
7000
7200
7400 TASI - LHS Dallah (SAR) - RHS
De
c 1
2
Jan
13
Jan
13
Jan
13
Jan
13
Jan
13
Fe
b 1
3
Fe
b 1
3
Fe
b 1
3
Fe
b 1
3
Ma
r 1
3
Ma
r 1
3
Ma
r 1
3
Ma
r 1
3
Ma
r 1
3
Ap
r 1
3
Ap
r 1
3
Ap
r 1
3
Ap
r 1
3
Ma
y 1
3
Ma
y 1
3
Ma
y 1
3
Ma
y 1
3
Ma
y 1
3
Price Chart
Initiation | KSA | Healthcare

14 © All rights reserved
Please read Disclaimer on the back
Dallah Healthcare Holding Company July 2013
Valuation summary
Our weighted average valuation approach is based on the combination the company’s net worth derived by applying DCF based valuation methodology and relative valuation technique (peer group TTM EV/EBITDA matrix); where 60% weight is assigned to DCF and 40% relative valuation technique (due to unavailability of the company’s relevant beta). It should be noted that we used pure-play method to calculate the company’s beta for our valuation. Under this method, we used 2-years weekly betas of several local and international similar companies and calculated weighted average beta (based on their respective market capitalization).
Key variables estimations• Terminal growth rate is taken at 3.0%.• Beta is calculated at 0.80.• Risk free rate is taken at 2.7%. The calculation of RFR is based on the summation of• 10-year US government bond yield of 2.0%; and• Country default spread (CDS) of 0.7% for KSA, as per Damodaran’s Equity Risk Premium; determinants, estimations & implications -
March 2013 edition.• KSA total market risk premium (annual 2012) is taken at 13.15% from Bloomberg. Hence, the equity risk premium is calculated at 10.4%.• Capital Assets Pricing Model (CAPM) is used to calculate cost of equity at 11.1%.• Cost of debt is taken at 3.5%.• Weighted average cost of capital (WACC) is taken at 11.0%.
Based on the company’s peer group 2013 TTM-EV/EBITDA, we arrived at a relative valuation based 12-month price target of SAR85.2 per share.
By employing weighted average valuation approach, we arrived at a 12-month price target of SAR 79.6/share. This indicates the stock at current market price of SAR64.50/share (as of 2nd July 2013) is offering a potential upside of 23.4% and trading at a prospective 2013PE and PBV of 18.4x and 2.5x, respectively. We therefore, initiate our coverage on Dallah with ‘Overweight’ recommendation.
All figures in SAR mn, unless specified 2012 2013e 2014e 2015e 2016e 2017e 2018eRevenues 637 776 909 1,054 1,099 1,361 1,862 EBITDA 189 227 284 347 365 471 654 Margin (%) 29.7% 29.2% 31.2% 32.9% 33.2% 34.6% 35.1%EBIT 131 162 213 273 289 383 541 Margin (%) 20.6% 20.9% 23.4% 25.9% 26.3% 28.2% 29.0%Net Income 133 166 216 274 291 382 536 Margin (%) 20.9% 21.4% 23.8% 26.0% 26.5% 28.1% 28.8%Cash from operations 125 204 216 272 285 371 537 Total assets 1,273 1,209 1,325 1,479 1,643 1,895 2,309 Shareholders' equity 1,116 1,206 1,328 1,484 1,650 1,902 2,273 Total liabilities & equity 1,273 1,409 1,527 1,683 1,849 2,103 2,519 Free Cash Flow Analysis (FCF)NOPLAT 159 187 238 298 315 411 576 Depriciation & amortization 29 35 40 41 42 51 64 Change in net working capital (46) 5 (31) (35) (40) (53) (68)CAPEX (86) (82) (82) (89) (97) (235) (304)FCF 55 146 165 215 221 173 269 Discount Factor - 0.95 0.85 0.77 0.69 0.62 0.56 PV of FCF - 138 141 166 153 108 151 Sum of PV of FCF - - - - - - 598 Terminal value - - - - - - 3,443 PV of Terminal value - - - - - - 2,387 Net present value - - - - - - 2,985 Add: Net debts - - - - - - 594 Total equity value - - - - - - 3,579 Shares (mn) - - - - - - 47.2 DCF based value (SAR/share) - - - - - - 75.8 Terminal growth - - - - - - 3.0%WACC - - - - - - 11.0%
Source: Aljazira capital research
All figures in SAR, unless specified Fair value Weights Weighted averageDCF based value 75.8 60% 45.5 Relative value 85.2 40% 34.1 Weighted average 12-month price target 79.6
Source: Aljazira capital
DCF based valuation methodology
Weighted average 12-month price target
All figures in SAR mn, unless specifiedSector EV/EBITDA 15.1 Implicit enterprise value 3,428.7 Cash 604 Net worth of Dallah 4,022.81 Shares (Mn) 47 Relative value (SAR/share) 85.2
Source: Aljazira capital
Relative valuation

15 © All rights reserved
Please read Disclaimer on the back
Dallah Healthcare Holding Company July 2013
Dallah Healthcare Company - Operational overview
Dallah Hospital was established in 1987 by Sheikh Saleh Abdullah Kamel with 237 beds and became one of the largest hospitals in the kingdom as measured by bed capacity, then later as it grew and expanded its services, Dallah Health Services Company was formed in 1994 as a Limited Liability Company. In 2008, the company was approved to convert to a joint stock company and changed its name to Dallah Healthcare Holding Company. In 2011, the company share capital increased from SAR 148mn to SAR 330mn. In August 2012, the company increased its capital from SAR 330mn to SAR 472mn through its initial public offering. In November 2012 it went public and offered 14.2mn share at SAR38.0/share through IPO.
At present, the company operates four units:
• Dallah Hospitals unit (Includes the main hospital building, a building for Obstetrics & Gynecology hospital, and a building for Pediatrics hospital) a 352 beds & 113 clinics hospital in Riyadh providing in-patient and out-patient medical services and it focuses on offering a wide range of services in the following specialties: Cardiac medicine and surgery, Orthopedic and backbone surgery, Dentistry, Endocrinology & Diabetes, Dermatology & cosmetic, ENT, ER, Nephrology, Ophthalmology, Pediatric Surgery, Urology, Psychiatry, Neurosurgery, Pulmonologist, Rheumatology, Plastic surgery, Medical nutrition, Laboratory, Physiotherapy, X-Ray, General surgery, Fertility center, Internal medicine, Operation rooms, Open specialist clinics.
• Dallah Pharma (medicines warehouse) unit is the wholesale distributor of pharmaceutical, herbal and cosmetic products. It is located in Riyadh, Dammam & Jeddah. It distributes these products to retail pharmacies, health & beauty stores, hospitals and government agencies. Dallah Pharma has exclusive distribution rights in the kingdom for 45 pharmaceutical products, 12 herbal products and 8 cosmetic products. The company has also applied for an additional 12 pharmaceutical and 2 herbal products for registration with Saudi Food & Drug Authority.
• Operation & Management Projects unit located in Al-Khafji (under the name Dallah Company) which offers management and operational services to other hospitals, currently there are two major projects run by the company: i) Al-Khafji Hospital for Joint Operations: A hospital owned by Aramco and is dedicated for Gulf Operations and Kuwaiti Gulf Oil Company, the hospital consists of 100 beds and 13 outpatient clinics and two operating theatres. Contract was signed in April 2011 for 5 years to provide medical services to around 3,000 employees and their families. ii) Mahayel Hospital: A private hospital located in the Southern Region of the kingdom (Assir region), it consists of 100 beds and 25 outpatient clinics and two operating theatres. Contract was signed in November 2010 for 5 years, and the company focuses on the provision of hospital management services.
• Investments unit where the company invests in several healthcare companies locally and regionally in surrounding countries: i) Makkah medical center: A Saudi shareholder company was founded in 1990 and located in Makkah city. The company holds 8% share. ii) Jordanian Pharmaceuticals Company: A Jordanian public shareholder company specialized in manufacture of pharmaceutical products and cosmetics. It is subcontracting Dallah Pharma for marketing and distribution. The company holds 0.5% share. iii) Al-Ahsa Medical Services Company Limited: a Saudi Limited company which consists of 120 beds. The company holds 0.8% share. iv) Assir Company for trading, tourism, industry, agriculture, real estate & contracting. The company holds 1% share.
Shareholding Pattern – 2012The company went public and offered 14.2mn shares at SAR38.0/share through an IPO (increasing its capital to SAR 472mn) completed in November 2012. By the end of 2012, the general public owns 37.9%.
Shareholding Pattern
Source: Tadawul
Mohammed RashedAl-Fagih; 5.20% Tareq Othman Al-Kasabi;
5.20%
General Public; 37.90%
Dallah AlBarakahHolding Company; 51.70%

16 © All rights reserved
Please read Disclaimer on the back
Dallah Healthcare Holding Company July 2013
Steps in the right direction
Based on our understanding, the company’s current expansion plans are in line with the industry’s requirement and our strategic analysis. Our views on the company’s key expansion projects are given below;
• Center of excellence is what drives Dallah, their main expansions in sophisticated medical areas to cater for the patients’ needs, and this gives them an advantage, because the rising trend in NCDs in KSA is forcing local patients to prefer more specialized treatment rather than a general one. It should be noted that the company is mainly focusing to expand its exposure in pediatrics clinic, where the hospital is already well reputed in Riyadh for its quality services. According to the given information, the company, recently, expanded its pediatrics wing by 70 beds and 26 out-patient clinics; where the outpatient clinics started operation in 1Q-2013 while the in-patient facility will start commercial operation in 3Q2013. Moreover, the company recently signed a contract (dated 20th Feb 2013) to increase its out-patient clinics at Dallah Hospital Complex, located in Riyadh. The project is expected to be completed in 20 months (i.e. late 4Q2014) and add 65 new clinics.
• Geographically the main focus for the company with regards to its hospitals is still in Riyadh, as the new hospital will be built in West of Riyadh with a designed capacity of 300 beds and 80 outpatient clinics as per 2012 annual report. Recently the company announced that the construction of the new hospital is expected to commence during 2Q-2014 and the project will be completed by 2Q-2017, hence, we expect it to come online by late 3Q-2017, and will take this into consideration for our valuation. However, we assume the completion of this new medical unit will translate positively on the company’s financial; where, the strategic importance of the expansion could be analyzed when more details will be disclosed.
• With reference to our thematic report of the sector; a large size hospital is not the ideal business opportunity as compared to mid-size hospital; considering the ‘cost and differentiation’ payoff. However, based on our analysis, the ideal situation for large size hospital is to increase specialization clinics (as Dallah is doing); which will offset the high payoff of large-size hospital.
• Beside the expansion in medical healthcare facilities, the company, recently, acquired 100% stake in Dawara Medical Factory (Dawara) located in Jeddah which produces medicines (including herbal) and cosmetics. We believe the new facility will complement the company’s existing business line and strengthen its operational integration; as the new factory could consider as a potential supplier of medicines to hospital.
Financial growthBased on the above mentioned given expansion plans, we expect the company’s sales revenue to increase at 2012-16CAGR of 14.6% with declining YoY growth rates in 2016 (mainly due to the completion of all existing projects in 2015). Based on the company’s balanced expansion strategy (as explain earlier); the revenue composition is expected to show minimal deviation from existing level.
Moreover, we expect the company to post a net profit of SAR165.9mn (EPS; SAR3.51); indicating a YoY growth of 24.4% in 2013. However, the expected improvement in sales revenue along with profitability margins will lead the company’s net profitability to increase at 2012-18 CAGR of 26.1%; where, ROAA and ROAE are expected to show improvement to 23.2% and 25.7%, respectively in 2016.
Sales revenue growth – 2012-2016 Net profitability growth – 2012-2016
Source: EIU * Based on EIU estimates Source: EIU
20.8%
21.9%
17.1%
16.0%
4.2%
23.8%
36.9%
0.0%
5.0%
10.0%
15.0%
20.0%
25.0%
30.0%
35.0%
40.0%
-
200.0
400.0
600.0
800.0
1,000.0
1,200.0
1,400.0
1,600.0
1,800.0
2,000.0
2012 2013e 2014e 2015e 2016e 2017e 2018e
Sales revenue (SARmn) - LHS Growth - RHS
20.9%21.4%
23.8%
26.0%26.5%
28.1%
28.8%
20.0%
21.0%
22.0%
23.0%
24.0%
25.0%
26.0%
27.0%
28.0%
29.0%
30.0%
-
100.0
200.0
300.0
400.0
500.0
600.0
2012 2013e 2014e 2015e 2016e 2017e 2018e
Net profit (SARmn) - LHS Net profit margin - RHS
Mainly because of the impact of the new hospital in west Riyadh
Mainly because of the impact of the new hospital in west Riyadh

17 © All rights reserved
Please read Disclaimer on the back
Dallah Healthcare Holding Company July 2013
Amount in SARmn, unless otherwise specified 2012 2013e 2014e 2015e 2016e 2017e 2018e Income statement Revenues 637.1 776.5 909.1 1,054.5 1,098.7 1,360.6 1,862.4 YoY growth 20.8% 21.9% 17.1% 16.0% 4.2% 23.8% 36.9% Cost (393.4) (425.6) (497.7) (571.2) (593.7) (738.2) (1,004.9) Gross profit 243.6 350.9 411.4 483.3 505.0 622.4 857.5 Selling & distribution expense (10.1) (12.9) (13.5) (14.3) (14.7) (16.3) (21.6) General & administration expense (73.2) (146.6) (153.9) (163.4) (167.5) (185.6) (245.8) Other non-cash expenses (29.3) (29.5) (31.0) (32.9) (33.7) (37.4) (49.5) Operating profit 131.0 161.9 213.0 272.6 289.1 383.2 540.6 YoY growth 33.8% 23.6% 31.5% 28.0% 6.0% 32.5% 41.1% Other income 6.7 8.7 8.8 8.9 9.0 9.1 9.2 Financial charges (2.7) - - - - - - Income before zakat 135.1 170.6 221.8 281.5 298.1 392.2 549.8 Zakat (1.7) (4.7) (5.5) (7.0) (7.5) (9.8) (13.7) Net income 133.4 165.9 216.2 274.5 290.6 382.4 536.0 YoY growth 17.6% 24.4% 30.4% 26.9% 5.9% 31.6% 40.2% Balance sheet Assets Cash & equivalent 560 311 352 420 488 499 573 Other current assets 263 292 325 361 402 457 556 Property plant & equipment 438 484 526 574 629 814 1,053 Other non-current assets 12 121 122 123 124 125 126 Total assets 1,273 1,209 1,325 1,479 1,643 1,895 2,309 Liabilities & owners' equity Total current liabilities 108 148 144 143 143 144 174 Long-term loans - - - - - - - Total other non-current liabilities 49 55 56 56 57 57 72 Paid -up capital 472 472 472 472 472 472 472 Statutory reserves 398 398 398 398 398 398 398 Fair value adjustment (3) (3) (3) (3) (3) (3) (3) Retained earnings 248 339 460 617 782 1,035 1,406 Total owners' equity 1,116 1,206 1,328 1,484 1,650 1,902 2,273 Total equity & liabilities 1,273 1,409 1,527 1,683 1,849 2,103 2,519 Cash flow statement Operating activities 125 204 216 272 285 371 537 Investing activities (86) (182) (74) (81) (89) (227) (295) Financing activities 437 (71) (99) (121) (126) (130) (166) Change in cash 476 (49) 43 70 69 14 76 Ending cash balance 560 512 354 422 490 501 575 Key fundamental ratios Liquidity ratios Current ratio (x) 7.6 5.4 6.1 6.9 7.7 8.1 7.7 Cash ratio (x) 5.2 2.1 2.4 2.9 3.4 3.5 3.3 Profitability ratios Gross profit margin 38.2% 45.2% 45.3% 45.8% 46.0% 45.7% 46.0% Operating margin 20.6% 20.9% 23.4% 25.9% 26.3% 28.2% 29.0% EBITDA margin 29.7% 29.2% 31.2% 32.9% 33.2% 34.6% 35.1% Net profit margin 20.9% 21.4% 23.8% 26.0% 26.5% 28.1% 28.8% Return on assets 13.5% 12.4% 14.7% 17.1% 16.5% 19.3% 23.2% Return on equity 16.8% 14.3% 17.1% 19.5% 18.5% 21.5% 25.7% Leverage ratio Debt / equity (x) 0.00 0.01 0.00 0.00 0.00 0.00 0.00 Market/valuation ratios EV/sales (x) 4.00 3.53 2.97 2.49 2.33 1.87 1.33 EV/EBITDA (x) 13.47 12.09 9.51 7.58 7.00 5.40 3.78 EPS (SAR) 3.88 3.51 4.58 5.81 6.16 8.10 11.36 BVPS (SAR) - Adjusted 23.64 25.55 28.13 31.44 34.95 40.30 48.16 Market price (SAR)* 65.75 64.50 64.50 64.50 64.50 64.50 64.50 Market-Cap (SAR mn) 3,103.4 3,044.4 3,044.4 3,044.4 3,044.4 3,044.4 3,044.4 Dividend yield 2.3% 2.3% 2.3% 2.3% 2.3% 2.3% 2.3% P/E ratio (x) 16.96 18.35 14.08 11.09 10.48 7.96 5.68 P/BV ratio (x) 2.78 2.52 2.29 2.05 1.85 1.60 1.34
Source: Company financial reports & Aljazira Capital * We have taken respective Dec end prices for 2012, while for years 2013 & onwards we used closing price of 2nd July 2013.
Key financial data

18 © All rights reserved
Please read Disclaimer on the back
National Medical Care Company July 2013
Specialization in focus - “Overweight” Recommendation
• Limited operational coverage – National Medical Care Company (Care) is currently operating with two hospitals; both are located in Riyadh and owns a distribution company of medical supplies & medicine (pharmacy). Thus, this indicates the company’s core operational focus is limited to Riyadh. Based on the given information, the company’s two hospitals are functioning with 460 beds; where Riyadh Care Hospital (RHC) has 360 beds and remaining bed are in Riyadh National Hospital (RNH). Through these hospitals; the company, at present, is providing medical services in to treat several specialized diseases along with general illness.
• Expansion to increase existing facility – Based on the given expansion plans, the company is in a process to make the addition of 200 news beds in RNH by the end of 2013. Consequently, this will lead the total number of bed at the respective medical facility to 300; indicating the company’s total number of bed (RCH + RNH) to 660. Beside the given expansion, the company is in a process to open ‘family medical center’ which is expected to complete in late 2013.
• Focusing on differentiation startegy – Instead of increasing the operational exposure across the Kingdom, we believe, based on the given corporate vision, the company is committed to adopt specialization. It should be noted that, based on our industry analysis, the (above mentioned) expansion at National hospital (to make large-size hospital) is not a good strategic move (please refer to our thematic report of the sector; Porter’s generic competitive model). But; the successful increase in specialization (to treat particular disease) will help the company to strengthen its differentiation factor in term of quality physicians (a requirement for any specialized medical facility).
• Financial growth - We expect the completion of expansion at RNH will lead the company to post net profit of SAR124.9mn (EPS; SAR2.78); indicating YoY growth of 19.0%. Consequently, this will lead the company’s net profitability to increase at 2012-16CAGR of 18.2%; where, the revenue are expected to increase at a CAGR of 15.7% during 2012-16.
• Investment consideration - We used weighted average approach to arrive at a 12-month price target of SAR68.5/share. This indicates the stock, at a current market price of SAR59.25/share (as of 2nd July 2013), is offering a potential upside of 15.5% and trading at prospective 2013 PE and PBV of 21.3x and 4.3x, respectively. We, therefore, initiate our coverage on Care with ‘Overweight’ recommendation.
Key risks to valuationSince the industry has high immunity against the rapid change in economic environment so we believe the key risk associated with our valuation could be the company specific. Hence, we identified the following key risk associated with our valuation;
• Delay in expansions - The company’s growth in coming years is mainly based on the successful commencement of new medical units & expansion at the existing facility. Hence, any delay could lead us to make subsequent revision in our valuations and estimations.
• Failure to get recognition in specialization - As explained earlier the company’s expansion is not in-line with our industry strategic analysis (pplease refer to our KSA Helth care thematic report- Healthy Outlook for Health Investors). Hence, the failure to capture good standing among specialization would lead us to revisit the company’s future prospects.
Recommendation ‘Overweight’
12-month price target; SAR68.5
Current Price: SAR59.25
Upside / (downside): 15.50%
Reuters code: 4005.SEBloomberg code: CARE ABCountry: KSASector: Health carePrimary Listing: KSA exchangeM-Cap: SAR2,6.57.4mn52 Weeks H/L (SAR): 200.0 / 55.75
SARmn (unless specified) 2012 2013e 2014e 2015e 2016eRevenues 525 628 796 863 941 YoY Growth 14.5% 19.7% 26.8% 8.4% 9.0%Operating Profit 132 157 203 222 245 Growth % 8.4% 18.9% 29.6% 9.4% 10.3%Net Income 105 125 167 184 205 Growth % 10.8% 19.0% 34.1% 10.0% 11.0%EPS (SAR) 2.3 2.8 3.7 4.1 4.6 P/E N/A 21.3 15.9 14.4 13.0P/BV N/A 4.3 4.2 4.0 3.9EV/EBITDA N/A 16.5 12.5 11.1 9.8
Source: AlJazira Capital* Since the company listed on TASI in March 2013 so there is no price data prior to 2013, while for years 2013 & onwards we used closing price of 2nd July 2013.
Key information
Key financial indicators
54.0
56.0
58.0
60.0
62.0
64.0
66.0
68.0
70.0
72.0
6,950
7,000
7,050
7,100
7,150
7,200
7,250
7,300 TASI - LHS Care (SAR) - RHS
Ma
r 1
3
Ap
r 1
3
Ap
r 1
3
Ap
r 1
3
Ap
r 1
3
Ap
r 1
3
Ap
r 1
3
Ap
r 1
3
Ap
r 1
3
Ap
r 1
3
Ap
r 1
3
Ap
r 1
3
Ap
r 1
3
Ap
r 1
3
Ap
r 1
3
Ap
r 1
3
Ap
r 1
3
Ap
r 1
3
Ma
y 1
3
Ma
y 1
3
Ma
y 1
3
Ma
y 1
3
Ma
y 1
3
Ma
y 1
3
Ma
y 1
3
Ma
y 1
3
Ma
y 1
3
Ma
y 1
3
Ma
y 1
3
Ma
y 1
3
Ma
y 1
3
Ma
y 1
3
Ma
y 1
3
Ma
y 1
3
Ma
y 1
3
Ma
y 1
3
Ma
y 1
3
Price Chart
Initiation | KSA | Healthcare

19 © All rights reserved
Please read Disclaimer on the back
National Medical Care Company July 2013
Valuation summary
Our weighted average valuation approach is based on the combination the company’s net worth derived by applying DCF based valuation methodology and relative valuation technique (peer group TTM EV/EBITDA matrix); where 60% weight is assigned to DCF and 40% relative valuation technique (due to unavailability of the company’s relevant beta). It should be note that we used pure-play method to calculate the company’s beta for our valuation. Under this method, we used 2-years weekly betas of several local and international similar companies and calculated weighted average beta (based on their respective market capitalization).
Key variables estimations• Terminal growth rate is taken at 3.0%.• Beta is calculated at 0.80.• Risk free rate is taken at 2.7%. The calculation of RFR is based on the summation of• 10-year US government bond yield of 2.0%; and• Country default spread (CDS) of 0.7% for KSA, as per Damodaran’s Equity Risk Premium; determinants, estimations & implications -
March 2012 edition.• KSA total market risk premium (annual 2012) is taken at 13.15% from Bloomberg. Hence, the equity risk premium is calculated at
10.4%.• Capital Assets Pricing Model (CAPM) is used to calculate cost of equity at 11.1%.• Cost of debt is taken at 2.7%.• Weighted average cost of capital (WACC) is taken at 10.8%.
Based on the company’s peer group 2013 TTM-EV/EBITDA, we arrived at a relative valuation based 12-month price target of SAR71.0/ share.
By employing weighted average valuation approach, we arrived at a 12-month price target of SAR 68.5/share. This indicates the stock at current market price of SAR59.25/share (as of 2nd July 2013.) is offering a potential upside of 15.5% and trading at prospective 2013 PE and PBV of21.3x and 4.3x, respectively. We therefore, initiate our coverage on Care with ‘Overweight’ recommendation.
Based on the company’s peer group 2013 TTM-EV/EBITDA, we arrived at a relative valuation based 12-month price target of SAR84.8 per share.
All figures in SAR mn, unless specified 2012 2013e 2014e 2015e 2016eRevenues 525 628 796 863 941 EBITDA 132 157 203 222 245 Margin (%) 25.1% 25.0% 25.6% 25.8% 26.1%EBIT 111 133 178 196 218 Margin (%) 21.2% 21.1% 22.4% 22.7% 23.1%Net Income 105 125 167 184 205 Margin (%) 20.0% 19.9% 21.0% 21.4% 21.7%Cash from operations 119 171 223 249 280 Total assets 795 834 875 927 992 Shareholders' equity 610 623 639 658 678 Total liabilities & equity 795 834 875 927 992 Free Cash Flow Analysis (FCF)NOPLAT 98 120 163 179 200 Depriciation & amortization 28 30 30 31 33 Change in net working capital (17) 22 30 38 48 CAPEX (121) (30) (30) (31) (33)FCF (12) 142 193 217 247 Discount Factor 0.95 0.86 0.77 0.70 PV of FCF 135 166 168 173 Sum of PV of FCF 641 Terminal value 3,269 PV of Terminal value 2,284 Enterprise value 2,925 Add: Net debts 75 Total equity value 3,001 Shares (mn) 44.9 DCF based value (SAR/share) 66.9 Terminal growth 3.0%WACC 10.8%
Source: Aljazira capital research
All figures in SAR, unless specified Fair value Weights Weighted averageDCF based SOTP value 66.9 60% 40.1 Relative value 71.0 40% 28.4 Weighted average 12-month price target 68.5
Source: Aljazira capital
DCF based valuation methodology
Weighted average 12-month price target
All figures in SAR, unless specifiedSector EV/EBITDA 15.3 Implict enterprise value 3,109.7 Cash 107 Debt (32)Net worth of National Care 3,185.07 Shares (Mn) 44.9 Relative value (QAR/share) 71.0
Source: Aljazira capital
Relative valuation

20 © All rights reserved
Please read Disclaimer on the back
National Medical Care Company July 2013
National Medical Care Company - Operational overview
The company was founded in 2003; and, at present, it is operating with two hospitals and a medical supplies distribution company. By the end of 2012, the company’s hospitals were operating with 460 beds; of which RCH owned 360 and RNH owned the remaining. It should be noted that the company expanded its operational focus to pharmacy in 2011 following the establishment of its Care medicine and medical supplies distribution company.
Based on the given information, the company’s major corporate clients are i) Aramco, ii) GOSI, iii) MedGulf, iv) Tawuniya, v) Saudi Electric Company and vi) defense ministry.
The company went public and offered 13.5mn shares at SAR27.0/share (premium of SAR17.0/share) through an IPO completed in March 2013. At present, the company’s 38.3% shares are owned by the general public; where, the remainder is owned by Government Organization for Social Insurance (GOSI) and Fal Holding Arabia Company.
Riyadh Care Hospital (RCH)The hospital was established in 1991: and, at present, it is 100% owned by Care. The hospital, at present, is operating with 360 beds and has wide range of clinics like internal medicine, general & specialized surgery, pediatrics, obstetrics & gynecology, accidents & emergency, adult & pediatrics and radiology. The hospital’s inpatient department is mainly based on wide range of care units, operation rooms, laboratory and different wards.
Riyadh National Hospital (RNH)The facility is serving the nation since 1967 and was 100% owned by Care in 2003. The hospital, at present, has a capacity to accommodate around 100 beds; where, the key medical services provided by RNH are internal medicine, radiology, dental and surgery. On the other hand, the company’s internal department is based on emergency wards, laboratory, blood bank and care units for adults & children.
Care medicine and medical supplies distribution companyThe company was registered in KSA in 2011 and since then it is responsible for Care pharmacy operations and medical supplies.
Existing Organization Structure - 2012
Care shareholding pattern - 2012
Source: National Medical Care Company
Source: Tadawul & Zawya
ChairmanBoard of Directors
CEOMedicalAdvisor
LegalAdvisor
Internal AuditChief Internal Auditor
Strategy ManagementHead of Strategy &
Operational Excellence
Finance & AccountingCFO
Human ResourcesCHRO
Info & Comm. TechCIO
Bus Dev & MarketingDirector
Project ManagementDirector
Supply ChainDirector
Riyadh National Hospital(Business Unit)
Riyadh Care Hospital(Business Unit)
Pharmaceutical & MedicalDistribution Business
(Business Unit)
Family Health CareCenters
(Business Unit)
Care Services(Business Unit)
General public; 38.3%
GOSI; 35.1%
Fal Holdings ArabiaCompany; 26.6%

21 © All rights reserved
Please read Disclaimer on the back
National Medical Care Company July 2013
Expansion plan & our analysis
Strategic implicationAccording to the give expansion plan, the company expansion is mainly based on the i) addition of 200 new beds at RNH and iii) opening of new family medical unit. Although these projects are expected to complete in the 4Q-2013 but, in our view, both have different accounting and strategic implications;
i) The increase in number of beds at RNH will likely make positive impact on the company’s net profitability but strategically it is not so much attractive (considering our Porter’s generic competitive model). We believe the improvement in the company’s medical facilities could translate into better return as compared to the enlargement of existing hospital size.
ii) The expected opening of new ‘family medical center’ in 4Q-2013 will help the company to improve its specialization which will reflect positively on its differentiation factor. As explained in our industry’s strategic analysis that the increase in number of specialized clinics (inside the hospital) is acting as a multiplier to improve any medical set-up’s payoff between ‘cost & differentiation’. Thus, strengthening the differentiation factor of any particular hospital.
Operational implicationOn the other hand, based on our expectations, the completion of expansion at RNH will lead the company’s overall number of beds to 660 in 2016; indicating 2012-16CAGR of 9.4%. Simultaneously, the company’s overall (RCH+RNH) daily revenues per bed is expected to increase at 2012-16CAGR of 7.3% to SAR3,231.7. It should be noted that we have not incorporated the impact of ‘family medical center’ due to the availability of limited information on the same.
Growth in number of beds & revenue per bed– 2012-16
Source: Company annual reports and Aljazira Capital Research
878.2
720.7
964.1
1,056.6
1,163.4
650.0
750.0
850.0
950.0
1,050.0
1,150.0
1,250.0
0
100
200
300
400
500
600
700
2012 2013e 2014e 2015e 2016e
Number of beds - LHS
Beds
SAR
Revenues per bed (SAR'000') - RHS
Decline due to increase in number of beds; but, expected to improve 2013 onwards.

22 © All rights reserved
Please read Disclaimer on the back
National Medical Care Company July 2013
It should be noted that the expected improvement in gross margin along with operational efficiencies (on account of expected increase in specialization) will strengthen the company’s operating profitability margins. Consequently, the net profitability margin is expected to witness improvement and lead the company’s net profitability to increase at 2012-16CAGR of 18.2%; where we cannot ignore the impact of expansion at RNH. Furthermore, based on our expectation, the company’s ROAA and ROAE will continue to show improvement and reach 21.3% and 30.6% in 2016, respectively.
Financial implication
The expected increase in the company’s daily revenues/bed will lead the the company’s sales revenue to increase at 2012-16CAGR of 15.71% to SAR940.7mn in 2016; where, the company’s gross margins are expected to show improvement to 28.4% in 2016 as compared to 25.8% recorded in 2012. In addition, we expect the expansion of hospital segment will lead to dilute the contribution from pharmacy segment in overall sales revenue from 20.2% in 2012 to 13.5% in 2016.
Sales revenue growth - 2012-16
Net profitability growth
Source: Company’s annual report & Aljazira Capital
Source: Company annual reports, & Aljazira Capital
14.5%
19.7%
26.8%
8.4% 9.0%
0.0%
5.0%
10.0%
15.0%
20.0%
25.0%
30.0%
-
100.0
200.0
300.0
400.0
500.0
600.0
700.0
800.0
900.0
1,000.0
2012 2013e 2014e 2015e 2016e
Sales revenue (SARmn) - LHS Growth - RHS
10.8%
19.0%
34.1%
10.0%
11.0%
0.0%
5.0%
10.0%
15.0%
20.0%
25.0%
30.0%
35.0%
40.0%
-
50.0
100.0
150.0
200.0
250.0
2012 2013e 2014e 2015e 2016e
Sales revenue (SARmn) - LHS Net profit margin - RHS
Hospital services;
Pharmacy segment; 20.2%
Other sources; 2.9%
77.0%
Hospital services;
81.6%
Pharmacy segment; 13.5%
4.9%Other sources;
Sales revenue composition 2012
Sales revenue composition 2016e

23 © All rights reserved
Please read Disclaimer on the back
National Medical Care Company July 2013
Amount in SARmn, unless otherwise specified 2012 2013e 2014e 2015e 2016e Income statement Revenues 524.7 628.0 796.0 862.9 940.7 YoY growth 14.5% 19.7% 26.8% 8.4% 9.0% Cost (389.6) (464.6) (576.3) (621.4) (673.1) Gross profit 135.1 163.4 219.7 241.6 267.6 Selling & distribution expense (1.0) (1.0) (1.0) (1.0) (1.0) General & administration expense (30.1) (35.0) (45.3) (49.4) (53.9) Operating profit 104.0 127.3 173.4 191.1 212.6 YoY growth 9.3% 22.4% 36.2% 10.2% 11.3% Other income 7.4 5.4 4.8 4.9 5.0 Income before zakat 111.4 132.7 178.1 196.0 217.7 Zakat (6.4) (7.8) (10.7) (11.8) (13.1) Net income 105.0 124.9 167.5 184.3 204.6 YoY growth 10.8% 19.0% 34.1% 10.0% 11.0% Balance sheet Assets Cash & bank balance 72 107 147 198 262 Other current assets 263 267 268 269 271 Property & Equipment 245 248 248 248 249 Other non-current assets 214 212 212 211 211 Total assets 795 834 875 927 992 Liabilities & owners' equity Total current liabilities 117 143 172 210 257 Long-term loans 21 22 16 12 9 Total other non-current liabilities 46 46 47 47 48 Paid -up capital 381 449 449 449 449 Statutory reserves 42 55 71 90 110 General reserves 1.5 1.5 1.5 1.5 1.5 Dividend - - - - - Retained earnings 186 118 118 118 118 Total owners' equity 610 623 639 658 678 Total equity & liabilities 795 834 875 927 992 Cashflow statement - Operating activities 119 171 223 249 280 Investing activities (121) (24) (25) (26) (28) Financing activities (16) (112) (158) (171) (188) Change in cash (17.8) 36 40 51 64 Ending cash balance 72 107 147 198 262 Key fundamental ratios Liquidty ratios Current ratio (x) 2.9 2.6 2.4 2.2 2.1 Cash ratio (x) 0.7 1.0 1.2 1.5 1.7 Profitability ratios Gross profit margin 25.8% 26.0% 27.6% 28.0% 28.4% Operating margin 19.8% 20.3% 21.8% 22.1% 22.6% EBITDA margin 25.1% 25.0% 25.6% 25.8% 26.1% Net profit margin 20.0% 19.9% 21.0% 21.4% 21.7% Return on assets 14.2% 15.3% 19.6% 20.5% 21.3% Return on equity 18.1% 20.3% 26.5% 28.4% 30.6% Leverage ratio Debt / equity (x) 0.05 0.05 0.04 0.03 0.02 Market/valuation ratios EV/sales (x) n/a 4.11 3.18 2.87 2.56 EV/EBITDA (x) n/a 16.46 12.46 11.13 9.81 EPS (SAR) 2.34 2.78 3.73 4.11 4.56 BVPS (SAR) 16.01 13.88 14.25 14.67 15.12 Market price (SAR)* n/a 59.25 59.25 59.25 59.25 Market-Cap (SAR mn) n/a 2,657.4 2,657.4 2,657.4 2,657.4 Dividend yield n/a 4.2% 5.7% 6.2% 6.9% P/E ratio (x) n/a 21.28 15.87 14.42 12.99 P/BV ratio (x) n/a 4.27 4.16 4.04 3.92
Source: AlJazira Capital* Since the company listed on TASI in March 2013 so there is no price data prior to 2013, while for years 2013 & onwards we used closing price of 2nd July 2013.
Key financial data

RESE
ARC
H D
IVIS
ION
RESE
ARC
H
DIV
ISIO
NRA
TIN
GTE
RMIN
OLO
GY
BRO
KERA
GE A
ND IN
VEST
MEN
T CE
NTER
S DI
VISI
ON
Disclaimer
AlJazira Capital, the investment arm of Bank AlJazira, is a Shariaa Compliant Saudi Closed Joint Stock company and operating under the regulatory supervision of the Capital Market Authority. AlJazira Capital is licensed to conduct securities business in all securities business as authorized by CMA, including dealing, managing, arranging, advisory, and custody. AlJazira Capital is the continuation of a long success story in the Saudi Tadawul market, having occupied the market leadership position for several years. With an objective to maintain its market leadership position, AlJazira Capital is expanding its brokerage capabilities to offer further value-added services, brokerage across MENA and International markets, as well as offering a full suite of securities business.
1. Overweight: This rating implies that the stock is currently trading at a discount to its 12 months price target. Stocks rated “Overweight” will typically provide an upside potential of over 10% from the current price levels over next twelve months.
2. Underweight: This rating implies that the stock is currently trading at a premium to its 12 months price target. Stocks rated “Underweight” would typically decline by over 10% from the current price levels over next twelve months.
3. Neutral: The rating implies that the stock is trading in the proximate range of its 12 months price target. Stocks rated “Neutral” is expected to stagnate within +/- 10% range from the current price levels over next twelve months.
4. Suspension of rating or rating on hold (SR/RH): This basically implies suspension of a rating pending further analysis of a material change in the fundamentals of the company.
The purpose of producing this report is to present a general view on the company/economic sector/economic subject under research, and not to recommend a buy/sell/hold for any security or any other assets. Based on that, this report does not take into consideration the specific financial position of every investor and/or his/her risk appetite in relation to investing in the security or any other assets, and hence, may not be suitable for all clients depending on their financial position and their ability and willingness to undertake risks. It is advised that every potential investor seek professional advice from several sources concerning investment decision and should study the impact of such decisions on his/her financial/legal/tax position and other concerns before getting into such investments or liquidate them partially or fully. The market of stocks, bonds, macroeconomic or microeconomic are of a volatile nature and could witness sudden changes without any prior warning, therefore, the investor in securities or other assets might face some unexpected risks and fluctuations. All the information, views and expectations and fair values or target prices contained in this report have been compiled or arrived at by AlJazira Capital from sources believed to be reliable, but AlJazira Capital has not independently verified the contents obtained from these sources and such information may be condensed or incomplete. Accordingly, no representation or warranty, express or implied, is made as to, and no reliance should be placed on the fairness, accuracy, completeness or correctness of the information and opinions contained in this report. AlJazira Capital shall not be liable for any loss as that may arise from the use of this report or its contents or otherwise arising in connection therewith. The past performance of any investment is not an indicator of future performance. Any financial projections, fair value estimates or price targets and statements regarding future prospects contained in this document may not be realized. The value of the security or any other assets or the return from them might increase or decrease. Any change in currency rates may have a positive or negative impact on the value/return on the stock or securities mentioned in the report. The investor might get an amount less than the amount invested in some cases. Some stocks or securities maybe, by nature, of low volume/trades or may become like that unexpectedly in special circumstances and this might increase the risk on the investor. Some fees might be levied on some investments in securities. This report has been written by professional employees in AlJazira Capital, and they undertake that neither them, nor their wives or children hold positions directly in any listed shares or securities contained in this report during the time of publication of this report. This report has been produced independently and separately and no party (in-house or outside) who might have interest whether direct or indirect have seen the contents of this report. It should be also noted that the Research Division of AlJazira Capital had no information at the time of issuing this report regarding any conflict of interest between the company/companies mentioned in this report and any members of the board / executives / employees of AlJazira Capital or any of Bank AlJazira Group companies. No part of this document may be reproduced whether inside or outside the Kingdom of Saudi Arabia without the written permission of AlJazira Capital. Persons who receive this document should make themselves aware, of and adhere to, any such restrictions. By accepting this document, the recipient agrees to be bound by the foregoing limitations.
AGM - Head of ResearchAbdullah Alawi+966 2 [email protected]
Senior Analyst Syed Taimure Akhtar +966 2 6618271 [email protected]
Senior Analyst
Talha Nazar +966 2 [email protected]
Analyst
Saleh Al-Quati+966 2 [email protected]
Analyst
Jassim Al-Jubran +966 2 [email protected]
General Manager - Brokerage DivisionAla’a Al-Yousef+966 1 [email protected]
AGM-Head of international
and institutional brokerageLuay Jawad Al-Motawa +966 1 [email protected]
Regional Manager - West and South Regions
Abdullah Al-Misbahi+966 2 [email protected]
Sales And Investment Centers Central Region
Manger
Sultan Ibrahim AL-Mutawa +966 1 [email protected]
Area Manager - Qassim & Eastern Province
Abdullah Al-Rahit+966 6 [email protected]
Asset Management Brokerage Corporate Finance Custody Advisory
Head Office: Madinah Road, Mosadia، P.O. Box: 6277, Jeddah 21442, Saudi Arabia، Tel: 02 6692669 - Fax: 02 669 7761