Krider - Prioritizing Watersheds for PMP Placement
33
Prioritizing watersheds for BMP placement: southern Minnesota case study Lori Krider, PhD. Candidate Dr. Bruce Wilson, Professor Department of Bioproducts and Biosystems Engineering University of Minnesota
-
Upload
soil-and-water-conservation-society -
Category
Environment
-
view
276 -
download
6
Transcript of Krider - Prioritizing Watersheds for PMP Placement

Prioritizing watersheds for BMP placement: southern Minnesota
case studyLori Krider, PhD. Candidate
Dr. Bruce Wilson, Professor
Department of Bioproducts and Biosystems EngineeringUniversity of Minnesota
Water quality issues Agriculture and drainage Watershed approach Case study Mullenbach Two‐Stage Ditch
Stability and nitrates
Overview

Restoration vs. Protection
Basin Overview
stormwater.pca.state.mn.us

Minnesota River: CAFOs, fertilizer pollution, row crops, erosion Nitrates and sediment
Water Quality Issues in S MNEPA SPARROW, 2013 (mrbdc.mnsu.edu)
19.9 mil lbs/yr
18.2 mil lbs/yr
10.1 mil lbs/yr
(Mattteson & Baskfield, ND)
startribune.comWHY?‐climate change‐river bluffs‐agricultural practices
Minnesota River
Mississippi River

fws.gov
Types of Drainage SystemsSurface Drainage:Ditches ‐ remove standingwater (outlet for tiles)
Subsurface Drainage:“Tiles” ‐ remove water from soil

Why Drainage?
• Decreased maintenance of transportation• Increased crop yields• Increased land value• Reduced risk of malaria
Illinois had settlements abandoned because of malaria in 1830s
Fort Snelling: 66 cases per 1000 people per year (1829‐1838)
Palmer (1915):

Ditch Construction:Blue Earth, Brown, Le Sueur, & Nicollet County
0.00% 5.00% 10.00% 15.00% 20.00% 25.00% 30.00%
Prior to 1880
1900-1909
1920-1929
1940-1949
1960-1969
Quade et al., 1980
Above average precipitation ‐> greater ditch construction
Drought
First
Second

Changes in Row Crop Acreages A
crea
ge o
f Cro
ps (i
n th
ousa
nds)
Year
1870 1890 1910 1930 1950 1970 1990 20100
1000
2000
3000
4000
5000
6000
7000
8000
9000
Corn
Soybeans
Data Provided by Steven Taff
Increasing commodity prices and growing populations
100% yield increase
MN AESMN AES
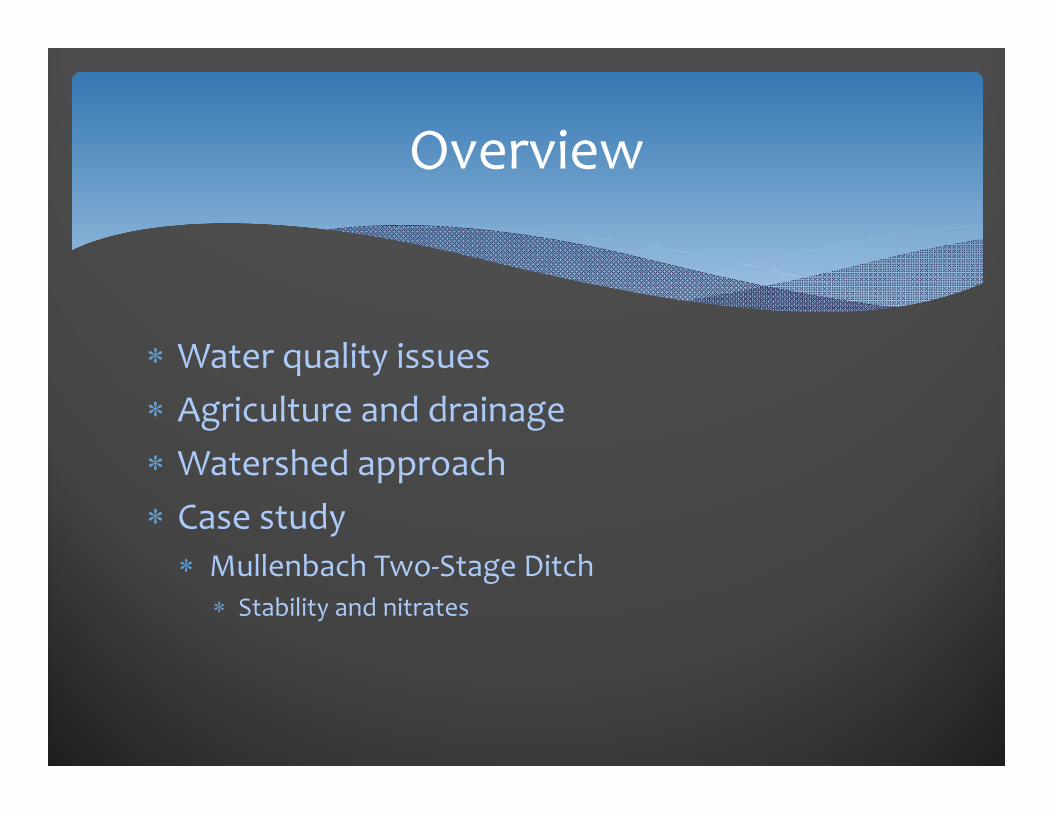
FertilityManure Application Rates:1930’s: 8 tons/ac, 1950’s: 6.2 tons/ac, 1970’s: 4 tons/ac(V. Cardwell)
More row crops ‐> less livestock
David Hansen
Constituents known and constant
Commercial Fertilizers:1950’s: 14%, 1960’s: 67% and 1979: 95%(V. Cardwell)
Year
1950 1970 1990 2010
N A
pplic
atio
n R
ates
(lb/
ac)
0
20
40
60
80
100
120
140
160Decrease in row spacing

Minnesota Pollution Control Agency (MPCA) Intensive Watershed Monitoring
Watershed Approachmpca.state.mn.us
Watershed Restoration and Protection Strategy (WRAPS)

Minnesota Pollution Control Agency Intensive Watershed Monitoring & WRAPS
Board of Water and Soil Resources (BWSR) Targeted Watersheds: grants to local governments 1 Watershed, 1 Plan: integration
Watershed Approach
bwsr.state.mn.us
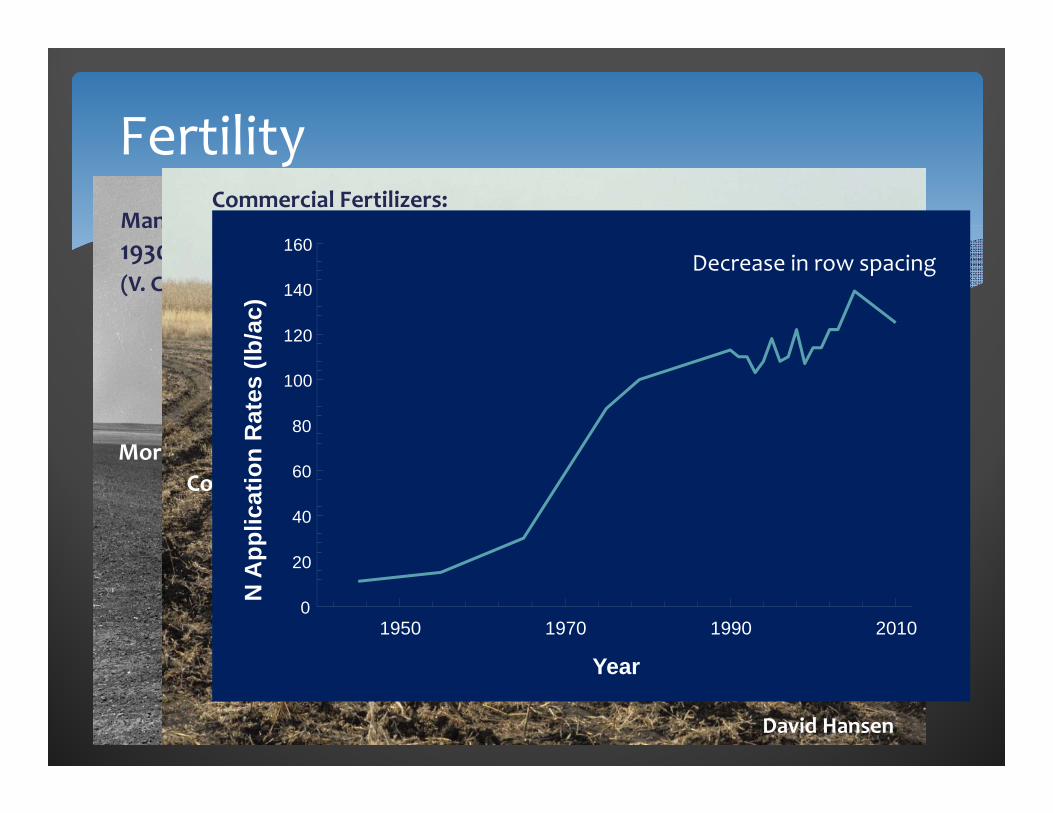
BMP Placement
Tomer, 2013Tomer, 2013
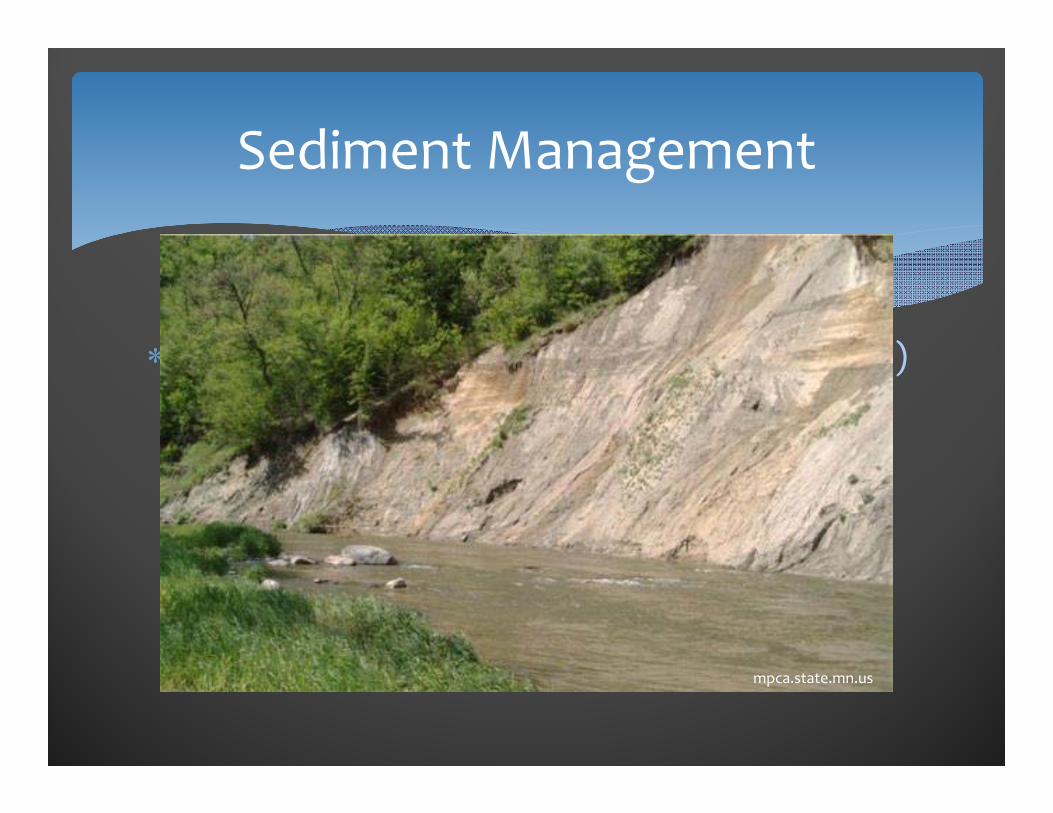
MPCA Sediment Reduction Strategy (Jan 2015) Minnesota and Lower Mississippi River
50 percent reduction by 2030 90 percent reduction by 2040
Sediment Management
mpca.state.mn.us
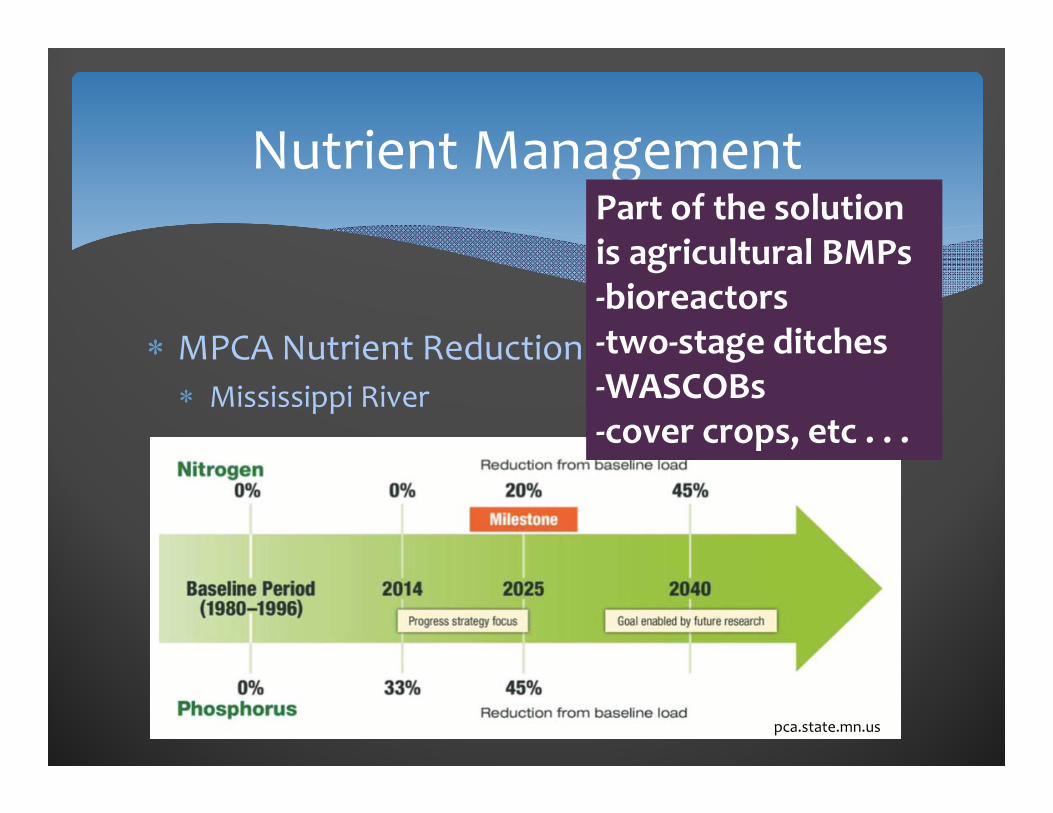
MPCA Nutrient Reduction Strategy (Sept 2014) Mississippi River
Nutrient Management
pca.state.mn.us
Part of the solution is agricultural BMPs‐bioreactors‐two‐stage ditches‐WASCOBs‐cover crops, etc . . .

Cedar River Watershed
Case Study
75% row crops

Mullenbach Two‐Stage Ditch Constructed Oct 2009
Kramer, 2011
Mower County
Case Study
Kramer, 2011
Funding: MPCAData: 2009 ‐ 2013
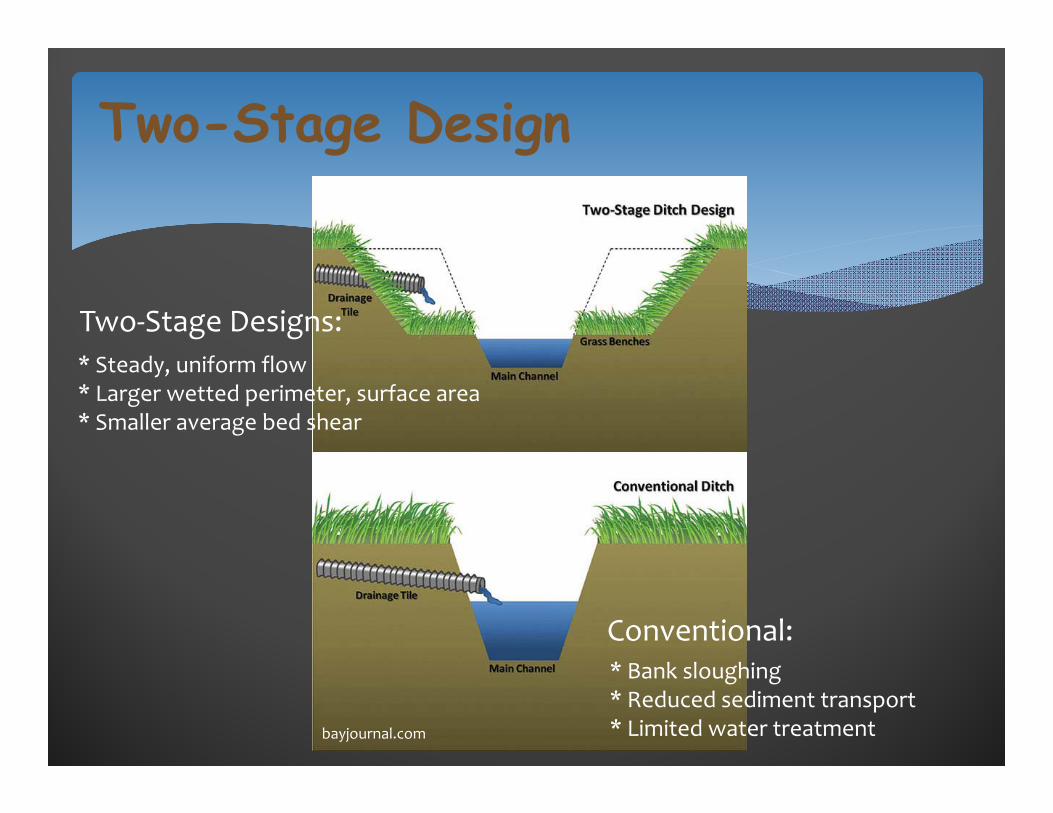
Two-Stage Design
bayjournal.com
* Bank sloughing* Reduced sediment transport* Limited water treatment
Conventional:
* Steady, uniform flow* Larger wetted perimeter, surface area* Smaller average bed shear
Two‐Stage Designs:

Natural Processes
Stage 1: Low Flow Channel
Stage 2: High Flow Channel
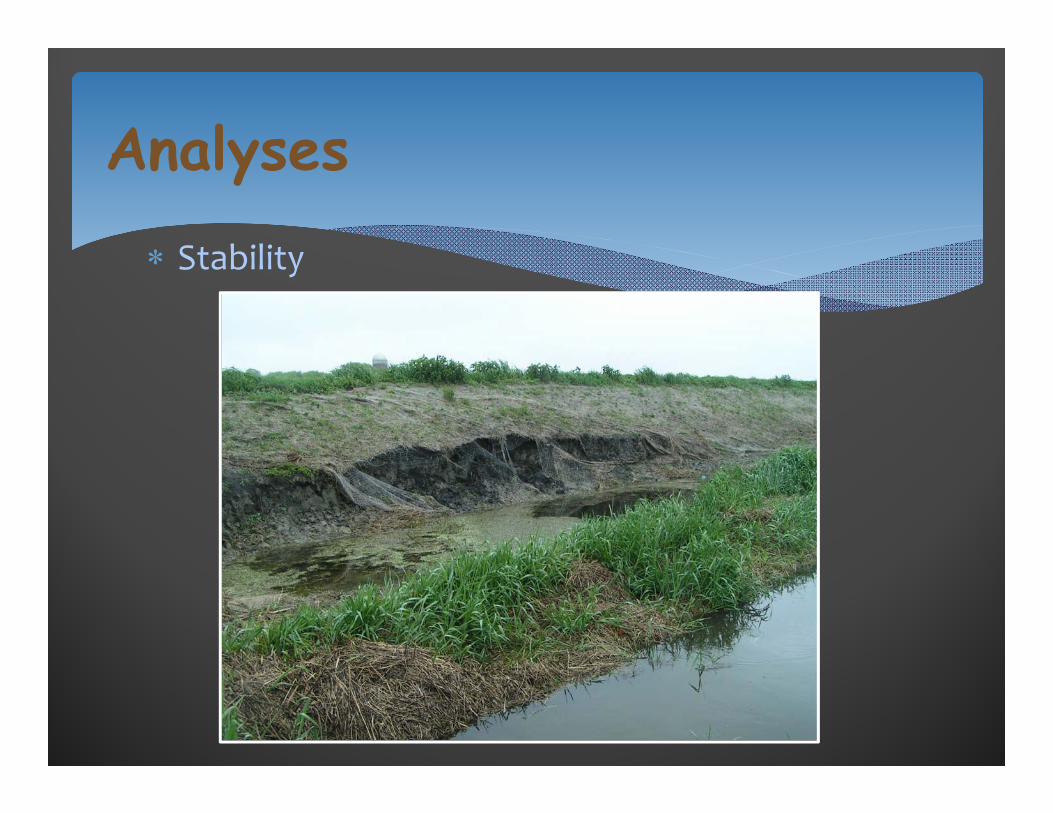
Stability
Analyses
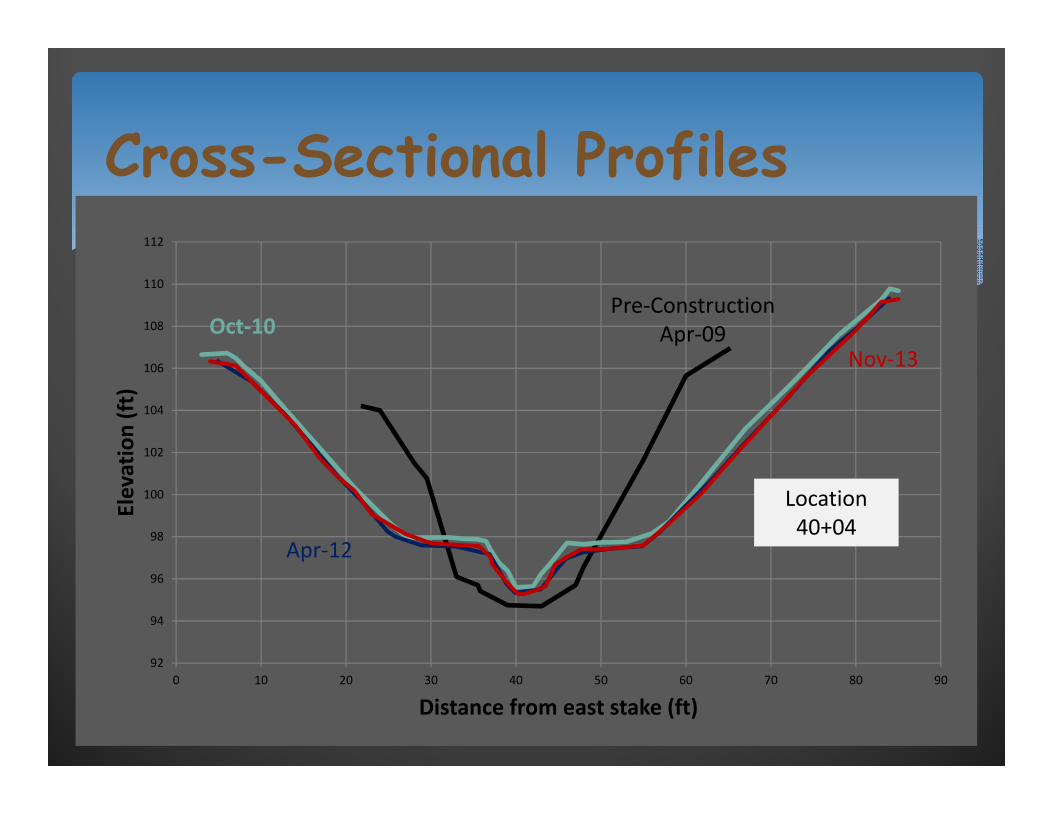
Cross-Sectional Profiles
92
94
96
98
100
102
104
106
108
110
112
0 10 20 30 40 50 60 70 80 90
Elevation (ft)
Distance from east stake (ft)
Location40+04
Pre‐ConstructionApr‐09Oct‐10
Apr‐12
Nov‐13

Cross-Sectional Surveys
0
2
4
6
8
10
12
14
300 600 900 1200 1800 2100 2400 2700 3000 3300 3600 4200 4500 4800 5100 5400 5700 6000
Chan
nel W
idth (f
t)
Station (ft)
Bankfull Width Increased by ~11% ‐ less active sediment supply
9092949698
100102104106108
0 1000 2000 3000 4000 5000 6000
Ele
vatio
n (ft
)
Channel Distance (ft)
bed riffle pool
9092949698
100102104
0 1000 2000 3000 4000 5000 6000
Ele
vatio
n (ft
)
Channel Distance (ft)
Pool BedRiffle
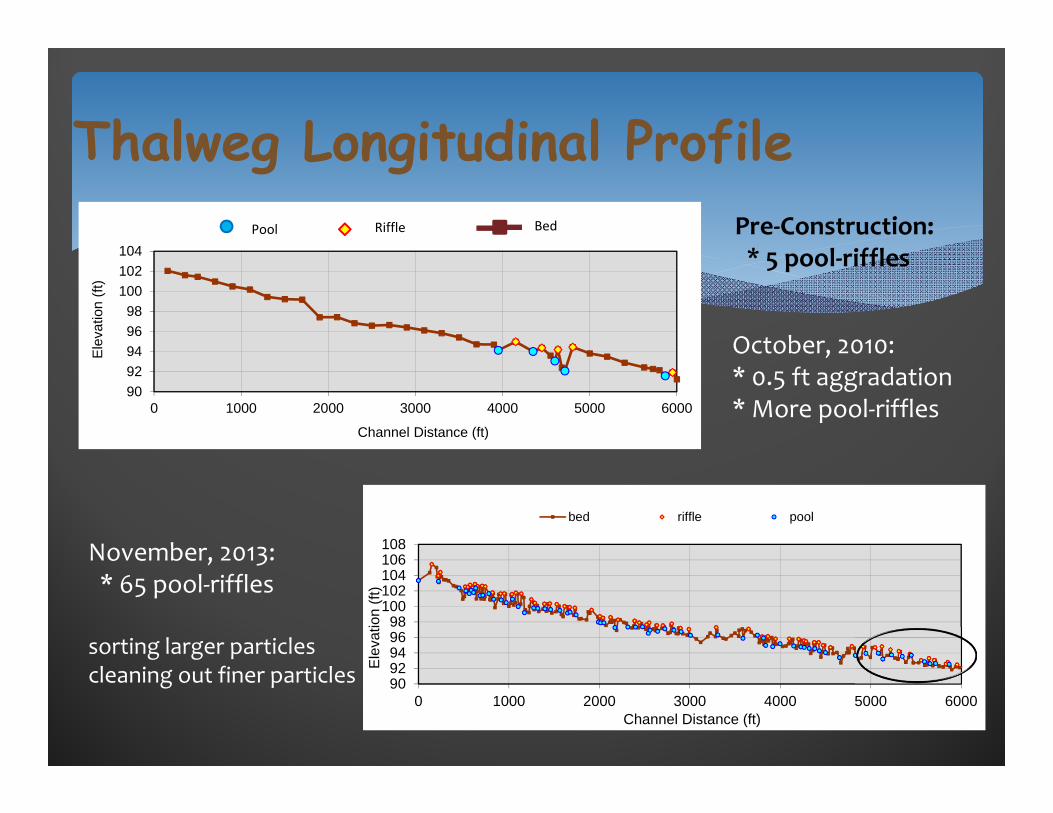
Thalweg Longitudinal ProfilePre‐Construction:* 5 pool‐riffles
November, 2013:* 65 pool‐riffles
sorting larger particlescleaning out finer particles
October, 2010:* 0.5 ft aggradation* More pool‐riffles

From Brenda DeZiel
Fish Community
Low DO Need sand/gravel DegradationFIBI: 44 ‐> 52.5 (+8.5)574 ‐> 1050 individuals

Daily nitrate and precipitation: April 27 – Oct 10, 2010
Nitrate Concentration
ΔC~ 4 mg/L

Nitrate Removal (denitrification)
• Mass balance (in‐stream)
• N2O laboratory
– Acetylene inhibition assay
– Sediment
Approaches:

Mass Balance Method
UpstreamQin
[N]in[δ18O]in
DownstreamQout
[N]out[δ18O]out
GroundwaterQgw
[N]gw[δ18O]gw
NremovedTiles
Qtile
[N]tile[δ18O]tile

August 3, 2010 – entire ditch length Groundwater δ18O and NO3 unknown
0
5
10
15
20
25
30
35
40
45
15 20 25 30 35 40
Percen
t Rem
oval of N
Groundwater NO3‐N Concentrations
Large Groundwater Contribution(δ18O= ‐9)
Modest Groundwater Contribution(δ18O= ‐10)
Mass Balance Results
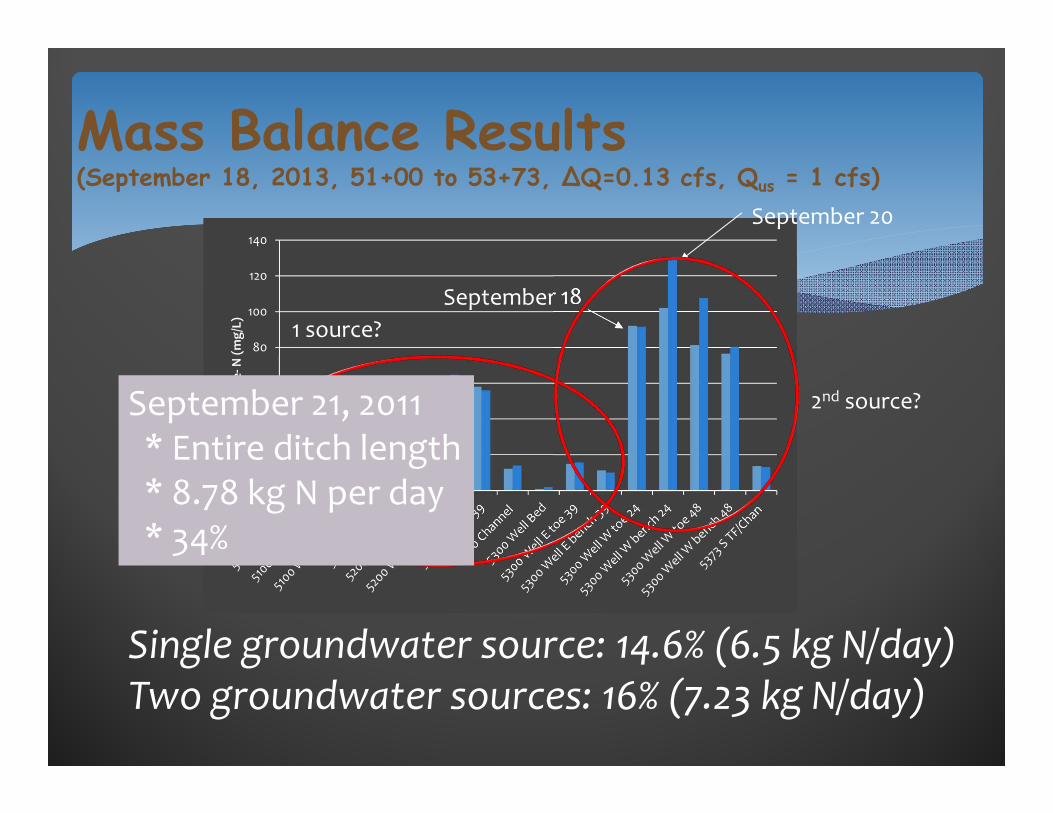
Mass Balance Results(September 18, 2013, 51+00 to 53+73, ΔQ=0.13 cfs, Qus = 1 cfs)
Single groundwater source: 14.6% (6.5 kg N/day) Two groundwater sources: 16% (7.23 kg N/day)
0
20
40
60
80
100
120
140Nitr
ate‐
N (m
g/L)
September 18
September 20
1 source?
2nd source?September 21, 2011* Entire ditch length* 8.78 kg N per day* 34%
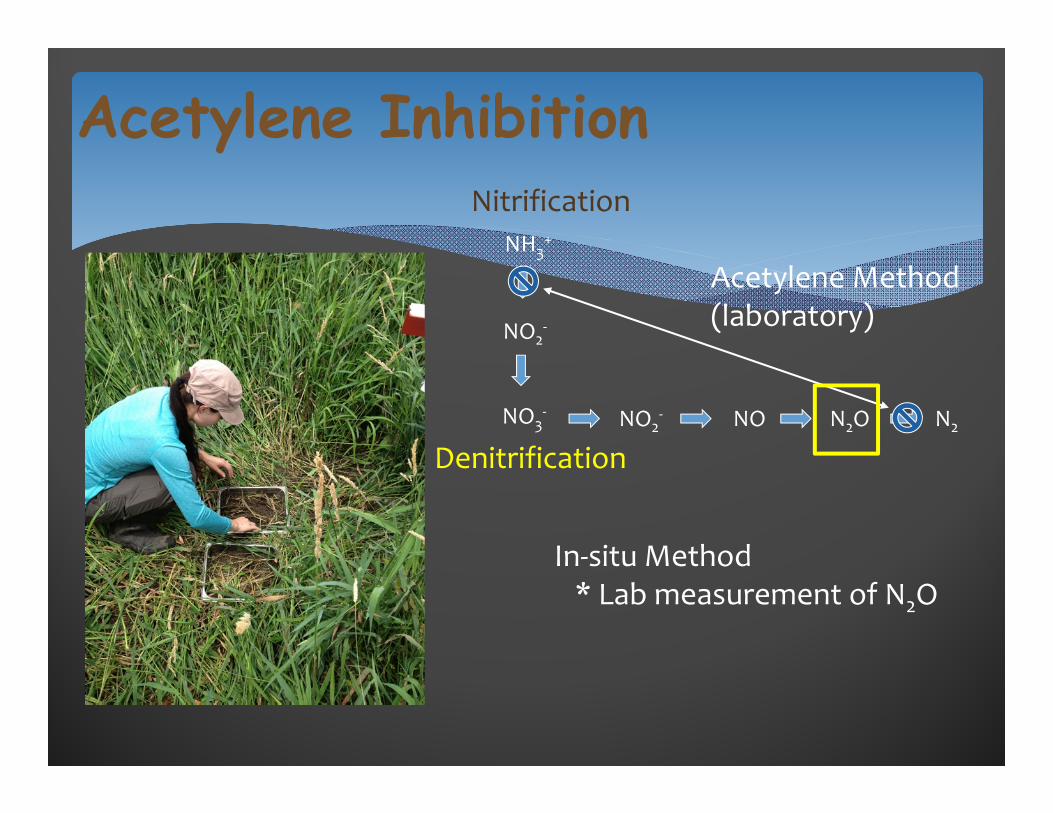
Acetylene InhibitionNitrification
NH3+
NO2‐
NO3‐
DenitrificationNO2
‐ NO N2O N2
Acetylene Method(laboratory)
In‐situ Method* Lab measurement of N2O
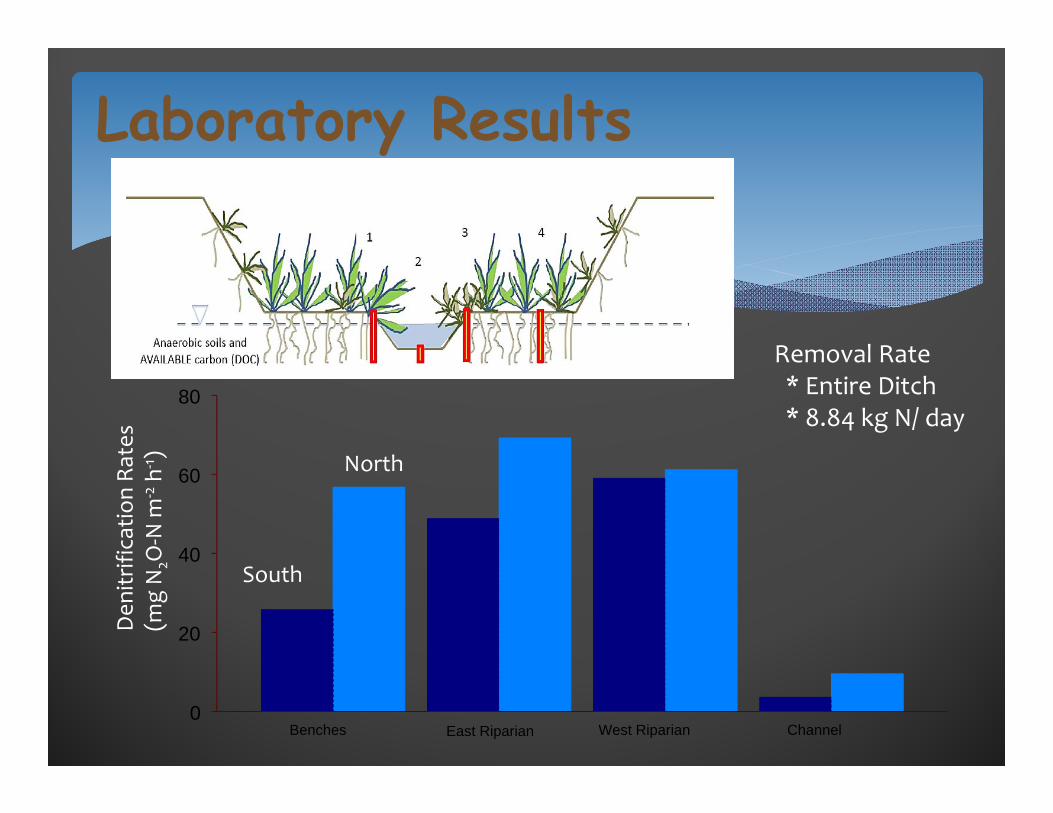
Laboratory Results
0
20
40
60
80
Benches East Riparian West Riparian Channel
Den
itrifica
tion Ra
tes
(mg N
2O‐N m
‐2h‐
1 )
South
North
Removal Rate* Entire Ditch* 8.84 kg N/ day
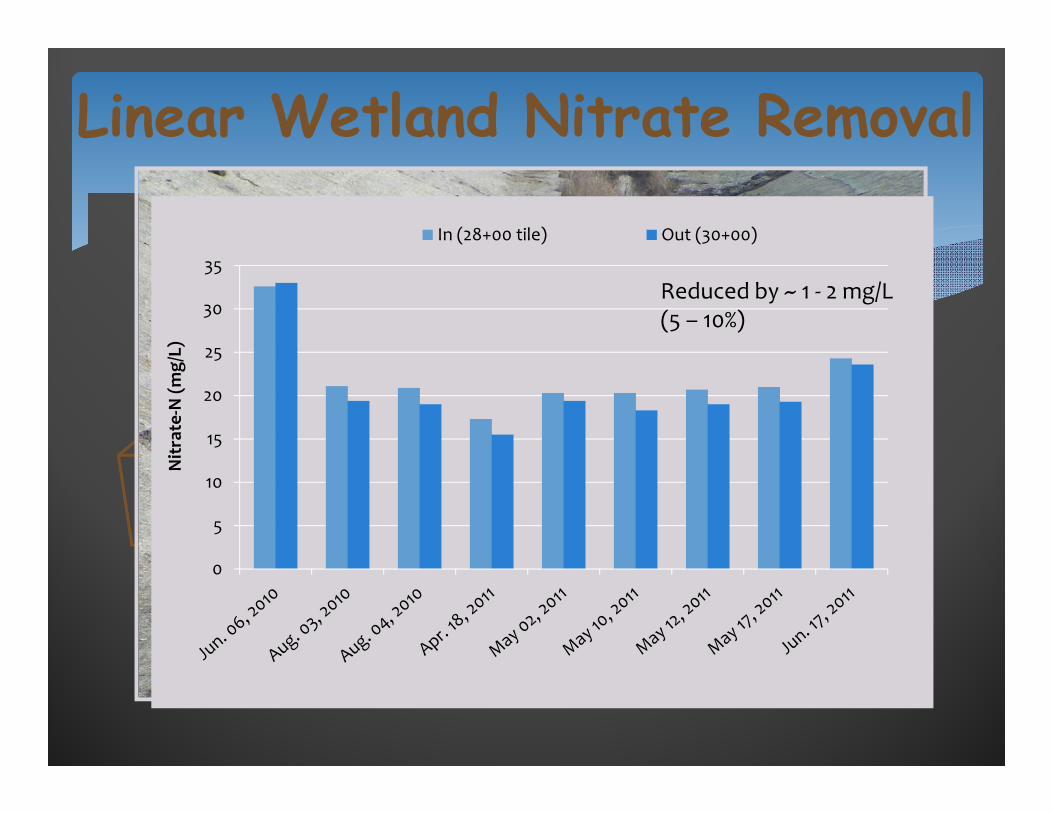
Linear Wetland Nitrate Removal
Enhanced Ditch Nitrogen Removal
200 ft
0
5
10
15
20
25
30
35
Nitr
ate‐N (m
g/L)
In (28+00 tile) Out (30+00)
Reduced by ~ 1 ‐ 2 mg/L(5 – 10%)
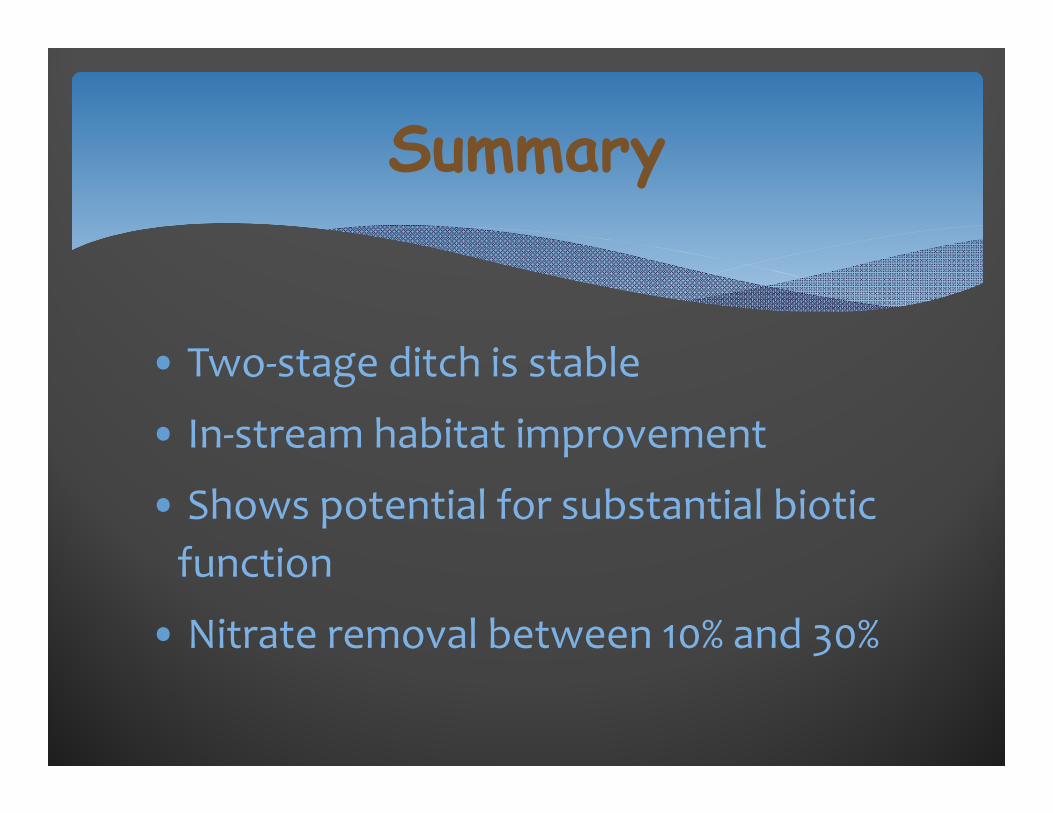
• Two‐stage ditch is stable
• In‐stream habitat improvement
• Shows potential for substantial biotic function
• Nitrate removal between 10% and 30%
Summary

Questions and Comments