KRAFT HEINZ REPORTS THIRD QUARTER 2020 RESULTS
18
Exhibit 99.1 Contacts: Michael Mullen (media) Christopher Jakubik, CFA (investors) [email protected] [email protected] KRAFT HEINZ REPORTS THIRD QUARTER 2020 RESULTS • Q3 net sales increased 6.0%; Organic Net Sales (1) increased 6.3% • Q3 gross profit increased 20.4% • Q3 operating income declined 2.8%, net income attributable to common shareholders decreased 33.7%, and diluted EPS decreased 33.8% due to charges related to the pending Cheese Transaction (2) • Adjusted EBITDA (1) increased 13.5% and Adjusted EPS (1) increased 1.4% • Full-year outlook raised to mid-single-digit Organic Net Sales (3) growth and high-single-digit Constant Currency Adjusted EBITDA (1)(3) growth PITTSBURGH & CHICAGO - October 29, 2020 - The Kraft Heinz Company (Nasdaq: KHC) (“Kraft Heinz” or the “Company”) today reported financial results for the third quarter of 2020 that reflected net sales growth across all six Consumer Platforms due to sustained at-home consumption momentum. “The continuation of our strong growth into the third quarter is a reflection of the agility we are creating as an organization and because of that, we are raising our outlook for the full year,” said Kraft Heinz CEO Miguel Patricio. “We are building momentum, and we are confidently optimistic about our near-term performance. We are heading into 2021 with our new operating model fully implemented, our platform strategy coming to life in the marketplace, and our growth investments ramping up. And although there are multiple future scenarios we must plan for and manage against, we are in a strong position to both accelerate and exceed the strategic plan we finalized earlier this year.” Net Sales In millions Net Sales Organic Net Sales (1) Growth September 26, 2020 September 28, 2019 % Chg vs PY YoY Growth Rate Price Volume/ Mix For the Three Months Ended United States (4) $ 4,710 $ 4,385 7.4 % 7.4 % 4.0 pp 3.4 pp International (4) 1,325 1,276 3.9 % 4.6 % 2.1 pp 2.5 pp Canada 406 415 (2.2)% (1.0)% 4.6 pp (5.6) pp Kraft Heinz $ 6,441 $ 6,076 6.0 % 6.3 % 3.7 pp 2.6 pp For the Nine Months Ended United States (4) $ 14,122 $ 13,142 7.5 % 7.5 % 2.9 pp 4.6 pp International (4) 3,931 3,874 1.5 % 5.7 % 2.2 pp 3.5 pp Canada 1,193 1,425 (16.3)% 1.0 % 0.1 pp 0.9 pp Kraft Heinz $ 19,246 $ 18,441 4.4 % 6.7 % 2.6 pp 4.1 pp 1
Transcript of KRAFT HEINZ REPORTS THIRD QUARTER 2020 RESULTS
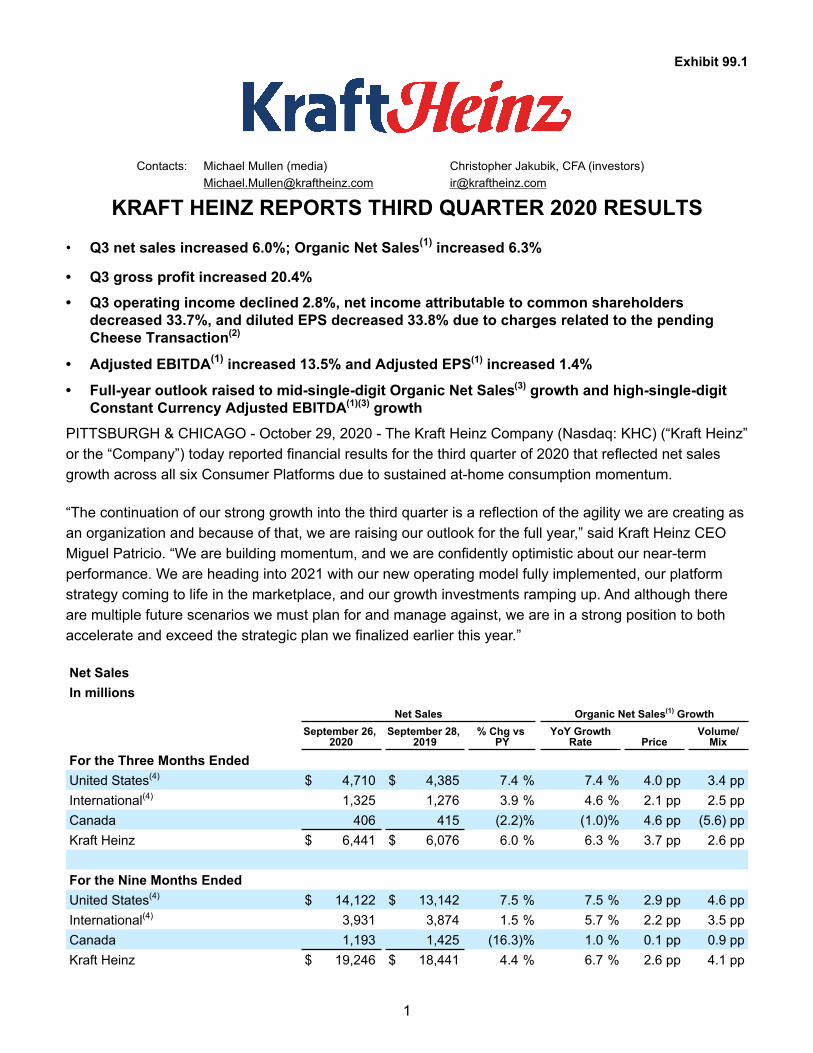
Exhibit 99.1
Contacts: Michael Mullen (media) Christopher Jakubik, CFA (investors)[email protected] [email protected]
KRAFT HEINZ REPORTS THIRD QUARTER 2020 RESULTS
• Q3 net sales increased 6.0%; Organic Net Sales(1) increased 6.3%
• Q3 gross profit increased 20.4%
• Q3 operating income declined 2.8%, net income attributable to common shareholders decreased 33.7%, and diluted EPS decreased 33.8% due to charges related to the pending Cheese Transaction(2)
• Adjusted EBITDA(1) increased 13.5% and Adjusted EPS(1) increased 1.4%
• Full-year outlook raised to mid-single-digit Organic Net Sales(3) growth and high-single-digit Constant Currency Adjusted EBITDA(1)(3) growth
PITTSBURGH & CHICAGO - October 29, 2020 - The Kraft Heinz Company (Nasdaq: KHC) (“Kraft Heinz” or the “Company”) today reported financial results for the third quarter of 2020 that reflected net sales growth across all six Consumer Platforms due to sustained at-home consumption momentum.
“The continuation of our strong growth into the third quarter is a reflection of the agility we are creating as an organization and because of that, we are raising our outlook for the full year,” said Kraft Heinz CEO Miguel Patricio. “We are building momentum, and we are confidently optimistic about our near-term performance. We are heading into 2021 with our new operating model fully implemented, our platform strategy coming to life in the marketplace, and our growth investments ramping up. And although there are multiple future scenarios we must plan for and manage against, we are in a strong position to both accelerate and exceed the strategic plan we finalized earlier this year.”
Net SalesIn millions
Net Sales Organic Net Sales(1) GrowthSeptember 26,
2020September 28,
2019% Chg vs
PYYoY Growth
Rate PriceVolume/
Mix
For the Three Months EndedUnited States(4) $ 4,710 $ 4,385 7.4 % 7.4 % 4.0 pp 3.4 ppInternational(4) 1,325 1,276 3.9 % 4.6 % 2.1 pp 2.5 ppCanada 406 415 (2.2) % (1.0) % 4.6 pp (5.6) ppKraft Heinz $ 6,441 $ 6,076 6.0 % 6.3 % 3.7 pp 2.6 pp
For the Nine Months EndedUnited States(4) $ 14,122 $ 13,142 7.5 % 7.5 % 2.9 pp 4.6 ppInternational(4) 3,931 3,874 1.5 % 5.7 % 2.2 pp 3.5 ppCanada 1,193 1,425 (16.3) % 1.0 % 0.1 pp 0.9 ppKraft Heinz $ 19,246 $ 18,441 4.4 % 6.7 % 2.6 pp 4.1 pp
1

Net Income/(Loss) Attributable to Common Shareholders and Diluted EPSIn millions, except per share data
For the Three Months Ended For the Nine Months EndedSeptember 26,
2020September 28,
2019% Chg vs
PYSeptember 26,
2020September 28,
2019% Chg vs
PY
Gross profit $ 2,344 $ 1,947 20.4 % $ 6,654 $ 6,040 10.2 %Operating income/(loss) 1,147 1,180 (2.8) % 578 2,476 (76.7) %Net income/(loss) attributable to common shareholders 597 899 (33.7) % (676) 1,753 (138.6) %Diluted EPS $ 0.49 $ 0.74 (33.8) % $ (0.55) $ 1.43 (138.5) %
Adjusted EPS(1) 0.70 0.69 1.4 % 2.09 2.13 (1.9) %Adjusted EBITDA(1) $ 1,667 $ 1,469 13.5 % $ 4,881 $ 4,500 8.5 %
Q3 2020 Financial Summary
• Net sales increased 6.0 percent versus the year-ago period to $6.4 billion, including an unfavorable 0.3 percentage point impact from currency. Organic Net Sales increased 6.3 percent despite a negative 1.2 percentage point impact from exiting the McCafé licensing agreement. Pricing was up 3.7 percentage points versus the prior year period, with positive pricing in each business segment. Higher pricing primarily resulted from reduced promotional activity compared to the year-ago period, with gains also reflecting planned pricing actions in select categories and markets and pricing to offset dairy inflation. Volume/mix was up 2.6 percentage points versus the year-ago period, driven by strong growth in retail, e-commerce, and club channels supported by continued growth of at-home consumption due, in part, to the COVID-19 pandemic. This growth more than offset lower but improving foodservice sales, and the negative impact from exiting the McCafé licensing agreement.
• Net income attributable to common shareholders decreased 33.7 percent versus the year-ago period to $597 million and Diluted EPS decreased to $0.49, down 33.8 percent versus the prior year driven by charges related to the pending Cheese Transaction(2) in the current period and a gain on sale of the Canadian natural cheese business in the year-ago period.
• Adjusted EPS increased to $0.70, up 1.4 percent versus the prior year as Adjusted EBITDA growth more than offset a higher effective tax rate, unfavorable changes in other income, and higher non-cash equity award compensation expenses versus the year-ago period.
• Adjusted EBITDA increased 13.5 percent versus the year-ago period to $1.7 billion, including an unfavorable 0.1 percentage point impact from currency. Excluding the impact of currency, Adjusted EBITDA growth was driven by pricing gains, volume growth, and favorable mix versus the year-ago period, as well as procurement savings in the United States. This growth more than offset higher variable compensation, unfavorable key commodity(5) costs, specifically in dairy, as well as increased marketing investment in the United States and incremental COVID-19-related operating expenses globally.
• Year-to-date net cash provided by operating activities increased to $3.3 billion, up 67.0% versus the comparable prior year period, primarily driven by Adjusted EBITDA growth, reduced cash outflows resulting from lower payments related to the timing of promotional activity, and favorable changes in inventory, primarily due to reduced inventory levels from COVID-19-related demand. Free Cash
2

Flow(1) for the first nine months of 2020 increased to $2.9 billion, up 107.8% versus the comparable prior year period, from a combination of the previously mentioned items and lower capital expenditures versus the prior year period.
Outlook
Based on performance to date, the Company believes mid-single-digit Organic Net Sales(3) growth and high-single-digit Constant Currency Adjusted EBITDA(3) growth versus the prior year period are reasonable expectations for fourth-quarter performance. This would result in mid-single-digit Organic Net Sales(3) growth and high-single-digit Constant Currency Adjusted EBITDA(3) growth for the full year.
End Notes(1) Organic Net Sales, Adjusted EBITDA, Constant Currency Adjusted EBITDA, Adjusted EPS, and Free Cash Flow are non-
GAAP financial measures. Please see discussion of non-GAAP financial measures and the reconciliations at the end of this press release for more information.
(2) In September 2020, the Company entered into a definitive agreement to sell certain assets in the Company’s global cheese businesses, as well as to license certain trademarks, for total consideration of approximately $3.3 billion, including $3.2 billion of cash consideration (the “Cheese Transaction”). The Company has allocated $1.5 billion of the total consideration to perpetual licenses that will be granted to the buyer for the Kraft and Velveeta brands. The Company has allocated the remainder of the total consideration, currently $1.8 billion, to the net assets to be transferred (the “Disposal Group”). The Company determined that the Disposal Group, which included allocated goodwill, had an aggregate carrying amount above its $1.8 billion estimated fair value. Accordingly, a non-cash impairment loss of $300 million was recorded in the third quarter of 2020. Upon closing of the Cheese Transaction, we may recognize a gain or loss, depending on a number of factors, including changes in the fair values of certain assets in the Disposal Group. Additionally, the license income related to the Kraft and Velveeta brands will be recognized in the future as a reduction to SG&A.
(3) Fourth quarter and 2020 full year guidance for Organic Net Sales and Constant Currency Adjusted EBITDA are provided on a non-GAAP basis only because certain information necessary to calculate the most comparable GAAP measure is unavailable due to the uncertainty and inherent difficulty of predicting the occurrence and the future financial statement impact of such items impacting comparability, including, but not limited to, the impact of currency, acquisitions and divestitures, integration and restructuring expenses, deal costs, unrealized losses/(gains) on commodity hedges, impairment losses, and equity award compensation expense, among other items. Therefore, as a result of the uncertainty and variability of the nature and amount of future adjustments, which could be significant, the Company is unable to provide a reconciliation of these measures without unreasonable effort.
(4) In the first quarter of 2020, the Company’s internal reporting and reportable segments changed. The Puerto Rico business was moved from the Latin America zone to the United States zone to consolidate and streamline the management of the Company's product categories and supply chain. The Company also combined its Europe, Middle East, and Africa (“EMEA”), Latin America, and Asia Pacific (“APAC”) zones to form the International zone. Therefore, effective in the first quarter of 2020, the Company manages and reports its operating results through three reportable segments defined by geographic region: United States, International, and Canada. The Company has reflected these changes in all historical periods presented.
(5) The Company's key commodities in the United States and Canada are dairy, meat, coffee and nuts.
Webcast Information
A webcast of The Kraft Heinz Company's third quarter 2020 earnings conference call will be available at ir.kraftheinzcompany.com. The call begins today at 8:30 a.m. Eastern Daylight Time.
3

ABOUT THE KRAFT HEINZ COMPANY
We are driving transformation at The Kraft Heinz Company (Nasdaq: KHC), inspired by our Purpose, Let’s Make Life Delicious. Consumers are at the center of everything we do. With 2019 net sales of approximately $25 billion, we are committed to growing our iconic and emerging food and beverage brands on a global scale. We leverage our scale and agility to unleash the full power of Kraft Heinz across a portfolio of six consumer-driven product platforms. As global citizens, we’re dedicated to making a sustainable, ethical impact while helping feed the world in healthy, responsible ways. Learn more about our journey by visiting www.kraftheinzcompany.com or following us on LinkedIn and Twitter.
4

Forward-Looking Statements
This press release contains a number of forward-looking statements. Words such as “plan,” "believe," "anticipate," "reflect," "invest," "make," "expect," "drive," “improve,” “intend,” "assess," "evaluate," “establish,” “focus,” “build,” “turn,” “expand,” “leverage,” "grow," "will," and variations of such words and similar future or conditional expressions are intended to identify forward-looking statements. Examples of forward-looking statements include, but are not limited to, statements regarding the Company's plans, impacts of accounting standards and guidance, costs and cost savings, legal matters, taxes, impairments, dividends, expectations, investments, innovations, opportunities, capabilities, execution, initiatives, pipeline, and growth. These forward-looking statements are not guarantees of future performance and are subject to a number of risks and uncertainties, many of which are difficult to predict and beyond the Company's control.
Important factors that may affect the Company's business and operations and that may cause actual results to differ materially from those in the forward-looking statements include, but are not limited to, the impact of COVID-19; operating in a highly competitive industry; the Company’s ability to correctly predict, identify, and interpret changes in consumer preferences and demand, to offer new products to meet those changes, and to respond to competitive innovation; changes in the retail landscape or the loss of key retail customers; changes in the Company's relationships with significant customers, suppliers and other business relationships; the Company’s ability to maintain, extend, and expand its reputation and brand image; the Company’s ability to leverage its brand value to compete against private label products; the Company’s ability to drive revenue growth in its key product categories, increase its market share, or add products that are in faster-growing and more profitable categories; product recalls or product liability claims; unanticipated business disruptions; the Company’s ability to identify, complete or realize the benefits from strategic acquisitions, alliances, divestitures, joint ventures or other investments; the Company’s ability to realize the anticipated benefits from prior or future streamlining actions to reduce fixed costs, simplify or improve processes, and improve its competitiveness; the Company’s ability to successfully execute its strategic initiatives; the impacts of the Company’s international operations; economic and political conditions in the United States and in various other nations where the Company does business; changes in the Company’s management team or other key personnel and the Company’s ability to hire or retain key personnel or a highly-skilled and diverse global workforce; risks associated with information technology and systems, including service interruptions, misappropriation of data or breaches of security; impacts of natural events in the locations in which we or the Company’s customers, suppliers, distributors, or regulators operate; the Company’s ownership structure; the Company’s indebtedness and ability to pay such indebtedness, as well as the Company's ability to comply with covenants under its debt instruments; the Company's liquidity, capital resources and capital expenditures, as well as its ability to raise capital; additional impairments of the carrying amounts of goodwill or other indefinite-lived intangible assets; foreign exchange rate fluctuations; volatility in commodity, energy, and other input costs; volatility in the market value of all or a portion of the commodity derivatives we use; increased pension, labor and people-related expenses; compliance with laws, regulations, and related interpretations and related legal claims or other regulatory enforcement actions, including additional risks and uncertainties related to any potential actions resulting from the Securities and Exchange Commission’s (“SEC”) ongoing investigation, as well as potential additional subpoenas, litigation, and regulatory proceedings; potential future material weaknesses in the Company's internal control over financial reporting or other deficiencies or the Company’s failure to maintain an effective system of internal controls; the Company’s failure to prepare and timely file its periodic reports; the Company’s
5

ability to protect intellectual property rights; tax law changes or interpretations; the impact of future sales of the Company's common stock in the public markets; the Company’s ability to continue to pay a regular dividend and the amounts of any such dividends; volatility of capital markets and other macroeconomic factors; a downgrade in the Company's credit rating; and other factors. For additional information on these and other factors that could affect the Company's forward-looking statements, see the Company's risk factors, as they may be amended from time to time, set forth in its filings with the SEC. The Company disclaims and does not undertake any obligation to update, revise or withdraw any forward-looking statement in this press release, except as required by applicable law or regulation.
6

Non-GAAP Financial Measures
The non-GAAP financial measures provided should be viewed in addition to, and not as an alternative for, results prepared in accordance with accounting principles generally accepted in the United States of America (“GAAP”) that are presented in this press release.
To supplement the financial information provided, the Company has presented Organic Net Sales, Adjusted EBITDA, Constant Currency Adjusted EBITDA, Adjusted EPS, and Free Cash Flow which are considered non-GAAP financial measures. The non-GAAP financial measures presented may differ from similarly titled non-GAAP financial measures presented by other companies, and other companies may not define these non-GAAP financial measures in the same way. These measures are not substitutes for their comparable GAAP financial measures, such as net sales, net income/(loss), diluted earnings per share, or other measures prescribed by GAAP, and there are limitations to using non-GAAP financial measures.
Management uses these non-GAAP financial measures to assist in comparing the Company's performance on a consistent basis for purposes of business decision making by removing the impact of certain items that management believes do not directly reflect the Company's underlying operations. Management believes that presenting the Company's non-GAAP financial measures (i.e., Organic Net Sales, Adjusted EBITDA, Constant Currency Adjusted EBITDA, Adjusted EPS, and Free Cash Flow) is useful to investors because it (i) provides investors with meaningful supplemental information regarding financial performance by excluding certain items, (ii) permits investors to view performance using the same tools that management uses to budget, make operating and strategic decisions, and evaluate historical performance, and (iii) otherwise provides supplemental information that may be useful to investors in evaluating the Company's results. The Company believes that the presentation of these non-GAAP financial measures, when considered together with the corresponding GAAP financial measures and the reconciliations to those measures, provides investors with additional understanding of the factors and trends affecting the Company's business than could be obtained absent these disclosures.
Organic Net Sales is defined as net sales excluding, when they occur, the impact of currency, acquisitions and divestitures, and a 53rd week of shipments. The Company calculates the impact of currency on net sales by holding exchange rates constant at the previous year's exchange rate, with the exception of highly inflationary subsidiaries, for which the Company calculates the previous year's results using the current year's exchange rate. Organic Net Sales is a tool that can assist management and investors in comparing the Company's performance on a consistent basis by removing the impact of certain items that management believes do not directly reflect the Company's underlying operations.
7

Adjusted EBITDA is defined as net income/(loss) from continuing operations before interest expense, other expense/(income), provision for/(benefit from) income taxes, and depreciation and amortization (excluding integration and restructuring expenses); in addition to these adjustments, the Company excludes, when they occur, the impacts of integration and restructuring expenses, deal costs, unrealized losses/(gains) on commodity hedges, impairment losses, and equity award compensation expense (excluding integration and restructuring expenses). The Company also presents Adjusted EBITDA on a constant currency basis. The Company calculates the impact of currency on Adjusted EBITDA by holding exchange rates constant at the previous year's exchange rate, with the exception of highly inflationary subsidiaries, for which it calculates the previous year's results using the current year's exchange rate. Adjusted EBITDA and Constant Currency Adjusted EBITDA are tools that can assist management and investors in comparing the Company's performance on a consistent basis by removing the impact of certain items that management believes do not directly reflect the Company's underlying operations.
Adjusted EPS is defined as diluted earnings per share excluding, when they occur, the impacts of integration and restructuring expenses, deal costs, unrealized losses/(gains) on commodity hedges, impairment losses, losses/(gains) on the sale of a business, other losses/(gains) related to acquisitions and divestitures (e.g., tax and hedging impacts), nonmonetary currency devaluation (e.g., remeasurement gains and losses), debt prepayment and extinguishment costs, and U.S. Tax Reform discrete income tax expense/(benefit), and including when they occur, adjustments to reflect preferred stock dividend payments on an accrual basis. The Company believes Adjusted EPS provides important comparability of underlying operating results, allowing investors and management to assess operating performance on a consistent basis.
Free Cash Flow is defined as net cash provided by/(used for) operating activities less capital expenditures. The Company believes Free Cash Flow provides a measure of the Company's core operating performance, the cash-generating capabilities of the Company's business operations, and is one factor used in determining the amount of cash available for debt repayments, dividends, acquisitions, share repurchases, and other corporate purposes. The use of this non-GAAP measure does not imply or represent the residual cash flow for discretionary expenditures since the Company has certain non-discretionary obligations such as debt service that are not deducted from the measure.
See the attached schedules for supplemental financial data, which includes the financial information, the non-GAAP financial measures and corresponding reconciliations to the comparable GAAP financial measures for the relevant periods.
8

Schedule 1The Kraft Heinz Company
Condensed Consolidated Statements of Income(in millions, except per share data)
(Unaudited)For the Three Months Ended For the Nine Months Ended
September 26, 2020
September 28, 2019
September 26, 2020
September 28, 2019
Net sales $ 6,441 $ 6,076 $ 19,246 $ 18,441 Cost of products sold 4,097 4,129 12,592 12,401
Gross profit 2,344 1,947 6,654 6,040 Selling, general and administrative expenses, excluding impairment losses 897 762 2,677 2,341 Goodwill impairment losses 300 — 2,343 744 Intangible asset impairment losses — 5 1,056 479 Selling, general and administrative expenses 1,197 767 6,076 3,564 Operating income/(loss) 1,147 1,180 578 2,476
Interest expense 314 398 1,066 1,035 Other expense/(income) (73) (380) (232) (893)
Income/(loss) before income taxes 906 1,162 (256) 2,334 Provision for/(benefit from) income taxes 308 264 417 584
Net income/(loss) 598 898 (673) 1,750 Net income/(loss) attributable to noncontrolling interest 1 (1) 3 (3)
Net income/(loss) attributable to common shareholders $ 597 $ 899 $ (676) $ 1,753
Basic shares outstanding 1,223 1,221 1,222 1,220 Diluted shares outstanding 1,229 1,223 1,222 1,223
Per share data applicable to common shareholders:
Basic earnings/(loss) per share $ 0.49 $ 0.74 $ (0.55) $ 1.44 Diluted earnings/(loss) per share 0.49 0.74 (0.55) 1.43
9

Schedule 2The Kraft Heinz Company
Reconciliation of Net Sales to Organic Net Sales For the Three Months Ended
(dollars in millions) (Unaudited)
Net Sales Currency
Acquisitions and
DivestituresOrganic Net
Sales Price Volume/Mix
September 26, 2020United States $ 4,710 $ — $ — $ 4,710 International 1,325 (4) — 1,329 Canada 406 (4) — 410
$ 6,441 $ (8) $ — $ 6,449
September 28, 2019United States $ 4,385 $ — $ — $ 4,385 International 1,276 6 — 1,270 Canada 415 — 1 414
$ 6,076 $ 6 $ 1 $ 6,069
Year-over-year growth ratesUnited States 7.4 % 0.0 pp 0.0 pp 7.4 % 4.0 pp 3.4 ppInternational 3.9 % (0.7) pp 0.0 pp 4.6 % 2.1 pp 2.5 ppCanada (2.2) % (1.0) pp (0.2) pp (1.0) % 4.6 pp (5.6) ppKraft Heinz 6.0 % (0.3) pp 0.0 pp 6.3 % 3.7 pp 2.6 pp
10

Schedule 3The Kraft Heinz Company
Reconciliation of Net Sales to Organic Net Sales For the Nine Months Ended
(dollars in millions) (Unaudited)
Net Sales Currency
Acquisitions and
DivestituresOrganic Net
Sales Price Volume/Mix
September 26, 2020United States $ 14,122 $ — $ — $ 14,122 International 3,931 (128) — 4,059 Canada 1,193 (25) — 1,218
$ 19,246 $ (153) $ — $ 19,399
September 28, 2019United States $ 13,142 $ — $ — $ 13,142 International 3,874 20 13 3,841 Canada 1,425 — 219 1,206
$ 18,441 $ 20 $ 232 $ 18,189
Year-over-year growth ratesUnited States 7.5 % 0.0 pp 0.0 pp 7.5 % 2.9 pp 4.6 ppInternational 1.5 % (3.8) pp (0.4) pp 5.7 % 2.2 pp 3.5 ppCanada (16.3) % (1.8) pp (15.5) pp 1.0 % 0.1 pp 0.9 ppKraft Heinz 4.4 % (0.9) pp (1.4) pp 6.7 % 2.6 pp 4.1 pp
11

Schedule 4The Kraft Heinz Company
Reconciliation of Net Income/(Loss) to Adjusted EBITDA(dollars in millions)
(Unaudited)For the Three Months Ended For the Nine Months Ended
September 26, 2020
September 28, 2019
September 26, 2020
September 28, 2019
Net income/(loss) $ 598 $ 898 $ (673) $ 1,750 Interest expense 314 398 1,066 1,035 Other expense/(income) (73) (380) (232) (893) Provision for/(benefit from) income taxes 308 264 417 584
Operating income/(loss) 1,147 1,180 578 2,476 Depreciation and amortization (excluding integration and restructuring expenses) 232 243 722 730 Integration and restructuring expenses 8 15 12 56 Deal costs 9 6 9 19 Unrealized losses/(gains) on commodity hedges (70) 9 47 (30) Impairment losses 300 5 3,399 1,223 Equity award compensation expense (excluding integration and restructuring expenses) 41 11 114 26
Adjusted EBITDA $ 1,667 $ 1,469 $ 4,881 $ 4,500
Segment Adjusted EBITDA:United States $ 1,363 $ 1,160 $ 4,050 $ 3,556 International 277 260 797 765 Canada 103 107 268 371 General corporate expenses (76) (58) (234) (192)
Adjusted EBITDA $ 1,667 $ 1,469 $ 4,881 $ 4,500
12

Schedule 5The Kraft Heinz Company
Reconciliation of Adjusted EBITDA to Constant Currency Adjusted EBITDAFor the Three Months Ended
(dollars in millions)(Unaudited)
Adjusted EBITDA CurrencyConstant Currency Adjusted EBITDA
September 26, 2020United States $ 1,363 $ — $ 1,363 International 277 3 274 Canada 103 (2) 105 General corporate expenses (76) — (76)
$ 1,667 $ 1 $ 1,666
September 28, 2019United States $ 1,160 $ — $ 1,160 International 260 2 258 Canada 107 — 107 General corporate expenses (58) — (58)
$ 1,469 $ 2 $ 1,467
Year-over-year growth ratesUnited States 17.5 % 0.0 pp 17.5 %International 6.6 % (0.2) pp 6.8 %Canada (3.9) % (0.9) pp (3.0) %General corporate expenses 31.6 % 0.9 pp 30.7 %Kraft Heinz 13.5 % (0.1) pp 13.6 %
13

Schedule 6The Kraft Heinz Company
Reconciliation of Adjusted EBITDA to Constant Currency Adjusted EBITDAFor the Nine Months Ended
(dollars in millions)(Unaudited)
Adjusted EBITDA CurrencyConstant Currency Adjusted EBITDA
September 26, 2020United States $ 4,050 $ — $ 4,050 International 797 (17) 814 Canada 268 (7) 275 General corporate expenses (234) 1 (235)
$ 4,881 $ (23) $ 4,904
September 28, 2019United States $ 3,556 $ — $ 3,556 International 765 9 756 Canada 371 — 371 General corporate expenses (192) — (192)
$ 4,500 $ 9 $ 4,491
Year-over-year growth ratesUnited States 13.9 % 0.0 pp 13.9 %International 4.1 % (3.6) pp 7.7 %Canada (27.7) % (1.8) pp (25.9) %General corporate expenses 22.0 % (0.2) pp 22.2 %Kraft Heinz 8.5 % (0.7) pp 9.2 %
14

Schedule 7The Kraft Heinz Company
Reconciliation of Diluted EPS to Adjusted EPS(Unaudited)
For the Three Months Ended For the Nine Months EndedSeptember 26,
2020September 28,
2019September 26,
2020September 28,
2019
Diluted EPS $ 0.49 $ 0.74 $ (0.55) $ 1.43 Integration and restructuring expenses(a) 0.01 0.01 0.01 0.04 Deal costs(b) — 0.01 — 0.01 Unrealized losses/(gains) on commodity hedges(c) (0.04) 0.01 0.03 (0.02) Impairment losses(d) 0.24 — 2.60 0.90 Losses/(gains) on sale of business(e) — (0.13) — (0.29) Nonmonetary currency devaluation(f) — — — 0.01 Debt prepayment and extinguishment costs(g) — 0.05 0.07 0.05 U.S. Tax Reform discrete income tax expense/(benefit)(h) — — (0.07) —
Adjusted EPS $ 0.70 $ 0.69 $ 2.09 $ 2.13
(a) Gross expenses included in integration and restructuring expenses were $9 million ($7 million after-tax) for the three months and $13 million ($10 million after-tax) for the nine months ended September 26, 2020 and $15 million ($15 million after-tax) for the three months and $56 million ($44 million after-tax) for the nine months ended September 28, 2019 and were recorded in the following income statement line items:• Cost of products sold included income of $3 million for the three months and $4 million for the nine months ended September 26,
2020 and expenses of $12 million for the three months and $27 million for the nine months ended September 28, 2019;• SG&A included expenses of $11 million for three months and $16 million for the nine months ended September 26, 2020 and $3
million for the three months and $29 million for the nine months ended September 28, 2019; and• Other expense/(income) included expenses of $1 million for the three and nine months ended September 26, 2020.
(b) Gross expenses included in deal costs were $9 million ($7 million after-tax) for the three and nine months ended September 26, 2020 and $6 million ($7 million after-tax) for the three months and $19 million ($18 million after-tax) for the nine months ended September 28, 2019 and were recorded in SG&A.
(c) Gross expenses/(income) included in unrealized losses/(gains) on commodity hedges were income of $70 million ($54 million after-tax) for the three months and expenses of $47 million ($35 million after-tax) for the nine months ended September 26, 2020 and expenses of $9 million ($7 million after-tax) for the three months and income of $30 million ($22 million after-tax) for the nine months ended September 28, 2019 and were recorded in cost of products sold.
(d) Gross impairment losses, which were recorded in SG&A, included the following:• Goodwill impairment losses of $300 million ($300 million after-tax) for the three months and $2.3 billion ($2.3 billion after-tax) for
the nine months ended September 26, 2020 and $744 million ($717 million after-tax) for the nine months ended September 28, 2019; and
• Intangible asset impairment losses of $1.1 billion ($829 million after-tax) for the nine months ended September 26, 2020 and $5 million ($7 million after-tax) for the three months and $479 million ($381 million after-tax) for the nine months ended September 28, 2019.
(e) Gross expenses/(income) included in losses/(gains) on sale of business were expenses of $2 million ($2 million after-tax) for the nine months ended September 26, 2020 and income of $244 million ($158 million after-tax) for the three months and $490 million ($348 million after-tax) for the nine months ended September 28, 2019 and were recorded in other expense/(income).
(f) Gross expenses included in nonmonetary currency devaluation were $2 million ($2 million after-tax) for the three months and $6 million ($6 million after-tax) for the nine months ended September 26, 2020 and $4 million ($4 million after-tax) for the three months and $10 million ($10 million after-tax) for the nine months ended September 28, 2019 and were recorded in other expense/(income).
(g) Gross expenses included in debt prepayment and extinguishment costs were $109 million ($82 million after-tax) for the nine months ended September 26, 2020 and $88 million ($62 million after-tax) for the three and nine months ended September 28, 2019 and were recorded in interest expense.
(h) U.S. Tax Reform discrete income tax expense/(benefit) was a benefit of $81 million for the nine months ended September 26, 2020. The benefit primarily relates to the revaluation of our deferred tax balances due to changes in state tax laws following U.S. Tax Reform and subsequent clarification or interpretation of state tax laws.
15

Schedule 8The Kraft Heinz Company
Condensed Consolidated Balance Sheets(in millions, except per share data)
(Unaudited) September 26, 2020 December 28, 2019
ASSETSCash and cash equivalents $ 2,720 $ 2,279 Trade receivables, net 1,979 1,973 Inventories 2,661 2,721 Prepaid expenses 382 384 Other current assets 401 618 Assets held for sale 1,922 122
Total current assets 10,065 8,097 Property, plant and equipment, net 6,558 7,055 Goodwill 32,861 35,546 Intangible assets, net 46,418 48,652 Other non-current assets 2,220 2,100
TOTAL ASSETS $ 98,122 $ 101,450 LIABILITIES AND EQUITY
Commercial paper and other short-term debt $ 6 $ 6 Current portion of long-term debt 529 1,022 Trade payables 4,052 4,003 Accrued marketing 1,001 647 Interest payable 333 384 Other current liabilities 1,755 1,804 Liabilities held for sale 18 9
Total current liabilities 7,694 7,875 Long-term debt 27,882 28,216 Deferred income taxes 11,461 11,878 Accrued postemployment costs 250 273 Other non-current liabilities 1,496 1,459
TOTAL LIABILITIES 48,783 49,701 Redeemable noncontrolling interest (2) — Equity: Common stock, $0.01 par value 12 12 Additional paid-in capital 55,544 56,828 Retained earnings/(deficit) (3,739) (3,060) Accumulated other comprehensive income/(losses) (2,258) (1,886) Treasury stock, at cost (341) (271)
Total shareholders' equity 49,218 51,623 Noncontrolling interest 123 126
TOTAL EQUITY 49,341 51,749 TOTAL LIABILITIES AND EQUITY $ 98,122 $ 101,450
16

Schedule 9The Kraft Heinz Company
Condensed Consolidated Statements of Cash Flow(in millions)(Unaudited)
For the Nine Months Ended
September 26,
2020September 28,
2019
CASH FLOWS FROM OPERATING ACTIVITIES:Net income/(loss) $ (673) $ 1,750 Adjustments to reconcile net income/(loss) to operating cash flows:
Depreciation and amortization 722 737 Amortization of postretirement benefit plans prior service costs/(credits) (92) (229) Equity award compensation expense 114 26 Deferred income tax provision/(benefit) (343) (140) Postemployment benefit plan contributions (20) (23) Goodwill and intangible asset impairment losses 3,399 1,223 Nonmonetary currency devaluation 6 10 Loss/(gain) on sale of business 2 (490) Other items, net 143 (34) Changes in current assets and liabilities:
Trade receivables (6) 138 Inventories (455) (637) Accounts payable 62 113 Other current assets (15) (73) Other current liabilities 482 (381)
Net cash provided by/(used for) operating activities 3,326 1,990 CASH FLOWS FROM INVESTING ACTIVITIES:
Capital expenditures (397) (581) Payments to acquire business, net of cash acquired — (199) Proceeds from sale of business, net of cash disposed — 1,875 Other investing activities, net 35 16
Net cash provided by/(used for) investing activities (362) 1,111 CASH FLOWS FROM FINANCING ACTIVITIES:
Repayments of long-term debt (4,395) (3,272) Proceeds from issuance of long-term debt 3,500 2,967 Debt prepayment and extinguishment costs (101) (91) Proceeds from revolving credit facility 4,000 — Repayments of revolving credit facility (4,000) — Proceeds from issuance of commercial paper — 377 Repayments of commercial paper — (377) Dividends paid (1,467) (1,464) Other financing activities, net (46) (21)
Net cash provided by/(used for) financing activities (2,509) (1,881) Effect of exchange rate changes on cash, cash equivalents, and restricted cash (14) (40) Cash, cash equivalents, and restricted cash
Net increase/(decrease) 441 1,180 Balance at beginning of period 2,280 1,136 Balance at end of period $ 2,721 $ 2,316
17

Schedule 10The Kraft Heinz Company
Reconciliation of Net Cash Provided By/(Used For) Operating Activities to Free Cash Flow(in millions)(Unaudited)
For the Nine Months EndedSeptember 26,
2020September 28,
2019
Net cash provided by/(used for) operating activities $ 3,326 $ 1,990 Capital expenditures (397) (581)
Free Cash Flow $ 2,929 $ 1,409
18