KPMG Transport Tracker · The refugee crisis in Europe poses another downside risk to both...
28
KPMG Transport Tracker February / March 2016 kpmg.com Global transport Market trends and views
Transcript of KPMG Transport Tracker · The refugee crisis in Europe poses another downside risk to both...

KPMG Transport Tracker
February / March 2016
kpmg.com
Global transport Market trends and views

© 2016 KPMG International Cooperative (“KPMG International”). KPMG International provides no client services and is a Swiss entity with which the independent member firms of the KPMG network are affiliated. / Transport Tracker
Table of Contents
2
Page
MARKET FUNDAMENTALS 4
SHIPPING AND SEA FREIGHT 6
AVIATION 10
EXPRESS LOGISTICS 16
M&A AND STARTUPS 20
CASE STUDIES 24

© 2016 KPMG International Cooperative (“KPMG International”). KPMG International provides no client services and is a Swiss entity with which the independent member firms of the KPMG network are affiliated. / Transport Tracker3
We are delighted to present
the sixth edition of the KPMG
Transport Tracker, our regular
publication looking at the latest
market indicators and trends in
the global transport market.
Market fundamentals
AviationShipping andsea freight
Case studiesExpress logistics M&A and startups

© 2016 KPMG International Cooperative (“KPMG International”). KPMG International provides no client services and is a Swiss entity with which the independent member firms of the KPMG network are affiliated. / Transport Tracker
Market fundamentalsLong term downside pressures weigh on lackluster economy2015 was far from a strong year on the demand side for most transport and logistics companies. World trade growth averaged barely 3 percent year-on-year in 2015 (2.6 percent until November 2016) according to CPB statistics – and the OECD notes that there had been just five years in the past 50 in which global trade had grown by 2 percent or less (a). The Purchasing Manager Indices (PMI) in the major economies further support this negative view, as both the Chinese and the US PMI ended the year below the 50 percent growth mark, while the global PMI only just reached expansionary figures.
The IMF is now projecting global output growth at 3.4 percent in 2016 and 3.6 percent in 2017, both of which are slightly lower than forecasts issued in October 2015. On the bright side, European growth is expected to be 1.7 percent in 2016, an upwards revision of 0.1 percentage points. Emerging markets growth is expected to increase from 4 percent in 2015—the lowest rate since the financial crisis—to 4.3 and 4.7 percent in 2016 and 2017, respectively.
While downside pressures such as a slowdown in emerging market economies, China’s shift from an export-driven to a consumption-led economy and a geopolitical crisis, were the main reasons for the sluggish growth, the new consensus can also be explained as a plateau effect of globalization: Where trade growth has traditionally outpaced GDP rates by a factor of 2 – 3, the ratio has now converged to 1.5x and is expected to remain stagnant in coming years. It now seems that globalization has reached a stage in which supply chains can hardly fragmentise any further as the advantages of offshore production and the subsequent shipping of products to consumers, become smaller amid rising salary and transportation costs.
The refugee crisis in Europe poses another downside risk to both transport companies and global trade in case border checks are re-applied which will result in significantly higher transportation costs and delays in supply chains. The Dutch transport sector alone is estimated to lose around €600mn a year from the reinstatement of border controls (b). Losses of the British freight industry due to delays in Calais this summer were estimated to be £750,000 (€1.07mn) per day according to the Freight Transport Association (FTA) (c).
An effect of weak demand and increasing overcapacities was that in 2015, oil and fuel prices ended 40 – 50 percent below the prior year, trading at levels last seen in 2004. Overcapacities have raised questions on storage capacities and whether the inventory build in 2016 might run into its operational limits. This has led the first traders into chartering oil tankers to use as floating tanks, amid a squeeze on space for growing oil supplies. Société Générale has calculated that Brent will have to fall to US$35 a barrel in order to make floating storage profitable for investors.
Despite the strong decline of fuel and oil prices, which has had a largely positive contribution to the earnings of transport companies, the share prices of transport companies reflect the rather negative demand sentiment. Amongst the different transport modes and business models, only airlines (where passenger demand has been less dependent on the overall economy) and transport infrastructure operators (which are less effected by overcapacities) managed to end the year on a high note. Shipping companies were the worst performers within the sector, as they faced their eighth consecutive year of crisis.
4
SHARE PRICES(end of December 2015 YOY):
Transport and Logistics overall-10%
Transportinfrastructure 3%
Airlines 4%
Road and Rail-14%
Shipping -19%(a) http://www.telegraph.co.uk/finance/economics/11983690/global-recession-trade-growth-warns-oecd.html (b) http://www.ad.nl/ad/nl/5597/Economie/article/detail/4142489/2015/09/15/Transportsector-vreest-strop-door-grenscontroles.dhtml (c) http://www.dw.com/en/calais-chaos-hits-european-freight-companies/a-18627929
Note:

© 2016 KPMG International Cooperative (“KPMG International”). KPMG International provides no client services and is a Swiss entity with which the independent member firms of the KPMG network are affiliated. / Transport Tracker
Global Purchasing Manager Indices (PMI)
48
50
52
54
Jan
-15
Fe
b-1
5
Mar
-15
Apr-
15
May
-15
Jun-1
5
Jul-1
5
Aug
-15
Sep-1
5
Oct-
15
No
v-15
De
c-15
Global PMI US PMI
Eurozone PMI China PMI
Note: Values above 50 indicate growthSource: Institute for Supply Management (ISM), Markit, JP Morgan, China
Federation of Logistics & Purchasing
5
World trade and industrial production index
Source: CPB Netherlands Bureau for Economic Policy Analysis
Fuel and oil prices
Source: Bloomberg, ICE (Intercontinental Exchange)
Share prices of transport subsectors
Source: Bloomberg, KPMG Research
40
50
60
70
80
90
100
110
120
130
140
Jan
-15
Fe
b-1
5
Mar
-15
Apr-
15
May
-15
Jun-1
5
Jul-1
5
Aug
-15
Sep-1
5
Oct-
15
No
v-15
De
c-15
Jan 1
5 =
100
Bloomberg 380 Centistoke Bunker Fuel Price
Bloomberg Jet Fuel FOB ARA Spot Barges
Brent Crued Oil (ICE)
0%
1%
2%
3%
4%
5%
6%
De
c-14
Jan
-15
Fe
b-1
5
Mar
-15
Apr-
15
May
-15
Jun-1
5
Jul-1
5
Aug
-15
Sep-1
5
Oct-
15
No
v-15
YoY
World trade Industrial Production
80
85
90
95
100
105
110
115
120
Jan
-15
Fe
b-1
5
Mar
-15
Apr-
15
May
-15
Jun-1
5
Jul-1
5
Aug
-15
Sep-1
5
Oct-
15
No
v-15
De
c-15
Jan 1
5 =
100
Bloomberg World Transportation Index
Bloomberg World Airlines Index
Bloomberg Shipping Index
MSCI World Transportation Infrastructure Index
MSCI World Road & Rail
Market fundamentals
AviationShipping andsea freight
Case studiesExpress logistics M&A and startups

© 2016 KPMG International Cooperative (“KPMG International”). KPMG International provides no client services and is a Swiss entity with which the independent member firms of the KPMG network are affiliated. / Transport Tracker
Shipping and sea freightNo land in sight 2015 was yet another year lost for the shipping industry which was facing its eighth consecutive year of crisis. World trade grew in a range of 2-3 percent in 2015 which fell short of expectations and far off from historical standards. The Container Throughput Index even signals a declining volume trend towards the end of the year and BIMCO estimates that container volumes on the Far East to Europe trade lane contracted by 4 percent in 2015. The sluggish demand once again stood in contrast to the expansionary tonnage supply as the total world fleet capacity grew by 3.3 percent according to Clarkson.
The total containership fleet grew by 8 percent in 2015 which added to the persisting overcapacities in the market. Subsequently, container freight rates declined by 30 – 40 percent even as scrapping of capacities continued. In contrast, container charter rates did increase in the first half of 2015 but could not keep the gains as they ended up -10 percent below the prior year by the end of 2015. The containership orderbook at the end of 2015 stands at 18 percent of existing capacity which is a rather moderate increase of ordering activities as compared to the beginning of the year. Total net fleet capacity is expected to grow by “only” 4.6 percent in 2016, the lowest ever recorded growth of the global containership fleet according to Alphaliner. Still, this will likely be enough to once again outpace demand growth in 2016. According to the International Monetary Fund (IMF), the volume of global trade, which is key to the demand for container shipping services, will increase by 3.4 percent in 2016 (2015: +2.6 percent). IHS Global Insight is forecasting that the global container shipping volume will increase by 3.5 percent in 2016 (2015: +1.0 percent).
The situation is even worse for dry bulk shipping companies as the Baltic Dry Index fell to new historic lows in 2015 (a). By the end of 2015, the index had lost around one third of its value from the beginning of the year. This came on the back of a 3 percent increase of total fleet capacity while dry bulk demand slightly declined in 2015. The tanker segment was the main positive exception within the shipping industry in 2015 according to Clarkson numbers. Demand increased by about 5 percent while fleet supply grew by only 3 percent which drove up freight rates and average earnings of tanker operators.
As a consequence of the persisting depressed market situation, we saw a number of larger mergers and restructuring efforts of shipping companies across the globe – a trend which we expect to continue over the course of 2016 as a sustained recovery is nowhere in sight. Some current examples include:
— The announced merger between China COSCO and China Shipping Group that will shuffle assets between their listed units
— CMA CGM’s announced acquisition of Singapore based NOL
— Hyundai Merchant Marine’s talks with PE owned H Line Shipping relating to a sell of its bulk ship line division
— China Shipping Container Lines’ expected loss of about US$425mn for 2015 on an 8 percent decline in container volumes
6
SHARE PRICES(end of June 2015 YOY):
Freight forwardingand logistics15%
Transportinfrastructure -7%
Airlines 33%
Publictransport 19%
Shipping -5%(a) http://www.bloomberg.com/news/articles/2015-11-19/baltic-dry-ship-index-drops-to-record-as-iron-ore-
growth-slump Note:

© 2016 KPMG International Cooperative (“KPMG International”). KPMG International provides no client services and is a Swiss entity with which the independent member firms of the KPMG network are affiliated. / Transport Tracker7
Share prices of shipping subsectors
Source: Bloomberg, KPMG Research
Baltic shipping indices
Source: Baltic Exchange
Container Throughput Index
Note: Based on flash estimates of 73 ports, 2008 = 100Source: Institute of Shipping Economics and Logistics (ISL)
Orderbook in % of capacity
Source: Global Insight
Total fleet capacity (DWT)
Source: Global Insight
Container freight and time charter rates
Source: Vereingung Hamburger Schiffsmakler und Schiffsagenten (VHSS), Shanghai Shipping Exchange
60
70
80
90
100
110
120
Jan
-15
Fe
b-1
5
Mar
-15
Apr-
15
May
-15
Jun-1
5
Ju
l-15
Aug
-15
Sep-1
5
Oct-
15
No
v-15
De
c-15
Jan 1
5 =
100
General Shipping Dry Bulk Shipping
Container Shipping Tankers
50
70
90
110
130
150
170
Jan
-15
Fe
b-1
5
Mar
-15
Apr-
15
May
-15
Jun-1
5
Jul-1
5
Aug
-15
Sep-1
5
Oct-
15
No
v-15
De
c-15
Jan 1
5 =
100
Baltic Dry Index
Baltic Dirty Tanker Index
Baltic Clean Tanker Index
45
65
85
105
125
145
165
Jan
-15
Fe
b-1
5
Mar
-15
Apr-
15
May
-15
Jun-1
5
Jul-1
5
Aug
-15
Sep-1
5
Oct-
15
No
v-15
De
c-15
Jan 1
5 =
100
Container Time Charter Index (New ConTex)
Shanghai (Export) Containerized Freight Index (SCFI)
China (Export) Containerized Freight Index
95
97
99
101
103
105
107
109
Jan
-15
Fe
b-1
5
Mar
-15
Apr-
15
May
-15
Jun-1
5
Jul-1
5
Aug
-15
Sep-1
5
Oct-
15
No
v-15
De
c-15
Jan 1
5 =
100
Dry Bulk Carrier Containerships
Crude Oil Tankers
10
12
14
16
18
20
22
24
Jan
-15
Fe
b-1
5
Mar
-15
Apr-
15
May
-15
Jun-1
5
Jul-1
5
Aug
-15
Sep-1
5
Oct-
15
No
v-15
De
c-15
% o
f exi
stin
g D
WT
Dry Bulk Carrier Containerships
Crude Oil Tankers Oil Product Tanker
-5%-4%-3%-2%-1%0%1%2%3%4%5%6%7%
110
112
114
116
118
120
122
124
126
128
De
c-14
Jan
-15
Fe
b-1
5
Mar
-15
Apr-
15
May
-15
Jun-1
5
Jul-1
5
Aug
-15
Sep-1
5
Oct-
15
No
v-15
YoY
Index
seas
onal
ly a
dju
sted
Index seasonally adjusted
YoY seasonally adjusted
Market fundamentals
AviationShipping andsea freight
Case studiesExpress logistics M&A and startups

© 2016 KPMG International Cooperative (“KPMG International”). KPMG International provides no client services and is a Swiss entity with which the independent member firms of the KPMG network are affiliated. / Transport Tracker
Shipping and sea freight (cont.)No land in sight (cont.)— Mitsui O.S.K. Lines announcement to lose money in the year ending
March 31 as it restructures operations
— Japan’s K Line’s downward revision of its full-year profit forecast
— In a recent Chinese survey, more than 60 percent of the dry-bulk shipping firms were struggling with long-term losses, while about 40 percent faced liquidity problems
Overall, Drewry expects industrywide losses of more than US$5bn this year for the containership segment alone, on widening supply-demand imbalances. On the other hand, Moody's would consider a change to a positive outlook if the oversupply of vessels declines materially and aggregate year-over-year EBITDA growth appears likely to exceed 10 percent. Any EBITDA growth will be driven primarily by continued cost reductions.
On a positive note, the opening up of trade with Iran is providing opportunities for the shipping industry and the first companies have started to develop new business with the country. The decline of bunker prices is another positive factor on the profit statements of shipping companies albeit this situation will likely reverse in the second half of 2016 when oil prices are expected to rise again. Overall, 2016 will be just as tough for shipping companies as 2015 has been – with the effect that not every shipping operator and vessel owner will have the financial strength to sustain in such environment.
8
SHARE PRICES(end of June 2015 YOY):
Freight forwardingand logistics15%
Transportinfrastructure -7%
Airlines 33%
Publictransport 19%
Shipping -5%
Hartmut Heckert
Global Head of Shipping

© 2016 KPMG International Cooperative (“KPMG International”). KPMG International provides no client services and is a Swiss entity with which the independent member firms of the KPMG network are affiliated. / Transport Tracker/ Transport Tracker
We will continue to see larger mergers and restructuring efforts of shipping companies across the globe in 2016“
Hartmut HeckertGlobal Head of Shipping
“
© 2016 KPMG International Cooperative (“KPMG International”). KPMG International provides no client services and is a Swiss entity with which the independent member firms of the KPMG network are affiliated.
Market fundamentals
AviationShipping andsea freight
Case studiesExpress logistics M&A and startups
9

© 2016 KPMG International Cooperative (“KPMG International”). KPMG International provides no client services and is a Swiss entity with which the independent member firms of the KPMG network are affiliated. / Transport Tracker
AviationStrong momentum for global air passenger trafficThe global aviation sector retained its momentum from the first half of 2015 and finished the year with passenger traffic demand up by 6.5 percent compared to prior year thanks to air-fares absorbing the benefit of lower fuel prices and encouraging air travel. This outweighed the slight deceleration in global GDP growth, which slowed down by 0.3 percentage points to 3.1 percent in 2015 (IMF, January 2016 Update).
Monthly traffic growth slowed down in the last quarter of 2015 as European traffic in November and December felt the short-term impact of a number of events including the strikes at Lufthansa, closure of Transaero, and the attacks in Egypt and Paris. Nonetheless, on a global level passenger demand exceeded capacity growth in 2015 (with the exception of the Middle East), which coupled with better capacity management, has resulted in record industry passenger load factor of 80.3 percent in 2015 as reported by IATA.
In terms of financial performance in 2015, operating margins for the aviation industry overall increased to 7.7 percent (up from 5.5 percent in 2014), and are forecasted to raise further up to 8.2 percent in 2016. The North American airlines continued to deliver the highest profits across all regions thanks to the high degree of consolidation, and also benefiting more of the drop in oil price, which for non-USD reporting airlines was partially offset by the strengthening of the US dollar. For example, in 2015 North American airlines saw a reduction of their fuel costs as percentage of operating expenses of 6-11 percent. In comparison, for European airlines the reduction was 1-7 percent. On the opposite side of the scale, LATAM airlines struggled to remain profitable realizing an average operating margin for the region of 1.3 percent despite international traffic growth and consolidation.
The industry outlook will remain positive in 2016 as airlines unwind hedges and obtain the cost benefit of the falling jet fuel prices. IATA forecasts that passenger traffic demand will increase by 6.9 percent in 2016. The Middle Eastern carriers will retain their leadership in RPK growth, followed by the Asia-Pacific, driven by domestic demand in China (China continues to maintain a double-digit growth in RPK with 10.9 percent in 2015 as it is set to become the number one traffic flow globally by 2034).
Decline in oil prices and impact on operating models
The decline of oil and jet fuel prices over the past year have benefitted the airline industry overall. IATA’s analysis shows fuel costs decreased by 20 percent in 2015. KPMG’s assessment of a sample of global airlines demonstrates that fuel costs reduced from 31 percent to 25 percent of operating costs in 2015, albeit the drop in oil prices was much sharper. The impact on individual airlines, however, has not been universally positive, depending on the airlines’ hedging strategies. A number of recent announcements show how the reduction in fuel prices has directly impacted on reported profits:
— In North America, Delta Air Lines, United and Southwest all reported significant profits in Q4 2015, all helped by falling fuel prices;
10
SHARE PRICES(end of June 2015 YOY):
Freight forwardingand logistics15%
Transportinfrastructure -7%
Airlines 33%
Publictransport 19%
Shipping -5%

© 2016 KPMG International Cooperative (“KPMG International”). KPMG International provides no client services and is a Swiss entity with which the independent member firms of the KPMG network are affiliated. / Transport Tracker11 / Transport Tracker© 2016 KPMG International Cooperative (“KPMG International”). KPMG International provides no client services and is a Swiss entity with which the independent member firms of the KPMG network are affiliated.
Passenger traffic growth (RPK)
Note: Two months rolling averageSource: International Air Transport Association (IATA)
Passenger capacity growth (ASK)
Note: Two months rolling average Source: International Air Transport Association (IATA)
Passenger load factor
Note: Two months rolling averageSource: International Air Transport Association (IATA)
Market fundamentals
AviationShipping andsea freight
Case studiesExpress logistics M&A and startups
0
2
4
6
8
10
12
14
16
18
Jan
-15
Fe
b-1
5
Mar-15
Apr-15
May-15
Ju
n-1
5
Ju
l-15
Aug
-15
Sep-15
Oct-1
5
No
v-15
De
c-15
YoY
in
%
Global Europe
North America ASPAC
Middle East LATAM
0
5
10
15
20
25
Jan
-15
Fe
b-1
5
Mar-15
Apr-15
May-15
Ju
n-1
5
Ju
l-15
Aug
-15
Sep-15
Oct-1
5
No
v-15
De
c-15
YoY
in
%
Global Europe
North America ASPAC
Middle East Latam
70
72
74
76
78
80
82
84
86
88
90
Jan
-15
Fe
b-1
5
Mar-15
Apr-15
May-15
Ju
n-1
5
Ju
l-15
Aug
-15
Sep-15
Oct-1
5
No
v-15
De
c-15
%
Global Europe
North America ASPAC
Middle East Latam

© 2016 KPMG International Cooperative (“KPMG International”). KPMG International provides no client services and is a Swiss entity with which the independent member firms of the KPMG network are affiliated. / Transport Tracker
Aviation (cont.)— Air France-KLM posted its first annual net profit in the last five years
thanks to continued cost-reduction efforts and lower oil prices;
— In ASPAC, Qantas reported improving underlying profits in H1 2016, partly attributable to the benefit of lower fuel prices secured through their hedging program. Cathay Pacific, on the other hand, reported fuel hedging loss in 1H 2015, which exceeded operating profit for the same period.
— Unhedged airlines (Air China, China Southern, China Eastern, Emirates) have enjoyed between 30-40 percent decreases in their fuel bill despite increase in ATKs/ASKs as reported by CAPA.
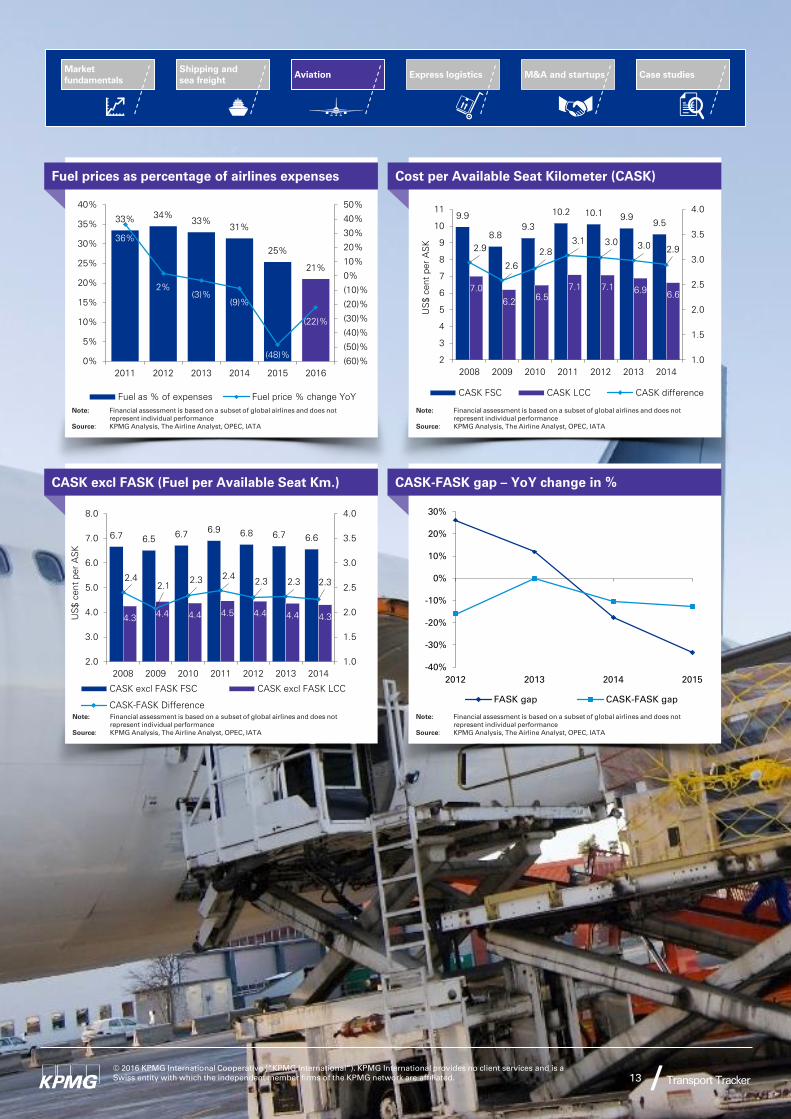
While there is high degree of uncertainty around cost of oil in 2016, the downward trend for the airline industry is expected to continue reducing fuel costs to 21 percent of the cost base (please see chart to the right).
In the meantime, the cost gap between full service and low cost operators have continued to converge, posing a growing question whether the drop in oil prices will further bring FSCs closer to LCCs in terms of price. KPMG’s analysis of a sample of full service and low cost airlines reveals that the oil price reduction has improved the price competiveness of FSCs. In the sample, a substantial part of the convergence is attributed to a reduction in the Fuel Costs per Available Seat Km (FASK) gap, which decreased by 33 percent and contributed to 28 percent of the overall Cost per ASK (CASK) convergence (compared to 22 percent in 2014). In comparison, the CASK gap excluding fuel reduced by 13 percent between 2014 and 2015.
Further evidence is yet to crystallize as 2015 financial results become publicly available, however it is clear that LCCs have been affected by pricing pressure from full service carriers reducing fares in line with budget airlines. Gary Kelly, CEO of Southwest Airlines, has stated that, “With lower fuel prices, it’s a very competitive environment in the industry, so fares are a little lower and the demand has continued to be brisk.”
What opportunities do LCCs have to respond?
The low cost operating model has seen a range of industry responses to competitive pressure and search for new growth, including:
— Targeting the business segment: LCCs have started to cater for business traffic by promoting ticket flexibility, addition of premium product and providing lounge access as an add-on;
— Providing feeder traffic: LCCs may look again at strategic arrangements with flag carriers to provide feeder traffic on long-haul routes (in ways that avoid interline liabilities);
— Forming alliances: Four airlines of the HNA Group have established the world’s first LCC alliance U-Fly to seek revenue and cost synergies.
While low oil prices on their own are not a catalyst for these changes and may prove to be relatively short-term, it is likely that the ability to capture the benefit of fuel cost reduction will accelerate the evolution of airline operating models and will trigger a wider industry reaction in the medium term.
12
SHARE PRICES(end of June 2015 YOY):
Freight forwardingand logistics15%
Transportinfrastructure -7%
Airlines 33%
Publictransport 19%
Shipping -5%
© 2016 KPMG International Cooperative (“KPMG International”). KPMG International provides no client services and is a Swiss entity with which the independent member firms of the KPMG network are affiliated. / Transport Tracker13 / Transport Tracker© 2016 KPMG International Cooperative (“KPMG International”). KPMG International provides no client services and is a Swiss entity with which the independent member firms of the KPMG network are affiliated.
Market fundamentals
AviationShipping andsea freight
Case studiesExpress logistics M&A and startups
Fuel prices as percentage of airlines expenses
Note: Financial assessment is based on a subset of global airlines and does not represent individual performance
Source: KPMG Analysis, The Airline Analyst, OPEC, IATA
Cost per Available Seat Kilometer (CASK)
Note: Financial assessment is based on a subset of global airlines and does not represent individual performance
Source: KPMG Analysis, The Airline Analyst, OPEC, IATA
CASK excl FASK (Fuel per Available Seat Km.)
Note: Financial assessment is based on a subset of global airlines and does not represent individual performance
Source: KPMG Analysis, The Airline Analyst, OPEC, IATA
CASK-FASK gap – YoY change in %
Note: Financial assessment is based on a subset of global airlines and does not represent individual performance
Source: KPMG Analysis, The Airline Analyst, OPEC, IATA
33%34%
33%
31%
25%
21%
36%
2%
(3)%
(9)%
(48)%
(22)%
(60)%
(50)%
(40)%
(30)%
(20)%
(10)%
0%
10%
20%
30%
40%
50%
0%
5%
10%
15%
20%
25%
30%
35%
40%
2011 2012 2013 2014 2015 2016
Fuel as % of expenses Fuel price % change YoY
-40%
-30%
-20%
-10%
0%
10%
20%
30%
2012 2013 2014 2015
FASK gap CASK-FASK gap
9.9
8.8
9.3
10.2 10.19.9
9.5
7.0
6.26.5
7.1 7.16.9
6.6
2.9
2.6
2.8
3.1 3.03.0
2.9
1.0
1.5
2.0
2.5
3.0
3.5
4.0
2
3
4
5
6
7
8
9
10
11
2008 2009 2010 2011 2012 2013 2014
US
$ cent per A
SK
CASK FSC CASK LCC CASK difference
6.76.5
6.76.9
6.8 6.76.6
4.34.4 4.4 4.5 4.4 4.4 4.3
2.4
2.12.3
2.42.3 2.3 2.3
1.0
1.5
2.0
2.5
3.0
3.5
4.0
2.0
3.0
4.0
5.0
6.0
7.0
8.0
2008 2009 2010 2011 2012 2013 2014
US
$ cent per A
SK
CASK excl FASK FSC CASK excl FASK LCC
CASK-FASK Difference

© 2016 KPMG International Cooperative (“KPMG International”). KPMG International provides no client services and is a Swiss entity with which the independent member firms of the KPMG network are affiliated. / Transport Tracker
Aviation (Freight)Impact of falling fuel prices also felt in air freightGlobal air freight volumes expanded by 2.2 percent in 2015, which was lower than in 2014 according to IATA. The graphs show a continuing decline of monthly year-on-year growth rates over the course of 2015, clearly highlighting the overall weakness of global trade.
According to IATA, all major regions recorded weakness in air freight traffic in 2015. European carriers’ volumes declined by 0.1 percent overall. North American carriers reported a hardly noticeable expansion of 0.1 percent, while Asia Pacific airlines expanded air freight volumes by 2.3 percent, a slower expansion than in 2014. The lackluster state of the Chinese economy (and other Asian economies) contributed to the slower growth. Latin American carriers showed the largest declines in FTKs (-6.0 percent percent) which does not bode well for overall economic activity in the region.
The falling oil prices and persistent overcapacities (due to the expansion of belly capacity over the last years) caused a further deterioration of air freight rates. The average monthly decline of air freight rates in 2015 was -9 percent. Yet, IATA states that the fall in yields for air cargo services is lower than the fall in jet fuel prices, meaning a boost in profits for air cargo carriers, whilst those that are shipping goods have benefited from lower transportation costs.
The fall in fuel prices could also mean a mid-term modal re-shift of cargo from sea to air freight (since air freight had been suffering from losing modal market shares to sea carriers when jet fuel prices peaked some years ago). As prices have fallen, the cost gap between ocean and air cargo becomes less striking –and so has the motivation for shippers to switch to the lower cost sea freight. On the other hand, air freight is still largely dependent on the state of the global economy and world trade. As such, 2016 can be expected to be just as tough as 2015 for air freight operators, if not even more challenging, especially when fuel and oil prices might start to rise again in the second half of 2016.
14
SHARE PRICES(end of June 2015 YOY):
Freight forwardingand logistics15%
Transportinfrastructure -7%
Airlines 33%
Publictransport 19%
Shipping -5%James StampGlobal Head of Aviation

© 2016 KPMG International Cooperative (“KPMG International”). KPMG International provides no client services and is a Swiss entity with which the independent member firms of the KPMG network are affiliated. / Transport Tracker15 / Transport Tracker© 2016 KPMG International Cooperative (“KPMG International”). KPMG International provides no client services and is a Swiss entity with which the independent member firms of the KPMG network are affiliated.
Share prices by business model
Source: Bloomberg, KPMG Research
Share prices by region
Source: Bloomberg, KPMG Research
Freight traffic growth (FTK)
Note: Two months rolling averageSource: International Air Transport Association (IATA) Source: Drewry
Air freight price index
Market fundamentals
AviationShipping andsea freight
Case studiesExpress logistics M&A and startups
(15)
(10)
(5)
0
5
10
15
20
Jan
-15
Fe
b-1
5
Mar-15
Apr-15
May-15
Ju
n-1
5
Ju
l-15
Aug
-15
Sep-15
Oct-1
5
No
v-15
De
c-15
YoY
in
%
Global Europe
North America ASPAC
Middle East Latam
(20)
(15)
(10)
(5)
0
5
80
85
90
95
100
105
110
115
120
125
Jan
-15
Fe
b-1
5
Mar
-15
Apr-
15
May
-15
Jun-1
5
Jul-1
5
Aug
-15
Sep-1
5
Oct-
15
No
v-15
De
c-15
YoY
(%)
Price
Index
Drewry Air Freight Price Index
Drewry Air Freight YoY (%)
80
85
90
95
100
105
110
115
Jan
-15
Fe
b-1
5
Mar-15
Apr-15
May-15
Ju
n-1
5
Ju
l-15
Aug
-15
Sep-15
Oct-1
5
No
v-15
De
c-15
Jan 15 =
100
Full-Service Airlines Low-Cost Carriers
40
60
80
100
120
140
160
Jan
-15
Fe
b-1
5
Mar-15
Apr-15
May-15
Ju
n-1
5
Ju
l-15
Aug
-15
Sep-15
Oct-1
5
No
v-15
De
c-15
Jan 15 =
100
Global EMA USA
ASPAC LATAM
The impact of declining fuel prices on individual airlines has not been universally positive, depending on the airlines’ hedging strategies.“
James StampGlobal Head of Aviation
“

© 2016 KPMG International Cooperative (“KPMG International”). KPMG International provides no client services and is a Swiss entity with which the independent member firms of the KPMG network are affiliated. / Transport Tracker
Express logisticsChallenging time ahead for logistics companiesWhile B2B freight and logistics demand was rather muted in 2015 (see chapter on Market Fundamentals and Shipping), on the back of rising e-commerce, B2C logistics was again the bright spot for express logistics companies and not just in terms of volume:
UPS results for the fourth quarter in the Domestic US Express business showed that volumes increased by 2.4 percent and 2.6 percent in revenue, despite a 2.5 percent lower fuel surcharge. Adjusted operational profit increased by 18.4 percent year-on-year. Over the year, UPS’ revenue remained rather flat (+0.2 percent) while adjusted operating profit rose by 9.2 percent.
While it is a positive sign that a large global integrator was able to benefit not only from rising volumes, but also increased profits on the back of rising B2C logistics demand, it must not be overlooked that part of this effect was due to lower oil prices, which boosted margins. Additionally, competition in the market is increasing, as startups and tech giants are both targeting business opportunities in this attractive logistics market segment.
Over recent years, startups with a focus on digital platform solutions for crowd-based, last mile delivery solutions, such as Postmates, Shyp or Deliv, have entered the market at a fast pace and have attracted increasing volumes of funding from investors (see chapter on M&A and startups). On the other hand, tech giants like Google, eBay and Amazon are all developing dedicated delivery solutions and transportation capacities. Ironically, the peak in sales this year for express companies on Black Friday and over the Christmas period was influenced heavily by limiting access to the network. This may ultimately contribute to driving the retailers to look for in-house solutions, similar to those that Amazon is currently exploring. In addition to this, the online giant has added a new dimension to its strategy that has emerged over recent months:
Not only has the e-tailer set up its own logistics capacities in trucking, air freight and warehousing, it has now also registered with the U.S. government to provide ocean freight services, as the startup Flexport discovered (a). While the full scope of this new license is still unclear in the short and mid-term, there is firm evidence that Amazon is challenging the established logistics companies and freight forwarders more than ever. The tech giant now refers to itself as a ’transportation service provider’, as the Wall Street Journal reported, and in a securities filing said it faces competition from companies ‘that provide fulfillment and logistics services for themselves or for third parties (b).’ At the beginning of the year, Amazon acquired the French package delivery company Colis Prive.
The strategy threatens the established logistics companies that are transporting parcels and packages for the e-tailer by reducing the scope of the logistics work that it is outsourcing. Furthermore, Amazon’s experiments may soon be rolled out to third parties, as it has done so many times with other services that it had been experimenting with internally first (c).
16
SHARE PRICES(end of June 2015 YOY):
Freight forwardingand logistics15%
Transportinfrastructure -7%
Airlines 33%
Publictransport 19%
Shipping -5% (a) https://www.flexport.com/blog/amazon-ocean-freight-forwarder/(b) http://blogs.wsj.com/digits/2016/01/29/amazon-hints-at-new-shipping-
business/?mod=djemlogistics(c) http://techcrunch.com/2016/01/29/is-logistics-about-to-get-amazoned/
Note:

© 2016 KPMG International Cooperative (“KPMG International”). KPMG International provides no client services and is a Swiss entity with which the independent member firms of the KPMG network are affiliated. / Transport Tracker17 / Transport Tracker© 2016 KPMG International Cooperative (“KPMG International”). KPMG International provides no client services and is a Swiss entity with which the independent member firms of the KPMG network are affiliated.
Logistics Confidence Index
Note: Above 50 indicates higher volumes, below 50 indicates lower volumes"Source: Stifel, Transport Intelligence
Consumer confidence indices
Source: National Bureau of Statistics of China, CNI (Confederacao Nacional dasIndustrias, Conference Board, European Commission) Source: Bloomberg, KPMG Research
Express logistics share prices
70
75
80
85
90
95
100
105
110
115
120
Jan
-15
Fe
b-1
5
Mar
-15
Apr-
15
May
-15
Jun-1
5
Jul-1
5
Aug
-15
Sep-1
5
Oct-
15
No
v-15
De
c-15
Jan 1
5 =
100
Global Europe North America ASPAC
(15)
(13)
(11)
(9)
(7)
(5)
(3)
(1)
1
80
85
90
95
100
105
110
115
120
125
No
v-14
De
c-14
Jan
-15
Fe
b-1
5
Mar
-15
Apr-
15
May
-15
Jun-1
5
Jul-1
5
Aug
-15
Sep-1
5
Oct-
15
Balan
ce/d
iffusio
n in
dex
Nov
14 =
100
China Brazil USA EU 27 (rhs)
40
45
50
55
60
65
Jan
-15
Fe
b-1
5
Mar
-15
Apr-
15
May
-15
Jun-1
5
Jul-1
5
Aug
-15
Sep-1
5
Oct-
15
No
v-15
De
c-15
Situation Expectations Confidence
Market fundamentals
AviationShipping andsea freight
Case studiesExpress logistics M&A and startups

© 2016 KPMG International Cooperative (“KPMG International”). KPMG International provides no client services and is a Swiss entity with which the independent member firms of the KPMG network are affiliated. / Transport Tracker
Express logistics (cont.)A report published by Bloomberg recently describes Amazon’s logistics strategy (“Global Supply Chain by Amazon”) as a ‘revolutionary system that will automate the entire international supply chain and eliminate much of the legacy waste associated with document handling and freight booking. Sellers will no longer book with DHL, UPS or FedEx but will book directly with Amazon,’ according to the report (d). The major competitive advantages that the tech giant has over traditional logistics companies are both its technological ability and innovative agility – characteristics that a number of logistics companies are currently lacking. A key advantage that Amazon has as a new entrant is that it can create fit for purpose networks rather than having to adapt historic models – something we observed when low-cost airlines challenged the position of flag carriers in aviation.
And on top of that new challenge, there is the bearish market sentiment that logistics companies need to worry about: with a score of 45.4, the December edition of the Stifel Logistics Confidence Index has recorded its lowest ever total, which is a worrying sign for logistics companies in 2016, especially in the B2B freight segment. Amid growing competition and disruptive technologies like driverless cars/vans and 3D printing, the immediate need to further digitalize processes and a weakening freight market, the challenges that lie ahead of logistics companies and freight forwarders have never been greater.
18
SHARE PRICES(end of June 2015 YOY):
Freight forwardingand logistics15%
Transportinfrastructure -7%
Airlines 33%
Publictransport 19%
Shipping -5%
Justin Zatouroff
Global Head of Post and
Express
(d) http://www.bloomberg.com/news/articles/2016-02-09/amazon-is-building-global-delivery-business-to-take-on-alibaba-ikfhpyes
Note:

© 2016 KPMG International Cooperative (“KPMG International”). KPMG International provides no client services and is a Swiss entity with which the independent member firms of the KPMG network are affiliated. / Transport Tracker19 / Transport Tracker
The major competitive advantages of Amazon over traditional logistics companies are both its technological ability and innovative agility – characteristics that a number of logistics companies are currently lacking.
“Justin ZatouroffGlobal Head of Post and Express
“
© 2016 KPMG International Cooperative (“KPMG International”). KPMG International provides no client services and is a Swiss entity with which the independent member firms of the KPMG network are affiliated.
Market fundamentals
AviationShipping andsea freight
Case studiesExpress logistics M&A and startups

© 2016 KPMG International Cooperative (“KPMG International”). KPMG International provides no client services and is a Swiss entity with which the independent member firms of the KPMG network are affiliated. / Transport Tracker
M&A and startups in transport and logisticsBusiness model convergence and slower market growth drives M&A activity2015 was a record year for the transport and logistics sector for various reasons: the total value of M&A transactions and funding for startups both reached all-time highs. The value of completed M&A transactions rose for the third consecutive year, to a total value of around US$74bn. Additionally, further transactions worth approximately US$100bn were announced, which set M&A activity in the sector at a record level in 2015. There are a few drivers for these trends:
The acquisitions made in the sector increasingly serve the transformation of existing business models. This relates to both the acquisition of logistics companies with high-tech/asset-light business models by asset-based companies and vice versa (asset-light logistics specialists acquiring asset-heavy freight forwarders). Last year, a number of large transactions, some complementing and some transforming the existing business models could be observed:
— The acquisition of US logistics company Coyote Logistics (high-tech/asset-light business model) by UPS (asset-heavy integrator), worth US$1.8bn (a);
— The acquisition of the French forwarder Norbert Dentressangle (asset-heavy) by XPO Logistics (until the start of numerous acquisitions last year an asset-light logistics operator), worth US$2.8bn; and
— The acquisition of TOLL Logistics by Japan Post, worth US$5bn, in turn, served to transform the existing business model of the postal service provider into a full-service logistics provider.
Traditionally, asset-light logistics service providers with relevant IT systems were popular acquisition targets for large logistics providers and freight forwarders. The reverse case now applies and the leaner forwarders increasingly look for their own assets and reliable networks in order to support and enhance their services.
In addition to this, the plateau effect of globalization makes organic growth ever harder to achieve for logistics companies, which in turn drives M&A activity in the sector. World trade consensus forecasts are now significantly lower than several years ago. One reason for this is that the global division of labor, which had risen rapidly during the last decades, has gradually reached its plateau and therefore cannot be expected to increase indefinitely. This means that in the future, there will be fewer additional growth effects as part of an increasing globalization of trade flows. As a consequence, the world-trade-GDP multiplier (the factor by which the world trade grows faster than global GDP) has decreased from 3.5x in the 1990s, to 1.4x today, where it will remain for a number of years.
Against the backdrop of this new growth consensus, the major companies in the sector are increasingly looking for ways to compensate for the slower market dynamics through inorganic growth. Examples include:
— The announced acquisition of the shipping line NOL by CMA CGM, worth US$2.4bn;
— The intended acquisition of Norfolk Southern by Canadian Pacific Railway, worth US$27.5bn; and
— FedEx’s acquisition of TNT Express, worth US$4.7bn.
20
SHARE PRICES(end of June 2015 YOY):
Freight forwardingand logistics15%
Transportinfrastructure -7%
Airlines 33%
Publictransport 19%
Shipping -5%
(a) Based on numbers sourced from Thomoson ONENote:

© 2016 KPMG International Cooperative (“KPMG International”). KPMG International provides no client services and is a Swiss entity with which the independent member firms of the KPMG network are affiliated. / Transport Tracker
Transaction values by subsector Transaction volumes by subsector
M&A transaction values in transport and logistics since 1985 (announced and completed)
0
50
100
150
200
19
85
19
86
19
87
19
88
19
89
19
90
19
91
19
92
19
93
19
94
19
95
19
96
19
97
19
98
19
99
20
00
20
01
20
02
20
03
20
04
20
05
20
06
20
07
20
08
20
09
20
10
20
11
20
12
20
13
20
14
20
15
US
$bn
Completed Announced
21 / Transport Tracker© 2016 KPMG International Cooperative (“KPMG International”). KPMG International provides no client services and is a Swiss entity with which the independent member firms of the KPMG network are affiliated.
Market fundamentals
AviationShipping andsea freight
Case studiesExpress logistics M&A and startups
Note: Based on flash estimates of 73 ports, 2008 = 100Source: Source: Thomson ONE, KPMG Research
0
10
20
30
40
50
60
70
80
90
2010 2011 2012 2013 2014 2015
Deal
Val
ue (
US
$bn)
Infrastructure Shipping
Airlines Freight & Logistics
Note: Based on flash estimates of 73 ports, 2008 = 100Source: Thomson ONE, KPMG Research
0
200
400
600
800
1,000
1,200
2010 2011 2012 2013 2014 2015
Num
ber
of
deal
s
Infrastructure Shipping
Airlines Freight & Logistics
Source: Thomson ONE, KPMG Research
Transaction values by region
Note: Based on flash estimates of 73 ports, 2008 = 100Source: Thomson ONE, KPMG Research
Transaction volumes by region
Source: Thomson ONE, KPMG Research
0
10
20
30
40
50
60
70
80
90
2010 2011 2012 2013 2014 2015
Deal
Val
ue (
US
$ b
n)
EMA North America Latin America ASPAC
0
200
400
600
800
1,000
1,200
2010 2011 2012 2013 2014 2015
Num
ber
of
Deal
s
EMA North America Latin America ASPAC
© 2016 KPMG International Cooperative (“KPMG International”). KPMG International provides no client services and is a Swiss entity with which the independent member firms of the KPMG network are affiliated. / Transport Tracker
M&A and startups in transport and logistics (cont.)Competition for customer interface drives investments in logistics startupsIn addition to M&A investments, the funding of startups from the transport and logistics sector accelerated in 2015 with a total global funding volume of US$14bn, some 180 percent more than last year and a further 500 percent more than the average of the four years before that. This figure includes investments in carsharing and mobility unicorns, such as Lyft and UBER, which are increasingly disrupting the traditional markets of large transportation companies.
In addition to startups with passenger transportation business models, new market players with a focus on logistics and forwarding are entering the arena. Investment in these startups rose by 125 percent to US$1.5bn last year and are around 85 percent higher than the average of the four years before that. This number includes agile business models within the eCommerce environment, which offer crowd-logistics and platform-based solutions for the delivery of online orders. These startups focus almost exclusively on the asset-free coordination of processes through software platforms and enable the direct interface of online shoppers with delivery providers. Examples include:
— Postmates, total funding of US$138mn (b);
— Shyp, total funding of US$62mn and Deliv, total funding of US$40mn.
But even in the B2B sector, new startups are now offering services similar to Freight Forwarders. Their business model mostly focuses on the brokerage of freight rates and the coordination of transportation chains through IT-based platforms. While the international freight forwarders are often still using analog processes for the negotiation of freight rates, the startups are positioning themselves directly between the shipper and the carrier through their digital platform solutions and are thus threatening the business model of the major freight forwarders. Examples are:
— Freightos, total funding of US$37mn;
— Flexport, total funding of US$27mn; and
— Efreightsolutions, total funding of US$19mn.
What all of these startups have in common is that they enable the end customers (B2B or B2C) to directly steer their transportation chains without an intervening logistics service provider. The larger transportation and logistics companies are thus at risk of losing their most important asset: the customer interface.
In the next few years we can expect investment activities in the transport and logistics sector to remain high. While many companies will be focusing on the integration of recent acquisitions, there are numerous other strategic investors willing to use their cash reserves for other medium to large-scale acquisitions. Other companies are changing their business model and will therefore divest business units, which will lead to a high availability of target companies.
Looking at the dynamic startups, we can expect to see a further increase in venture capital investments in the sector. The billion-dollar market for transport and logistics services has only recently been discovered by venture capital investors as a sector that is ready to be significantly disrupted. In the face of the forthcoming challenges, such as the rapidly progressing digitalization of business processes and ever growing eCommerce, the flexible and innovative startups will be best equipped to respond to such trends and offer new solutions. Therefore, it is only a matter of time before strategic investors mark them as acquisition targets to complement existing business models.
22
SHARE PRICES(end of June 2015 YOY):
Freight forwardingand logistics15%
Transportinfrastructure -7%
Airlines 33%
Publictransport 19%
Shipping -5%Steffen WagnerGlobal Chair – Transport & Leisure (b) Based on numbers sourced from crunchbase.comNote:

© 2016 KPMG International Cooperative (“KPMG International”). KPMG International provides no client services and is a Swiss entity with which the independent member firms of the KPMG network are affiliated. / Transport Tracker23 / Transport Tracker© 2016 KPMG International Cooperative (“KPMG International”). KPMG International provides no client services and is a Swiss entity with which the independent member firms of the KPMG network are affiliated.
Market fundamentals
AviationShipping andsea freight
Case studiesExpress logistics M&A and startups
Total VC Spendings in Transport & Logistics
Note: Based on flash estimates of 73 ports, 2008 = 100Source: CB Insights, KPMG Research
VC Spendings in Transport & Logistics, 2011-2015
Source: CB Insights, KPMG Research
VC Spendings in Travel & Ridesharing
Note: Based on flash estimates of 73 ports, 2008 = 100Source: CB Insights, KPMG Research
VC Spendings in Logistics & Forwarding
Source: CB Insights, KPMG Research
0
50
100
150
200
250
0
200
400
600
800
1,000
1,200
1,400
1,600
1,800
2011 2012 2013 2014 2015
Num
ber o
f Deals
US
$m
n
Funding in US$mn Deals
0
20
40
60
80
100
120
0
2,000
4,000
6,000
8,000
10,000
12,000
14,000
2011 2012 2013 2014 2015
Num
ber o
f Deals
US
$m
n
Funding in US$mn Deals
0
50
100
150
200
250
300
350
0
2,000
4,000
6,000
8,000
10,000
12,000
14,000
16,000
2011 2012 2013 2014 2015
Num
ber o
f Deals
US
$m
n
Funding in US$mn Deals
Travel & Ridesharing
82%
Logistics & Forwarding
18%
As startups enter the market, transportation and logistics companies are threatened to lose their most important asset: the customer interface.“
Steffen WagnerGlobal Chair – Transport & Leisure
“

© 2016 KPMG International Cooperative (“KPMG International”). KPMG International provides no client services and is a Swiss entity with which the independent member firms of the KPMG network are affiliated. / Transport Tracker
Global case studies in transport & logisticsKPMG member firms advise transport companies worldwide on an array of commercial and financial projects. We also work with Government policymakers and regulators and infrastructure companies. Our Global Transport Network works closely together to bring sector-specific advice to clients, wherever they may be.
This section of the Transport Tracker presents a selection of KPMG member firms’ recent work in helping clients from across the transport sector.
Transport & Logistics start-up scanClient challenge
The client, an important player in a commodity market, based in the Netherlands, was looking to optimize logistics and inland waterway and road transport through e.g. a TMS (Transport Management System) solution or integrated 4PL (fourth Party Logistics) platform, potentially in collaboration with other players in the market. The goal was to make transport more effective through i.a. decreasing the time barges remained without loads or were transporting not fully loaded, decreasing delays in transport and better optimized delivery schedules.
KPMG response
KPMG’s Innovative Startups explored the startup ecosystem to identify innovative technical solutions that could potentially optimize inland waterway transport.
Though most TMS and 4PL startups solely focus on the (bigger) market of road transport some concepts could be transformed to make them suited for inland waterway transport also. Within a specified search profile, set up in collaboration with the client, approximately 45 suited startups were selected. After further consideration and consultation with the client, the pool of startups was narrowed down to five; which could all potentially solve the client’s problem
Benefit to client
The client gained knowledge about and insights into the disruptive technologies and startups that are currently present in the transport part of his supply chain, which he would not have found through traditional market analysis.
24
SHARE PRICES(end of June 2015 YOY):
Freight forwardingand logistics15%
Transportinfrastructure -7%
Airlines 33%
Publictransport 19%
Shipping -5%

© 2016 KPMG International Cooperative (“KPMG International”). KPMG International provides no client services and is a Swiss entity with which the independent member firms of the KPMG network are affiliated. / Transport Tracker25 / Transport Tracker© 2016 KPMG International Cooperative (“KPMG International”). KPMG International provides no client services and is a Swiss entity with which the independent member firms of the KPMG network are affiliated.
Market fundamentals
AviationShipping andsea freight
Case studiesExpress logistics M&A and startups

© 2016 KPMG International Cooperative (“KPMG International”). KPMG International provides no client services and is a Swiss entity with which the independent member firms of the KPMG network are affiliated. / Transport Tracker
Global case studies in transport & logistics (cont.)IT Systems Consolidation Strategy and Business Development for European AirportClient challenge
The client needed assistance in developing their IT function and Enterprise Architecture, to be able to reach their IT-strategy goals that were:
— To improve information system manageability portfolio (e.g. maintenance and development).
— To enhance the end-user usability (less information-systems and logins).
— To improve operational effectiveness.
KPMG response
The KPMG team conducted a feasibility study based on the globally developed KPMG Business Improvement and Enterprise Architecture Methodologies. The study included a current state and future state analysis of the IT business and architecture to be able to find development areas. The work further consisted of:
— Business Capability Mapping (BCM)
— Integration architecture analysis and data architecture evaluation
— Information systems and business capability alignment
— KPI’s for the future state
— Business development planning
— IT systems consolidation strategy planning
Benefit to client
Based on the KPMG deliverables, the client together with the KPMG firm, was able to identify the most critical development areas to be able to meet the IT Strategy objectives. The development areas included traditional systems consolidation but also activities in Information Architecture, Enterprise Resource Planning, Enterprise Content Management, and Integration Architecture.
Based on the work, the client could be confident that the actions planned really was steps towards the IT Strategy objectives, and that the improvements were measureable with different KPI’s on both business and systems levels.
26
SHARE PRICES(end of June 2015 YOY):
Freight forwardingand logistics15%
Transportinfrastructure -7%
Airlines 33%
Publictransport 19%
Shipping -5%

© 2016 KPMG International Cooperative (“KPMG International”). KPMG International provides no client services and is a Swiss entity with which the independent member firms of the KPMG network are affiliated. / Transport Tracker27 / Transport Tracker© 2016 KPMG International Cooperative (“KPMG International”). KPMG International provides no client services and is a Swiss entity with which the independent member firms of the KPMG network are affiliated.
WE WOULD BE PLEASED TO DISCUSS THE RESULTS OF OUR ANALYSIS WITH YOU.

Contact Us
The KPMG name and logo are registered trademarks or trademarks of KPMG International.
The information contained herein is of a general nature and is not intended to address the circumstances of any particular individual or entity. Although we endeavour to provide accurate and timely information, there can be no guarantee that such information is accurate as of the date it is received or that it will continue to be accurate in the future. No one should act on such information without appropriate professional advice after a thorough examination of the particular situation.
© 2016 KPMG International Cooperative (“KPMG International”), a Swiss entity. Member firms of the KPMG network of independent firms are affiliated with KPMG International. KPMG International provides no client services. No member firm has any authority to obligate or bind KPMG International or any other member firm vis-à-vis third parties, nor does KPMG International have any such authority to obligate or bind any member firm. All rights reserved. Printed in the United Kingdom.
The KPMG name, logo and “cutting through complexity” are registered trademarks or trademarks of KPMG International. Produced by CREATE Graphics | CRT054473
Dr Steffen Wagner Global Chair, Transport
Tel: + 49 (0)69 9587 1507 [email protected]
Hartmut HeckertGlobal Head of Shipping
Tel: + 49 (0)40 32015 5307 [email protected]
James StampGlobal Head of Aviation
Tel: + 44 (0)20 7311 4418 [email protected]
Justin ZatouroffGlobal Head of Post and Express
Tel: + 44 (0)20 7311 8415 [email protected]