
KPI Examples
50
Key Performance Indicators (KPI's) A set of quantifiable measures that a company or industry uses to gauge or compare performance in terms of meeting their strategic and operational goals. KPIs vary between companies and industries, depending on their priorities or performance criteria. Also referred to as "key success indicators (KSI)". Notes: A company must establish its strategic and operational goals and then choose the KPIs which best reflect those goals. For example, if a software company's goal is to have the fastest growth in its industry, its main performance indicator may be the measure of revenue growth year-on-year. A company's KPIs will be stated in its annual report. Also, KPIs will often be industry-wide standards, like "same store sales", in the retail sector. Key Performance Indicators (KPIs) provide vital information to the organisation for tracking and predicting business performance against strategic objectives in a way that compliments financial measures. KPIs can be part of a corporate-wide Balance Scorecard implementation or can be used to monitor each individual business function. By measuring and monitoring operational efficiency, employee performance and innovation, customer satisfaction, as well as financial performance, long term strategies can be linked to short term actions. MAINTENANCE KEY PERFORMANCE INDICATORS (KPI's or METRICS) KPI Example > Effective key performance indicators (or metrics) are a valuable tool for triggering corrective maintenance actions. Often however, maintenance metrics are worthless since they do not provide worthwhile indications of maintenance performance, particularly when this performance is below acceptable levels. The key to this is that a KPI should normally have a trigger level set on it that is used to initiate some corrective maintenance action. If no trigger has been set then your maintenance metric is ineffective. If no one has defined the level on the metric where performance becomes bad enough to require corrective action, then there is no point in recording it.
-
Upload
haihuong2005 -
Category
Documents
-
view
130 -
download
5
description
Ví dụ về KPI
Transcript of KPI Examples

Key Performance Indicators (KPI's)
A set of quantifiable measures that a company or industry uses to gauge or compare performance in terms of meeting their strategic and operational goals. KPIs vary between companies and industries, depending on their priorities or performance criteria. Also referred to as "key success indicators (KSI)". Notes: A company must establish its strategic and operational goals and then choose the KPIs which best reflect those goals. For example, if a software company's goal is to have the fastest growth in its industry, its main performance indicator may be the measure of revenue growth year-on-year. A company's KPIs will be stated in its annual report. Also, KPIs will often be industry-wide standards, like "same store sales", in the retail sector.
Key Performance Indicators (KPIs) provide vital information to the organisation for tracking and predicting business performance against strategic objectives in a way that compliments financial measures. KPIs can be part of a corporate-wide Balance Scorecard implementation or can be used to monitor each individual business function. By measuring and monitoring operational efficiency, employee performance and innovation, customer satisfaction, as well as financial performance, long term strategies can be linked to short term actions.
MAINTENANCE KEY PERFORMANCE INDICATORS (KPI's or METRICS)
KPI Example >
Effective key performance indicators (or metrics) are a valuable tool for triggering corrective maintenance actions. Often however, maintenance metrics are worthless since they do not provide worthwhile indications of maintenance performance, particularly when this performance is below acceptable levels.
The key to this is that a KPI should normally have a trigger level set on it that is used to initiate some corrective maintenance action. If no trigger has been set then your maintenance metric is ineffective. If no one has defined the level on the metric where performance becomes bad enough to require corrective action, then there is no point in recording it.
A realistic period must also be used for each metric - in some cases this may be one hour while in others it could be one year.
KPI Example as applied to a Production Process Maintenance Metric
Let's say that we are monitoring the production output from a critical machine. Maximum output volume from the machine is 1250 widgets per hour but rather than drive it at full speed production volumes are set at 1000 widgets per hour. Output is monitored as a KPI on a one hourly basis.
In this example we could turn on a warning light when volumes drop below 950 per hour. At this point a maintenance technician would be called in to address the problem. The significant thing is that our KPI is set at 950 and this is defined as the trigger level at which some action is required.

The same principles can be applied to less obvious KPI's such as planned maintenance backlog. For example it may be decided that when PM backlog reaches a total of 100 hours then overtime must be used to reduce the backlog. Once again the key point is that a trigger level of 100 hours has been set.
Technicians and first line supervisors should be heavily involved in setting targets for performance indicators since they are usually best placed to decide what actually are acceptable targets and because management driven schemes often fail to work in the long term.
While it may be possible to create a metric for a particular factor it is not always practical. We must balance the effort involved and the cost of collecting the data with its actual or potential value. For example we may consider that it would be useful to develop a metric that indicates the number of work dockets completed against the number issued. Poor performance on this metric would indicate a reduction in commitment on behalf of the technicians to input data to the CMMS. For this to be useful however would entail a very significant amount of work in scanning the CMMS for each work docket which was not completed and then trying to determine to whom it was issued, etc.
Some Typical Maintenance Key Performance Indicators
← Overtime worked against plan ← PM schedule compliance ← Time taken to answer maintenance calls ← Budget compliance ← PM Backlog man-hours ← Critical Equipment availability (Don’t worry about non-critical equipment) ← Number of breakdowns (Unplanned maintenance) ← Production equipment performance (By output volume levels) ← Equipment performance (with respect to quality) ← MTBF
KPI Example
EBITDA ProfitabilityCalculation : EBITDA / RevenueInformation : Operating Efficiency IndicatorFrequency : Monthly
Business Value GrowthCalculation : Business Value (current) / Business Value (previous period)Information : Business Management Efficiency IndicatorFrequency : Quarterly
Brand RecognizebilityCalculation : Mentions Number Received by Representative SamplingInformation : Business Management Efficiency IndicatorFrequency : Quarterly
Market Share GrowthCalculation : Market Share (current) / Market Share (previous period)Information : Marketing Efficiency Indicator

Frequency : Quarterly
Lost Clients RateCalculation : Lost Accounts Number / Opening Total Accounts NumberInformation : Business Risk IndicatorFrequency : Quarterly
Prime Clients RateCalculation : Clients Generating 70% of Revenue / Total Accounts NumberInformation : Business Risk IndicatorFrequency : Quarterly
Investment Project Evaluating SpeedCalculation : Projects, evaluated in time / Total projects preparedInformation : Operational Execution and Management Flexibility IndicatorFrequency : Quarterly
Key Performance Indicators (Human Resources)
A set of quantifiable measures that a company or industry uses to gauge or compare performance in terms of meeting their strategic and operational goals. KPIs vary between companies and industries, depending on their priorities or performance criteria. Also referred to as "key success indicators (KSI)". Notes: A company must establish its strategic and operational goals and then choose the KPIs which best reflect those goals. For example, if a software company's goal is to have the fastest growth in its industry, its main performance indicator may be the measure of revenue growth year-on-year. A company's KPIs will be stated in its annual report. Also, KPIs will often be industry-wide standards, like "same store sales", in the retail sector.
Key Performance Indicators (KPIs) provide vital information to the organisation for tracking and predicting business performance against strategic objectives in a way that compliments financial measures. KPIs can be part of a corporate-wide Balance Scorecard implementation or can be used to monitor each individual business function. By measuring and monitoring operational efficiency, employee performance and innovation, customer satisfaction, as well as financial performance, long term strategies can be linked to short term actions. Staff TurnoverCalculation : Staff Leaving over the Month / Staff Number at the Last Day of the Month Information : Efficiency Indicator Frequency : Monthly Recruitment QualityCalculation : New Hires Leaving Within 6 Months / Total Hires Over the Year Information : Efficiency Indicator

Frequency : Monthly Training Days ExecutionCalculation : Actual Training Days / Budget Training Days Information : Efficiency Indicator Frequency : Monthly Fill Vacancy TimeCalculation : Average time HR required to fill 1 vacancy (broken down by grades) Information : Marketing Efficiency Indicator Frequency : Monthly
Key Performance Indicators (Finance)
A set of quantifiable measures that a company or industry uses to gauge or compare performance in terms of meeting their strategic and operational goals. KPIs vary between companies and industries, depending on their priorities or performance criteria. Also referred to as "key success indicators (KSI)". Notes: A company must establish its strategic and operational goals and then choose the KPIs which best reflect those goals. For example, if a software company's goal is to have the fastest growth in its industry, its main performance indicator may be the measure of revenue growth year-on-year. A company's KPIs will be stated in its annual report. Also, KPIs will often be industry-wide standards, like "same store sales", in the retail sector.
Key Performance Indicators (KPIs) provide vital information to the organisation for tracking and predicting business performance against strategic objectives in a way that compliments financial measures. KPIs can be part of a corporate-wide Balance Scorecard implementation or can be used to monitor each individual business function. By measuring and monitoring operational efficiency, employee performance and innovation, customer satisfaction, as well as financial performance, long term strategies can be linked to short term actions.
EBITDA ProfitabilityCalculation : EBITDA / Revenue Information : Operating Efficiency Indicator Frequency : Monthly Accounts ReceivableCalculation : Accounts Receivable Information : Business Management Efficiency Indicator Frequency : Monthly
Days Sale OutstandingCalculation : 30 / (Total monthly revenue / Average accounts receivable per month) Information : Business Management Efficiency Indicator Frequency : Monthly Outstanding debts over 2 month
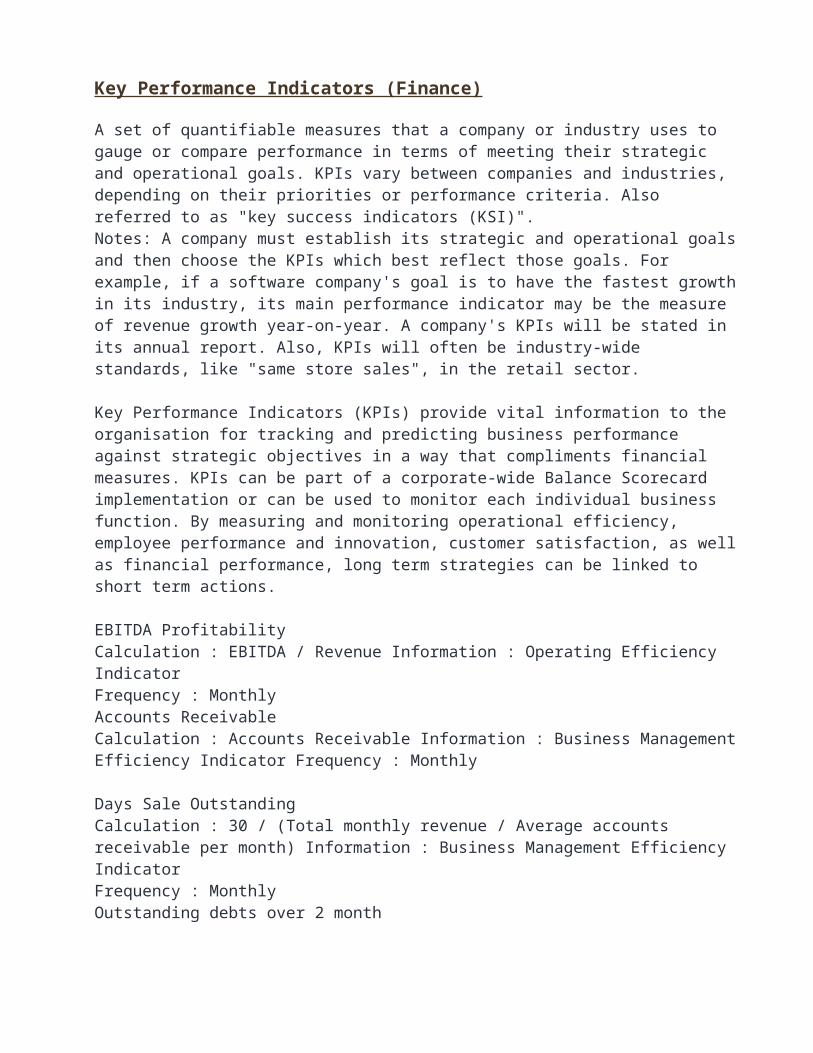
Calculation : Outstanding debts over 2 month / Average accounts receivable Information : Marketing Efficiency Indicator Frequency : Monthly
Key Performance Indicators (General)
A set of quantifiable measures that a company or industry uses to gauge or compare performance in terms of meeting their strategic and operational goals. KPIs vary between companies and industries, depending on their priorities or performance criteria. Also referred to as "key success indicators (KSI)". Notes: A company must establish its strategic and operational goals and then choose the KPIs which best reflect those goals. For example, if a software company's goal is to have the fastest growth in its industry, its main performance indicator may be the measure of revenue growth year-on-year. A company's KPIs will be stated in its annual report. Also, KPIs will often be industry-wide standards, like "same store sales", in the retail sector.
Key Performance Indicators (KPIs) provide vital information to the organisation for tracking and predicting business performance against strategic objectives in a way that compliments financial measures. KPIs can be part of a corporate-wide Balance Scorecard implementation or can be used to monitor each individual business function. By measuring and monitoring operational efficiency, employee performance and innovation, customer satisfaction, as well as financial performance, long term strategies can be linked to short term actions. EBITDA ProfitabilityCalculation : EBITDA / Revenue Information : Operating Efficiency Indicator Frequency : Monthly Business Value GrowthCalculation : Business Value (current) / Business Value (previous period) Information : Business Management Efficiency Indicator Frequency : Quarterly
Brand RecognizebilityCalculation : Mentions Number Received by Representative Sampling Information : Business Management Efficiency Indicator Frequency : Quarterly Market Share GrowthCalculation : Market Share (current) / Market Share (previous period) Information : Marketing Efficiency Indicator Frequency : Quarterly
Lost Clients RateCalculation : Lost Accounts Number / Opening Total Accounts Number Information : Business Risk Indicator Frequency : Quarterly Prime Clients Rate

Calculation : Clients Generating 70% of Revenue / Total Accounts Number Information : Business Risk Indicator Frequency : Quarterly Investment Project Evaluating SpeedCalculation : Projects, evaluated in time / Total projects prepared Information : Operational Execution and Management Flexibility Indicator Frequency : Quarterly
Key Performance Indicators (IT)
Data loss accidentsCalculation : Data loss accidents happenedInformation : IT efficiency indicatorFrequency : Monthly
Quality of softwareCalculation : Average score at 10-grade. Scale obtained at users surveyInformation : IT efficiency indicatorFrequency : Quarterly
IT budget executionCalculation : Actual IT costs / Planned IT costsInformation : IT efficiency indicatorFrequency : Quarterly
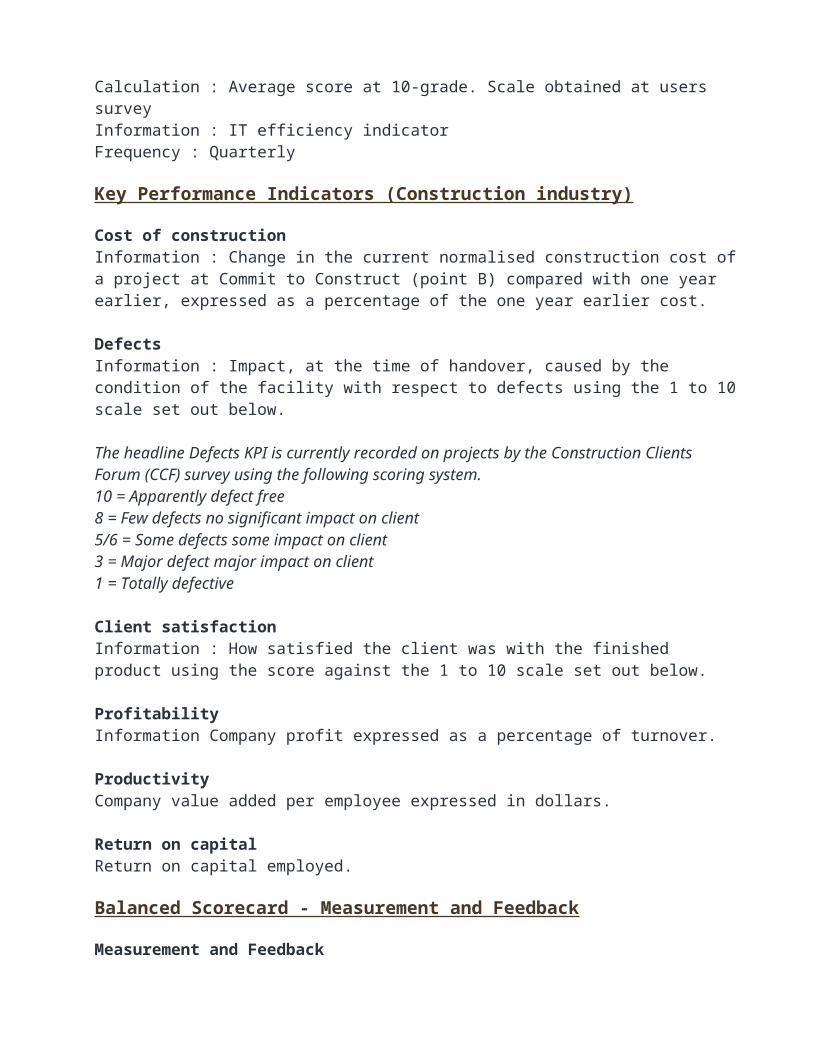
Quality of communications bandwidthCalculation : Average score at 10-grade. Scale obtained at users surveyInformation : IT efficiency indicatorFrequency : Quarterly
Key Performance Indicators (Construction industry)
Cost of constructionInformation : Change in the current normalised construction cost of a project at Commit to Construct (point B) compared with one year earlier, expressed as a percentage of the one year earlier cost.
DefectsInformation : Impact, at the time of handover, caused by the condition of the facility with respect to defects using the 1 to 10 scale set out below.
The headline Defects KPI is currently recorded on projects by the Construction Clients Forum (CCF) survey using the following scoring system.

10 = Apparently defect free8 = Few defects no significant impact on client5/6 = Some defects some impact on client3 = Major defect major impact on client1 = Totally defective
Client satisfactionInformation : How satisfied the client was with the finished product using the score against the 1 to 10 scale set out below.
ProfitabilityInformation Company profit expressed as a percentage of turnover.
ProductivityCompany value added per employee expressed in dollars.
Return on capitalReturn on capital employed.
Balanced Scorecard - Measurement and Feedback
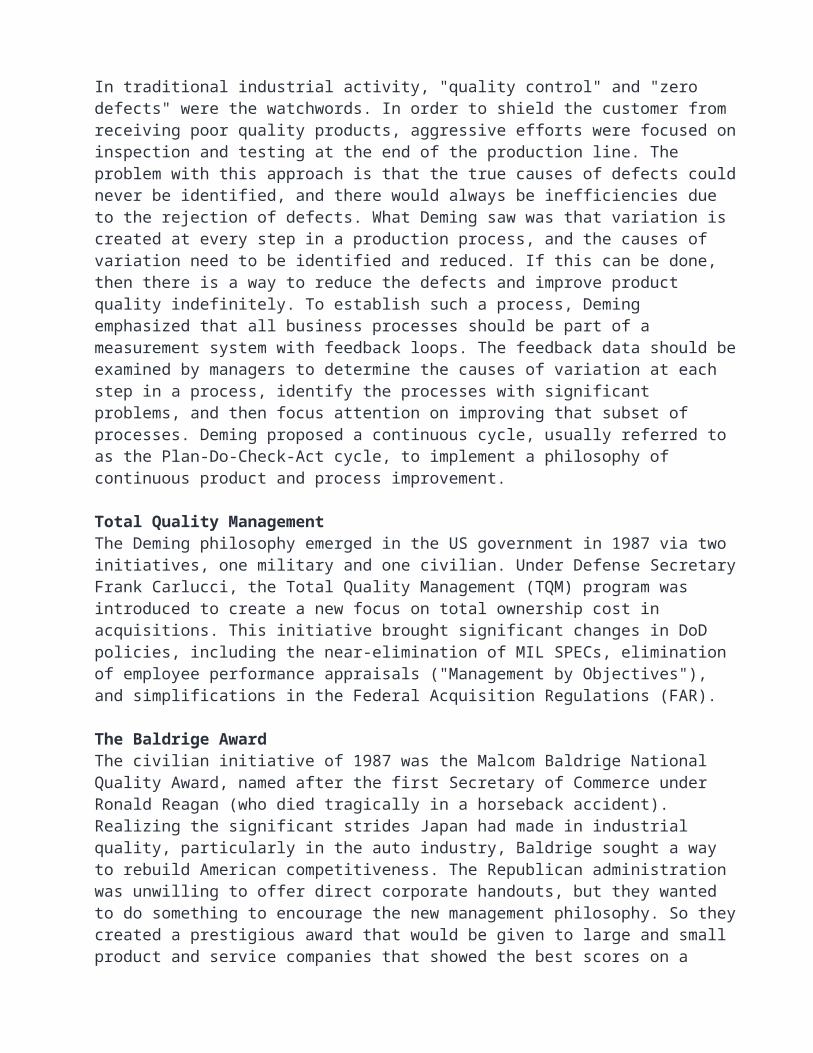
Measurement and FeedbackIn traditional industrial activity, "quality control" and "zero defects" were the watchwords. In order to shield the customer from receiving poor quality products, aggressive efforts were focused on inspection and testing at the end of the production line. The problem with this approach is that the true causes of defects could never be identified, and there would always be inefficiencies due to the rejection of defects. What Deming saw was that variation is created at every step in a production process, and the causes of variation need to be identified and reduced. If this can be done, then there is a way to reduce the defects and improve product quality indefinitely. To establish such a process, Deming emphasized that all business processes should be part of a measurement system with feedback loops. The feedback data should be examined by managers to determine the causes of variation at each step in a process, identify the processes with significant problems, and then focus attention on improving that subset of processes. Deming proposed a continuous cycle, usually referred to as the Plan-Do-Check-Act cycle, to implement a philosophy of continuous product and process improvement.
Total Quality ManagementThe Deming philosophy emerged in the US government in 1987 via two initiatives, one military and one civilian. Under Defense Secretary Frank Carlucci, the Total Quality Management (TQM) program was introduced to create a new focus on total ownership cost in acquisitions. This initiative brought significant changes in DoD policies, including the near-elimination of MIL SPECs, elimination of employee performance appraisals ("Management by Objectives"), and simplifications in the Federal Acquisition Regulations (FAR).
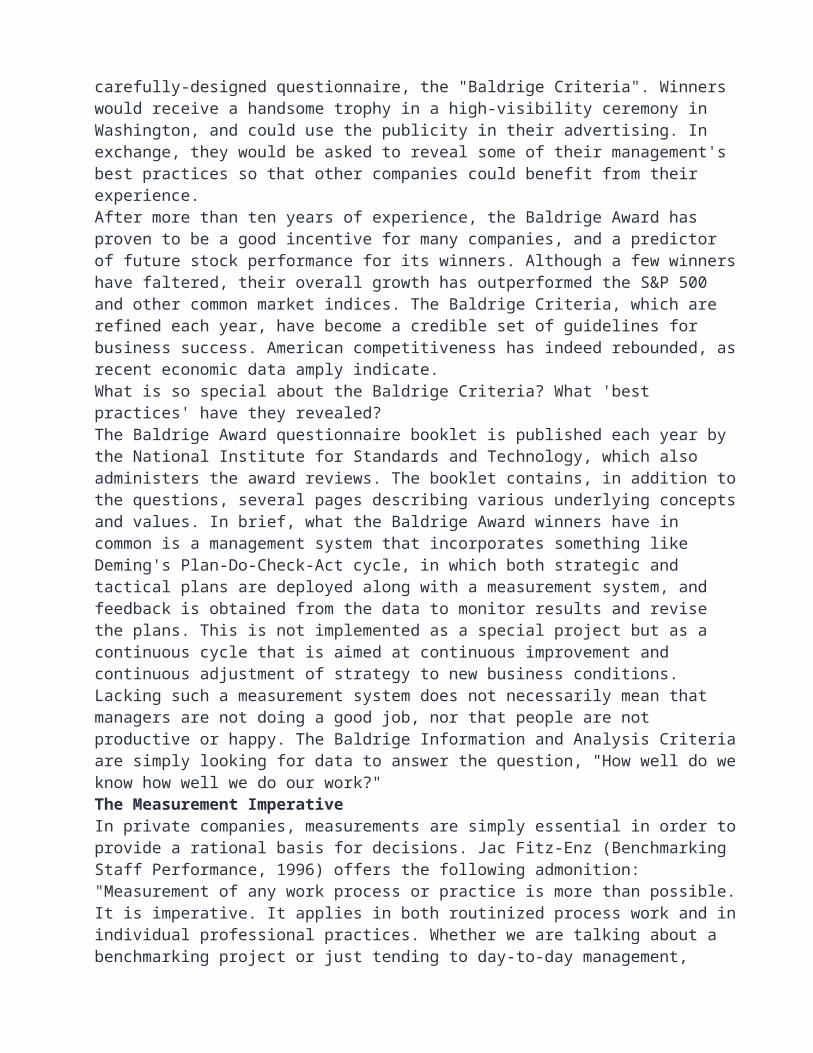
The Baldrige AwardThe civilian initiative of 1987 was the Malcom Baldrige National Quality Award, named after the first Secretary of Commerce under Ronald Reagan (who died tragically in a horseback accident). Realizing the significant strides Japan had made in industrial quality, particularly in the auto industry, Baldrige sought a way to rebuild American competitiveness. The Republican administration was unwilling to offer direct corporate handouts, but they wanted to do something to encourage the new management philosophy. So they created a prestigious award that would be given to large and small product and service companies that showed the best scores on a carefully-designed questionnaire, the "Baldrige Criteria". Winners would receive a handsome trophy in a high-visibility ceremony in Washington, and could use the publicity in their advertising. In exchange, they would be asked to reveal some of their management's best practices so that other companies could benefit from their experience. After more than ten years of experience, the Baldrige Award has proven to be a good incentive for many companies, and a predictor of future stock performance for its winners. Although a few winners have faltered, their overall growth has outperformed the S&P 500 and other common market indices. The Baldrige Criteria, which are refined each year, have become a credible set of guidelines for business success. American competitiveness has indeed rebounded, as recent economic data amply indicate. What is so special about the Baldrige Criteria? What 'best practices' have they revealed? The Baldrige Award questionnaire booklet is published each year by the National Institute for Standards and Technology, which also administers the award reviews. The booklet contains, in addition to the questions, several pages describing various underlying concepts and values. In brief, what the Baldrige Award winners have in common is a management system that incorporates something like Deming's Plan-Do-Check-Act cycle, in which both strategic and tactical plans are deployed along with a measurement system, and feedback is obtained from the data to monitor results and revise the plans. This is not implemented as a special project but as a continuous cycle that is aimed at continuous improvement and continuous adjustment of strategy to new business conditions. Lacking such a measurement system does not necessarily mean that managers are not doing a good job, nor that people are not productive or happy. The Baldrige Information and Analysis Criteria are simply looking for data to answer the question, "How well do we know how well we do our work?" The Measurement ImperativeIn private companies, measurements are simply essential in order to provide a rational basis for decisions. Jac Fitz-Enz (Benchmarking Staff Performance, 1996) offers the following admonition:"Measurement of any work process or practice is more than possible. It is imperative. It applies in both routinized process work and in individual professional practices. Whether we are talking about a benchmarking project or just tending to day-to-day management, without number we don't really know what we are doing. If managers do not know [measurements], I have only onequestion: What do you think they are managing? Without metrics, managers are only caretakers. They are administrators of processes." In government, is performance-based management another management fad that is going to disappear tomorrow? On the contrary, it appears to be becoming more entrenched. An illustration of
that is the passing in 1993 of the Government Performance and Results Act (GPRA) - the relevant excerpt of the Act is here. This Act requires all government agencies to deploy a strategic plan, set performance targets, and measure performance over time. Future budgets for the agencies will be set (by the Office of Management and Budget, not the Departments) with consideration given to progress in achieving performance targets. This is reality -- the US taxpayer wants to see a government that has demonstrable results and progress. Otherwise, there will be massive outsourcing of every possible function to private industry, where market forces promise better performance. In the Department of Defense in particular, it is clear that the GPRA will be taken seriously. The Secretary of Defense, William Cohen, in his previous position was one of the Senate sponsors of the GPRA. Recently he has flatly announced that there will be new rounds of Base Realignments And Closings (BRACs). His goal is to cut civilians in the DoD by 40%. At the same time, he and Congress agree that there is a need for the country to preserve its technology base and special skills, so there is a desire for judicious, surgical-style force reductions. Quantitative metrics such as scores of Baldrige-based self assessments will be one of the criteria considered in making future decisions about these reductions. The handwriting is on the wall. Government leaders that want to survive must make significant efforts to improve performance -- and be able to prove it with verifiable measurements. But What Must Be Measured?The earlier era of measurement-based mangement was focused on industrial production. In operations such as automobile production, there are numerous tangible, repetitive processes that can be precisely measured and monitored. Shewhart, as early as the 1930's, had begun to institute such methods as Statistical Process Control (SPC) for industrial processes. However, in the 1990's the economic drivers are not industrial mass production companies and blue-collar workers, but office-oriented production by 'knowledge workers'. In this environment, there is much that is intangible, and some processes, such as R&D, are not even repetitive. So how can performance be measured adequately in a modern enterprise?In most traditional industrial and government organizations, there have always been ample measurements of one particular kind: financial data. In private companies, profit or the 'bottom line' is the ultimate indicator of success, and earnings are carefully watched. Public agencies often operate at a loss and are subsidized, but the loss is targeted to a specified limit; the metric to compute this is called the Net Operating Result (NOR). This is the dial that senior staff are constantly watching. Financial data are precise and objective. However, they do not tell the whole story of a company's health. Financials are lagging indicators -- they show what happened in the past. What we would like to have are some leading indicators to get an idea of what may be ahead. Lacking these, companies often drive straight ahead in the fog and suffer the consequences. The balanced scorecard offers an alternative to the traditional financial indicators. It describes and explains what has to be measured in order to assess the effectiveness of strategies. The balanced scorecard approach to aligning strategy with action is just as applicable in the public sector as in the private sector, particularly for the reason that it does not focus so heavily on financial metrics, such as profit, which are not relevant in governmental organizations. Hence the balanced scorecard is being seen as an appropriate way for the government to implement the requirements of the
Government Performance and Results Act. Read more about this in the other articles on this web site.
Setting and Exceeding Sales Goals through Key Performance Indicators (KPI)
Have you identified the KPIs in your sales process?
A good KPI example in the sales process might be how many times you advance the first sales appointment to the next phase, whether that’s a demonstration, a site visit, a survey or a proposal. Another KPI is how many times you gain a new customer once the first gateway is passed. And when you do gain a new customer, what’s the average revenue you achieve? That’s certainly an important KPI. Because if your average revenue per sale is 40% less than the average peer KPI, you might want to find out why and take focused action to improve it, as you’re leaving money on the table.
And what about the length of a sales cycle in days? Is that conditional or do you have a degree of control over it? If you have a team member that has an average sales cycle 30% shorter than the peer group, uncover and assimilate those best practices out to the rest of the sales team. Less time, more results. That makes ‘Sales Cycle’ a valuable KPI.
On a practical level, KPIs can provide management prospect reactions to their service offering for feedback to marketing and product development, detect problem areas in sales performance and signal the need for strategic or tactical modifications — even an all-out intervention through pinpoint sales performance training.
Perhaps the most overlooked KPI is the individual ‘Magic number’; how many new weekly sales opportunities must be generated based on neighboring KPI’s. Think of the magic number as the fuel in your gas tank needed to get from point A to point B. It’s directly proportional to how far a distance, how fast you drive and your average miles per gallon. Your sales process ‘Magic number’ is a derivative of your average revenue per sale, 1st appointment to poroposal ratio, closing ratio and revenue goal. It’s your ‘Activity barometer’ and it should be at 100%.
The following are some tips for improving several sales process KPI’s.
If your current 1st Appointment to Proposal ratio is below 65%:
1. Internally define what your ‘Next step’ objective of the 1st appointment is; a demo, a site visit, a survey or a proposal. Then train to a process and measure the outcome.2. Decide to start at the ‘Top’ with the fiscal authority that can ‘Call the shots’. 3. Avoid ‘Selling’ your product on the 1st appointment. Instead, outline your diagnostic steps to evaluate the fit between your solutions parallel to their business objectives.
If your current Closing ratio is below 65%:
1. Ask pertinent questions to what the Prospect Company’s decision-making process is, what the internal criteria for change is and what players need to be involved for evaluation.2. Communicate a timeline and set a specific date for the 2nd appointment before leaving the 1st appointment. Encourage that all management players be present at the next appointment.3. Catalog risk factors for each management player and develop strategies, tactics, and tools for direct communication to them.4. Have relevant industry and title reference letters available for ‘Real-time’ credibility.
If your current ‘Activity barometer’ is below 100%:
1. Announce the Competency of converting conversations to appointments as a Key performance Indicator for sales success.2. Define an appointment setting training objective and set a realistic goal. 3. Develop a training process in line with prospecting scenarios and best practice communications. 4. Don’t sell your ‘Widget’; sell the Business reason to meet.5. Partner with technology to transfer best prospecting practices into ‘Intellectual capital’ promotion throughout your sales society.
Ultimately, sales trainers and management should work in concert to create a new culture by replacing random sales routines with specific KPI competency training.
Targeted and timely KPI training can make a critical difference to your monthly revenue scorecard. In today’s high sales performance culture migrate away from monthly and quarterly ‘Quota’ focus to daily routines and weekly goals. The opportunity rests squarely on switching paradigms from the required ‘End result’ to the necessary steps (KPIs) to get there routinely. Then build supporting tools for learning and application.

And don’t forget your ‘Magic Number’.
Defining Key Performance Indicators (KPI)Reply from rajnjus on 1/10/2007 7:14:00 PM
Don,
The SAP Maintenance strategy provides many benefits :
Its a strategy for all requests for maintanance;
Integration of all aspects of plant maintenance processes, including planning , materials, labor reporting, and accounting in real time;
?Overtime worked against plan ?PM schedule compliance ?Time taken to answer maintenance calls Budget compliance ?PM Backlog man-hours ?Critical Equipment availability (Don?t worry about non-critical equipment) ?Number of breakdowns (Unplanned maintenance) ?Production equipment performance (By output volume levels) ?Equipment performance (with respect to quality) ?MTBF
KPI Example as applied to a Production Process Let's say that we are monitoring the production output from a critical machine. Maximum output volume from the machine is 1250 widgets per hour but rather than drive it at full speed production volumes are set at 1000 widgets per hour. Output is monitored as a KPI on a one hourly.
What does Key Performance Indicator stand for in manufacturing?
Question:
Answer: Its simply a way of checking how well a manufactuing operation is performing against set targets, and may form part of a supply contract with a customer. You may have targets for quality and on time delivery at you customers for instance, say each is marked out of 100. If all targets are met then you score full points. If you miss deliveries or PPM rates are too high, you will lose points.
KPI's are usually set by managers and can be anything they like.For example, it could be percentage of defects must be less than 20%, or number of units made must be at least 50 per day, or low wastage etc. etc.
a key performance indicator is a measure of how well a company is doing, we have them at the council i work for and a KPI example is the percentage of enquiries/letters we answer fully

within 3 working days, a KPI can be any thing that is relevant and measureable, in industry it might be the number of faulty goods returned, or orders delivered on time etc
It could be specific goal and target that measures your progress
Beware "business speak"!!!
KPIs are are set goals as measured against set criteria by management - often fairly abritrary and usually constructed in such a way as to shed a positive light on a given aspect of the business which is generally tied in with bonus payments.
In manufacturing specifically, a true KPI would be the percentage fulfillment of orders within the mandated time scale (although this can be engineered/manipulated).Custom... satisfaction ratings can be used - but these are also manipulated and engineered to give false positives due to the impossibility of either non-response or a true negative.
For a true KPI one should examine the business in question and it's minimum requirements for sustainability. These should then be weighed against the prevailing economic performance of all other businesses in related sectors... giving a minimum and maximum performance rating at any given time (and one which is, therefore variable according to the prevailing market trends)... this can only be truly administered by an impartial observer .. and is almost never done!!
KPI's are usually set by higher end mgmt due to client and company needs. Some examples are production rate, on-time shipping, inventory accurracy.
Use leading KPIs to spot troubleBy Ricky Smith, CMRP, Contributing EditorPlantServices.comKeywords: KPI
Does your plant have reliability issues and a hard time meeting production targets? Metrics such as key performance indicators (KPIs), when identified and aligned properly, can save your plant, your job and your career. So grab a pen, open your mind and get ready to learn.Does your plant have reliability issues and a hard time meeting production targets? If so, it’s time to listen up! Metrics such as key performance indicators (KPIs), when identified and aligned properly, can save your plant, your job and your career. So grab a pen, open your mind and get ready to learn.It’s amazing that most companies in North America manage with very few metrics to measure the current performance of their maintenance and reliability process. They come to me crying for help, seeking a solution for their lack of management control. I know the feeling, as I was once one of them.

The sad part is, these companies aren’t even aware they need KPIs to know where to focus. They fight reliability, production and quality issues on a daily basis, and seem to be lost in a quagmire. Many are replacing managers so fast, the people on the plant floor aren’t sure who is in charge from one day to the next. They’re crying for help and don’t know which way to go.It doesn’t have to be that way. “By aligning our KPIs properly and managing the right ones, Carpenter discovered, for the first time, profits in a down market,” says Adonis Campbell, corporate reliability manager for Carpenter, a Richmond, Va.-based manufacturer of polyurethane foam. “We‘ve seen profits continue to rise as cost continues to drop by simply managing using leading KPIs.”
Measure the right things Think about driving a car with the windshield painted black. You can’t see where you’re going, but you do get a glimpse of where you’ve gone through the rear-view mirror. You don’t find out whether or not you were successful until either it’s too late, or disaster strikes. Your car goes into the ditch (high costs, or worse), or you never reach your destination (business goals are not met). In the famous words of the late, great industrial revolutionary Peter Drucker, “You cannot manage something you cannot control, and you cannot control something you cannot measure.”Drucker also said, “The problem with management is they’re measuring the wrong things.” If management truly understood the power of KPIs, things would quickly change, but trying to manage without KPIs leaves them feeling lost without hope in a reactive environment. This is a serious problem and it costs companies around the world billions of dollars due to what I consider to be lack of management control.“The number of companies with adequate, meaningful key performance indicators is extremely low,” says James Nesbitt, reliability practitioner and KPI expert, Ivara (www.ivara.com). Managers seeking to measure the performance of their organizations start by measuring too much. Without understanding where the opportunities are in their organization, they are left trying to translate data from a host of disconnected or misleading indicators, Nesbitt says. “This can lead to poor decisions or wasted effort trying to improve indicators that have marginal or no impact on business improvement.”
Leading versus lagging Let’s get down to basics and define KPIs. Within maintenance, we must first define the performance we want to measure. Is it the performance of the equipment? Is it the performance of the spare parts warehouse? Is it the performance of the maintenance function? These may seem like simple questions, but I often see companies mix their KPIs, as they haven’t defined the specific area of the business for which they are attempting to measure performance.For example, we want to measure the performance of the maintenance function. There are really two kinds of KPIs to choose from in measuring any particular function of a business: leading indicators and lagging indicators, or leading KPIs and lagging KPIs.We need leading indicators to manage a part of the business, while lagging indicators tell us how well we have managed. Leading indicators let us directly and immediately respond when a poor result is found. Lagging indicators tell us how well we performed, but we have little opportunity to immediately affect underperformance. Instead, when we see an unacceptable lagging indicator, we typically must drill down to the leading indicators to uncover the cause of the underperformance, and from there we can implement appropriate changes. Leading KPIs for the maintenance function measure how well we are conducting each of the steps in the maintenance process. For example, a leading KPI for the work planning element of maintenance process could be “the percentage of planned jobs that were executed using the specified amount of labor.” If the planner is estimating labor correctly, we will see a high percentage of jobs completed using the planned number of hours. If the maintenance manager finds that the value of the KPI is lower than expected, he or she can discuss with the planner how best to immediately improve the results – possibly for the remainder of that day.With all KPIs, by definition, we are measuring past performance, so I’m not suggesting that leading indicators can be tweaked to improve upon past performance. But as you can see in this example, if we’re managing using leading indicators, we can respond immediately when needed. A lagging indicator would measure the results of how well we managed the maintenance function. For example, where the maintenance function is well managed, we would expect an appropriate balance between the cost of maintenance and the plant availability. A lagging indicator could therefore be “the actual maintenance cost for a month as a percentage of the budgeted maintenance cost for that month.” If the actual maintenance cost for last month is found to be 110% of budget, there is really very little we can do to directly influence the performance of this KPI today. Instead, we would look at all of the leading indicators, probably including those that measure the performance of our maintenance process, to determine whether those values give us a signal for managing the problem.

Table 1 lists some KPIs I prefer to use, along with the world-class level where applicable. Leading indicators such as “Percent rework” and “Percent of PMs executed on time” affect the overall performance of the maintenance process. The corresponding lagging indicators are “Maintenance cost as a percent of budget” and “Plant availability.” At least one of these lagging indicators will suffer if there is sufficient underperformance in the leading indicators.
Key Performance Indicators (KPI)From F. John Reh,Your Guide to Management.FREE Newsletter. Sign Up Now!
How an organization defines and measures progress toward its goalsKey Performance Indicators, also known as KPI or Key Success Indicators (KSI), help an organization define and measure progress toward organizational goals. Once an organization has analyzed its mission, identified all its stakeholders, and defined its goals, it needs a way to measure progress toward those goals. Key Performance Indicators are those measurements.
What Are Key Performance Indicators (KPI)
Key Performance Indicators are quantifiable measurements, agreed to beforehand, that reflect the critical success factors of an organization. They will differ depending on the organization. A business may have as one of its Key Performance Indicators the percentage of its income that comes from return customers. A school may focus its Key Performance Indicators on graduation rates of its students. A Customer Service Department may have as one of its Key Performance Indicators, in line with overall company KPIs, percentage of customer calls answered in the first minute. A Key Performance Indicator for a social service organization might be number of clients assisted during the year. Whatever Key Performance Indicators are selected, they must reflect the organization's goals, they must be key to its success,and they must be quantifiable (measurable). Key Performance Indicators usually are long-term considerations. The definition of what they are and how they are measured do not change often. The goals for a particular Key Performance Indicator may change as the organization's goals change, or as it gets closer to achieving a goal.
Key Performance Indicators Reflect The Organizational Goals
An organization that has as one of its goals "to be the most profitable company in our industry" will have Key Performance Indicators that measure profit and related fiscal measures. "Pre-tax Profit" and "Shareholder Equity" will be among them. However, "Percent of Profit Contributed to Community Causes" probably will not be one of its Key Performance Indicators. On the other hand, a school is not concerned with making a profit, so its Key Performance Indicators will be different. KPIs like "Graduation Rate" and "Success In Finding Employment After Graduation", though different, accurately reflect the schools mission and goals.
Key Performance Indicators Must Be Quantifiable
If a Key Performance Indicator is going to be of any value, there must be a way to accurately define and measure it. "Generate More Repeat Customers" is useless as a KPI without some way to distinguish between new and repeat customers. "Be The Most Popular Company" won't work as a KPI because there is no way to measure the company's popularity or compare it to others. It is also important to define the Key Performance Indicators and stay with the same definition from year to year. For a KPI of "Increase Sales", you need to address considerations like whether to measure by units sold or by dollar value of sales. Will returns be deducted from sales in the month of the sale or the month of the return? Will sales be recorded for the KPI at list price or at the actual sales price? You also need to set targets for each Key Performance Indicator. A company goal to be the employer of choice might include a KPI of "Turnover Rate". After the Key Performance Indicator has been defined as "the number of voluntary resignations and terminations for performance, divided by the total number of employees at the beginning of the period" and a way to measure it has been set up by collecting the information in an HRIS, the target has to be established. "Reduce turnover by five percent per year" is a clear target that everyone will understand and be able to take specific action to accomplish.
Key Performance Indicators Must be Key To Organizational Success
Many things are measurable. That does not make them key to the organization's success. In selecting Key Performance Indicators, it is critical to limit them to those factors that are essential to the organization reaching its goals. It is also important to keep the number of Key Performance Indicators small just to keep everyone's attention focused on achieving the same KPIs. That is not to say, for instance, that a company will have only three or four total KPIs in total. Rather there will be three or four Key Performance Indicators for the company and all the units within it will have three, four, or five KPIs that support the overall company goals and can be "rolled up" into them. If a company Key Performance Indicator is "Increased Customer Satisfaction", that KPI will be focused differently in different departments.
Sponsored LinksExamples of KPI Choose the right KPI for your business (general, financial, HR) kpi.awardspace.com

Goal-Driven Measurement Is your improvement plan working? SEI training helps you find out. www.sei.cmu.edu Training materials Over 1000 Training materials. Get results at affordable prices www.matrixplus.biz The Manufacturing Department may have a KPI of "Number of Units Rejected by Quality Inspection", while the Sales Department has a KPI of "Minutes A Customer Is On Hold Before A Sales Rep Answers". Success by the Sales and Manufacturing Departments in meeting their respective departmental Key Performance Indicators will help the company meet its overall KPI.
Good Key Performance Indicators vs. Bad
Bad: Title of KPI: Increase Sales Defined: Change in Sales volume from month to month Measured: Total of Sales By Region for all region Target: Increase each month
What's missing? Does this measure increases in sales volume by dollars or units? If by dollars, does it measure list price or sales price? Are returns considered and if so do the appear as an adjustment to the KPI for the month of the sale or are they counted in the month the return happens? How do we make sure each sales office's volume numbers are counted in one region, i.e. that none are skipped or double counted? How much, by percentage or dollars or units, do we want to increase sales volumes each month?(Note: Some of these questions may be answered by standard company procedures.) Good:
Title of KPI: Employee Turnover Defined: The total of the number of employees who resign for whatever reason, plus the number of employees terminated for
performance reasons, and that total divided by the number of employees at the beginning of the year. Employees lost due to Reductions in Force (RIF) will not be included in this calculation.
Measured: The HRIS contains records of each employee. The separation section lists reason and date of separation for each employee. Monthly, or when requested by the SVP, the HRIS group will query the database and provide Department Heads with Turnover Reports. HRIS will post graphs of each report on the Intranet.
Target: Reduce Employee Turnover by 5% per year.
What Do I Do With Key Performance Indicators?
Once you have good Key Performance Indicators defined, ones that reflect your organization's goals, one that you can measure, what do you do with them? You use Key Performance Indicators as a performance management tool, but also as a carrot. KPIs give everyone in the organization a clear picture of what is important, of what they need to make happen. You use that to manage performance. You make sure that everything the people in your organization do is focused on meeting or exceeding those Key Performance Indicators. You also use the KPIs as a carrot. Post the KPIs everywhere: in the lunch room, on the walls of every conference room, on the company intranet, even on the company web site for some of them. Show what the target for each KPI is and show the progress toward that target for each of them. People will be motivated to reach those KPI targets.
What are KPIs (Key Performance Indicators)?
Quick Definition
Key Performance Indicators are measurable, definable metrics typically used to signify company goals. KPIs are considered to be primary metrics. Key Performance Indicators, when exposed and properly analyzed can be used to understand and improve manufacturing performance.
Expanded Definition
Every company measures themselves to some degree. Often measurement and analysis occur based on historical information. Although there is value in historical analysis, KPIs are biased toward real time data and are used to support decisions that enhance manufacturing performance. KPIs are tied to company goals and require careful design and implementation in order to support positive change. As with many organizational issues, acceptance of Key Performance Indicators and how they will be used to improve performance in critical.
In order to successfully leverage performance improvements based on KPIs there are three main precursors.

• Measurability• Team acceptance• Conformance to organizational goals
Measurability
The KPI must be measurable. The methodology of the measurement must be documented and accepted before the process begins. Understanding exactly what is to be measured will help determine how it will be measured. The effects of changes can be tracked through careful analysis of the benchmark KPI data. Goals and desires are often vague - key performance indicators are always very specific.
Team acceptance
Team buy in is often the difference between success and failure of many manufacturing projects. In regards to KPI it is critical. KPIs are typically the primary source of information regarding the performance of a process that is being monitored. In order to successfully use the data everyone needs to understand why the indicator was chosen and how it represents the underlying condition. Additionally, since the data will be used as an indicator of process performance, it is necessary that the entire team use it in the same way.
Conformance
General company goals and initiatives are at the heart of KPI. By determining a way to measure the success of a project companies are able to monitor change. When action is required, KPIs will provide advance warning. Successful KPI implementation means limiting exposed performance data to only key indicators. Often there may be a desire to measure the entire process. While this is understandable, the difference between KPI and other metrics must be understood and enforced.
KPI provides a mechanism for companies to identify areas for improvement, create the metrics that will be used to analyze the process and the tools to support change to the future state. Lean manufacturing is a process. Companies that use KPIs in this context use them to improve every day.
How Can KPIs (Key Performance Indicators) Help My Organization?
Once you've defined the KPIs that reflect your company's goals and have a consistent way to measure them, use them to enhance performance by charting the progress toward the target KPI. Only then will people be informed and motivated to:
• Support company initiatives• Manage growth• Manage change KPIs provide the tools to measure manufacturing performance enhancements.

Vorne Products and KPIs (Key Performance Indicators)
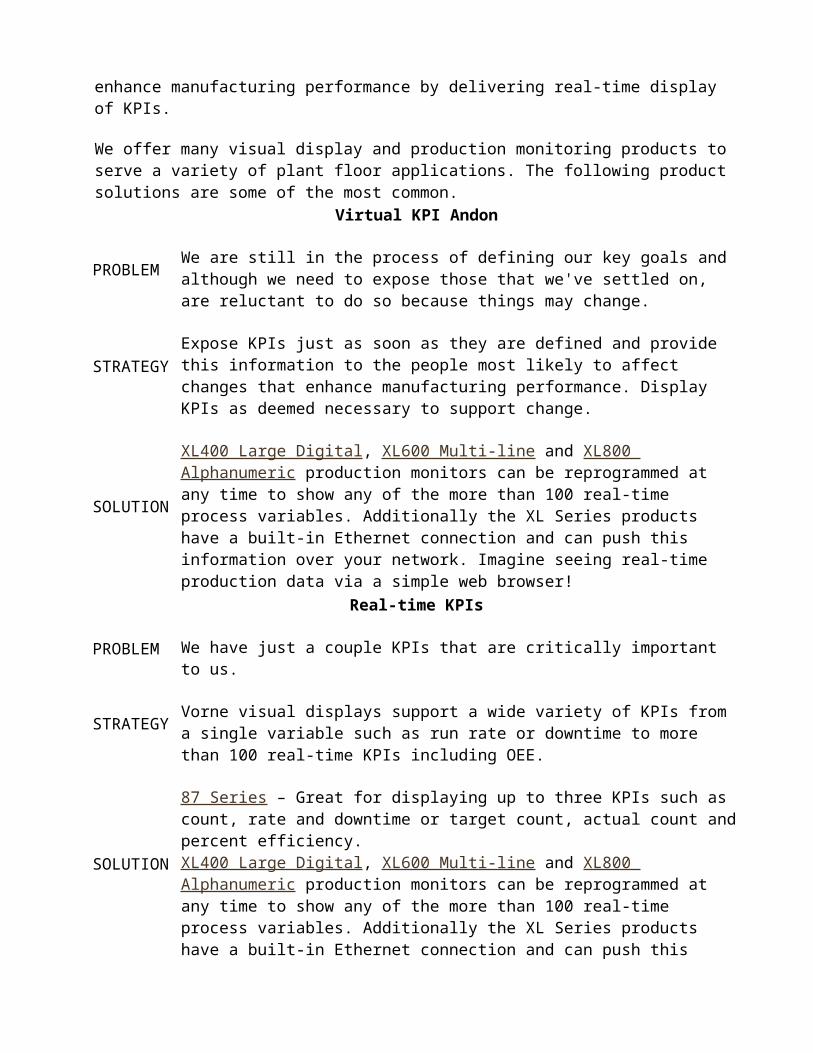
A manufacturing truth – “you cannot change that which you do not measure”. Vorne visual displays provide real-time information to enhance manufacturing performance by delivering real-time display of KPIs.
We offer many visual display and production monitoring products to serve a variety of plant floor applications. The following product solutions are some of the most common.
Virtual KPI Andon
PROBLEM We are still in the process of defining our key goals and although we need to expose those that we've settled on, are reluctant to do so because things may change.
STRATEGYExpose KPIs just as soon as they are defined and provide this information to the people most likely to affect changes that enhance manufacturing performance. Display KPIs as deemed necessary to support change.
SOLUTION
XL400 Large Digital, XL600 Multi-line and XL800 Alphanumeric production monitors can be reprogrammed at any time to show any of the more than 100 real-time process variables. Additionally the XL Series products have a built-in Ethernet connection and can push this information over your network. Imagine seeing real-time production data via a simple web browser!
Real-time KPIs
PROBLEMWe have just a couple KPIs that are critically important to us.
STRATEGY Vorne visual displays support a wide variety of KPIs from a single variable such as run rate or downtime to more than 100 real-time KPIs including OEE.
SOLUTION
87 Series – Great for displaying up to three KPIs such as count, rate and downtime or target count, actual count and percent efficiency.XL400 Large Digital, XL600 Multi-line and XL800 Alphanumeric production monitors can be reprogrammed at any time to show any of the more than 100 real-time process variables. Additionally the XL Series products have a built-in Ethernet connection and can push this information over your network. Imagine seeing real-time production data via a simple web browser!
Call us toll free at 1-888-DISPLAYS (1-888-347-7529). Our products deliver real-time KPIs that help you enhance manufacturing performance.
Another Look at KPIsGoogle "key performance indicator" or "KPI," and you'll find almost as much has been written about KPIs as has been written about Britney Spears. KPIs are a topic we deal with daily at BPM Partners, because nearly every client is or will soon be choosing a set of indicators. We recently attended a business intelligence focused conference, and the most popular topic during breakout sessions and around the breakfast buffet seemed to be the development of appropriate KPIs. This month's column collects some of the best current thinking on this topic.In reading many of the articles published in the last year, there's a clear path to select and define KPIs. You identify the key business objectives and then pick the KPIs to measure progress against those objectives. There are lists aplenty of the Do's and Don'ts of selecting KPIs.
However, there are obstacles and missteps that many companies encounter. Reid Karabush of Decision Systems points out that some executive teams choose KPIs that are outcomes rather than causes, results rather than drivers of success. These KPIs are consistent with the strategy and vision, but they produce a picture quite similar to a financial statement. In other words, they give you what you already have. Which would be more useful to a retail executive as an addition to existing reports: a KPI that shows declining sales, or a KPI that shows a decline in customer satisfaction?Taking this further, some companies tell us, "We hear that KPIs should be non-financial metrics because a financial KPI just mimics a financial statement." This view is too extreme. We believe there are financial KPIs that meet the criteria for a good KPI: they are strategic, they are actionable and they will make a difference in improving the business. In many cases, a 50/50 split between operational and financial measures would be optimal.Another business performance management (BPM) expert, Chris Iervolino of ITEC, has mentioned the "too high - too many" problem. This may be a symptom of simply trying to do too much with KPIs. When KPIs are too high-level, they might not reliably correlate to actual results. As a result, their utility to management is greatly diminished. Too many KPIs, on the other hand, are unwieldy and result in a lack of management focus. "Basically," says Iervolino, "somewhere in the extensive negotiations of creating the KPIs, the 'K' got lost."
You're Not So Special - And That's GoodIt is difficult for many companies to devote the executive time it takes to properly evaluate and develop a corporate scorecard - but you must do it, right? Actually, the answer is only a qualified yes. Your industry counterparts - your competitors - have probably already done some of the work and tested KPI sets that are relevant and valuable to you. As it turns out, approximately 70 to 80 percent of the key metrics for a company are nearly identical to those of other companies in their industry, much like different species have only a tiny bit of difference in their DNA. The more regulated the industry, the more metrics they have in common.This brings us to the industry dashboard, which comes pre-populated with best-practice metrics for your industry. If you locate a dashboard that is pre-populated for your company's industry and you like the KPIs you see there, you can now focus your attention on the smaller group of KPIs that are unique to your business - based on your competitive situation and growth stage. And, if your competitors use many of the same metrics, it's much easier to make apples-to-apples
comparisons. You can see an example of an industry dashboard at www.bpmpartners.com/indexpack.shtml.A company will have many metrics, but relatively few KPIs. Here we confront one of the toughest challenges: How do you get to that short list of agreed-upon key measures? You need a team approach, and the team needs to work down from the strategy to determine the key business drivers. For example, if the strategic goal is to be the number one supplier in the industry, then some key business drivers might be your distribution coverage in strategically important geographies, productivity of the sales force and customer retention rates.The bottom-up approach, where a team starts with a huge collection of metrics and then asks, "Which of these are the most important?" has several problems. What one VP defines as "most important" may not tie directly to the company's strategic direction. Another risk is that the group only looks at existing measures. If you don't already measure client satisfaction, for example, it won't even be up for consideration as a KPI. The top-down approach helps ensure that the KPIs measure execution of the strategy.I am a strong believer that the most crucial element is the process used to develop KPIs. Give careful thought to who should be involved, how to deal with the politics of developing KPIs that people in the meeting may later be compensated on, and how to ensure that the KPIs chosen are actionable and meaningful to all business units.An encouraging note about this process comes from Chris Iervolino. The discussion itself, the back-and-forth about which KPIs to adopt, can turn out to be just as important or even more useful than adoption of the KPIs themselves. These discussions of how to measure and view the business can prompt new, robust conversations about how the business and its environment have changed over time, what future challenges lie ahead and how these challenges can be addressed in a timely manner.


Close the loopLeading indicators for the maintenance process can support capable management (Figure 1). Dofasco Steel in Hamilton, Ontario, calls this feedback loop the Asset Reliability Process (Figure 2). It represents all the tasks required to support the maintenance function. “The Asset Reliability Process is a supply chain,” says Ron Thomas, Dofasco senior reliability specialist and world-class equipment reliability project manager. “Leading metrics presented as KPIs provide a clear indication if the requirements of each element in the proactive asset reliability process are being satisfied.”

If a step in the process is skipped, or performed at a substandard level, the process creates defects known as failures. “If those elements aren’t satisfied, leading KPIs also will determine what action should be taken to correct the lack of maintenance process adherence,” Thomas says. “The output of a healthy reliability process is optimal asset reliability at optimal cost.”We can use KPIs in other areas of the business as well. This approach is particularly interesting where multiple functional areas each play a role in a given goal, such as plant reliability. Plant reliability is a shared responsibility of the maintenance, production and engineering functions. Leading indicators for each departmental process feed the lagging indicators for the department function, which then summarize to the plant level (Figure 3).
It’s really a simple concept, but most plants don’t get it. “In studies, more than 90% of companies don’t have corporate support for an enterprise-level KPI program for maintenance and reliability,” says Terry Wireman, partner, Vesta Partners (www.vestapartners.com). Wireman is an accomplished expert in maintenance/reliability and author of the book, “Developing Performance Indicators for Managing Maintenance.” He says, “Even at the plant level, maintenance and reliability KPIs are not clearly defined and hence aren’t used effectively. In most companies, KPIs have just become a numbers game.” Using my earlier analogy, these companies are driving their car with the windshield painted black.According to Wireman, “The pitfall people encounter is they are trying to manage using too many lagging metrics, so they don’t have sufficient resources to manage the business process metrics. These
companies never achieve the target business results and never will as long as they are sub-optimizing their measurement system.”
Get seriousThe problem is management must learn to manage operations through KPIs (both leading and lagging). In my 30-year-plus career, I have seen many plants shut their doors forever. They blamed the closing on many reasons, but the one thing they all had in common was that none had properly managed with the KPIs. The metrics or indicators they manage with were ones like:
Cost Asset availability Equipment downtime OEE
All these metrics or indicators, while useful for measuring performance, cannot be used to manage the maintenance and reliability process. They are simply the results of all the actions that have taken place in the maintenance and reliability process. Again, you cannot manage results. You can only manage the processes leading to the results. If your company uses any of the above metrics to manage their operation, without using leading indicators, you should work to correct the situation.Ask some very basic questions:
Does your company differentiate between those KPIs that can be used to manage (leading indicators) from those that we can use to measure results (lagging indicators)?
Does your company measure performance of the maintenance process, where you can easily manage when needed?
If leading indicators show underperformance, the underperformance will affect the lagging indicator, which could be reliability, cost, capacity, etc. People must understand the relationship between a leading and lagging indicator and their effects on the maintenance and reliability function.Wireman described a recent client visit where the company had a completely integrated, enterprise-level KPI system. This company’s managers are able to review their KPIs and monitor trends from corporate headquarters. As they see negative trends develop in their corporate KPIs, they are able to drill down to the plant causing the trend. They can then examine their plant-level KPIs and find the trend driver. This was usually a process indicator, such as PM compliance.“One example clearly showed PM compliance was so low that it caused reactive work to increase,” Wireman says. “This, in turn, created more maintenance overtime and impacted production schedule compliance. This increased the maintenance costs (per unit produced), and also the total cost per unit for the plant. These cost drivers cascaded upward, impacting the overall corporate costs.”An integrated view of the corporation’s plant and departmental performance allowed this client to monitor its business performance and immediately take steps (manage) to improve the underlying process that would result in the desired increased profitability. Wireman says, “Unfortunately, only 10% or fewer of companies understand KPIs well enough to develop this types of performance management system.”Most maintenance managers are told to control cost, improve reliability and increase asset availability with no idea where the problem may be in their maintenance process. Unfortunately, many lose their job as a result. The fact is you cannot control cost, reliability or availability without managing the maintenance process.
Step-by-stepHow much money do corporations lose every year by managing plants without good leading and lagging KPIs? The costs may be too high to calculate, so we must stop them now by putting a plan in place to develop and align KPIs. This section may save your plant or your job, but I warn you, don’t look for shortcuts in the process, because there are none. Step 1: Educate management, from the executive level to floor-level supervisors, on KPIs and how leading and lagging indicators should be aligned to meet business goals. You then must provide a similar education to the maintainers and operators.Step 2: Define and assess your current maintenance and reliability process against a future state consisting of known maintenance and reliability best practices. As part of this assessment, you must develop a business case with financial opportunities and cost of change. This step continues the education process and creates awareness of the opportunity at-hand. Step 3: Develop a plan based on the assessment, with financial opportunities and cost on a timeline. This plan must include:a)Definition of the elements of your maintenance and reliability process (work identification, planning, scheduling, work execution, etc.);

b) Definition of leading and lagging KPIs in each element of your maintenance and reliability process;c) Definition of roles and responsibilities for each task; andd} World-class benchmarks established against the defined KPIs.Step 4: Implement the process and begin managing based on leading indicators. I would begin measuring only a few KPIs at first. Then allow people at the lowest levels to make the decisions required to ensure your maintenance and reliability process is proactive and effective. Using leading KPIs is a great awareness tool and will bring everyone into the decision-making process.Remove the black windshield and manage with leading indicators, not with lagging indicators. Leading KPIs should be used to drive your decision-making process. Remember, leading indicators are manageable, while lagging indicators just tell us how well we managed. If you want to be the best in your business, step up to the plate and manage in the most efficient manner by following my recommendations.If you would like additional information on KPIs, attend one of my workshops designed specifically to solve this problem. Send me an e-mail at [email protected] and I will send you a schedule and locations. You can also contact me if you have problems with or questions about your KPIs.
The legacy of John DayThe Mount Holly, S.C. plant of bath enclosure and shower door manufacturer Alumax was rated as one of the best maintained plants in the world for more than 20 years. “Hundreds of companies visited our plant, paying $1,000 each to see our maintenance program up close, but only a few learned from their visit,” says John Day, retired former engineering and maintenance manager at the plant. Day also was invited to visit more than 500 plants in the U.S., Canada and Australia. “The one the thing more than 90% of them had in common was they could not effectively manage their plants because they had no leading KPIs in place,” Day says. “Many of these companies were crying for help, but didn’t know which way to go.” Most managed only with lagging indicators, and made decisions based on metrics such as cost and reliability.Day learned early in his career that without leading KPIs, you cannot manage equipment maintenance and reliability. “Alumax had a system in place where we could measure everything in our maintenance process - from leading indicators such as identification of potential failures through to the lagging financial results of all actions performed by maintenance,” he says. This separation of leading and lagging KPIs allowed him to make management decisions when leading KPI underperformance was identified, before cost and reliability (the lagging indicators) were impacted. “For more than 20 years, I could see problems brewing long before they would become a serious issue,” he says.According to Day, there is a simple reason why most companies don’t succeed: They don’t know what information needs to be collected. In 1979, he worked with Alumax’s accounting department to establish more than 60 financial accounts just for maintenance. These accounts were linked to leading KPIs in the maintenance process that provided the information needed to manage proactively.In turn, these KPIs were linked to equipment performance (lagging indicators). Each of these lagging KPIs had established benchmarks that measured if the maintenance process was in or out of control. This approach may sound complex, but once you have it in place, management can truly manage the reliability of plant equipment.Day shared 13 years of KPI data that was so impressive, it would bring tears to any maintenance and reliability professional’s eyes. “Everyone from a maintenance person to the plant manager had KPIs they looked at on a daily or weekly basis to make basic and immediate management decisions,” he says. “Each level in our organization used a small number of lagging KPIs along with a larger number of leading KPIs that were important to managing their part of the business.”Over the 13-year period, maintenance cost (a lagging KPI) didn’t increase, but was constant. Maintenance cost as a percentage of return on asset value held at around 3%. Equally impressive was that the controllable plant operating cost was very constant over the same time period. This lagging-indicator data pointed to the obvious fact that equipment reliability directly correlates to operating cost. By managing the maintenance and reliability process, element by element, using leading indicators, Alumax was able achieve these results. Day’s experience validates that managing with both leading and lagging KPIs is the only way to effectively control an operation to achieve the results expected to succeed in business.By the way, more than 26 years ago I worked for John Day at Alumax, and enjoyed every day I worked at his plant.

Creating Effective KPIs
Article published in DM Review Magazine
June 2006 Issue
By Wayne Eckerson
One of the most common questions people ask about performance dashboards is, How do we define effective key performance indicators (KPIs)? The answer is important because KPIs govern how employees do their jobs.
Agents of Organizational ChangeThe adage "What gets measured, gets done" is true. KPIs focus employees' attention on the tasks and processes that executives deem most critical to the success of the business. KPIs are like levers that executives can pull to move the organization in new and different directions. In fact, among all the tools available to executives to change the organization and move it in a new direction, KPIs are perhaps the most powerful.
Subsequently, executives need to treat KPIs with respect. As powerful agents of change, KPIs can drive unparalleled improvements or plunge the organization into chaos and confusion. If the KPIs do not accurately translate the company's strategy and goals into concrete actions on a daily basis, the organization will flounder. Employees will work at cross purposes, impeding each other's progress and leaving everyone tired and frustrated with little to show for their efforts.
Suboptimized ProcessesA trucking company, for example, that measures performance by the percentage of on-time shipments may drive hauling costs skyward because the KPI does nothing to discourage dispatchers from sending out half-empty trucks to meet their schedules. To keep costs in line, the company needs to add a second KPI that measures the percentage of unused cargo capacity in outgoing trucks, and it needs to revise the first KPI so it emphasizes meeting customer expectations for fast, reliable shipments rather than just on-time deliveries. This combination of KPIs gives dispatchers leeway to contact customers and renegotiate shipping schedules if they know the customer may be flexible.
The Zen of DevelopmentCrafting sound KPIs is more of an art than a science. Although there are guidelines for creating effective KPIs (see sidebar), they do not guarantee success. A KPI team may spend months collecting requirements, standardizing definitions and rules, prioritizing KPIs and soliciting feedback - in short, following all the rules for solid KPI development - but still fail. In fact, the danger is that KPI teams will shoot for perfection and fall prey to analysis paralysis. In reality, KPI teams can only get 80 percent of the way to an effective set of KPIs; the last 20 percent comes from deploying the KPIs, seeing how they impact behavior and performance, and then adjusting them accordingly.Metrics used in performance dashboards are typically called key performance indicators because they measure how well the organization or individual performs against predefined goals and targets. There are two major types of KPIs: leading and lagging indicators. Leading indicators measure activities that have a significant effect on future performance, whereas lagging indicators, such as most financial KPIs, measure the output of past activity.Leading indicators are powerful measures to include in a performance dashboard but are sometimes difficult to define. They measure key drivers of business value and are harbingers of future outcomes. To do this, leading indicators either measure activity in its current state (i.e., number of sales meetings today) or in a future state (i.e., number of sales meetings scheduled for the next two weeks), the latter being more powerful because it gives individuals and their managers more time to influence the outcome.For example, Quicken Loans identified two KPIs that correlate with the ability of mortgage consultants to meet daily sales quotas: the amount of time they spend on the phone with customers and the number of clients they speak with each day. Quicken Loans now displays these two current-state KPIs prominently on its operational dashboards. More importantly, however, it created a third KPI based on the previous two that projects whether mortgage consultants are on track to meet their daily quotas every 15 minutes. This future-state KPI, which is based on a simple statistical regression algorithm using data from the current-state KPIs, enables sales managers to identify which mortgage consultants they should assist during the next hour or so.

Challenges to Creating KPIsSome of the challenges with creating effective KPIs include process nuances, activity measurement, accurate calculations and lifecycle management.Process Nuances. The problem with many KPIs is that they do not accurately capture the nuances of a business process, making it difficult for the project team to figure out what data to capture and how to calculate it.For example, executives at Direct Energy requested a repeat-call metric to track the efficiency of field service technicians, but it took the project team considerable time to clarify the meaning of the KPI. For example, field service technicians primarily repair home energy equipment, but they can also sell it. So, is a repeat call a bad thing if the technician also brings literature about replacement systems or makes a sale? Or, what if a homeowner only lets a technician make minor repairs to an aging system to save money but calls shortly afterward because the home's furnace broke down again?Most business processes contain innumerable nuances that must be understood and built into the KPI if it is to have any validity, especially if the KPI is used as a basis for compensation. The worst-case scenario is when employees discover these nuances after the KPIs have been deployed, which stirs up a hornet's nest of trouble and wreaks havoc on both the performance management system and compensation policies.Accurate Calculations. It is also difficult to create KPIs that accurately measure an activity. Sometimes, unforeseen variables influence measures. For example, a company may see a jump in worker productivity, but the increase is due more to an uptick in inflation than internal performance improvements. This is because the company calculates worker productivity by dividing revenues by the total number of workers it employs. Thus, a rise in the inflation rate artificially boosts revenues — the numerator in the KPI — and increases the worker productivity score even though workers did not become more efficient during this period.Also, it is easy to create KPIs that do not accurately measure the intended objective. For example, many organizations struggle to find a KPI to measure employee satisfaction or dissatisfaction. Some use surveys, but often employees do not answer the questions honestly. Other companies use absenteeism as a sign of dissatisfaction, but these numbers are skewed significantly by employees who miss work to attend a funeral, care for a sick family member or stay home when day care is unavailable. Some experts suggest that a better KPI, although not a perfect one, might be the number of sick days taken because unhappy employees often take more sick days than satisfied employees.

Natural Lifecycle. It's also important to note that a KPI has a natural lifecycle. When first introduced, the KPI energizes the workforce, and performance improves. Over time, the KPI loses its impact and must be refreshed, revised or discarded. Thus, it is imperative that organizations continually review KPI usage.Performance dashboard teams should automatically track KPI usage with system logs that capture the number of users and queries for each KPI in the system. The team should then present this information to the performance dashboard steering committee, which needs to decide what to do about underused KPIs. For example, Hewlett Packard Technology Solutions Group (TSG) holds quarterly meetings to review KPI usage, which it tracks at a detailed level. "If a KPI isn't being accessed, we go back to the owners and see whether they still want it. If not, we remove the KPI," says Martin Summerhayes, program manager.KPIs are powerful agents of organizational change, but creating effective KPIs is challenging; it is more art than science. While there are many guidelines that can steer teams in the right direction, ultimately, teams must put the KPIs in practice and see what behaviors they drive. Then, the teams need to continually refine and refresh the KPIs to ensure that they are positively affecting organizational change, not undermining it.
Key Performance Indicators (KPI) are financial and non-financial metrics used to quantify objectives to reflect strategic performance of an organization. KPIs are used in Business Intelligence to assess the present state of the business and to prescribe a course of action. The act of monitoring KPIs in real-time is known as business activity monitoring. KPIs are frequently used to "value" difficult to measure activities such as the benefits of leadership development, engagement, service, and satisfaction. KPIs are typically tied to an organization's strategy (as exemplified through techniques such as the Balanced Scorecard).The KPIs differ depending on the nature of the organization and the organization's strategy. They help an organization to measure progress towards their organizational goals, especially toward difficult to quantify knowledge-based processes.A KPI is a key part of a measurable objective, which is made up of a direction, KPI, benchmark, target and time frame. For example: "Increase Average Revenue per Customer from £10 to £15 by EOY 2008". In this case, 'Average Revenue Per Customer' is the KPI.KPIs should not be confused with a Critical Success Factor. For the example above, a critical success factor would be something that needs to be in place to achieve that objective; for example, a product launch.
Contents[hide]
1 Identifying indicators 2 Areas to be analyzed 3 Categorization of indicators 4 Problems
5 See also
[edit] Identifying indicatorsPerformance indicators differ with business drivers and aims (or goals). A school might consider the failure rate of its students as a Key Performance Indicator which might help the school understand its position in the educational community, whereas a business might consider the percentage of income from return customers as a potential KPI.But it is necessary for an organization to at least identify its KPI's. The key environments for identifying KPI's are:
Having a pre-defined business process. Having clear goals/performance requirements for the business processes. Having a quantitative/qualitative measurement of the results and comparison with set goals. Investigating variances and tweaking processes or resources to achieve short-term goals.
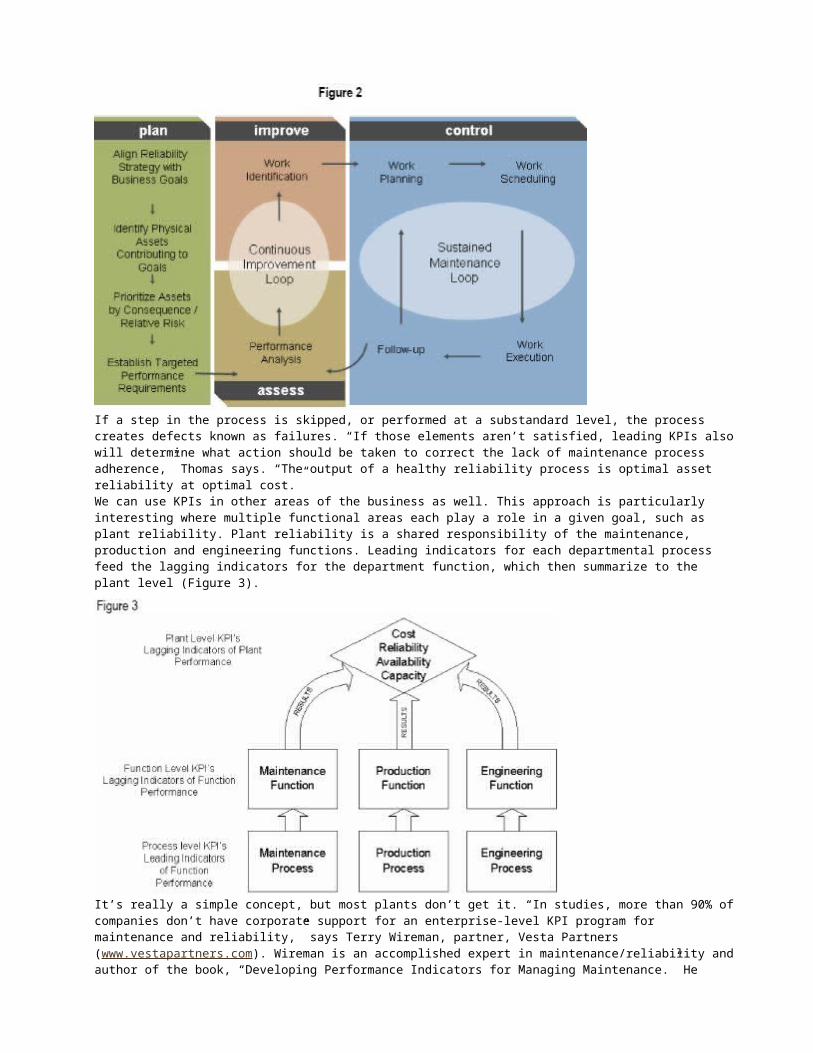
When identifying KPI's the acronym SMART is often applied. KPI's need to be: Specific Measurable Achievable Realistic Timely
[edit] Areas to be analyzedAmong the areas top management analyzes are:
1. Customer related numbers: 1. New customers acquired 2. Status of existing customers 3. Customer attrition
2. Turnover generated by segments of the customers - these could be demographic filters. 3. Outstanding balances held by segments of customers and terms of payment - these could be
demographic filters. 4. Collection of bad debts within customer relationships. 5. Demographic analysis of individuals (potential customers) applying to become customers,
and the levels of approval, rejections and pending numbers. 6. Delinquency analysis of customers behind on payments. 7. Profitability of customers by demographic segments and segmentation of customers by
profitability.
Many of these aforementioned customer KPIs are developed and improved with customer relationship management.This is more an inclusive list than an exclusive one. The above more or less describe what a bank would do, but could also refer to a telephone company or similar service sector company.What is important is:
1. KPI-related data which is consistent and correct. 2. Timely availability of KPI related Data.
Faster availability of data is beginning to become a concern for more and more organizations. Delays of a month or two were commonplace. Of late, several banks have tried to move from availability of data at shorter intervals and less delays. For example, in businesses which have higher operational/credit risk loading (that involve credit cards, wealth management), Citibank has moved onto a weekly availability of KPI related data or sometimes a daily analysis of numbers. This means that data is usually be available within 24 hours as a result of automation and the use of IT.
Categorization of indicatorsKey Performance Indicators define a set of values used to measure against. These raw sets of values fed to systems to summarize information against are called indicators. Indicators identifiable as possible candidates for KPIs can be summarized into the following sub-categories:
Quantitative indicators which can be presented as a number. Practical indicators that interface with existing company processes. Directional indicators specifying whether an organization is getting better or not. Actionable indicators are sufficiently in an organization's control to effect change.

Key Performance Indicators in practical terms and strategy development means are OBJECTIVES to be target that will add the VALUE to the business MOST (MOST = KEY INDICATORS OF SUCCESS).
DifficultyIn reality organizations and businesses often when looking for Key Performance Indicators discover that they cannot get the performance indicators that they would like to get. Often they are stuck with various non-key indicators. These are used as if they were Key Performance Indicators and often called KPI's since something is better than nothing.
KPIs Made EasyBehind the data walls and executive dashboards, metrics increasingly link to real-time, plant-floor data. Do you know enough about key
performance indicators (KPIs) and manufacturing execution systems (MES) to invest in efficient process improvements?
Frank O. Smith, Control Engineering
Control Engineering -- January 1, 2007
Process control is hip. Manufacturing line optimization is cool. Everybody from the CEO down wants a piece of it. And judging by the clamor around video walls, information portals, and executive dashboards, everyone wants to visualize control to drive performance. Globalization and pressure on companies to compete at the most fundamental level of operational excellence means everyone is looking at the factory, the mill, or the plant more closely. The challenge is whether control engineering can master the strategic role implicit in this level of scrutiny.What’s strategic in the role can be summed up in three letters: K-P-I. Key performance indicators are measures of success or compliance, and the industry is rife with talk of them. Industry analysts, organizations, and enterprises are deep in exploration and analysis of how to define, create, calculate, and disseminate KPIs. And control engineers need to understand them, so they can help in meaningful ways. “Control engineers can no longer afford to be satisfied with a controller’s performance by viewing how straight the lines on the control chart are,” says John Snodgrass, process control engineer for Chemtura Corp.’s Morgantown, WV, specialty chemical plant. “In today’s market, with today’s technology, typical operators aren’t typical anymore. They don’t just turn valves. Control engineers shouldn’t be typical either,” says Snodgrass. “They should be looking at the information they have and trying to determine what they can do make product more efficiently. If they don’t, it won’t be long before there won’t be a business anymore.”MESA International, a trade organization constellated around manufacturing execution systems (MES), has actively investigated KPIs since early last year. In October 2006, it published an initial report on its efforts called “Metrics That Matter: Uncovering KPIs that Justify Operational Improvements.” But MESA concedes it’s just scratched the surface of a very complex issue. Consequently, MESA working groups are delving deeper still, particularly into the labyrinthine linkages between KPIs at different business levels within organizations. A common thread is the control layer of a plant, where the data that feeds many KPIs is generated. Another common element is MES. That’s where aggregation of the data and context typically happens before it’s passed up to enterprise systems and their dashboard and video wall outputs that executive management sees. KPIs and MES are becoming critical elements to running a plant, because they’re critical to running a business. And, in today’s world, anyone not thinking about the business isn’t as keyed in to business performance as they should be. Engineering to money “Everything a control engineer does eventually rolls up into money,” says Jim Christian, product manager for Honeywell. “It’s important to know how what you do contributes to the business.

Stable operations translate into greater reliability and better throughput, longer catalyst and equipment life, and reduced use of chemicals. All are measurable.”One way for control engineers to think about KPIs is “to understand how what you do contributes to your company making money,” says Christian. “What measurements do you need to track to know you’re maximizing value?”A vast, widely prevalent disconnect exists in most organizations today, at various levels of conceptual abstraction as well as within data flow linkages. “Many of our customers view KPI initiatives as an engineering exercise to collect data,” says Claus Abildgren, marketing program manager for production and program development for Wonderware. “They don’t understand the key needs of the business—what are the pieces of data that the rest of the business needs to make decisions.”The disconnect is from the bottom up and from the top down. This was revealed in the survey behind the report that MESA developed. “The big surprise for us was how few felt they had a strong structure of linkage from financial goals and metrics down to the shop floor,” says Julie Fraser, principal at Industry Directions, a Boston-area industry consultancy. Fraser was contracted to help drive the MESA “Metrics That Matter” project. “Only 3% of the companies we interviewed for the study said they had strong linkage. We didn’t expect it to be huge, but we didn’t expect it to be that small either.”Contributing to the problem is structural weaknesses in technology infrastructure—in other words, an inability to handle the vast number of applications and amounts of data now being generated. “AMR has worked with manufacturers who have over 5,000 point solutions [applications] in their portfolio,” says Colin Masson, research director for supply networks operations for Boston-based AMR Research. Under such circumstances, “it’s not trivial to construct metrics at a single site, let alone across multiple sites. That’s not even taking into consideration performance data composed of millions of readings a day and putting that into some business context that has meaning at a higher level,” he says. Growth of data models Such a wealth of data possibilities is contributing to a growing emphasis on standardization of manufacturing data models that can establish commonality. This desire for a comprehensive manufacturing model is one of the market drivers behind the surge in interest in MES, for models are core to functionality of this software. It’s also what’s prompted automation and human machine interface (HMI) vendors to invest in model-driven integration infrastructures, such as Rockwell Automation’s FactoryTalk, GE Fanuc’s Proficy, and Invensys’ Infusion platforms. These create “one common computing environment,” in the words of Peter Martin, vice president of strategic ventures for Invensys.
It's not trivial to construct metrics at one site, let alone across multiple sites, says Colin Masson, research director at AMR Research. Use of specific metrics varies, as shown by the percentages.
Other factors driving interest in MES and KPIs are increasing product and manufacturing complexity and regulatory compliance needs. Align Technology manufactures a line of individually custom-designed orthodontic appliances used to properly align teeth. Orders are acquired at its Santa Clara, CA, headquarters, then transmitted to its facility in Costa Rica where clinical technicians create 3-D representations. These are then sent back to prescribing doctors for verification, before work orders are transmitted to the company’s Mexico production facility. Align Technology turned to MES to enable it to recover the detailed visibility of manual tracking that was lost when it implemented an enterprise resource planning (ERP) system. It uses Production Centre MES, a component of the Rockwell Automation FactoryTalk platform.
“We manufacture 50,000 custom parts every day—and every day it’s a different 50,000,” says Michael Henry, Align Technology CIO and vice president of information and technology. “The KPIs we’ve focused on initially are public facing ones—cycle times and gross margins.”By providing greater visibility into the flow and status of work orders, MES was instrumental in attacking problems that had driven up cycle times and eaten into gross margins. Real-time visibility into the status of work orders in the geographically distributed process flow helped Align Technology identify bottlenecks and smooth the flow into a more seamless stream, from order acquisition to finishing and polishing at the end of the production line.“Cycle times, which were two weeks, are down to five days. And gross margins that were 58% are now up to 69-70%,” Henry says.Regulation helps? Business metrics such as cycle times and gross margins are relatively common. Determining which manufacturing metrics are critical to track can be more challenging—unless you’re in a regulated industry. Utica, NY-based ConMed Corp., manufacturer of laparoscopic surgery
products, patient support and other products, is bound by U.S. 21CFR Part 820 regulations outlining Good Manufacturing Practices (GMP) for medical device manufacturers. “We operate in a tightly regulated industry, which determines which KPIs you must track and trend in your operations. We have to validate the process to begin with to determine the variable data, such that when I set these indicators, and the numbers are being met, I know the process is stable,” says Bill Wheatley, ConMed manager of manufacturing engineering. “After that, we’re looking at: first pass yields, are we staying capable, is preventive maintenance effective, [and] are we preventing breakdowns.” Implementing MES was crucial to streamlining the process, Wheatley says. ConMed uses Visiprise MES.
Manufacturers are striving to relate KPIs used on the manufacturing floor to business metrics tracked in the executive suite.
'The big surprise for us was how few felt they had a strong structure of linkage from financial goals and metrics down to the shop floor,' says Julie Fraser, head of the MESA 'Metrics That Matter' research.

How does a company determine which KPIs to use? Ideally, it’s a top-down decision. “In concept, you want to take top-level goals and strategy and build out departmental metrics and link those all the way down,” says Fraser of Industry Directions. “You want to take manufacturing metrics...right down to the machines.”Eliminating boundaries The whole issue of KPIs is exceedingly complex and, as a “science,” is still young and evolving. But progress being made is looping downward evermore inclusively into the domain of control engineering. As work in the field is revealing, everything is indeed interconnected.“The traditional approach over the years has held that automation, MES, and IT are three individual layers,” Martin says. “But it’s an artificial separation. It’s been necessary, he says, because past technology required that problems be segmented to deal with the unique requirements at each level. As the technology evolves, “in time that separation is going away,” Martin says. The push for KPIs linked from top floor to shop floor is driving the business case for that. And in the end, it truly is all about the business case. That’s what control engineers need to grasp and master. Forget the flashy data walls and Web-enabled dashboards. Focus instead on the metrics that feed those broadcasts. Your company’s future will be increasingly dependent on converting control data into strategic intelligence.
KPIs in action
Performance measurement is not static: it evolves as performance issues vary, as the market strategy changes, as technologies and the means to measure and record performance evolves over time. Sources of KPIs that others are using include research from MESA, AMR, and Aberdeen. Here are specific recommendations from users.
“We manufacture 50,000 custom parts every day…. The KPIs we’ve focused on initially are public facing ones—cycle times and gross margins.”
“We operate in a tightly regulated industry, which determines which KPIs you must track and trend in your operations. After that, we’re looking at: first-pass yields, are we staying capable, is preventive maintenance effective, [and] are we preventing breakdowns.”
“Corporate division headquarters set up the specific KPIs they wanted us to use.” “We put no more than four [KPIs] in front of an operator at any time.” “Our company has determined as an organization that there are four process areas that the enterprise needs to
focus on. These include: financial; process excellence; quality; and environmental health, safety and security. Everything cascades down from those.”
“At the operator level, we use the real-time accounting measurement of cost-per-batch. With that an operator can drive down costs and keep quality high. The next layer up doesn’t want to see the cost of everything, but [wants instead] variance-to-budget of production, or variance-to-budget from department to department. It’s all based on the same data that flows up.”
Online Extra
Importance of Top-Down KPI Implimentaion
Know what to trendThat’s what CD Technologies Power and Electronics Division (PED) did. CD Technologies PED, headquartered in Mansfield, MA, manufactures dc converters, power meters, standby and motor power, and other products. “Corporate division headquarters set up the specific KPIs they wanted us to use,” says Steve Kaplan, global MES administrator, CD Technologies. “They include first pass yield, scrap rate, and labor/machine facility cost. In order to measure those, each facility has certain KPIs: defects per operation, yield after correction, yield by line and shift.
“We have Siemens pick and place equipment that is feeding information on placements made. Automated inspection is recording failures found.” That information, fed into MES, is aggregated and fed into the divisional enterprise system, Kaplan says.

But performance measurement is not static: it evolves as the performance issues vary, as the market strategy changes, as the technology and the means to measure and record performance evolves over time.
“We shifted from graphing performance in percentages to reporting parts-per-million,” Kaplan states. “With percentages, you’re looking for an upward trend. With parts-per-million, you’re looking for zero. When we made the shift and people came in and saw a negative trend, there was quite an uproar. We hadn’t educated everybody fully. But on a positive note, it showed people were paying attention to the charts.”
Accounting-driven KPIsThe importance of top-down decomposition to get to production level KPIs has other nuances and ramifications. “Part of the challenge of rationalizing KPIs is determining which ones have impact,” says Martin of Invensys. Martin asserts that Invensys has talked with more than 14,000 executives over the course of a decade. “Many executives—especially CFOs—don’t believe KPIs are valuable. They’ve told us that engineering and operations managers keep telling them how much money they’ve saved or made for the company, but when accounting looks at the balance sheets, they don’t see it.”
Martin says Invensys has pushed back in terms of asking what it would take to overcome this problem. “Fundamentally, they’d like to do real-time accounting—using KPIs that measure profits and costs. Once you do that for each process in the plant, you can easily determine which KPIs are directly associated with adding value.”
The trick, he says, in building “accounting models right on the front lines.” To do that you need a proper “handoff” down the chain that ensures that CFOs and CEOs will get back what they need to make strategic business decisions. What’s critical is getting the CFO to define what is needed in terms of an equation.” After that, “it’s not that difficult to determine for each process area in the plant—then down to the process unit level—how to model the process data to calculate KPIs that feed those equations,” Martin says.
Says Jim Christian of Honeywell: “The KPIs that the CEO looks at are stock price and profitability. But if you’re an operator on the floor, looking at those KPIs doesn’t provide you a means to impact them. So you have to determine indirect measurements that operators understand. If you improve unit utilization, you can push more product in the course of a year.
You need those high level indicators, but you’ve got to build lower level KPIs you can put in front of operators that they can personally control.”
The key to effective KPIs is revealed in the first descriptor: key. Identify too many, and you merely end up with performance indicators. “We put no more than four in front of an operator at any time,” says Snodgrass of Chemtura. The same holds as you roll up to the highest level. Chemtura identified four process areas that the enterprise needs to focus on. These include: financial; process excellence; quality; and environmental health, safety and security. Everything cascades down from those.Snodgrass and Chemtura have worked with Peter Martin and Invensys in embracing real-time accounting at the operations level. “It’s very exciting,” Snodgrass says. Once you know what the company is driving toward in terms of key performance measurements, and you have a unified computing environment that a platform like Invensys’ Infusion makes possible, Snodgrass says, real-time accounting measurements designed for each hierarchical level in the plant becomes immeasurably more fluid and easy.
“At the operator level, we use the real-time accounting measurement of cost-per-batch,” he explains. “With that, an operator can drive down costs and keep quality high. The next layer up doesn’t want to see the cost of everything, but [wants instead] variance-to-budget of production, or variance-to-budget from department to department. It’s all based on the same data that flows up and is used for other calculations.”
WHICH KPIS ARE DRIVING YOUR BOTTOM LINE?(Contractor's Business Management Report)Do you know what's causing profit fade on your jobs? Or,why A/Rs are outstanding for more than 60 days? Perhaps monitoring your key performance indicators (KPIs) could provide insights for corrective actions. But what exactly are meaningful KPIs for construction companies? What metrics signal where contractors should focus to become more productive and profitable-and reduce risk?
Ke Performance Indicators Drive Best Practices for General Contractors, a new white paper from by Ken Roper and Michael McLin, management consultants with FMI Corporation, introduces a set of KPIs specifically for the construction industry. "We hope contractors will utilize this
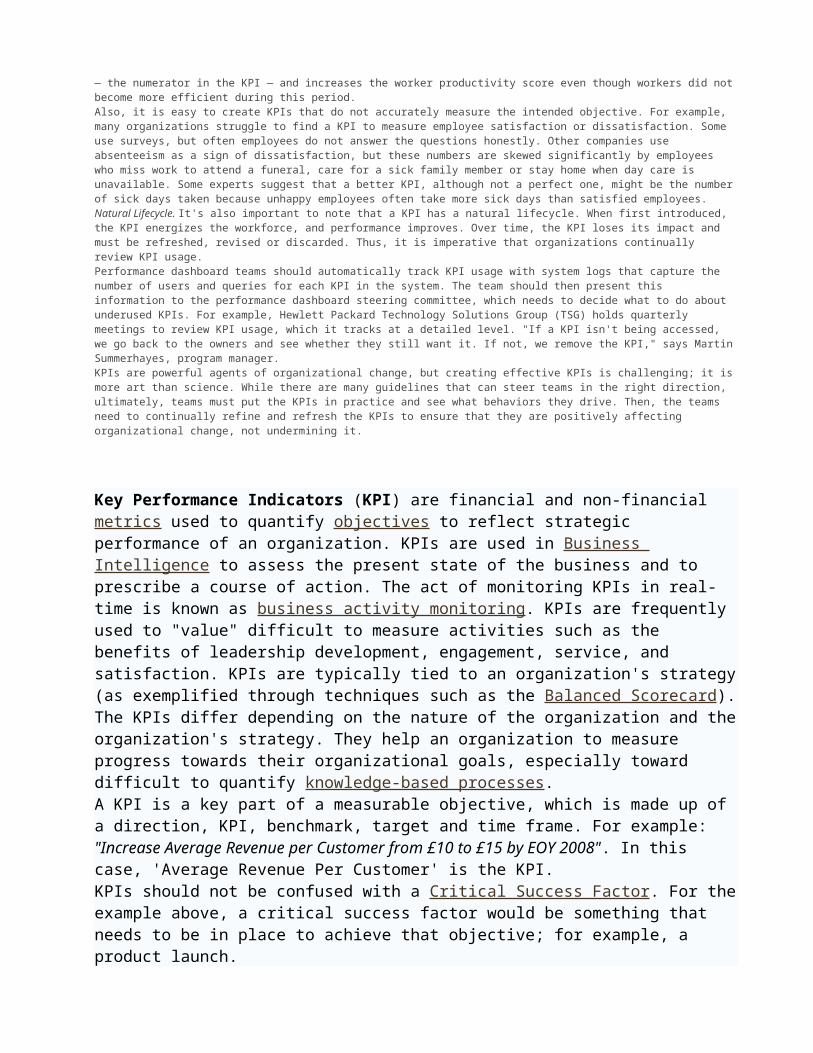
information to drive business process improvements to become profitable and better manage risk," McLin told CBMR. Further, he suggests that these KPIs provide a comprehensive look at "your business and where it is going, and identify items you should address proactively to manage your daily operations more effectively."
Identifying construction industry KPIs. Teaming with Microsoft Business Solutions and SIS Software, FMI developed seven indicators as "meaningful yardsticks that contractors can use to effectively communicate the daily operations of their business (see the accompanying sidebar). The report encourages contractors to use these KPIs to benchmark their performances against best-in-class contractors.
KPIs can isolate the breakdowns in contractors' business processes that contribute to poor performance outcomes. Examining these breakdowns should produce clues to the necessary remedial actions. For example, if your receivables far exceed those of best-in-class contractors, you would need to evaluate your invoicing processes, invoice format, follow-up once invoices are distributed, and so forth. The goal, observes McLin, is to streamline the flow of information so it doesn't take as long to get paid.
Do KPIs replace traditional financial statement ratios such as quick ratios, working capital turnover, and return on assets? Both Roper and McLin told us no. Rather, that KPIs are complimentary to the analysis many contractors conduct based on financial statement data. "These KPIs are more broad-ranging because they address more than financial issues." According to McLin, they are more comprehensive and specific to construction industry eccentricities that influence and affect the profitability of a construction company.
Monitoring KPIs in large and small construction companies. Although the white paper makes a case for implementation of integrated systems to capture data, McLin concedes that smaller companies or contractors not ready to undertake such an expensive system, "can use the technology that you have" in a different way. The calculation of the KPIs does not hinge on having an integrated system, McLin said; however, the advantage of an integrated system is its ability to drill down to uncover what is feeding a negative KPI and to isolate specific projects that may be influencing the KPIs.
Still, most contractors run their business on Excel spreadsheets, says McLin, because they don't have an integrated system. What's difficult about using the spreadsheet is the inability to dissect the data to identify what is "causing the numbers to come out as they are." Roper adds that a database system with a customized report writer could assist in crunching your company's KPIs.
An integrated system is much more efficient than the traditional system used by construction firms, which is basically a compilation of disparate legacy systems. Since "most contractors have one program for accounting, another for scheduling, and another for estimating," observes McLin, "determining the causes of negative KPI outputs is more difficult."
However, for contractors with the wherewithal to purchase an integrated system, other pitfalls exist. For example, McLin told us: "The biggest is an over-investment in technology and an under-investment in training and implementation. If you were to go to a fully integrated system, that would mean all of your existing systems would be negated." Upshot: All of your staff will have to be trained so that the new system becomes the way you do business. Although a cultural challenge exists, he believes there is a bigger challenge: the fundamental technology skill sets lacking in many construction companies.
Roper stresses that it is important to have an overall technology strategy for your firm. "Rather than simply buying hardware and software," he says, "be clear about how you plan to use it in your firm to gain a competitive advantage in the marketplace."
Compared to other industries, the consensus is that construction is not as technologically sophisticated. Many contractors lack the skills to run a fully integrated system. Thus, they may become frustrated, aborting or diverting energies from adequate system implementation. So, the system needs to be simple and user-friendly.
Another pitfall to avoid: People underestimate the amount of time and energy it will take to make the transition from legacy systems to an integrated one.
Which KPIs are driving your bottom line? No single KPI can provide a complete picture of your business performance, according to the white paper. Rather, evaluating KPIs as a group renders a more accurate representation of your operations. Here are the KPIs the FMI white paper advocates you should routinely evaluate:
* Liquidity. Since cash is king, contractors should review their liquidity indicators (e.g., cash conversion, cash funding, cash demand) and determine which projects contribute to and which usurp liquidity.
* Schedule variance. Maintaining an updated schedule that reflects changing conditions increases a contractor's ability to manage the construction process and hit scheduled completion dates. You can evaluate schedule performance by examining variance in days and expressing the positive or negative variance as a percentage of remaining duration.
* Margin variance. This KPI identifies the gross margin performance (e.g., forecasted gross margin, actual gross margin on closed jobs, WIP gross margin). By identifying current and cumulative margin variances, contractors are in a better position to make urgent corrections to control project profitability.
* Cash flow. A project's cash position is a key measure of WIP and project profitability, encouraging prompt project billing collections.
* Unapproved change order. Costs incurred through unapproved change orders pinpoint possible financial exposure. Contractors successful at early notice and timely approval of change orders ultimately reduce their financial risk and increase client satisfaction.
* Committed cost. This KPI can reveal company exposure to price increases and promote early execution of project buyout procedures.
* Backlog. This KPI discloses gross margins on future projects and operates as an early warning gauge of reduced profitability.
"These KPIs put together in a concise format are the key items that we need to manage the business and provide the visibility that our executives and
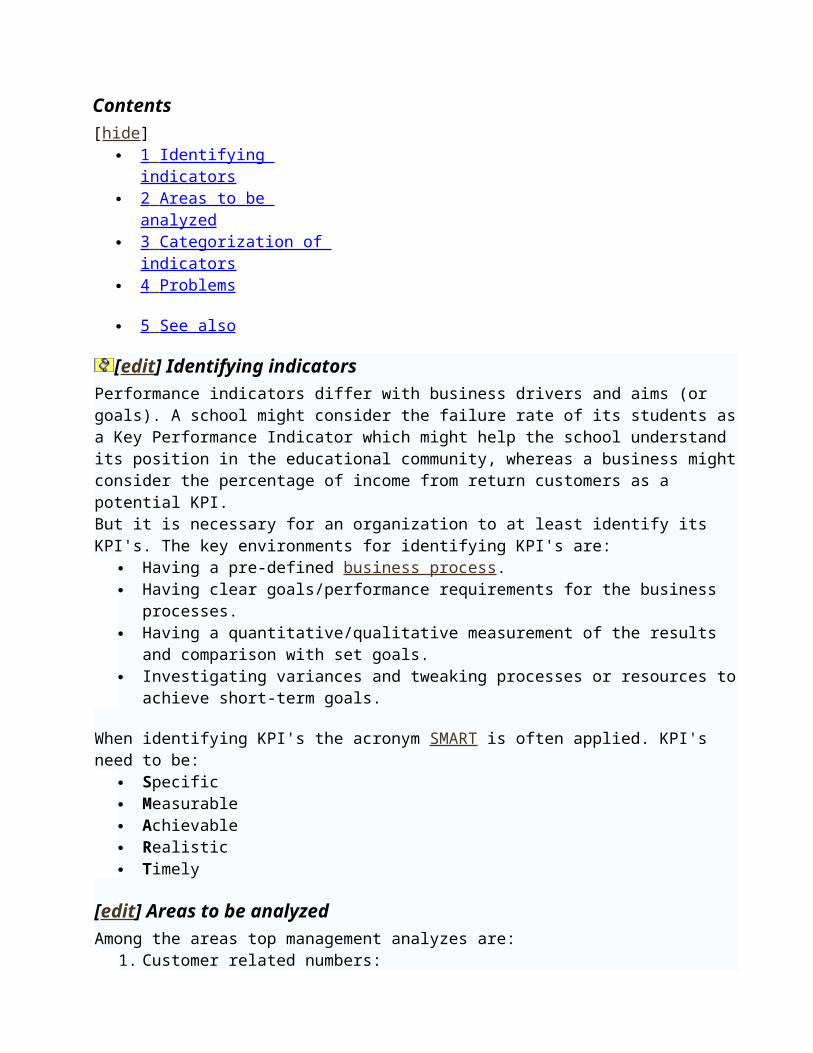
project managers need to successfully execute projects," said John Hodge, VP of finance with KDA Holdings, in an FMI press release. "We know what we need to be doing better, but until we start looking at the KPIs, we do not have a way to measure how well we are doing."
McLin told CBMR that monitoring these KPIs forces problems to surface sooner, thus "enabling you to be more proactive about managing your work."
For more information: To help construction companies, FMI, Microsoft Business Solutions, and SIS Software have teamed up to present an executive Web cast series, "Key Performance Indicators Driving Best Practices in Construction."
These Web casts provide detailed information about the KPIs and describe the practices that the best-of-class companies in the industry are using. The overall objective is to help construction firms increase profitability, improve productivity, and manage risk. All Web cast participants will receive a free copy of the white paper on KPIs for construction. Visit www.fminet.com for registration details.
Key Performance Indicators for Construction Companies
* Accounts receivable + retention receivable + underbillings = Cash Conversion
* Accounts payable + retention payable + overbillings = Cash Funding
* Cash conversion-cash funding = Cash Demand
* Subcontractor revenue/365 days = Average Daily Revenue
Schedule Variance Indicator-Key Equation:
Original duration (days)-revised duration (days) = Schedule Variance (%)
Total remaining duration (days)
* Forecasted revenue-forecasted direct costs = Forecasted Gross Margin
* Actual revenue of closed jobs-actual direct costs on closed jobs = Actual Gross Margin on Closed Jobs
* WIP revenue-WIP direct costs = WIP Gross Margin
Cash Flow Indictor-Key Equation:
Sum of project cash receipts-sum of project cash disbursements = Project Cash Position
Unapproved Change-Order Indicator-Key Equation:
Sum of costs incurred on unapproved change orders (%) = % of Margin-at-
Total forecasted gross margin ($)
Risk
Committed Cost Indicator-Key Equation:
Sum of uncommitted costs on contracts in progress = % of Uncommitted
Sum of all available committed costs
Costs
Backlog Indicator-Key Equation:
Sum of forecasted gross margin-sum of earned gross margin = Gross Margin in Backlog
(Source: Key Performance Indicators Drive Best Practices for General Contractors, a white paper by Ken Roper and Michael McLin, FMI Corp.)
Strategies for Successful Scorecards: Key to Performance Management Initiatives
Article published in DM Direct Newsletter
February 23, 2007 Issue
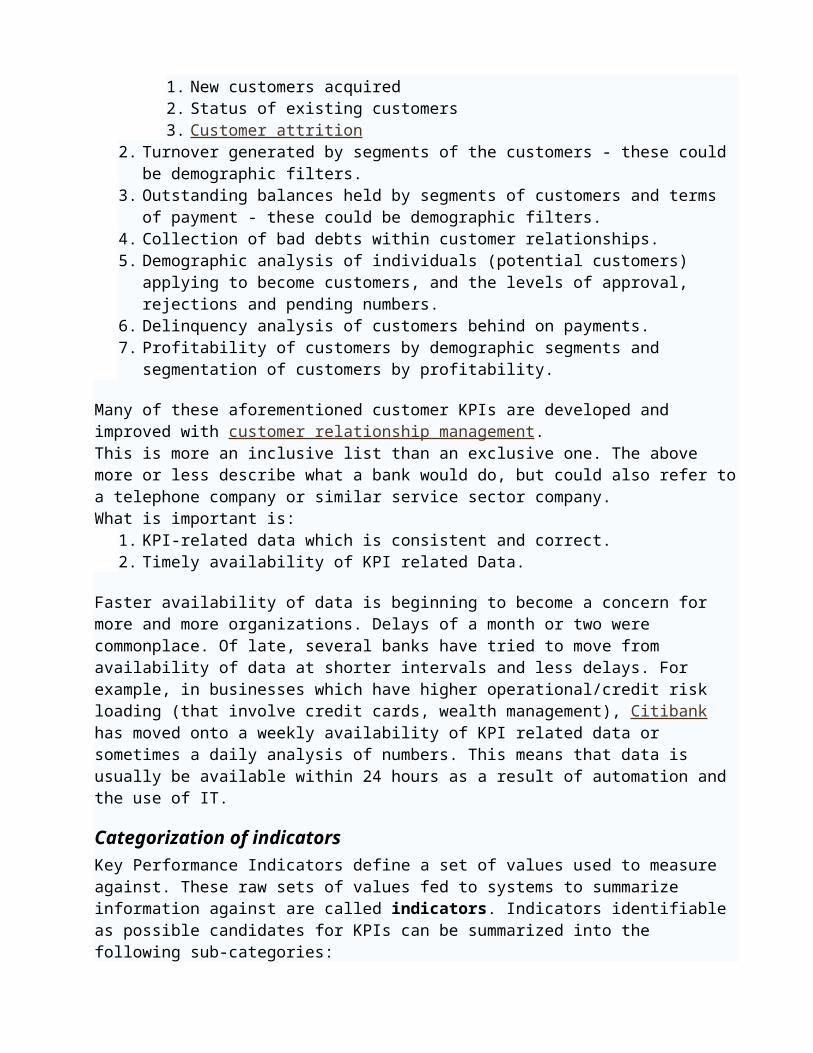
By Leah MacMillan
Companies juggle a variety of priorities: driving innovation, launching products, improving quality, creating value for customers, developing new markets, managing human capital and, ultimately, increasing shareholder value.These priorities make up the basic elements of any company's strategy. Executives and managers must determine the value each one creates for their particular situation, their relative importance, and the interaction among the processes that drive them. Once these have been determined, executives can integrate these elements into a strategic plan and communicate the plan throughout the rest of the organization.Employees in all types of organizations need to rely on the strategy to guide their decisions and focus their energies on the areas of highest priority. Historically, companies have relied on financial metrics to support these decisions, but this approach is proving increasingly ineffective. Financial metrics only reveal the effect of decisions made in the past.In a complex and challenging economy, companies need forward-looking or "leading" metrics that are tied to the company's value drivers. Leading metrics (for example, customer satisfaction) based on cause-and-effect relationships can alert companies to problems before they adversely affect the bottom line. For example: declining customer satisfaction can point to an eventual drop in overall revenue or a loss of market share.Further, companies need to integrate these metrics into a performance management environment that can be deployed across the entire organization. In the example above, many departments have a role to play in managing customer satisfaction. Employees in each need to know their roles and responsibilities and where they fit into the overall plan.
Factors Impeding Visibility Until now, this has been easier said than done. One of the biggest challenges companies face has been consolidating performance data from disparate sources into a coherent system that people can trust. Companies usually rely on a raft of performance data drawn from many different systems: enterprise resource planning (ERP), customer relationship management (CRM), spreadsheets, flat data files, data marts, presentation software, legacy data and other sources. Each system provides important information about a particular aspect of the company's performance, but each collects, defines and displays the information in a different way.Disparate data creates confusion and inefficiencies, and blurs accountability. Metrics based on this data are often incomplete, conflicting or limited to a particular department or function. Sometimes they are all three.A common problem among managers is spending more time discussing the validity of the data than using it to manage performance. Metrics may show that a problem exists but not who is responsible for resolving it. In addition, managers may interpret metrics differently from what executives intend. As a result, their teams may focus on objectives that conflict with overall strategic goals.
Three Common Business PainsWithout commonly understood definitions and a consistently defined view of their performance, executives have difficulty understanding how the company is performing overall, whether the company is going in the right direction, and who is responsible for taking corrective action when problems arise. Managers have no way of monitoring their department's performance relative to the strategy and risk misallocating resources. Employees have little opportunity to collaborate for effective decision-making. So despite an abundance of performance data, companies still make many key decisions based on gut feel and best guesses. Three common pains contribute to this problem:
Lack of Alignment Companies risk wasting resources and efforts when they lack a commonly shared and understood strategy. In the absence of commonly shared source of metrics, managers may measure performance in areas not related to the corporate strategy or not aligned in the correct way.This usually leads to managers suggesting different priorities or providing conflicting solutions to performance problems. For example, Balanced Scorecard creators Kaplan and Norton describe how the 25 executives at a then-recently merged bank agreed "to provide superior service to targeted customers," only to find out later that each executive had a different definition of "superior service" and a different image of "targeted customers."1
Lack of Focus on What's Important Misaligned tactics often lead to an inability to focus. Without a commonly shared understanding of corporate goals, every priority becomes a top priority. This spreads human and financial resources too thin.Managers can also become distracted by opportunities that are easy to capitalize on but do little to support higher-level strategic goals. Individual employees are caught between competing or conflicting initiatives, lacking both the context and information they need to decide where to focus.
Lack of Accountability and Ownership Employees know they are responsible for driving corporate performance. But not every employee knows if or when he or she is responsible for resolving a performance problem. Many problems persist or go unaddressed simply because no one person, team or department has been specifically tasked with resolving them. Also, many problems span departments and functions.

To resolve these issues, people in each department need to understand how their decisions affect outcomes in other departments. Yet few employees can easily look beyond their respective silos. Many companies implement a scorecard system to resolve these issues.
Scorecards Alleviate Business Pains Scorecarding is a proven approach for monitoring, measuring and managing performance at a tactical or strategic level for an organization, team or individual employees. At the tactical level, employees and managers use scorecards to monitor performance against targets for discrete, specific projects. At the strategic level, scorecards can be part of a corporate-wide performance management system that executives use to map the overall corporate strategy and communicate it throughout the organization.A scorecard is a list of key performance indicators (KPIs), or metrics, that present current performance data for a business process or strategic goal against target values. Most metrics feature a corresponding color scheme and trend arrow that indicates whether that performance is on, above or below target and whether performance is trending up or down. Most scorecards, such as those used in Balanced Scorecard implementations, use a mix of financial and nonfinancial information, leading and lagging (financial) indicators, and corresponding strategy maps.The Balanced Scorecard made its first appearance in the Harvard Business Review in 1992. In their seminal article, Drs. Robert Kaplan and David Norton asserted that a company's financial metrics reflected the effects of only a small proportion of the decisions made within that company, and that its true value could be more accurately evaluated and increased by identifying the value created by the interplay of people, processes, and other intangible assets such as customer relationships, employee skills, and brand.2 These dynamics would be aligned with the overall strategy and progress against it would be measured with metrics grouped into four interconnected perspectives: financial, customer, internal processes, and learning and growth. These perspectives help companies answer fundamental questions about their business performance. For example:
Financial: What must we focus on to meet shareholder expectations? Customer: How should we deliver value to customers in key market segments? Internal: At which operational processes must we excel to satisfy shareholders and targeted customers? Learning and Growth: How will we sustain our ability to change and improve?
Scorecards help companies translate strategy into specific, measurable objectives that can be consistently defined, applied, understood, and communicated to everyone. The Balanced Scorecard illustrates a company's key value drivers and shows how they interact to create value and competitive advantage. This is done through a strategy map.A strategy map is a visual tool that enables companies to illustrate the cause-and-effect relationships between strategic goals and the processes that companies use to achieve them, and the intangible assets that they need to leverage effectively.The Balanced Scorecard proved immensely successful, helping some companies move from last to first in their industry. Many companies rely exclusively on the Balanced Scorecard, or a modified Balanced Scorecard, to manage their performance. Companies also use the Balanced Scorecard in conjunction with other methodologies such as Six Sigma, total quality management (TQM), activity-based costing (ABC) and economic value added (EVA).
Scorecarding Applications - A Checklist Companies have tried to support their scorecarding initiatives with a mix of purchased and homegrown software applications. Many purchased or proprietary scorecarding solutions are hardwired to ERP systems and require extensive coding to change. This makes them more of a burden than a benefit when a company needs to change priorities in response to changing market conditions and monitor its performance against new benchmarks.Homegrown applications rarely deliver the functionality or analysis required to resolve performance issues. They consist primarily of static HTML pages and usually offer only limited analytical capabilities. They may show that performance is off track, but they don't provide any insight into why this might be.Companies need a scorecarding application that can be delivered to every employee so they can monitor their performance, and that also provides the necessary analytic capabilities that managers can use to understand why performance is on or off track.Many scorecarding initiatives fail because of a lack of adoption among middle management. Connecting scorecards to a BI environment can increase adoption within this key audience because it provides managers with relevant tactical information they need to translate strategy into action.Analysts Bill Hostmann and Frank Buytendijk note, "Practice shows that if the Balanced Scorecard somehow provides basic drill-down capabilities, use on the middle-management level takes off. It is the drilldown for performance indicators into relevant breakouts that provides a more tactical view. Not only does the Balanced Scorecard benefit from being integrated into a broader BI strategy, BI benefits greatly from the Balanced Scorecard methodology as well." 3
Ensuring Alignment and Driving Accountability for Performance Management Successful deployments at leading Global 3500 organizations show us that scorecards can be used as the single trusted source of performance data with which business users can monitor performance against targets. Administrators create a metric, process diagram, or scorecard once and use it across the organization to ensure that everyone is working with the same definitions and to the same targets.In addition, companies that use strategy maps and impact analysis diagrams can understand the cause-and-effect relationships of key processes and metrics. Further, metrics can integrate a range of cross-functional data from any
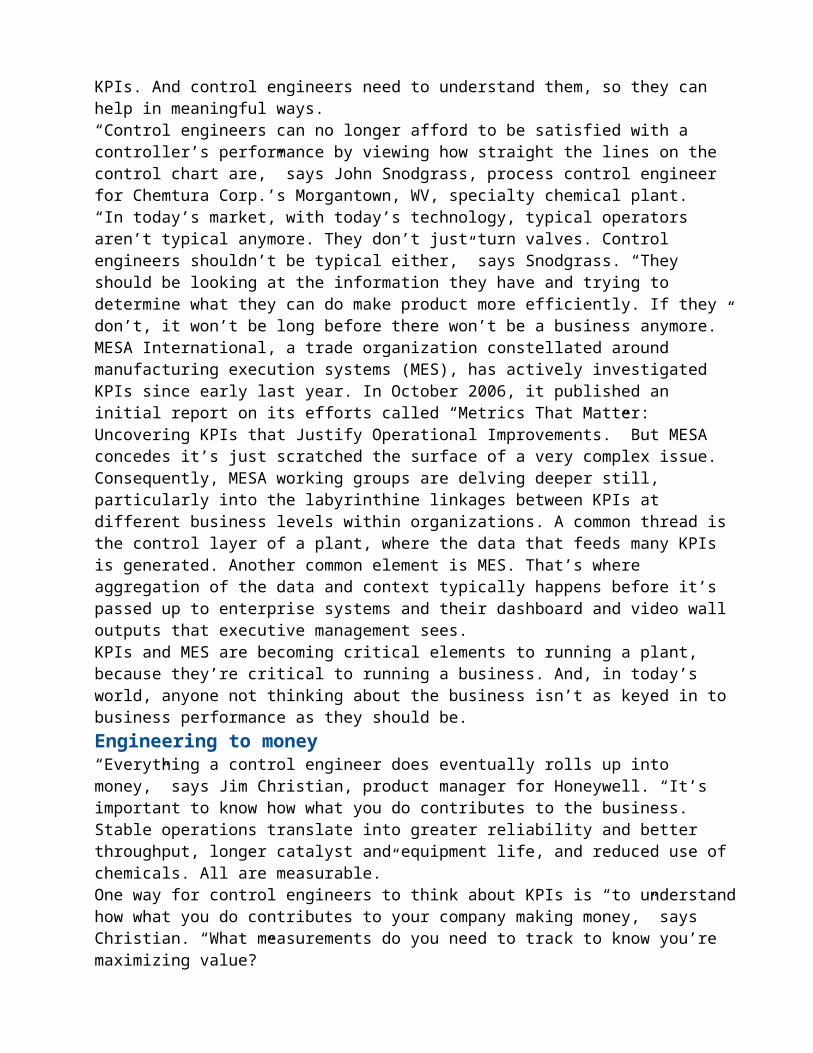
source, including OLAP and dimensionally aware relational data, ERP and CRM systems, spreadsheets, flat files, legacy and mainframe data, and user-entered values.Companies should use scorecards to help business users increase their focus on key issues. Proven practices suggest companies let users organize and view their scorecards by status to quickly identify problem areas; by owner to understand accountability; and by strategy map to see how processes and metrics support corporate strategy.Companies can also leverage new technologies so users can be notified when a metric changes status, such as through email or PDA alerts and manage corrective actions through embedded initiative tracking and collaboration capabilities. Finally, when deployed as part of a performance management solution, scorecards can leverage BI reports, analysis, dashboards and other content to better analyze and understand the factors that affect performance.Today, leading global organizations recognize that scorecarding provides an essential role in performance management by helping to answer three essential business questions: How are we doing? Why? What should we be doing? Just as the questions are connected, the fabric of information fueling the answers must connect as well. The answers must be based on a common understanding of metrics, data dimensions, data definitions and views of the organization, delivered through scorecarding.
References:1. Robert Kaplan & David Norton. "Using the Balanced Scorecard as a Strategic Management System." Harvard
Business Review, January-February 1996. 2. Kaplan & Norton. "The Balanced Scorecard: Measures that Drive Performance." Harvard Business Review,
January-February 1992. 3. Frank Buytendijk and Bill Hostmann. "The Five Fatal Flaws of BI." Gartner BI Summit, Chicago 2005.