KOSOVAN MIGRATION - IOM Kosovokosovo.iom.int/sites/default/files/Migrimet English FINAL...
78
KOSOVAN MIGRATION
Transcript of KOSOVAN MIGRATION - IOM Kosovokosovo.iom.int/sites/default/files/Migrimet English FINAL...
KOSOVAN MIGRATION

KOSOVAN MIGRATION
Pristina
April, 2014
This report was prepared by the staff of the Kosovo Agency of Statistics in cooperation with representatives of other local and international institutions.
The team that worked on preparation of this report:
Team leader:Mr. Avni Kastrati, Chief of Population Division in KAS
Mr. Kadri Sojeva, Deputy Manager of PCO in KAS,
Mr. Zymer Maxharri, Methodologists in KAS,
Ms.Sanija Uka, Chief of Population Statistics Sector, KAS
Mr. Rahman Tara, Head of Cartography Sector, in KAS,
Mr. Dren Gashi, Information Technology Sector, KAS
Prof. Dr. Tefik Basha, Professor at the Faculty of Mathematics and Natural Sciences,
Public University of Pristina, Denis Nushi and Leon Thaçi from UNDP (Kosovo), Visar Kastrati, “Universum” college, Liridon Zeqa from the Ministry of Diaspora, Dukagjin Etemi from the Ministry of Local Government Administration.
A special thanks for professional contribution and unreserved technical support on the finalization of this report goes to the International Organization for Migration in Kosovo (IOM), Mr. Jorge Baca Vaughan (Head of IOM mission in Kosovo) and Mr. Roberto Cancel (IOM Project Manager Kosovo).
User service: Contact us via:
Email: [email protected]: [email protected]
Phone: +038 200 31 129Fax : 038+038 235 033
Address: Kosovo Agency of Statistics
Str: “Zenel Salihu” ,no.4 10000 Pristina – Kosovo
More information is available on the Internet, which can be accessed through the website of KAS
http://esk.rks-gov.net/
Published: April 2014©: Kosovo Agency of Statistics Reproduction is authorised provided the source is acknowledged
KOSOVAN MIGRATION
5PAGE
Introduction
This is the first report on Kosovan migration prepared by the Kosovo Agency of Statistics. This report introduces data on both national and international migration (emigration-immigration).
KAS has prepared this report, and published it, under the responsibilities deriving from the Law on Official Statistics of the Republic of Kosovo, no. 04/L-036, specifically under Articles 16 and 28 of this Law
An adequate importance has been given to the concepts of migration in order to allow the users of this data to distinguish the correct terminology.
This is an important report as it provides a solid basis for assessing the key features of international migration.
The report contains demographic and socio-economic aspects of migration.
For various researchers, including demographers and statisticians, data on international migration is an important source for assessing the migration trends in terms of reproduction, gender, age, and other factors that well be important for future evaluation and planning.
Since the data is given at the municipal level, the users of this data have the potential to use it in order to plan migration, and its impact on the family, municipality, or even the region, in the future.
In economic terms this data is a good basis for evaluating (based on focusing across various countries) the flow of investments from Diaspora and the remittances.
This report will make it possible for data users to become closely informed about internal migration, reasons for migration, migration periods, age, gender of migrants, and other aspects, which are included in this report.
Analysis made in this report and various tables introduced provide for data users a comprehensive report on internal migration, as a valuable source for further work in future planning, analyzing, and projecting of internal migration trends.
Countries/municipalities that face steep emigration can plan more favorable conditions in order to reduce the rate of emigration for not having steep emigration in the future, while countries/municipalities with steep immigration can do their appropriate planning on capacities and possibilities on providing necessary conditions in the future.
This data will be important both at the national and local level.
Drafting of this report was enabled as a result of the 2011 Population Census in Kosovo which has been conducted based on international criteria and standards on censuses, including the form on population which had emigrated out of Kosovo.
Chief Executive Officer of Kosovo Agency of Statistics
Mr. Isa Krasniqi

ContentsCHAPTER I .................................................................................................................................................................................................. 11
1.1.1 ABOUT THE TERMS ON POPULATION MOVEMENT/MIGRATION ....................................................................................................... 11
1.1.2 DEFINITIONS ................................................................................................................................................................................... 12
1.1.3 Purpose of migration ........................................................................................................................................................................ 13
1.1.4 ABOUT 2011 POPULATION CENSUS ................................................................................................................................................... 14
CHAPTER II ................................................................................................................................................................................................... 15
2. INTERNATIONAL MIGRATION ................................................................................................................................................................. 17
2.1.1 INTERNATIONAL EMIGRATION ......................................................................................................................................................... 18
2.1.2 International migration from Kosovo municipalities ........................................................................................................................ 19
2.1.3 International migration by country of residence ............................................................................................................................. 21
Tab. 2.1 International migration by country (10 leading countries of destination) expressed in percentages ........................................... 21
2.1.4 Preferences of emigration from municipalities ................................................................................................................................ 21
Tab. 2.2 The largest number of emigration by municipalities in 10 leading countries of destination ...................................................... 21
2.1.5 Eigration by sex ................................................................................................................................................................................ 22
2.1.6 Emigration by age .............................................................................................................................................................................. 23
Tab. 2.3 Population abroad Kosovo and non-resident population by age groups ...................................................................................... 23
2.1.7 Emigration by years .......................................................................................................................................................................... 24
2.1.8 Emigration periods ............................................................................................................................................................................ 25
2.1.9 Reasons for emigration ..................................................................................................................................................................... 26
Tab. 2.4 Main reasons for international migration, expressed in percentage ............................................................................................ 26
2.2 International immigration ................................................................................................................................................................... 27
2.2.1 Intrenational immigration by years .................................................................................................................................................. 27
2.2.2 Proportion of immigration with the resident population in Kosovo .................................................................................................. 28
2.2.3 Immigration by countries .................................................................................................................................................................. 30
2.3 The balance of international migration ............................................................................................................................................... 31
Tab. 2.5 Interational migration balance by municipalities ......................................................................................................................... 31
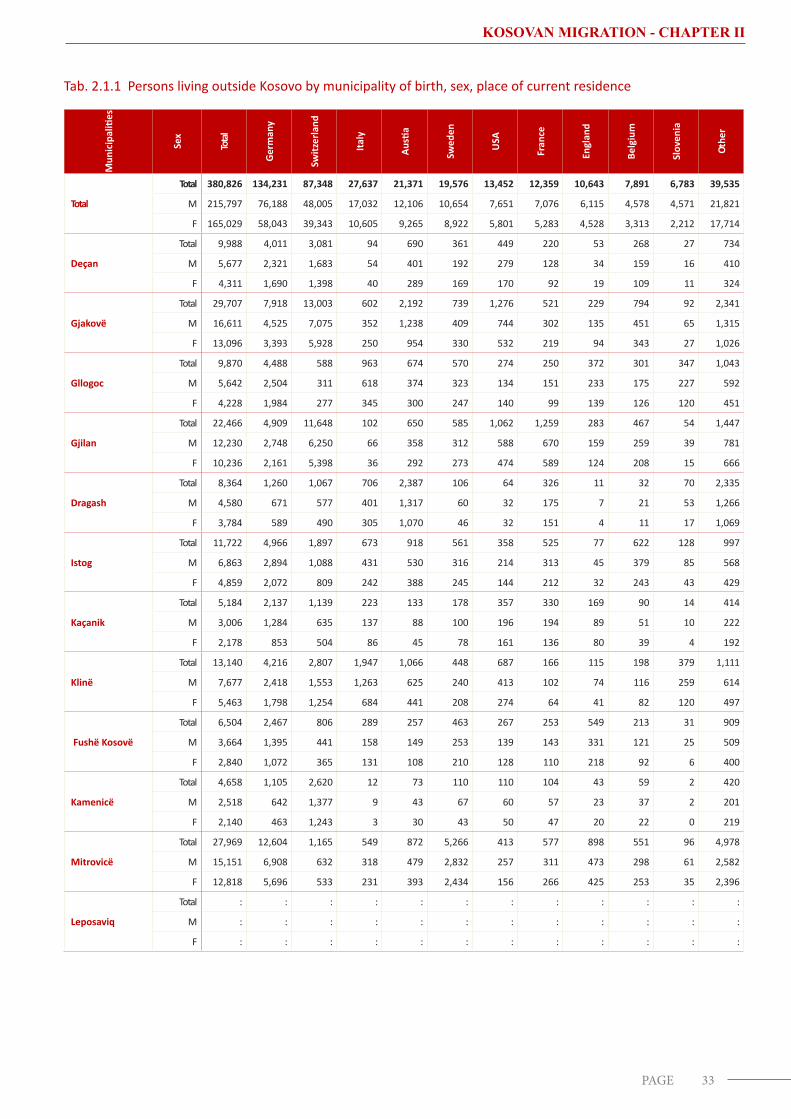
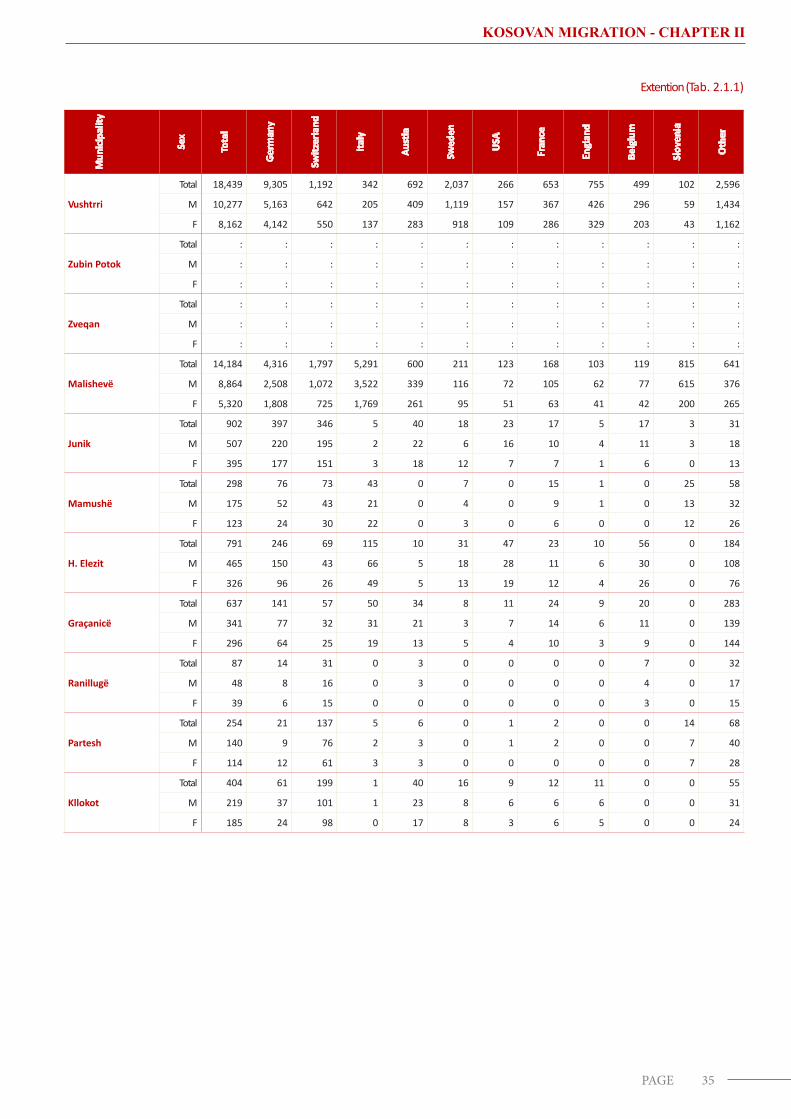
Tab. 2.1.1 Persons living outside Kosovo by municipality of birth, sex, place of current residence ........................................................... 33
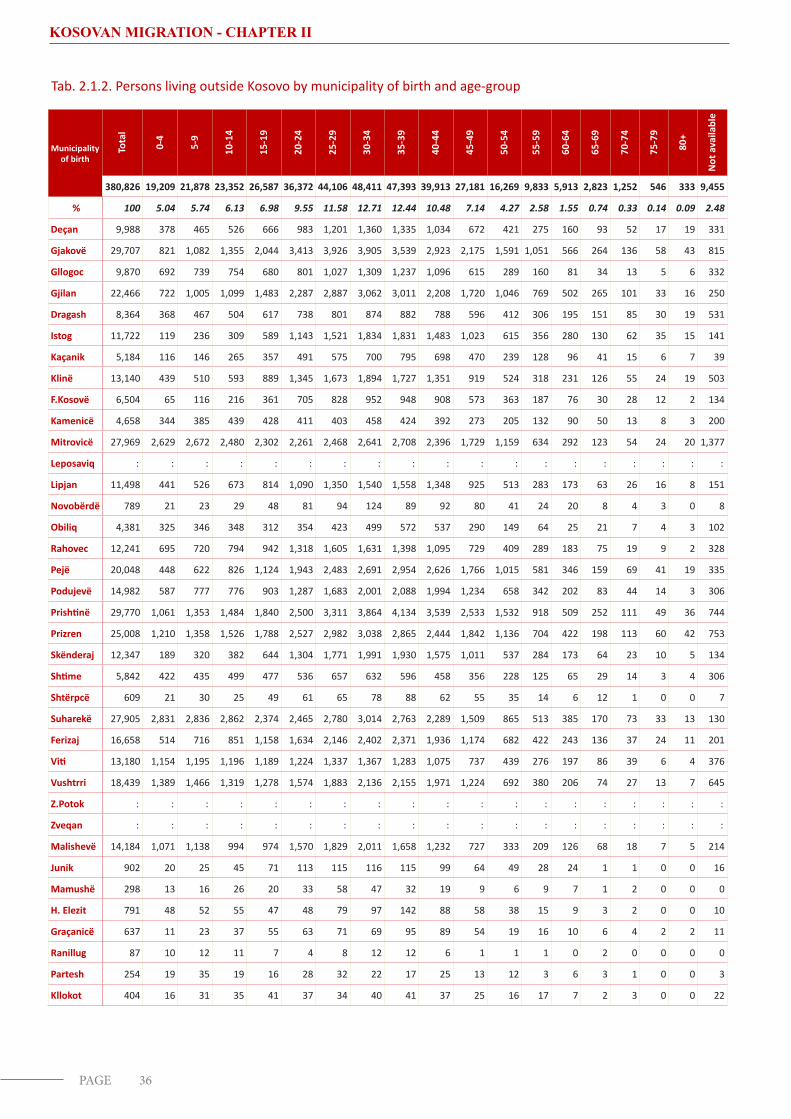
Tab. 2.1.2. Persons living outside Kosovo by municipality of birth and age-group .................................................................................... 36
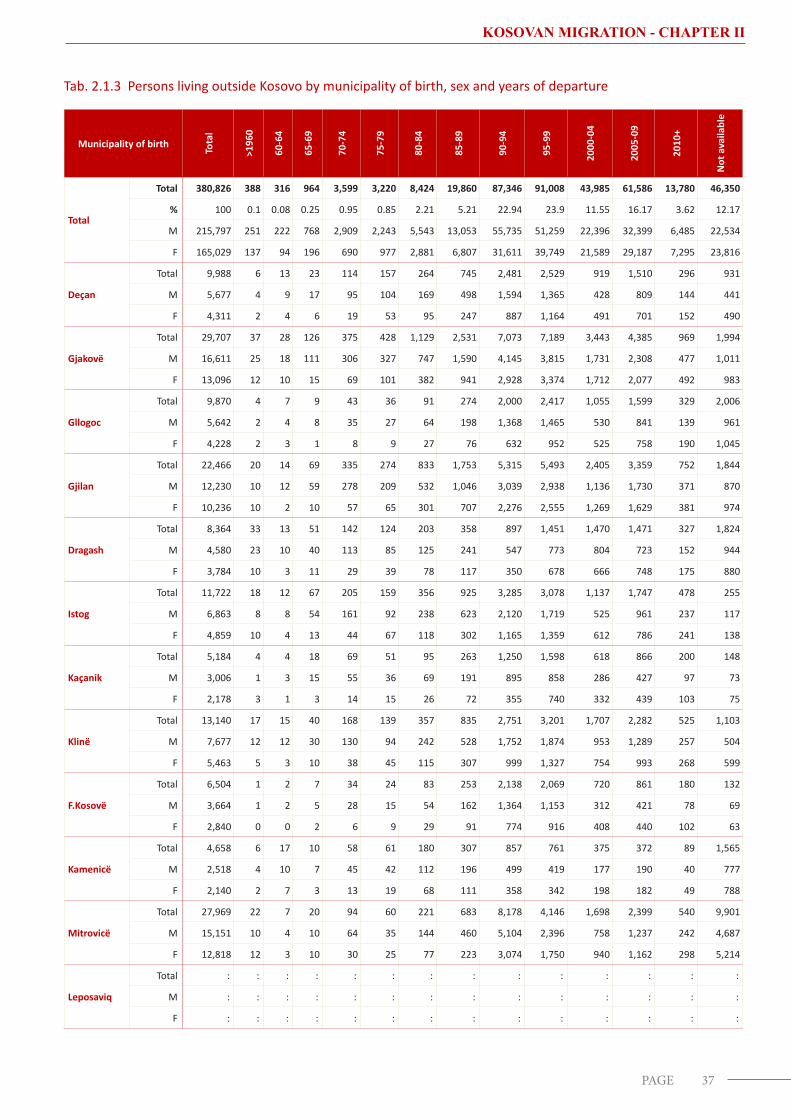
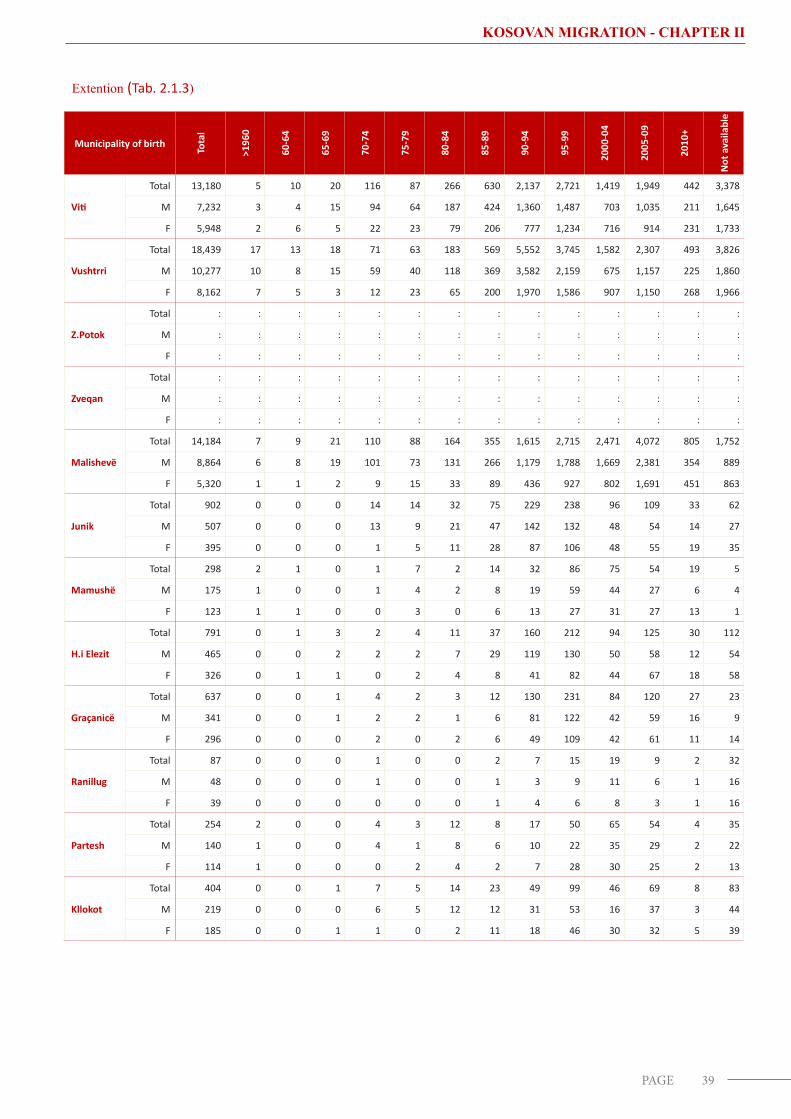
Tab. 2.1.3 Persons living outside Kosovo by municipality of birth, sex and years of departure ................................................................. 37
Tab. 2.1.4 Persons living outside Kosovo by municipality and reasons for leaving ..................................................................................... 40
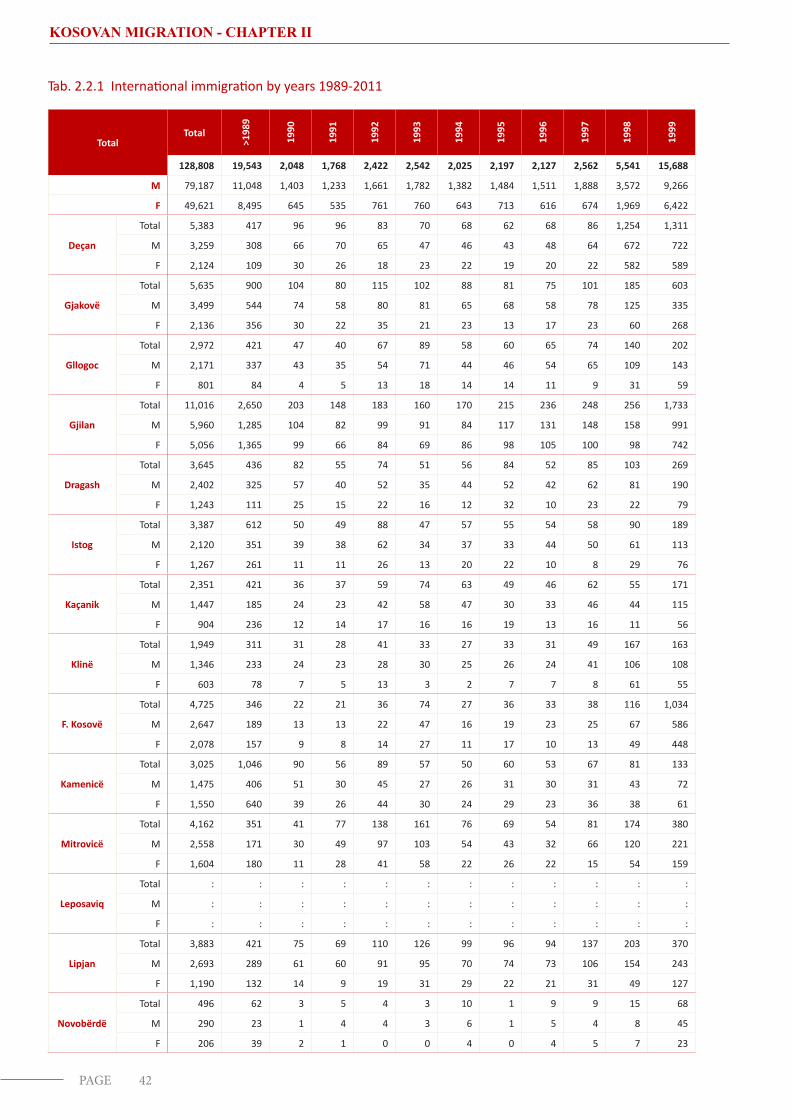
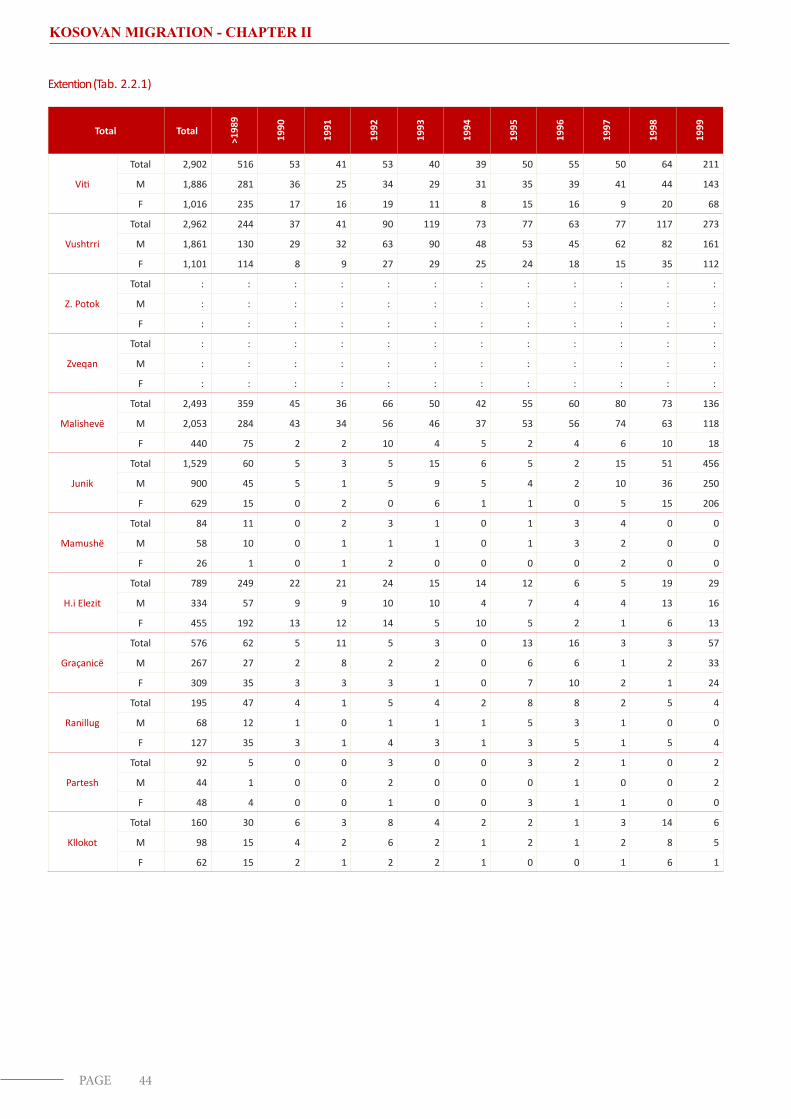
Tab. 2.2.1 International immigration by years 1989-2011 .......................................................................................................................... 42
Tab. 2.2.2 Imigrimi ndërkombëtar në Kosovë sipas shteteve kryesore ...................................................................................................... 48
CHAPTER III .................................................................................................................................................................................................. 51
3. NATIONAL MIGRATION (INTERNAL) ......................................................................................................................................................... 53
3.1.1 INTERNAL EMIGRATION ..................................................................................................................................................................... 55
3.1.2 Migration from Kosovo municipalities ............................................................................................................................................... 55
3.2.1 NATIONAL IMMIGRATION ................................................................................................................................................................... 57
3.2.2 Immigration from Kosovo municipalities .......................................................................................................................................... 57
3.3 Internal Migration Balance .................................................................................................................................................................. 59
Tab. 3.3 Internal migration balance by municipalities ................................................................................................................................ 59
3.4 Total migration balance (international / national) ................................................................................................................................ 60
Tab. 3.4 Total migration balance by municipalities ................................................................................................................................... 60
Tab. 3.1.1 1 Internal migration, departures, the share in proportion with the resident population at municipal and national level ......... 62
Tab. 3.1.2 Internal migration/immigration from/in municipalities of Kosovo ............................................................................................. 63
Tab. 3.1.2 Internal migration/immigration from/in municipalities of Kosovo ............................................................................................. 65
Tab. 3.2.1 Main reasons for internal migration/immigration ...................................................................................................................... 68
Tab. 3.2.2 Internal migration/immigration by years and sex ....................................................................................................................... 69
CHAPTER IV ................................................................................................................................................................................................. 73
4.KOSOVAN POPULATION/ WITH KOSOVO ORIGIN ..................................................................................................................................... 75
Tab. 4.1 Kosovo’s population, emigrated and with Kosovan origin (April 2011)......................................................................................... 76
Important note ............................................................................................................................................................................................ 77

KOSOVAN MIGRATION
8PAGE
List of symbols
% Percentage ‰ Per thousand (promils)1-4 Simple class of integers, for example from 1 to 5 excluding number 5.0-4 Group interval85+ Over eighty-five years<18 Smaller (less) than eighteen >18 Greater (more) than eighteen- No data: Missing data
KOSOVAN MIGRATION
9PAGE
Preface
The publication of a report of this nature, with a focus on migration, represents a new and important milestone in the continuous professional work of the Kosovo Agency of Statistics.
Data collected during the 2011 Population and Housing Census and other data from various sources have been used as the main sources for analyzing the reasons of migration in the recent decades.
Data on international migration in this report are mainly for the migration period from 1969 up to April 2011.
The data is important for policy makers, both at the municipal and the national level, for researchers of various areas, as well for various national and international organizations.
The report also highlights the situation through which the Kosovan population has gone through in the last five (5) decades and the main factors that have influenced migration.
Large population movements, especially international migration, occurred in the late 1980’s with a larger flow in 1990 and later. The current migration flows is still relatively large, mainly due to family reunifications and the high level of unemployment which are the main two push factors generating irregular migrants.
The biggest changes in internal migration occurred especially after 1999.
While international migration mainly included young people, internal migration included mainly whole families which moved from rural areas (mainly hilly-mountainous areas) to urban or suburban areas.
In addition to socio-economic consequences, migration also affected the reproductive aspects of the Kosovan population and certain areas. Therefore, the analysis of international and internal migration in Kosovo, based on the data collected, is of particular interest.
The report is divided into five (5) chapters. The first chapter introduces the internationally recognized definitions and the purpose of migration for the Kosovo caseload in particular; the second chapter introduces International Migration; the third chapter introduces internal migration; and the fourth chapter introduces statistical estimations of Kosovo population.

KOSOVAN MIGRATION
10PAGE
KOSOVAN MIGRATION - CHAPTER I
11PAGE
CHAPTER I
1.1.1 ABOUT THE TERMS ON POPULATION MOVEMENT/MIGRATION
In world literature, as well in domestic literature, certain universal terms on population movements are being used in almost all aspects of communications, media and literature. These terms are considered acceptable for the purpose of this study, and will thus be used throughout the report. Hereafter, the following terms will be used:
• Population spatial movement, change of settlement- Migration
• Population departure from a settlement- Emigration
• Population arrived from another settlement- Immigration
Migration is a term used to describe the spatial movement of people, but in a broader sense it also includes the movement of other populations. The data on population migration usually introduces the waves or the trends of movement of people between countries in both directions: emigration (departure) and immigration (arrival).
Data users in some cases fail to make the distinction between these terms in an appropriate manner. Both terms emigration and immigration imply population movement.
The term emigration tends to be used more often because it is a term that is used very often in media and in politics.
The Kosovo Agency of Statistics has provided additional clarifications on the terms used in this publication.
KOSOVAN MIGRATION - CHAPTER I
12PAGE
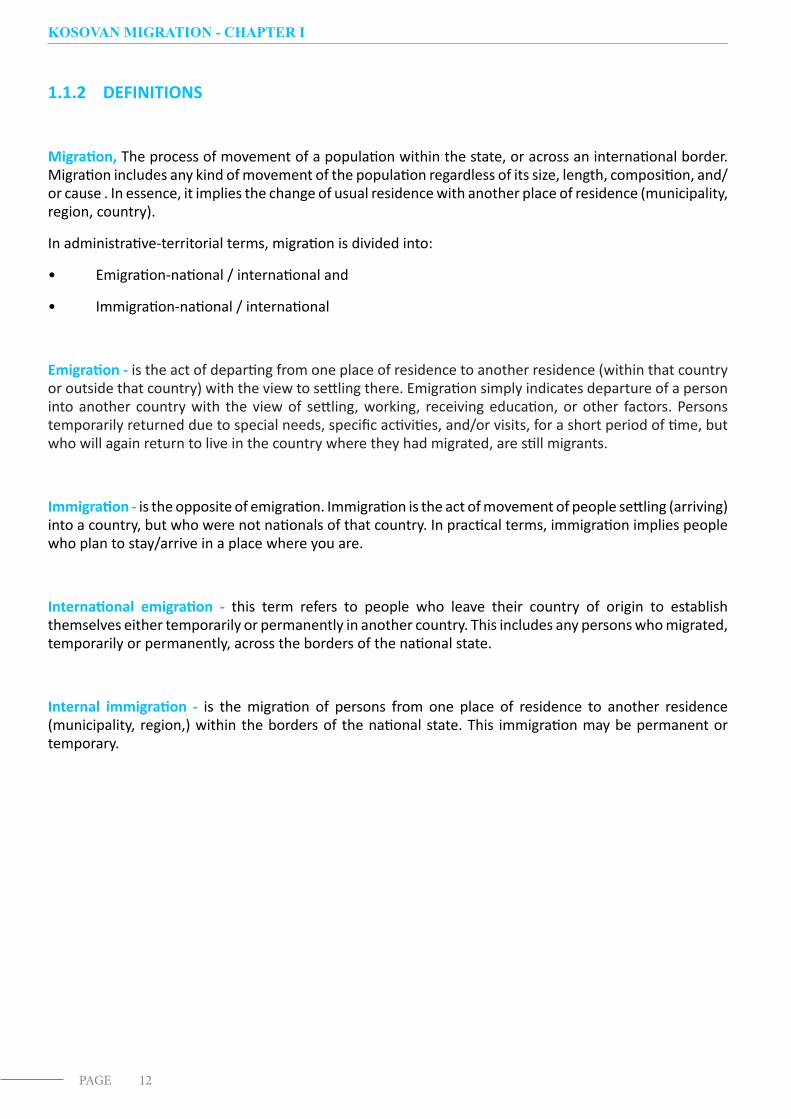
1.1.2 DEFINITIONS
Migration, The process of movement of a population within the state, or across an international border. Migration includes any kind of movement of the population regardless of its size, length, composition, and/or cause . In essence, it implies the change of usual residence with another place of residence (municipality, region, country).
In administrative-territorial terms, migration is divided into:
• Emigration-national / international and
• Immigration-national / international
Emigration - is the act of departing from one place of residence to another residence (within that country or outside that country) with the view to settling there. Emigration simply indicates departure of a person into another country with the view of settling, working, receiving education, or other factors. Persons temporarily returned due to special needs, specific activities, and/or visits, for a short period of time, but who will again return to live in the country where they had migrated, are still migrants.
Immigration - is the opposite of emigration. Immigration is the act of movement of people settling (arriving) into a country, but who were not nationals of that country. In practical terms, immigration implies people who plan to stay/arrive in a place where you are.
International emigration - this term refers to people who leave their country of origin to establish themselves either temporarily or permanently in another country. This includes any persons who migrated, temporarily or permanently, across the borders of the national state.
Internal immigration - is the migration of persons from one place of residence to another residence (municipality, region,) within the borders of the national state. This immigration may be permanent or temporary.
KOSOVAN MIGRATION - CHAPTER I
13PAGE
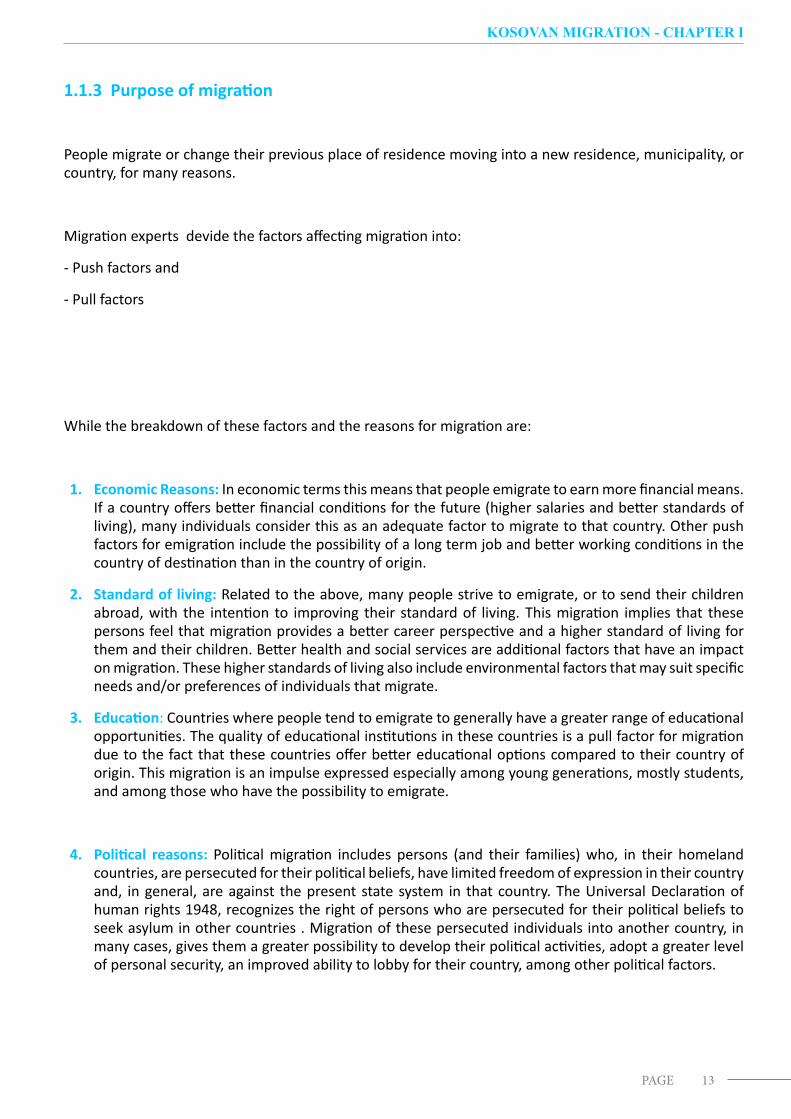
1.1.3 Purpose of migration
People migrate or change their previous place of residence moving into a new residence, municipality, or country, for many reasons.
Migration experts devide the factors affecting migration into:
- Push factors and
- Pull factors
While the breakdown of these factors and the reasons for migration are:
1. Economic Reasons: In economic terms this means that people emigrate to earn more financial means. If a country offers better financial conditions for the future (higher salaries and better standards of living), many individuals consider this as an adequate factor to migrate to that country. Other push factors for emigration include the possibility of a long term job and better working conditions in the country of destination than in the country of origin.
2. Standard of living: Related to the above, many people strive to emigrate, or to send their children abroad, with the intention to improving their standard of living. This migration implies that these persons feel that migration provides a better career perspective and a higher standard of living for them and their children. Better health and social services are additional factors that have an impact on migration. These higher standards of living also include environmental factors that may suit specific needs and/or preferences of individuals that migrate.
3. Education: Countries where people tend to emigrate to generally have a greater range of educational opportunities. The quality of educational institutions in these countries is a pull factor for migration due to the fact that these countries offer better educational options compared to their country of origin. This migration is an impulse expressed especially among young generations, mostly students, and among those who have the possibility to emigrate.
4. Political reasons: Political migration includes persons (and their families) who, in their homeland countries, are persecuted for their political beliefs, have limited freedom of expression in their country and, in general, are against the present state system in that country. The Universal Declaration of human rights 1948, recognizes the right of persons who are persecuted for their political beliefs to seek asylum in other countries . Migration of these persecuted individuals into another country, in many cases, gives them a greater possibility to develop their political activities, adopt a greater level of personal security, an improved ability to lobby for their country, among other political factors.
KOSOVAN MIGRATION - CHAPTER I
14PAGE
5. Family reunification: The process through which family members, that were separated through either voluntary, or forced migration, regroup in a new country, other than the one of their origin. This enables family members to emigrate/move to that country through various forms, such as: family reunification (with parent, children, or other members of a wider family), marriage with the person living in the country of destination where she/he tends to move for cohabitation reasons.
6. Other: certain groups of people who emigrate have other push factors pushing them to migrate such as: family reunification members from the wider family (in cases when the relatives have moved out, emigration for religious reasons, mother tongue or close language to mother tongue, due to conflicts, wars, better long-term security in social, political terms.
1.1.4 ABOUT 2011 POPULATION CENSUS
The Population Census in Kosovo has been conducted based on the Law on: ‘’POPULATION, HOUSEHOLD AND HOUSING CENSUS,’’ no. 03/L-237. Under Article 3 of this law population divisions are specified as: resident population and non-resident population.
Article 3. Item 1.1’’ Resident population - individuals who have lived for a continuous period of time in their usual place of residence for more than twelve (12), months prior to census day, or who have arrived in that place of residence within the period of twelve (12) months prior the census day with the purpose to live there longer than one (1) year. Persons temporarily absent from their usual place of residence in the resident country, for a period of time less than twelve (12) months, for various reasons, such as: employment, studying, traveling, and health treatment or education shall be included in the census, respectively in the resident population.
Article 3. 1.2 Supplementary List - is the list of registered Kosovo population, considered not as a resident population of Kosovo, but which are the citizens of Kosovo. During the enumeration process the data about these persons has been provided by the person him/herself or by a family member”.

KOSOVAN MIGRATION
15PAGE
CHAPTER II

17PAGE
KOSOVAN MIGRATION - CHAPTER II
2. INTERNATIONAL MIGRATION
Migration is a challenge for almost all countries when it comes to coverage and derivation of representative statistical data on international migration, and as such it is being discussed at the highest scientific, research, professional, as well as political, levels. This is due to the complexity that is provided in terms of its definition as well as a result of the fact that the migration process is a dynamic process that is constantly changing over time and affecting different layers of society. The complexity that migration provides due to its definition and its process combined with the reality that nowadays the mobility of people is much greater than in the past, provides an issue for both data users and gatherers.
For various reasons of migration (better economic conditions, education, political reasons, family reunification, among other reasons), international migration of a person from the country of origin, usually is not reported or followed by de-registration at the competent institutions of the country that the person leaves. However, the data on immigration (arrival) of a person from another country are more representative than the data on migration. This is the determining factor (de-registration/registration) that makes difficult derivation of real statistical data on the number of international migration.
.

18PAGE
KOSOVAN MIGRATION - CHAPTER II
2.1.1 INTERNATIONAL EMIGRATION
According to the international migration definitions and standards: a person is an migrant if she/he has left her/his country of birth with the view of settling permanently in another country, no matter if she/he has a special status in the country where she/he has emigrated. A person settled in the country where she/he has migrated (settled) is the resident person of that country. (Temporary travelling abroad for the purpose of recreation, holidays, visiting friends or relatives, for business, medical treatment, or religious pilgrimage does not change the country of usual residence of the person. )
Children born in the country where their parents emigrated (children of migrant parents), by international standards are not migrants. They, the children, have not emigrated from another country, but they were born there (it is their home country) and their place of usual residence is the country where their parents have emigrated. This definition or standard (on emigration) has been used by the Kosovo Agency of Statistics during the Population Census conducted in April, 2011, on collecting data on the Kosovan population that emigrated outside of Kosovo.
Data collected on persons who previously have been Kosovo residents, but who have moved abroad for more than 12 months, regardless their citizenship, has been collected with the form: ‘’Supplementary list on household members living abroad Kosovo (FORM S1)’’
According to official data collected from the FORM S1, ‘ the number of persons (only of those born in Kosovo) who had emigrated from Kosovo was 380.826 persons. According to this data, in proportion to Kosovo’s resident population , 21.4% of population was living outside Kosovo.
The following analysis on international migration was based on the number of persons captured during the last Census, in April, 2011?
Kosovo Agency of Statistics (KAS) is aware that this number of migrants is higher, on the grounds that during the population census, for some of these migrants, there were no close relatives available to provide complete information on the number of household members who had emigrated outside Kosovo. In chapter IV the assessment on Kosovo’s population and the population with Kosovan origin, who had emigrated outside Kosovo, is provided
19PAGE
KOSOVAN MIGRATION - CHAPTER II
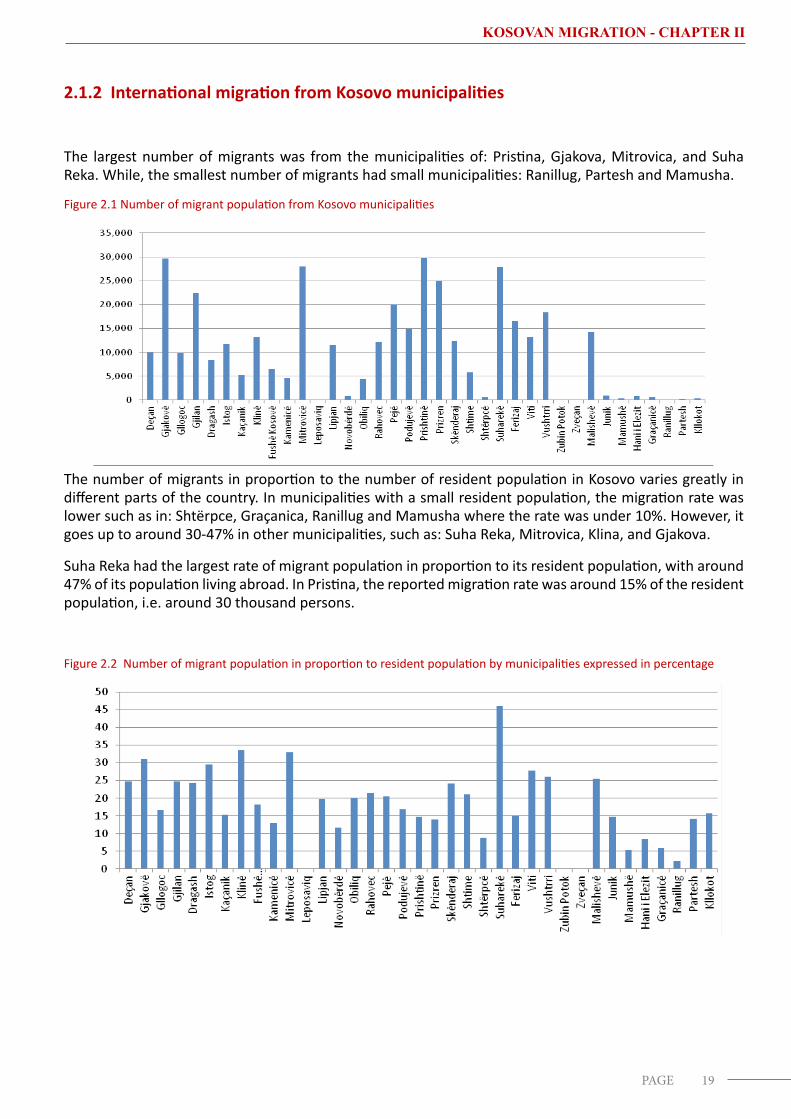
2.1.2 International migration from Kosovo municipalities
The largest number of migrants was from the municipalities of: Pristina, Gjakova, Mitrovica, and Suha Reka. While, the smallest number of migrants had small municipalities: Ranillug, Partesh and Mamusha.
Figure 2.1 Number of migrant population from Kosovo municipalities
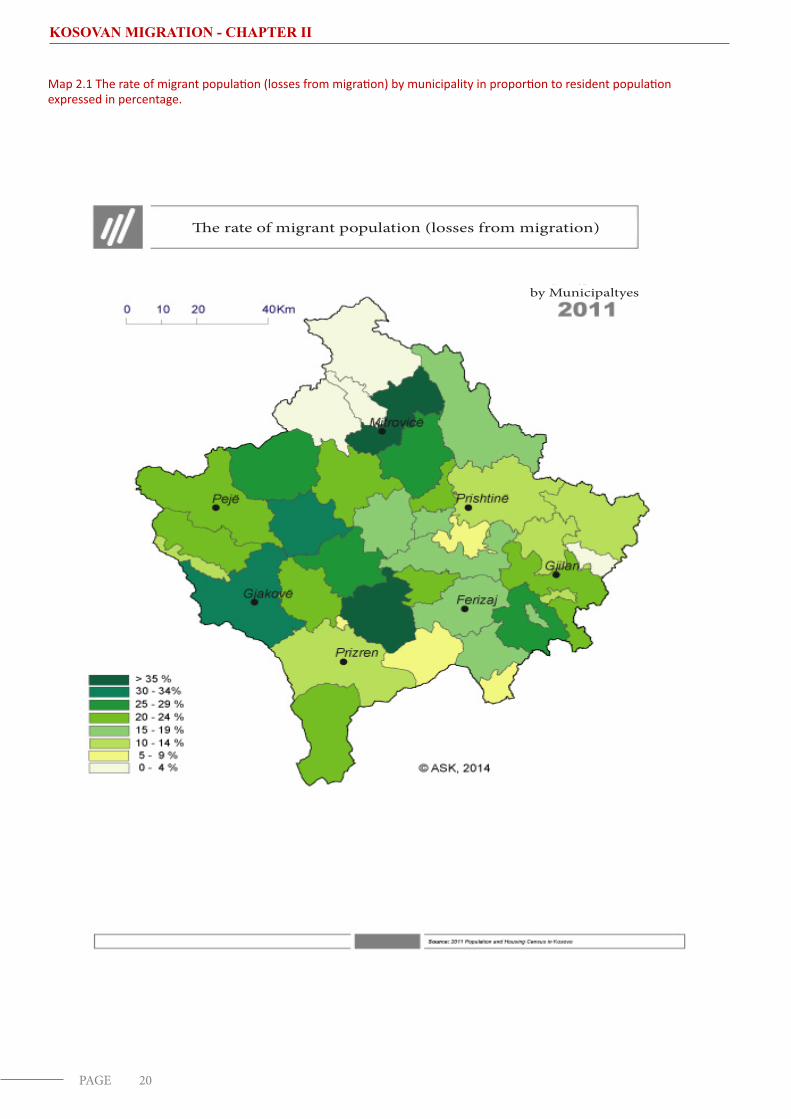
The number of migrants in proportion to the number of resident population in Kosovo varies greatly in different parts of the country. In municipalities with a small resident population, the migration rate was lower such as in: Shtërpce, Graçanica, Ranillug and Mamusha where the rate was under 10%. However, it goes up to around 30-47% in other municipalities, such as: Suha Reka, Mitrovica, Klina, and Gjakova.
Suha Reka had the largest rate of migrant population in proportion to its resident population, with around 47% of its population living abroad. In Pristina, the reported migration rate was around 15% of the resident population, i.e. around 30 thousand persons.
Figure 2.2 Number of migrant population in proportion to resident population by municipalities expressed in percentage
20PAGE
KOSOVAN MIGRATION - CHAPTER II
Map 2.1 The rate of migrant population (losses from migration) by municipality in proportion to resident population expressed in percentage.
The rate of migrant population (losses from migration)
by Municipaltyes
21PAGE
KOSOVAN MIGRATION - CHAPTER II
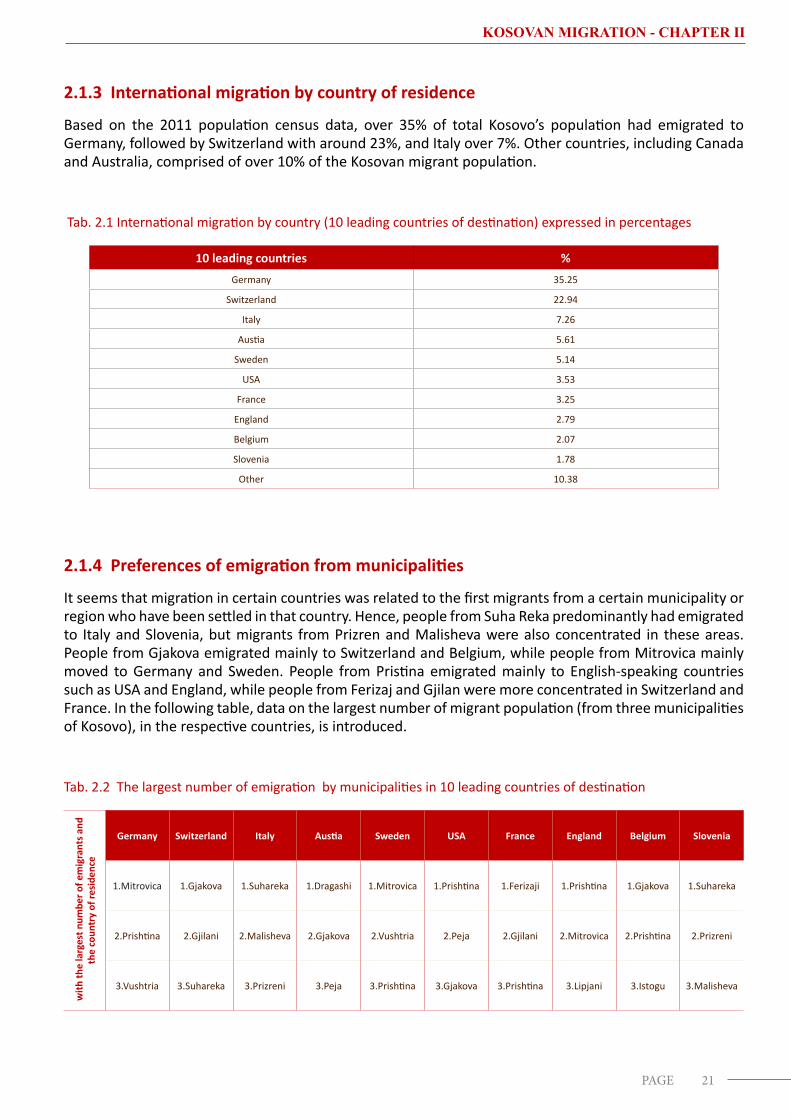
2.1.3 International migration by country of residence
Based on the 2011 population census data, over 35% of total Kosovo’s population had emigrated to Germany, followed by Switzerland with around 23%, and Italy over 7%. Other countries, including Canada and Australia, comprised of over 10% of the Kosovan migrant population.
Tab. 2.1 International migration by country (10 leading countries of destination) expressed in percentages
10 leading countries %Germany 35.25
Switzerland 22.94
Italy 7.26
Austia 5.61
Sweden 5.14
USA 3.53
France 3.25
England 2.79
Belgium 2.07
Slovenia 1.78
Other 10.38
2.1.4 Preferences of emigration from municipalities
It seems that migration in certain countries was related to the first migrants from a certain municipality or region who have been settled in that country. Hence, people from Suha Reka predominantly had emigrated to Italy and Slovenia, but migrants from Prizren and Malisheva were also concentrated in these areas. People from Gjakova emigrated mainly to Switzerland and Belgium, while people from Mitrovica mainly moved to Germany and Sweden. People from Pristina emigrated mainly to English-speaking countries such as USA and England, while people from Ferizaj and Gjilan were more concentrated in Switzerland and France. In the following table, data on the largest number of migrant population (from three municipalities of Kosovo), in the respective countries, is introduced.
Tab. 2.2 The largest number of emigration by municipalities in 10 leading countries of destination
with
the
larg
est n
umbe
r of e
mig
rant
s and
th
e co
untr
y of
resi
denc
e
Germany Switzerland Italy Austia Sweden USA France England Belgium Slovenia
1.Mitrovica 1.Gjakova 1.Suhareka 1.Dragashi 1.Mitrovica 1.Prishtina 1.Ferizaji 1.Prishtina 1.Gjakova 1.Suhareka
2.Prishtina 2.Gjilani 2.Malisheva 2.Gjakova 2.Vushtria 2.Peja 2.Gjilani 2.Mitrovica 2.Prishtina 2.Prizreni
3.Vushtria 3.Suhareka 3.Prizreni 3.Peja 3.Prishtina 3.Gjakova 3.Prishtina 3.Lipjani 3.Istogu 3.Malisheva
22PAGE
KOSOVAN MIGRATION - CHAPTER II
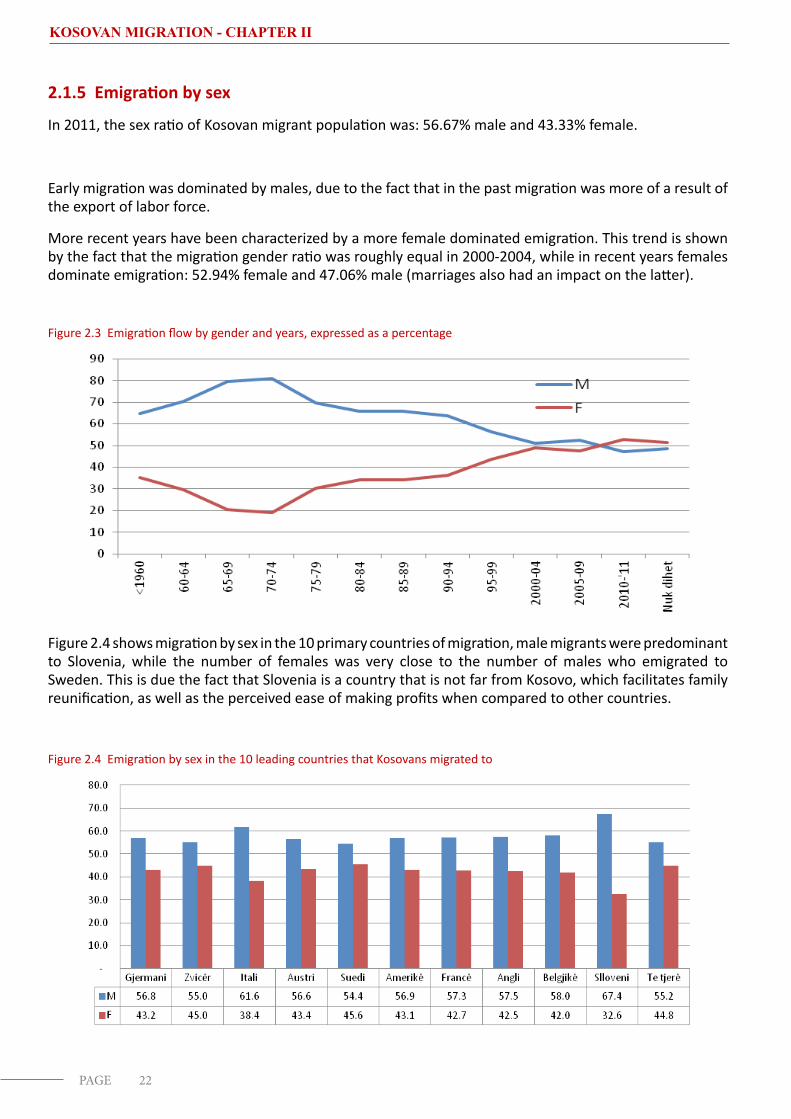
2.1.5 Emigration by sex
In 2011, the sex ratio of Kosovan migrant population was: 56.67% male and 43.33% female.
Early migration was dominated by males, due to the fact that in the past migration was more of a result of the export of labor force.
More recent years have been characterized by a more female dominated emigration. This trend is shown by the fact that the migration gender ratio was roughly equal in 2000-2004, while in recent years females dominate emigration: 52.94% female and 47.06% male (marriages also had an impact on the latter).
Figure 2.3 Emigration flow by gender and years, expressed as a percentage
Figure 2.4 shows migration by sex in the 10 primary countries of migration, male migrants were predominant to Slovenia, while the number of females was very close to the number of males who emigrated to Sweden. This is due the fact that Slovenia is a country that is not far from Kosovo, which facilitates family reunification, as well as the perceived ease of making profits when compared to other countries.
Figure 2.4 Emigration by sex in the 10 leading countries that Kosovans migrated to
23PAGE
KOSOVAN MIGRATION - CHAPTER II
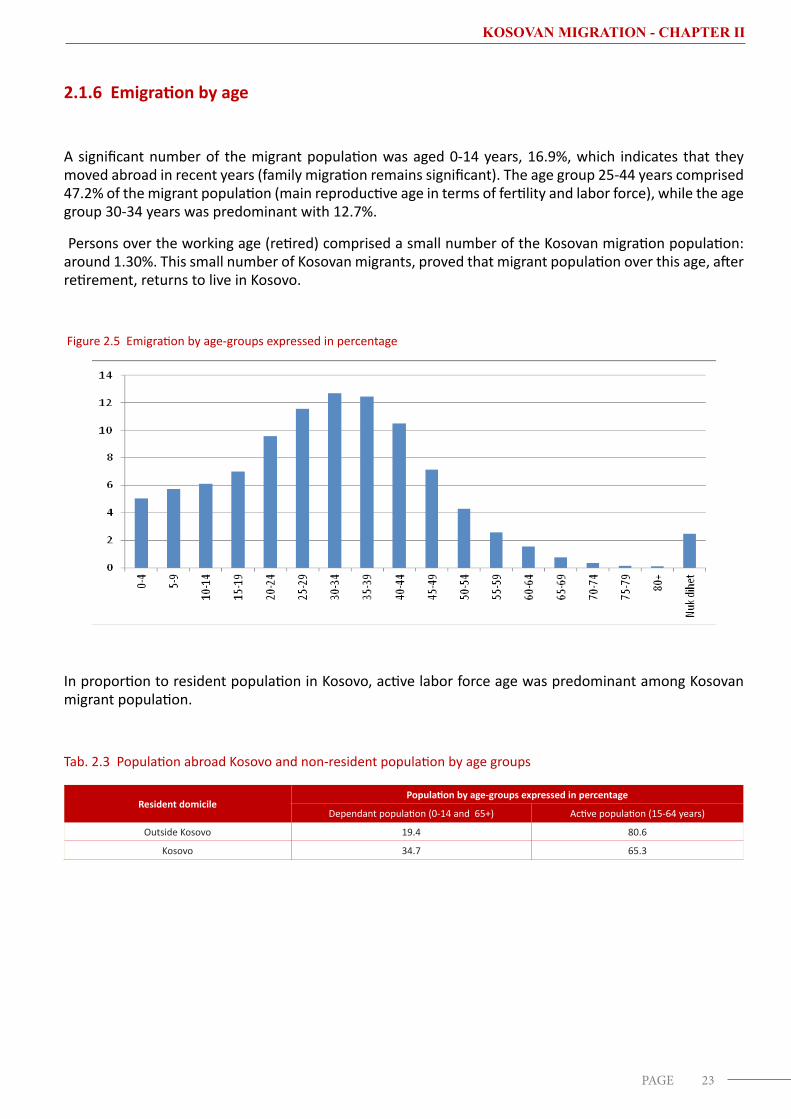
2.1.6 Emigration by age
A significant number of the migrant population was aged 0-14 years, 16.9%, which indicates that they moved abroad in recent years (family migration remains significant). The age group 25-44 years comprised 47.2% of the migrant population (main reproductive age in terms of fertility and labor force), while the age group 30-34 years was predominant with 12.7%.
Persons over the working age (retired) comprised a small number of the Kosovan migration population: around 1.30%. This small number of Kosovan migrants, proved that migrant population over this age, after retirement, returns to live in Kosovo.
Figure 2.5 Emigration by age-groups expressed in percentage
In proportion to resident population in Kosovo, active labor force age was predominant among Kosovan migrant population.
Tab. 2.3 Population abroad Kosovo and non-resident population by age groups
Resident domicile Population by age-groups expressed in percentage
Dependant population (0-14 and 65+) Active population (15-64 years)
Outside Kosovo 19.4 80.6
Kosovo 34.7 65.3
24PAGE
KOSOVAN MIGRATION - CHAPTER II
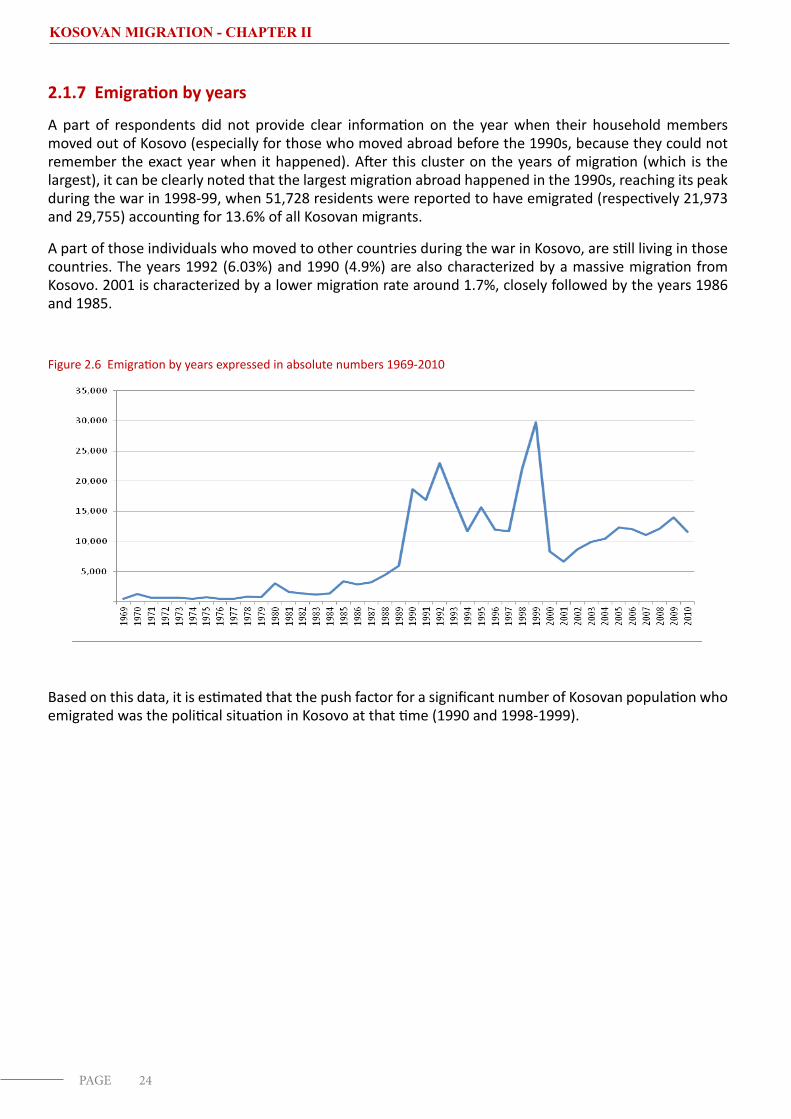
2.1.7 Emigration by years
A part of respondents did not provide clear information on the year when their household members moved out of Kosovo (especially for those who moved abroad before the 1990s, because they could not remember the exact year when it happened). After this cluster on the years of migration (which is the largest), it can be clearly noted that the largest migration abroad happened in the 1990s, reaching its peak during the war in 1998-99, when 51,728 residents were reported to have emigrated (respectively 21,973 and 29,755) accounting for 13.6% of all Kosovan migrants.
A part of those individuals who moved to other countries during the war in Kosovo, are still living in those countries. The years 1992 (6.03%) and 1990 (4.9%) are also characterized by a massive migration from Kosovo. 2001 is characterized by a lower migration rate around 1.7%, closely followed by the years 1986 and 1985.
Figure 2.6 Emigration by years expressed in absolute numbers 1969-2010
Based on this data, it is estimated that the push factor for a significant number of Kosovan population who emigrated was the political situation in Kosovo at that time (1990 and 1998-1999).
25PAGE
KOSOVAN MIGRATION - CHAPTER II
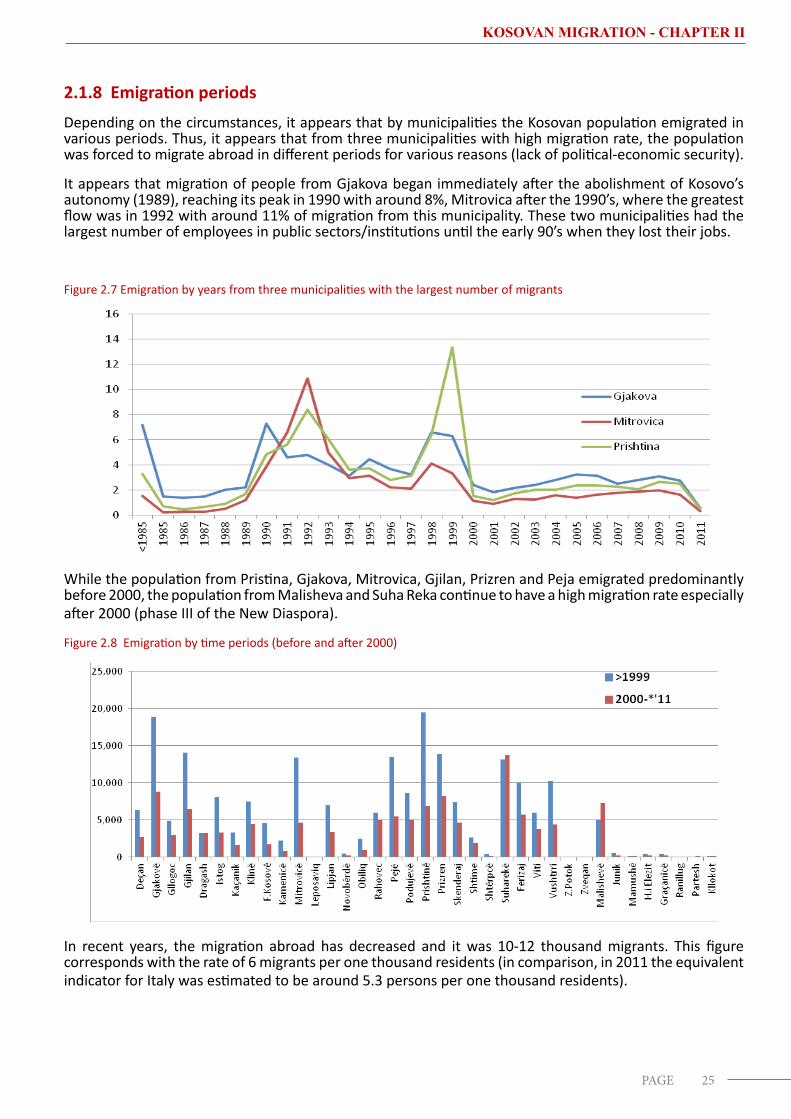
2.1.8 Emigration periodsDepending on the circumstances, it appears that by municipalities the Kosovan population emigrated in various periods. Thus, it appears that from three municipalities with high migration rate, the population was forced to migrate abroad in different periods for various reasons (lack of political-economic security).
It appears that migration of people from Gjakova began immediately after the abolishment of Kosovo’s autonomy (1989), reaching its peak in 1990 with around 8%, Mitrovica after the 1990’s, where the greatest flow was in 1992 with around 11% of migration from this municipality. These two municipalities had the largest number of employees in public sectors/institutions until the early 90’s when they lost their jobs.
Figure 2.7 Emigration by years from three municipalities with the largest number of migrants
While the population from Pristina, Gjakova, Mitrovica, Gjilan, Prizren and Peja emigrated predominantly before 2000, the population from Malisheva and Suha Reka continue to have a high migration rate especially after 2000 (phase III of the New Diaspora).
Figure 2.8 Emigration by time periods (before and after 2000)
In recent years, the migration abroad has decreased and it was 10-12 thousand migrants. This figure corresponds with the rate of 6 migrants per one thousand residents (in comparison, in 2011 the equivalent indicator for Italy was estimated to be around 5.3 persons per one thousand residents).
26PAGE
KOSOVAN MIGRATION - CHAPTER II
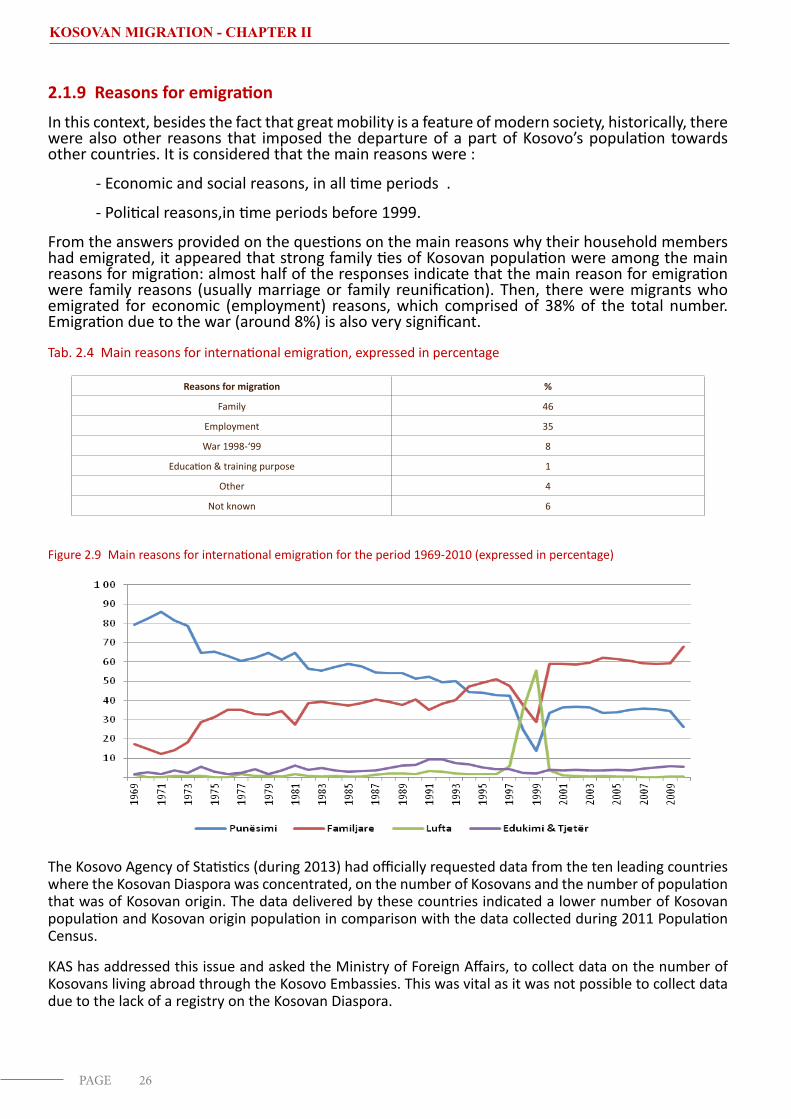
2.1.9 Reasons for emigration In this context, besides the fact that great mobility is a feature of modern society, historically, there were also other reasons that imposed the departure of a part of Kosovo’s population towards other countries. It is considered that the main reasons were :
- Economic and social reasons, in all time periods .
- Political reasons,in time periods before 1999.
From the answers provided on the questions on the main reasons why their household members had emigrated, it appeared that strong family ties of Kosovan population were among the main reasons for migration: almost half of the responses indicate that the main reason for emigration were family reasons (usually marriage or family reunification). Then, there were migrants who emigrated for economic (employment) reasons, which comprised of 38% of the total number. Emigration due to the war (around 8%) is also very significant.
Tab. 2.4 Main reasons for international emigration, expressed in percentage
Reasons for migration %
Family 46
Employment 35
War 1998-‘99 8
Education & training purpose 1
Other 4
Not known 6
Figure 2.9 Main reasons for international emigration for the period 1969-2010 (expressed in percentage)
The Kosovo Agency of Statistics (during 2013) had officially requested data from the ten leading countries where the Kosovan Diaspora was concentrated, on the number of Kosovans and the number of population that was of Kosovan origin. The data delivered by these countries indicated a lower number of Kosovan population and Kosovan origin population in comparison with the data collected during 2011 Population Census.
KAS has addressed this issue and asked the Ministry of Foreign Affairs, to collect data on the number of Kosovans living abroad through the Kosovo Embassies. This was vital as it was not possible to collect data due to the lack of a registry on the Kosovan Diaspora.

27PAGE
KOSOVAN MIGRATION - CHAPTER II
2.2 International immigration According to the 2011 Population Census data, in Kosovo there were 128,808 immigrants (arrived), which comprised 7.4% of the population. Around 97% of immigrants had Kosovan citizenship; therefore, the vast majority of immigrants in fact were returnees to their country. Taking into account the citizenship of its residents, Kosovo is fairly homogeneous country. 98.6% of respondents who responded to 2011 Population Census were Kosovo citizens.
2.2.1 Intrenational immigration by years
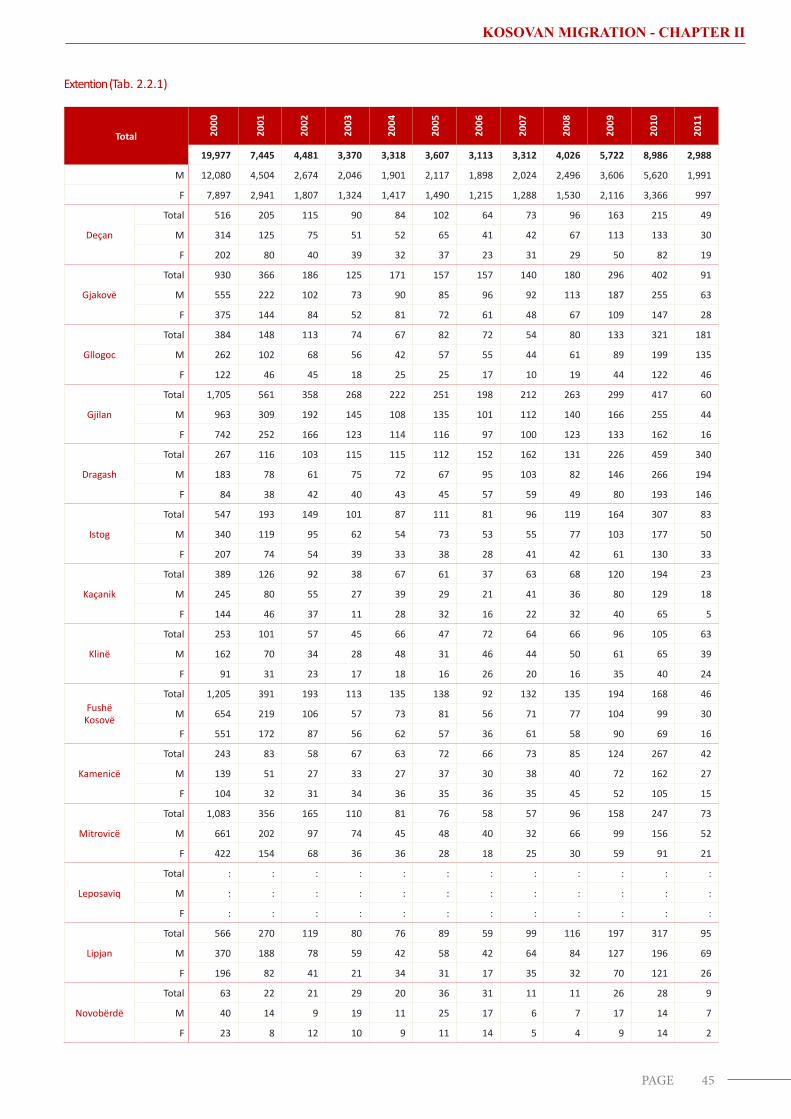
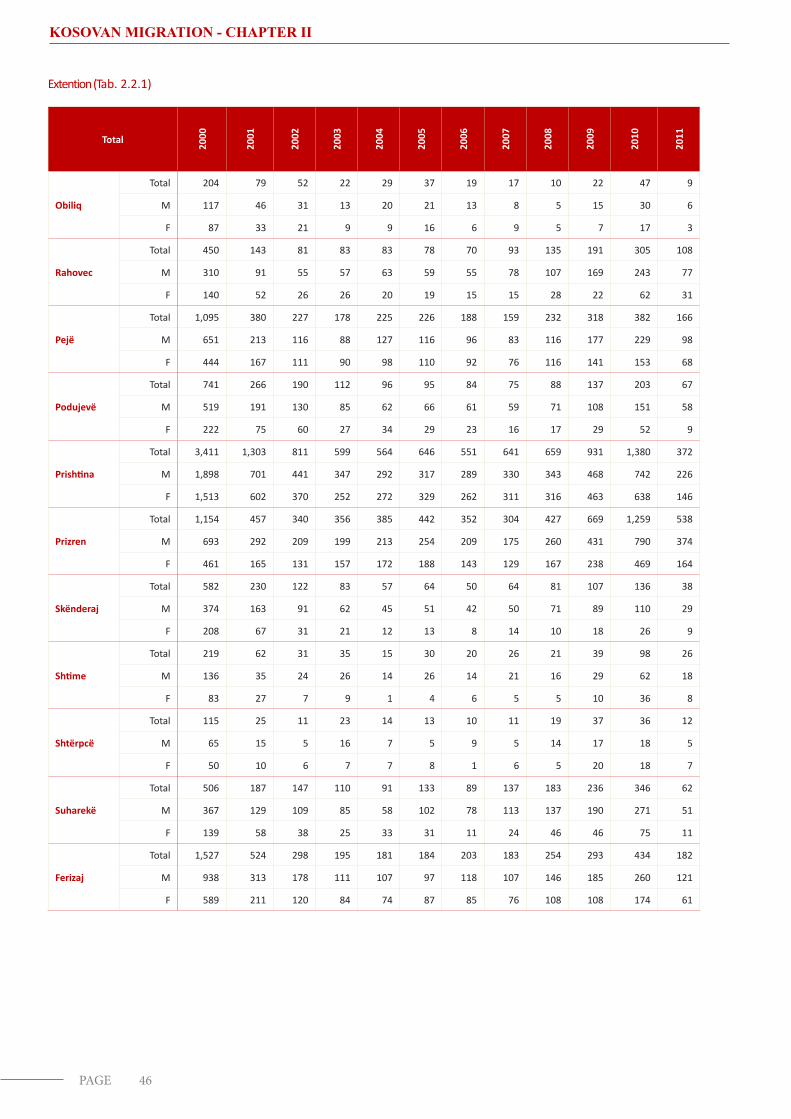
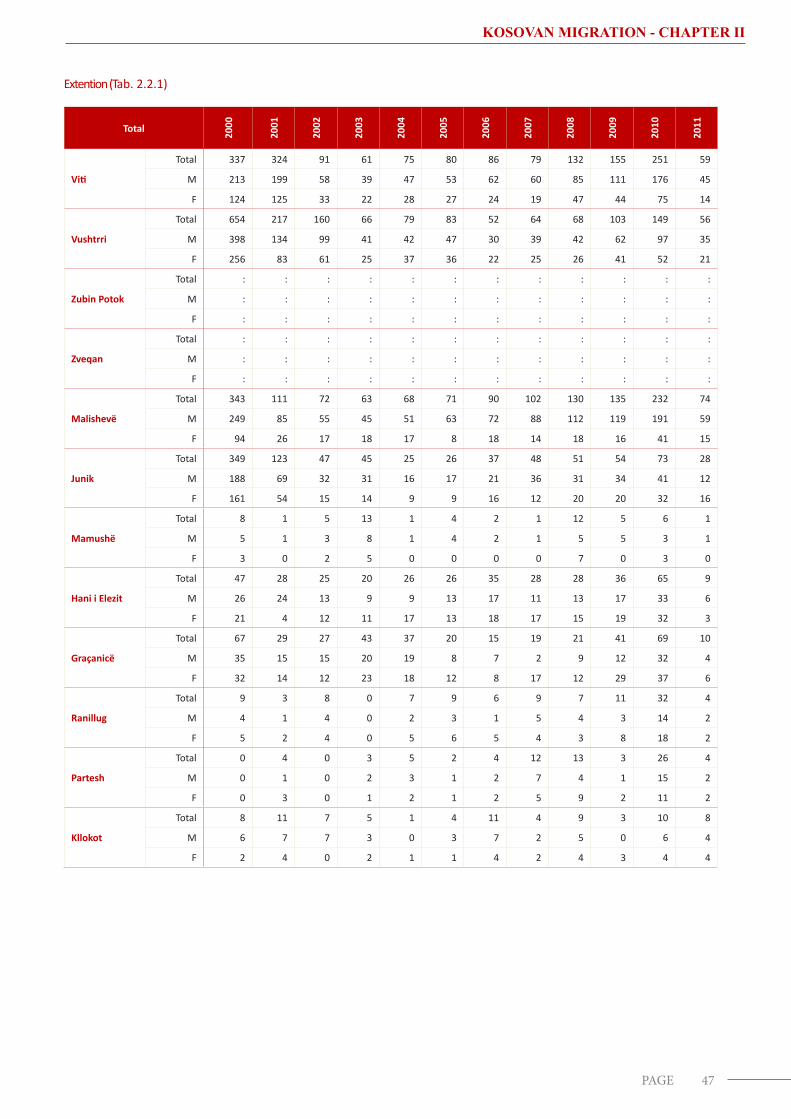
The largest number of immigrants (returned-arrived) in Kosovo was recorded in 1999 and 2000. Thus, in 1999, 15,688 residents immigrated to Kosovo, while in 2000 the largest number of immigrants ever recorded in Kosovo, 19,977 residents, was recorded. As a result of the agreement reached between Kosovo and several countries on repatriation of Kosovans, a large immigration flow was also recorded in 2010.
The lowest number of immigrants (returnees) was in 1991 and 1994, of 1.37% and 1.57% respectively.
Figure 2.10 International immigration in Kosovo by years, >1989-2011
International immigration has great influence on fluctuations in population number and on its geographic distribution. The immigration rate clearly shows the impact of these immigrations in the municipality of destination. The largest number of immigrants was concentrated in the municipalities of: Pristina, Prizren, and Gjilan, while a lower number was recorded in municipalities with a small population.
28PAGE
KOSOVAN MIGRATION - CHAPTER II
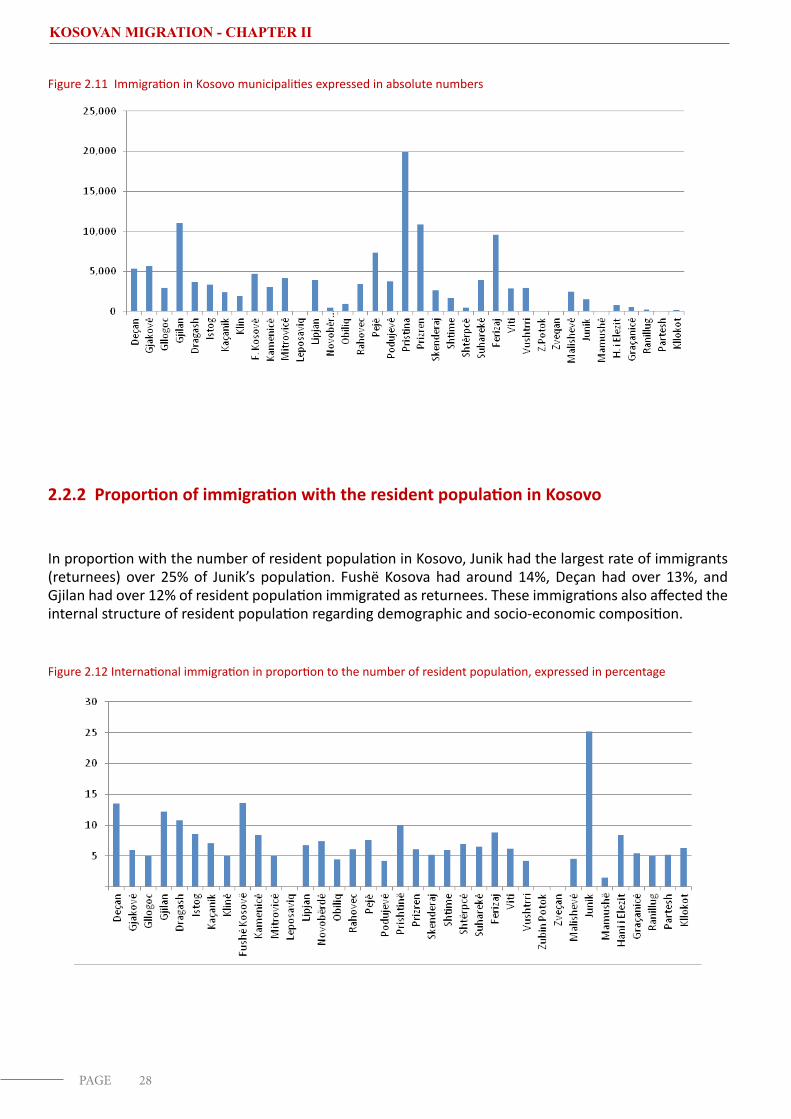
Figure 2.11 Immigration in Kosovo municipalities expressed in absolute numbers
2.2.2 Proportion of immigration with the resident population in Kosovo
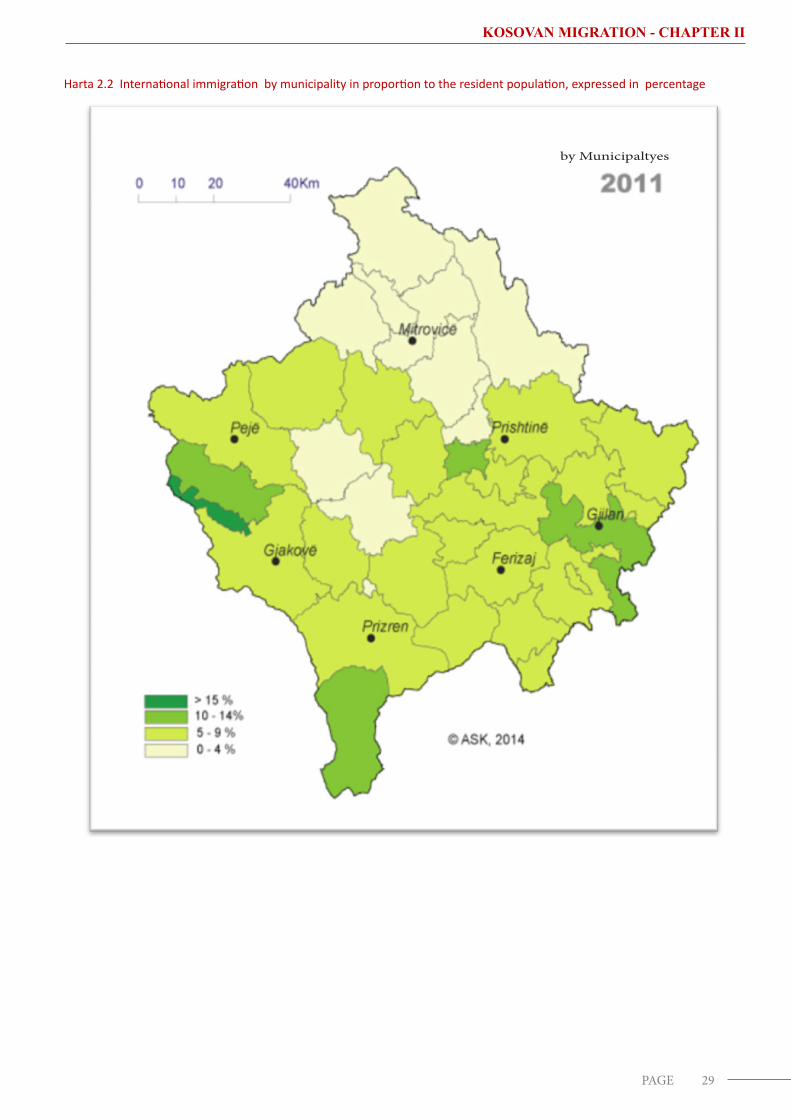
In proportion with the number of resident population in Kosovo, Junik had the largest rate of immigrants (returnees) over 25% of Junik’s population. Fushë Kosova had around 14%, Deçan had over 13%, and Gjilan had over 12% of resident population immigrated as returnees. These immigrations also affected the internal structure of resident population regarding demographic and socio-economic composition.
Figure 2.12 International immigration in proportion to the number of resident population, expressed in percentage
29PAGE
KOSOVAN MIGRATION - CHAPTER II
Harta 2.2 International immigration by municipality in proportion to the resident population, expressed in percentage
by Municipaltyes
30PAGE
KOSOVAN MIGRATION - CHAPTER II
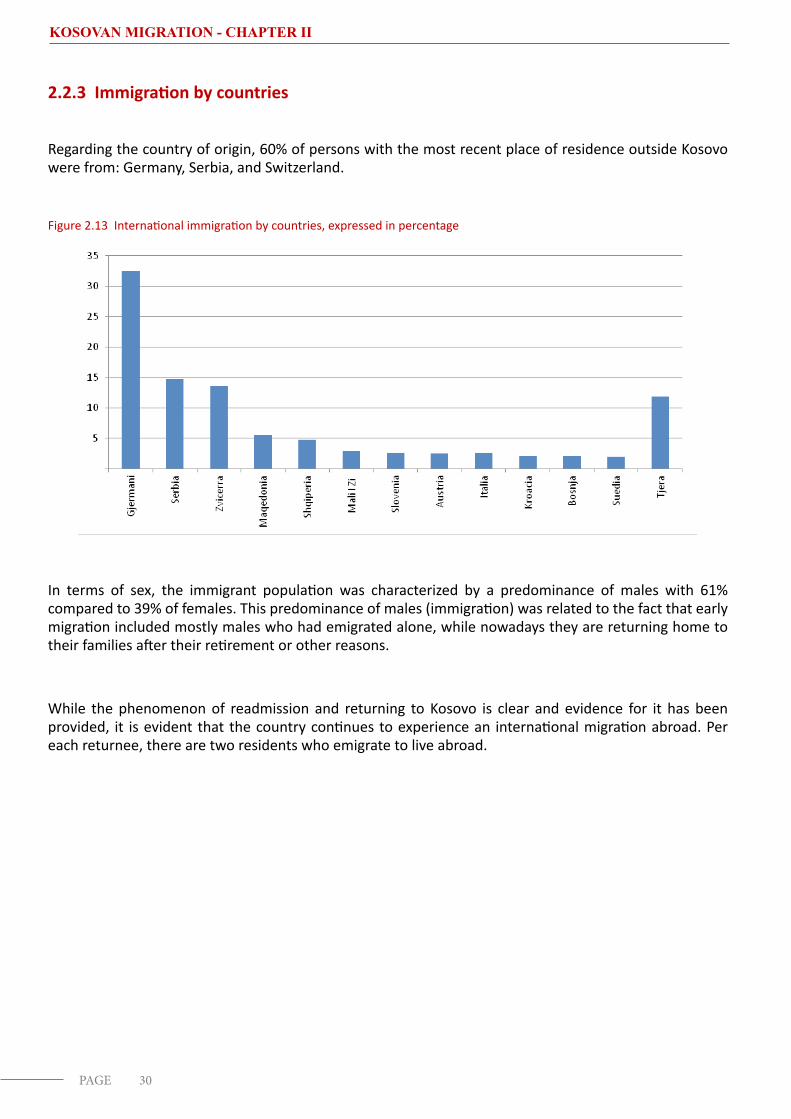
2.2.3 Immigration by countries
Regarding the country of origin, 60% of persons with the most recent place of residence outside Kosovo were from: Germany, Serbia, and Switzerland.
Figure 2.13 International immigration by countries, expressed in percentage
In terms of sex, the immigrant population was characterized by a predominance of males with 61% compared to 39% of females. This predominance of males (immigration) was related to the fact that early migration included mostly males who had emigrated alone, while nowadays they are returning home to their families after their retirement or other reasons.
While the phenomenon of readmission and returning to Kosovo is clear and evidence for it has been provided, it is evident that the country continues to experience an international migration abroad. Per each returnee, there are two residents who emigrate to live abroad.
31PAGE
KOSOVAN MIGRATION - CHAPTER II
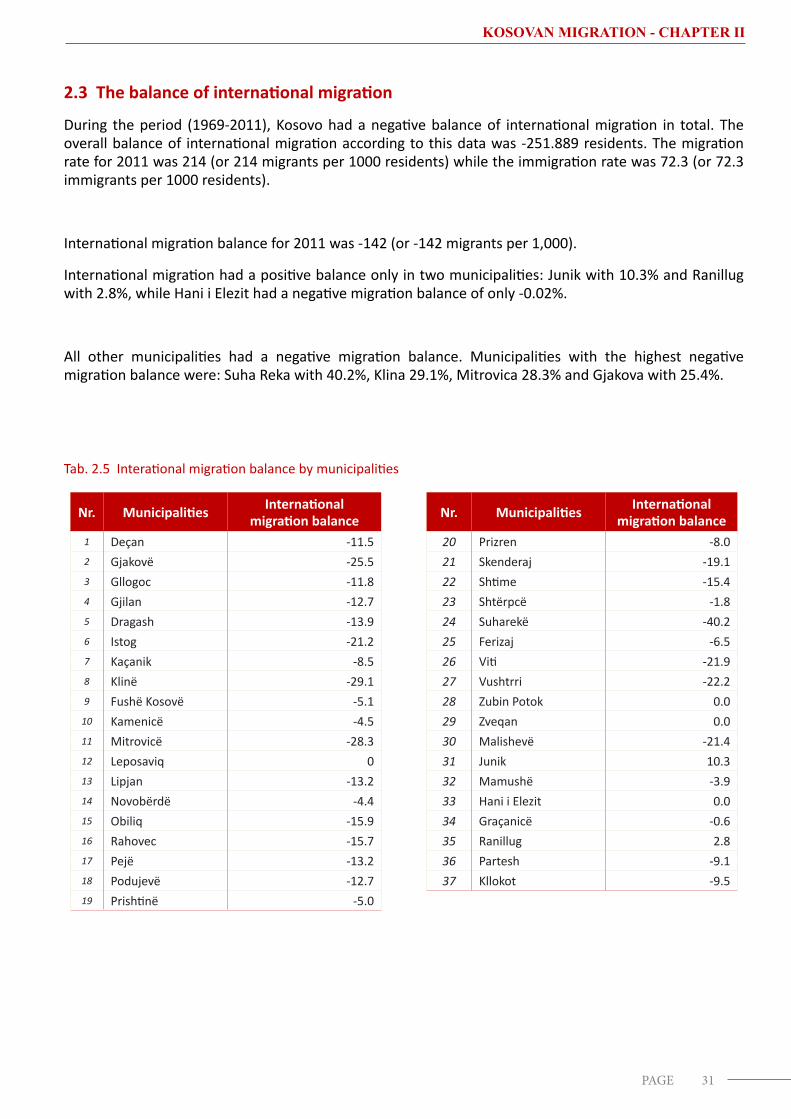
2.3 The balance of international migration
During the period (1969-2011), Kosovo had a negative balance of international migration in total. The overall balance of international migration according to this data was -251.889 residents. The migration rate for 2011 was 214 (or 214 migrants per 1000 residents) while the immigration rate was 72.3 (or 72.3 immigrants per 1000 residents).
International migration balance for 2011 was -142 (or -142 migrants per 1,000).
International migration had a positive balance only in two municipalities: Junik with 10.3% and Ranillug with 2.8%, while Hani i Elezit had a negative migration balance of only -0.02%.
All other municipalities had a negative migration balance. Municipalities with the highest negative migration balance were: Suha Reka with 40.2%, Klina 29.1%, Mitrovica 28.3% and Gjakova with 25.4%.
Tab. 2.5 Interational migration balance by municipalities
Nr. Municipalities International migration balance Nr. Municipalities International
migration balance 1 Deçan -11.5 20 Prizren -8.02 Gjakovë -25.5 21 Skenderaj -19.13 Gllogoc -11.8 22 Shtime -15.44 Gjilan -12.7 23 Shtërpcë -1.85 Dragash -13.9 24 Suharekë -40.26 Istog -21.2 25 Ferizaj -6.57 Kaçanik -8.5 26 Viti -21.98 Klinë -29.1 27 Vushtrri -22.29 Fushë Kosovë -5.1 28 Zubin Potok 0.0
10 Kamenicë -4.5 29 Zveqan 0.011 Mitrovicë -28.3 30 Malishevë -21.412 Leposaviq 0 31 Junik 10.313 Lipjan -13.2 32 Mamushë -3.914 Novobërdë -4.4 33 Hani i Elezit 0.015 Obiliq -15.9 34 Graçanicë -0.616 Rahovec -15.7 35 Ranillug 2.817 Pejë -13.2 36 Partesh -9.118 Podujevë -12.7 37 Kllokot -9.519 Prishtinë -5.0
32PAGE
KOSOVAN MIGRATION - CHAPTER II
TABLES
INTERNATIONAL MIGRATION
33PAGE
KOSOVAN MIGRATION - CHAPTER II
Tab. 2.1.1 Persons living outside Kosovo by municipality of birth, sex, place of current residenceM
unic
ipal
ities
Sex
Tota
l
Ger
man
y
Switz
erla
nd
Italy
Austi
a
Swed
en
USA
Fran
ce
Engl
and
Belg
ium
Slov
enia
Othe
r
Total
Total 380,826 134,231 87,348 27,637 21,371 19,576 13,452 12,359 10,643 7,891 6,783 39,535
M 215,797 76,188 48,005 17,032 12,106 10,654 7,651 7,076 6,115 4,578 4,571 21,821
F 165,029 58,043 39,343 10,605 9,265 8,922 5,801 5,283 4,528 3,313 2,212 17,714
Deçan
Total 9,988 4,011 3,081 94 690 361 449 220 53 268 27 734
M 5,677 2,321 1,683 54 401 192 279 128 34 159 16 410
F 4,311 1,690 1,398 40 289 169 170 92 19 109 11 324
Gjakovë
Total 29,707 7,918 13,003 602 2,192 739 1,276 521 229 794 92 2,341
M 16,611 4,525 7,075 352 1,238 409 744 302 135 451 65 1,315
F 13,096 3,393 5,928 250 954 330 532 219 94 343 27 1,026
Gllogoc
Total 9,870 4,488 588 963 674 570 274 250 372 301 347 1,043
M 5,642 2,504 311 618 374 323 134 151 233 175 227 592
F 4,228 1,984 277 345 300 247 140 99 139 126 120 451
Gjilan
Total 22,466 4,909 11,648 102 650 585 1,062 1,259 283 467 54 1,447
M 12,230 2,748 6,250 66 358 312 588 670 159 259 39 781
F 10,236 2,161 5,398 36 292 273 474 589 124 208 15 666
Dragash
Total 8,364 1,260 1,067 706 2,387 106 64 326 11 32 70 2,335
M 4,580 671 577 401 1,317 60 32 175 7 21 53 1,266
F 3,784 589 490 305 1,070 46 32 151 4 11 17 1,069
Istog
Total 11,722 4,966 1,897 673 918 561 358 525 77 622 128 997
M 6,863 2,894 1,088 431 530 316 214 313 45 379 85 568
F 4,859 2,072 809 242 388 245 144 212 32 243 43 429
Kaçanik
Total 5,184 2,137 1,139 223 133 178 357 330 169 90 14 414
M 3,006 1,284 635 137 88 100 196 194 89 51 10 222
F 2,178 853 504 86 45 78 161 136 80 39 4 192
Klinë
Total 13,140 4,216 2,807 1,947 1,066 448 687 166 115 198 379 1,111
M 7,677 2,418 1,553 1,263 625 240 413 102 74 116 259 614
F 5,463 1,798 1,254 684 441 208 274 64 41 82 120 497
Fushë Kosovë
Total 6,504 2,467 806 289 257 463 267 253 549 213 31 909
M 3,664 1,395 441 158 149 253 139 143 331 121 25 509
F 2,840 1,072 365 131 108 210 128 110 218 92 6 400
Kamenicë
Total 4,658 1,105 2,620 12 73 110 110 104 43 59 2 420
M 2,518 642 1,377 9 43 67 60 57 23 37 2 201
F 2,140 463 1,243 3 30 43 50 47 20 22 0 219
Mitrovicë
Total 27,969 12,604 1,165 549 872 5,266 413 577 898 551 96 4,978
M 15,151 6,908 632 318 479 2,832 257 311 473 298 61 2,582
F 12,818 5,696 533 231 393 2,434 156 266 425 253 35 2,396
Leposaviq
Total : : : : : : : : : : : :
M : : : : : : : : : : : :
F : : : : : : : : : : : :

34PAGE
KOSOVAN MIGRATION - CHAPTER II
Extention (Tab. 2.1.1) M
unic
ipal
ity
Sex
Tota
l
Ger
man
y
Switz
erla
nd
Italy
Austi
a
Swed
en
USA
Fran
ce
Engl
and
Belg
ium
Slov
enia
Oth
er
Lipjan
Total 11,498 4,870 1,693 895 307 646 400 390 854 218 161 1,064
M 6,577 2,816 965 541 186 327 220 237 491 126 108 560
F 4,921 2,054 728 354 121 319 180 153 363 92 53 504
Novobërdë
Total 789 191 222 6 27 44 25 37 6 22 1 208
M 448 116 120 4 15 22 13 22 3 14 1 118
F 341 75 102 2 12 22 12 15 3 8 0 90
Obiliq
Total 4,381 1,904 214 143 125 355 253 232 363 145 15 632
M 2,418 1,029 122 78 77 184 139 132 217 77 8 355
F 1,963 875 92 65 48 171 114 100 146 68 7 277
Rahovec
Total 12,241 3,879 4,615 806 1,396 158 97 166 64 70 305 685
M 7,197 2,242 2,708 529 751 90 56 100 44 45 225 407
F 5,044 1,637 1,907 277 645 68 41 66 20 25 80 278
Pejë
Total 20,048 7,660 3,850 349 1,413 1,063 1,618 516 381 591 131 2,476
M 11,605 4,449 2,158 212 818 586 1,015 313 231 343 80 1,400
F 8,443 3,211 1,692 137 595 477 603 203 150 248 51 1,076
Podujevë
Total 14,982 7,911 1,314 1,050 1,117 442 311 526 608 253 236 1,214
M 8,730 4,578 731 644 646 253 176 302 370 159 152 719
F 6,252 3,333 583 406 471 189 135 224 238 94 84 495
Prishtinë
Total 29,770 10,510 3,769 515 989 2,026 2,702 1,085 3,373 693 84 4,024
M 16,684 6,034 2,002 302 554 1,101 1,462 634 1,916 389 53 2,237
F 13,086 4,476 1,767 213 435 925 1,240 451 1,457 304 31 1,787
Prizren
Total 25,008 7,034 7,067 2,430 1,254 867 383 745 181 319 851 3,877
M 14,153 3,988 3,849 1,501 706 470 208 411 106 171 555 2,188
F 10,855 3,046 3,218 929 548 397 175 334 75 148 296 1,689
Skenderaj
Total 12,347 5,859 658 1,270 858 832 161 314 293 422 647 1,033
M 7,535 3,487 385 851 527 463 94 199 193 276 445 615
F 4,812 2,372 273 419 331 369 67 115 100 146 202 418
Shtime
Total 5,842 1,936 1,906 491 136 172 226 301 136 72 112 354
M 3,265 1,072 1,056 284 81 95 118 185 56 37 84 197
F 2,577 864 850 207 55 77 108 116 80 35 28 157
Shtërpcë
Total 609 227 196 28 13 12 14 46 12 10 1 50
M 362 137 121 15 8 7 7 30 3 6 0 28
F 247 90 75 13 5 5 7 16 9 4 1 22
Suharekë
Total 27,905 8,427 7,703 6,378 1,216 450 122 407 141 161 1,854 1,046
M 15,479 4,532 4,139 3,686 664 243 70 227 72 89 1,201 556
F 12,426 3,895 3,564 2,692 552 207 52 180 69 72 653 490
Ferizaj
Total 16,658 5,912 4,607 444 450 617 772 1,530 442 449 103 1,332
M 9,457 3,396 2,594 262 251 339 434 864 249 263 71 734
F 7,201 2,516 2,013 182 199 278 338 666 193 186 32 598
Viti
Total 13,180 3,253 5,812 820 733 177 571 619 96 153 83 863
M 7,232 1,778 3,213 466 395 96 296 350 50 87 49 452
F 5,948 1,475 2,599 354 338 81 275 269 46 66 34 411
35PAGE
KOSOVAN MIGRATION - CHAPTER II
Extention (Tab. 2.1.1) M
unic
ipal
ity
Sex
Tota
l
Ger
man
y
Switz
erla
nd
Italy
Austi
a
Swed
en
USA
Fran
ce
Engl
and
Belg
ium
Slov
enia
Oth
er
Vushtrri
Total 18,439 9,305 1,192 342 692 2,037 266 653 755 499 102 2,596
M 10,277 5,163 642 205 409 1,119 157 367 426 296 59 1,434
F 8,162 4,142 550 137 283 918 109 286 329 203 43 1,162
Zubin Potok
Total : : : : : : : : : : : :
M : : : : : : : : : : : :
F : : : : : : : : : : : :
Zveqan
Total : : : : : : : : : : : :
M : : : : : : : : : : : :
F : : : : : : : : : : : :
Malishevë
Total 14,184 4,316 1,797 5,291 600 211 123 168 103 119 815 641
M 8,864 2,508 1,072 3,522 339 116 72 105 62 77 615 376
F 5,320 1,808 725 1,769 261 95 51 63 41 42 200 265
Junik
Total 902 397 346 5 40 18 23 17 5 17 3 31
M 507 220 195 2 22 6 16 10 4 11 3 18
F 395 177 151 3 18 12 7 7 1 6 0 13
Mamushë
Total 298 76 73 43 0 7 0 15 1 0 25 58
M 175 52 43 21 0 4 0 9 1 0 13 32
F 123 24 30 22 0 3 0 6 0 0 12 26
H. Elezit
Total 791 246 69 115 10 31 47 23 10 56 0 184
M 465 150 43 66 5 18 28 11 6 30 0 108
F 326 96 26 49 5 13 19 12 4 26 0 76
Graçanicë
Total 637 141 57 50 34 8 11 24 9 20 0 283
M 341 77 32 31 21 3 7 14 6 11 0 139
F 296 64 25 19 13 5 4 10 3 9 0 144
Ranillugë
Total 87 14 31 0 3 0 0 0 0 7 0 32
M 48 8 16 0 3 0 0 0 0 4 0 17
F 39 6 15 0 0 0 0 0 0 3 0 15
Partesh
Total 254 21 137 5 6 0 1 2 0 0 14 68
M 140 9 76 2 3 0 1 2 0 0 7 40
F 114 12 61 3 3 0 0 0 0 0 7 28
Kllokot
Total 404 61 199 1 40 16 9 12 11 0 0 55
M 219 37 101 1 23 8 6 6 6 0 0 31
F 185 24 98 0 17 8 3 6 5 0 0 24
36PAGE
KOSOVAN MIGRATION - CHAPTER II
Tab. 2.1.2. Persons living outside Kosovo by municipality of birth and age-group
Municipalityof birth
Tota
l
0-4
5-9
10-1
4
15-1
9
20-2
4
25-2
9
30-3
4
35-3
9
40-4
4
45-4
9
50-5
4
55-5
9
60-6
4
65-6
9
70-7
4
75-7
9
80+
Not
ava
ilabl
e
380,826 19,209 21,878 23,352 26,587 36,372 44,106 48,411 47,393 39,913 27,181 16,269 9,833 5,913 2,823 1,252 546 333 9,455
% 100 5.04 5.74 6.13 6.98 9.55 11.58 12.71 12.44 10.48 7.14 4.27 2.58 1.55 0.74 0.33 0.14 0.09 2.48
Deçan 9,988 378 465 526 666 983 1,201 1,360 1,335 1,034 672 421 275 160 93 52 17 19 331
Gjakovë 29,707 821 1,082 1,355 2,044 3,413 3,926 3,905 3,539 2,923 2,175 1,591 1,051 566 264 136 58 43 815
Gllogoc 9,870 692 739 754 680 801 1,027 1,309 1,237 1,096 615 289 160 81 34 13 5 6 332
Gjilan 22,466 722 1,005 1,099 1,483 2,287 2,887 3,062 3,011 2,208 1,720 1,046 769 502 265 101 33 16 250
Dragash 8,364 368 467 504 617 738 801 874 882 788 596 412 306 195 151 85 30 19 531
Istog 11,722 119 236 309 589 1,143 1,521 1,834 1,831 1,483 1,023 615 356 280 130 62 35 15 141
Kaçanik 5,184 116 146 265 357 491 575 700 795 698 470 239 128 96 41 15 6 7 39
Klinë 13,140 439 510 593 889 1,345 1,673 1,894 1,727 1,351 919 524 318 231 126 55 24 19 503
F.Kosovë 6,504 65 116 216 361 705 828 952 948 908 573 363 187 76 30 28 12 2 134
Kamenicë 4,658 344 385 439 428 411 403 458 424 392 273 205 132 90 50 13 8 3 200
Mitrovicë 27,969 2,629 2,672 2,480 2,302 2,261 2,468 2,641 2,708 2,396 1,729 1,159 634 292 123 54 24 20 1,377
Leposaviq : : : : : : : : : : : : : : : : : : :
Lipjan 11,498 441 526 673 814 1,090 1,350 1,540 1,558 1,348 925 513 283 173 63 26 16 8 151
Novobërdë 789 21 23 29 48 81 94 124 89 92 80 41 24 20 8 4 3 0 8
Obiliq 4,381 325 346 348 312 354 423 499 572 537 290 149 64 25 21 7 4 3 102
Rahovec 12,241 695 720 794 942 1,318 1,605 1,631 1,398 1,095 729 409 289 183 75 19 9 2 328
Pejë 20,048 448 622 826 1,124 1,943 2,483 2,691 2,954 2,626 1,766 1,015 581 346 159 69 41 19 335
Podujevë 14,982 587 777 776 903 1,287 1,683 2,001 2,088 1,994 1,234 658 342 202 83 44 14 3 306
Prishtinë 29,770 1,061 1,353 1,484 1,840 2,500 3,311 3,864 4,134 3,539 2,533 1,532 918 509 252 111 49 36 744
Prizren 25,008 1,210 1,358 1,526 1,788 2,527 2,982 3,038 2,865 2,444 1,842 1,136 704 422 198 113 60 42 753
Skënderaj 12,347 189 320 382 644 1,304 1,771 1,991 1,930 1,575 1,011 537 284 173 64 23 10 5 134
Shtime 5,842 422 435 499 477 536 657 632 596 458 356 228 125 65 29 14 3 4 306
Shtërpcë 609 21 30 25 49 61 65 78 88 62 55 35 14 6 12 1 0 0 7
Suharekë 27,905 2,831 2,836 2,862 2,374 2,465 2,780 3,014 2,763 2,289 1,509 865 513 385 170 73 33 13 130
Ferizaj 16,658 514 716 851 1,158 1,634 2,146 2,402 2,371 1,936 1,174 682 422 243 136 37 24 11 201
Viti 13,180 1,154 1,195 1,196 1,189 1,224 1,337 1,367 1,283 1,075 737 439 276 197 86 39 6 4 376
Vushtrri 18,439 1,389 1,466 1,319 1,278 1,574 1,883 2,136 2,155 1,971 1,224 692 380 206 74 27 13 7 645
Z.Potok : : : : : : : : : : : : : : : : : : :
Zveqan : : : : : : : : : : : : : : : : : : :
Malishevë 14,184 1,071 1,138 994 974 1,570 1,829 2,011 1,658 1,232 727 333 209 126 68 18 7 5 214
Junik 902 20 25 45 71 113 115 116 115 99 64 49 28 24 1 1 0 0 16
Mamushë 298 13 16 26 20 33 58 47 32 19 9 6 9 7 1 2 0 0 0
H. Elezit 791 48 52 55 47 48 79 97 142 88 58 38 15 9 3 2 0 0 10
Graçanicë 637 11 23 37 55 63 71 69 95 89 54 19 16 10 6 4 2 2 11
Ranillug 87 10 12 11 7 4 8 12 12 6 1 1 1 0 2 0 0 0 0
Partesh 254 19 35 19 16 28 32 22 17 25 13 12 3 6 3 1 0 0 3
Kllokot 404 16 31 35 41 37 34 40 41 37 25 16 17 7 2 3 0 0 22
37PAGE
KOSOVAN MIGRATION - CHAPTER II
Tab. 2.1.3 Persons living outside Kosovo by municipality of birth, sex and years of departure
Municipality of birth
Tota
l
>196
0
60-6
4
65-6
9
70-7
4
75-7
9
80-8
4
85-8
9
90-9
4
95-9
9
2000
-04
2005
-09
2010
+
Not
ava
ilabl
e
Total
Total 380,826 388 316 964 3,599 3,220 8,424 19,860 87,346 91,008 43,985 61,586 13,780 46,350
% 100 0.1 0.08 0.25 0.95 0.85 2.21 5.21 22.94 23.9 11.55 16.17 3.62 12.17
M 215,797 251 222 768 2,909 2,243 5,543 13,053 55,735 51,259 22,396 32,399 6,485 22,534
F 165,029 137 94 196 690 977 2,881 6,807 31,611 39,749 21,589 29,187 7,295 23,816
Deçan
Total 9,988 6 13 23 114 157 264 745 2,481 2,529 919 1,510 296 931
M 5,677 4 9 17 95 104 169 498 1,594 1,365 428 809 144 441
F 4,311 2 4 6 19 53 95 247 887 1,164 491 701 152 490
Gjakovë
Total 29,707 37 28 126 375 428 1,129 2,531 7,073 7,189 3,443 4,385 969 1,994
M 16,611 25 18 111 306 327 747 1,590 4,145 3,815 1,731 2,308 477 1,011
F 13,096 12 10 15 69 101 382 941 2,928 3,374 1,712 2,077 492 983
Gllogoc
Total 9,870 4 7 9 43 36 91 274 2,000 2,417 1,055 1,599 329 2,006
M 5,642 2 4 8 35 27 64 198 1,368 1,465 530 841 139 961
F 4,228 2 3 1 8 9 27 76 632 952 525 758 190 1,045
Gjilan
Total 22,466 20 14 69 335 274 833 1,753 5,315 5,493 2,405 3,359 752 1,844
M 12,230 10 12 59 278 209 532 1,046 3,039 2,938 1,136 1,730 371 870
F 10,236 10 2 10 57 65 301 707 2,276 2,555 1,269 1,629 381 974
Dragash
Total 8,364 33 13 51 142 124 203 358 897 1,451 1,470 1,471 327 1,824
M 4,580 23 10 40 113 85 125 241 547 773 804 723 152 944
F 3,784 10 3 11 29 39 78 117 350 678 666 748 175 880
Istog
Total 11,722 18 12 67 205 159 356 925 3,285 3,078 1,137 1,747 478 255
M 6,863 8 8 54 161 92 238 623 2,120 1,719 525 961 237 117
F 4,859 10 4 13 44 67 118 302 1,165 1,359 612 786 241 138
Kaçanik
Total 5,184 4 4 18 69 51 95 263 1,250 1,598 618 866 200 148
M 3,006 1 3 15 55 36 69 191 895 858 286 427 97 73
F 2,178 3 1 3 14 15 26 72 355 740 332 439 103 75
Klinë
Total 13,140 17 15 40 168 139 357 835 2,751 3,201 1,707 2,282 525 1,103
M 7,677 12 12 30 130 94 242 528 1,752 1,874 953 1,289 257 504
F 5,463 5 3 10 38 45 115 307 999 1,327 754 993 268 599
F.Kosovë
Total 6,504 1 2 7 34 24 83 253 2,138 2,069 720 861 180 132
M 3,664 1 2 5 28 15 54 162 1,364 1,153 312 421 78 69
F 2,840 0 0 2 6 9 29 91 774 916 408 440 102 63
Kamenicë
Total 4,658 6 17 10 58 61 180 307 857 761 375 372 89 1,565
M 2,518 4 10 7 45 42 112 196 499 419 177 190 40 777
F 2,140 2 7 3 13 19 68 111 358 342 198 182 49 788
Mitrovicë
Total 27,969 22 7 20 94 60 221 683 8,178 4,146 1,698 2,399 540 9,901
M 15,151 10 4 10 64 35 144 460 5,104 2,396 758 1,237 242 4,687
F 12,818 12 3 10 30 25 77 223 3,074 1,750 940 1,162 298 5,214
Leposaviq
Total : : : : : : : : : : : : : :
M : : : : : : : : : : : : : :
F : : : : : : : : : : : : : :

38PAGE
KOSOVAN MIGRATION - CHAPTER II
Extention (Tab. 2.1.3)
Municipality of birth
Tota
l
>196
0
60-6
4
65-6
9
70-7
4
75-7
9
80-8
4
85-8
9
90-9
4
95-9
9
2000
-04
2005
-09
2010
+
Not
ava
ilabl
e
Lipjan
Total 11,498 13 13 25 113 71 216 486 3,060 3,024 1,264 1,783 374 1,056
M 6,577 10 7 20 98 48 138 336 2,006 1,767 599 861 172 515
F 4,921 3 6 5 15 23 78 150 1,054 1,257 665 922 202 541
Novobërdë
Total 789 2 0 2 16 9 29 45 185 219 87 143 23 29
M 448 1 0 1 12 7 17 27 117 111 51 77 14 13
F 341 1 0 1 4 2 12 18 68 108 36 66 9 16
Obiliq
Total 4,381 1 0 2 12 12 23 111 1,082 1,241 331 504 120 942
M 2,418 1 0 1 8 9 9 69 719 729 130 238 61 444
F 1,963 0 0 1 4 3 14 42 363 512 201 266 59 498
Rahovec
Total 12,241 10 3 23 118 112 224 648 2,102 2,732 1,805 2,635 574 1,255
M 7,197 7 3 20 102 95 184 483 1,400 1,571 1,000 1,439 273 620
F 5,044 3 0 3 16 17 40 165 702 1,161 805 1,196 301 635
Pejë
Total 20,048 22 12 69 222 198 611 1,740 5,633 4,967 2,123 2,762 577 1,112
M 11,605 16 10 55 169 125 374 1,160 3,631 2,750 1,039 1,477 263 536
F 8,443 6 2 14 53 73 237 580 2,002 2,217 1,084 1,285 314 576
Podujevë
Total 14,982 3 12 24 112 64 242 499 3,844 3,839 1,915 2,653 536 1,239
M 8,730 2 10 21 103 47 170 361 2,652 2,263 894 1,353 237 617
F 6,252 1 2 3 9 17 72 138 1,192 1,576 1,021 1,300 299 622
Prishtinë
Total 29,770 57 31 60 183 142 495 1,308 8,473 8,735 2,504 3,483 899 3,400
M 16,684 41 26 47 135 85 296 815 5,403 4,940 1,095 1,691 404 1,706
F 13,086 16 5 13 48 57 199 493 3,070 3,795 1,409 1,792 495 1,694
Prizren
Total 25,008 28 20 72 262 295 740 1,569 4,984 5,940 3,200 4,015 1,035 2,848
M 14,153 19 12 59 204 202 469 1,010 3,046 3,283 1,732 2,197 516 1,404
F 10,855 9 8 13 58 93 271 559 1,938 2,657 1,468 1,818 519 1,444
Skënderaj
Total 12,347 12 10 18 103 72 218 419 3,124 3,445 1,524 2,621 517 264
M 7,535 9 9 15 87 54 157 286 2,180 2,078 820 1,468 240 132
F 4,812 3 1 3 16 18 61 133 944 1,367 704 1,153 277 132
Shtime
Total 5,842 7 6 3 45 39 138 233 879 1,313 626 1,049 220 1,284
M 3,265 6 4 1 39 29 95 161 586 720 316 586 104 618
F 2,577 1 2 2 6 10 43 72 293 593 310 463 116 666
Shtërpcë
Total 609 0 0 4 7 7 15 60 124 177 63 106 29 17
M 362 0 0 4 6 4 11 38 92 103 29 57 11 7
F 247 0 0 0 1 3 4 22 32 74 34 49 18 10
Suharekë
Total 27,905 21 38 106 289 289 630 1,227 4,083 6,449 5,085 7,070 1,610 1,008
M 15,479 9 26 78 225 184 417 845 2,590 3,524 2,782 3,570 749 480
F 12,426 12 12 28 64 105 213 382 1,493 2,925 2,303 3,500 861 528
Ferizaj
Total 16,658 11 5 52 150 124 344 863 3,620 4,883 1,960 3,043 718 885
M 9,457 9 3 38 128 88 223 561 2,360 2,684 976 1,606 363 418
F 7,201 2 2 14 22 36 121 302 1,260 2,199 984 1,437 355 467
39PAGE
KOSOVAN MIGRATION - CHAPTER II
Extention (Tab. 2.1.3)
Municipality of birth
Tota
l
>196
0
60-6
4
65-6
9
70-7
4
75-7
9
80-8
4
85-8
9
90-9
4
95-9
9
2000
-04
2005
-09
2010
+
Not
ava
ilabl
e
Viti
Total 13,180 5 10 20 116 87 266 630 2,137 2,721 1,419 1,949 442 3,378
M 7,232 3 4 15 94 64 187 424 1,360 1,487 703 1,035 211 1,645
F 5,948 2 6 5 22 23 79 206 777 1,234 716 914 231 1,733
Vushtrri
Total 18,439 17 13 18 71 63 183 569 5,552 3,745 1,582 2,307 493 3,826
M 10,277 10 8 15 59 40 118 369 3,582 2,159 675 1,157 225 1,860
F 8,162 7 5 3 12 23 65 200 1,970 1,586 907 1,150 268 1,966
Z.Potok
Total : : : : : : : : : : : : : :
M : : : : : : : : : : : : : :
F : : : : : : : : : : : : : :
Zveqan
Total : : : : : : : : : : : : : :
M : : : : : : : : : : : : : :
F : : : : : : : : : : : : : :
Malishevë
Total 14,184 7 9 21 110 88 164 355 1,615 2,715 2,471 4,072 805 1,752
M 8,864 6 8 19 101 73 131 266 1,179 1,788 1,669 2,381 354 889
F 5,320 1 1 2 9 15 33 89 436 927 802 1,691 451 863
Junik
Total 902 0 0 0 14 14 32 75 229 238 96 109 33 62
M 507 0 0 0 13 9 21 47 142 132 48 54 14 27
F 395 0 0 0 1 5 11 28 87 106 48 55 19 35
Mamushë
Total 298 2 1 0 1 7 2 14 32 86 75 54 19 5
M 175 1 0 0 1 4 2 8 19 59 44 27 6 4
F 123 1 1 0 0 3 0 6 13 27 31 27 13 1
H.i Elezit
Total 791 0 1 3 2 4 11 37 160 212 94 125 30 112
M 465 0 0 2 2 2 7 29 119 130 50 58 12 54
F 326 0 1 1 0 2 4 8 41 82 44 67 18 58
Graçanicë
Total 637 0 0 1 4 2 3 12 130 231 84 120 27 23
M 341 0 0 1 2 2 1 6 81 122 42 59 16 9
F 296 0 0 0 2 0 2 6 49 109 42 61 11 14
Ranillug
Total 87 0 0 0 1 0 0 2 7 15 19 9 2 32
M 48 0 0 0 1 0 0 1 3 9 11 6 1 16
F 39 0 0 0 0 0 0 1 4 6 8 3 1 16
Partesh
Total 254 2 0 0 4 3 12 8 17 50 65 54 4 35
M 140 1 0 0 4 1 8 6 10 22 35 29 2 22
F 114 1 0 0 0 2 4 2 7 28 30 25 2 13
Kllokot
Total 404 0 0 1 7 5 14 23 49 99 46 69 8 83
M 219 0 0 0 6 5 12 12 31 53 16 37 3 44
F 185 0 0 1 1 0 2 11 18 46 30 32 5 39

40PAGE
KOSOVAN MIGRATION - CHAPTER II
Tab. 2.1.4 Persons living outside Kosovo by municipality and reasons for leaving
Municipalities Total Employemnt Studies Family War 1998/99 Other There is no data
Total 380,826 134,974 4,205 173,939 29,040 14,212 24,456
Deçan 9,988 3,299 86 4,696 930 572 405
Gjakovë 29,707 10,268 301 15,871 1,557 925 785
Gllogoc 9,870 3,535 119 4,313 778 277 848
Gjilan 22,466 7,798 213 11,194 1,881 500 880
Dragash 8,364 2,978 250 3,991 357 251 537
Istog 11,722 5,040 83 5,136 993 372 98
Kaçanik 5,184 2,014 26 2,289 643 154 58
Klinë 13,140 5,343 98 6,136 992 196 375
Fushë Kosovë 6,504 2,358 88 2,599 1,042 348 69
Kamenicë 4,658 1,368 38 2,221 173 128 730
Mitrovicë 27,969 8,273 165 8,303 1,527 2,151 7,550
Leposaviq : : : : : : :
Lipjan 11,498 4,486 103 5,015 1,088 421 385
Novobërdë 789 369 29 286 73 18 14
Obiliq 4,381 1,210 32 1,498 751 297 593
Rahovec 12,241 4,648 93 6,325 513 121 541
Pejë 20,048 8,255 266 8,451 1,726 951 399
Podujevë 14,982 5,906 173 7,147 863 421 472
Prishtinë 29,770 9,015 712 10,828 4,876 2,116 2,223
Prizren 25,008 9,363 550 11,369 1,583 595 1,548
Skenderaj 12,347 5,706 102 5,098 948 316 177
Shtime 5,842 2,211 62 2,534 429 127 479
Shtërpcë 609 211 2 330 50 6 10
Suharekë 27,905 7,563 87 18,510 544 393 808
Ferizaj 16,658 6,535 128 6,917 2,015 636 427
Viti 13,180 4,378 81 6,636 693 306 1,086
Vushtrri 18,439 5,693 159 7,794 1,225 1,427 2,141
Zubin Potok : : : : : : :
Zveqan : : : : : : :
Malishevë 14,184 6,032 83 7,079 337 59 594
Junik 902 255 4 493 105 27 18
Mamushë 298 90 17 142 45 3 1
Hani i Elezit 791 304 7 301 83 7 89
Graçanicë 637 194 36 201 134 63 9
Ranillug 87 24 3 22 9 0 29
Partesh 254 102 6 73 23 14 36
Kllokot 404 150 3 141 54 14 42
41PAGE
KOSOVAN MIGRATION - CHAPTER II
TABLES
INTERNATIONAL IMMIGRATION
42PAGE
KOSOVAN MIGRATION - CHAPTER II
Tab. 2.2.1 International immigration by years 1989-2011
TotalTotal
>198
9
1990
1991
1992
1993
1994
1995
1996
1997
1998
1999
128,808 19,543 2,048 1,768 2,422 2,542 2,025 2,197 2,127 2,562 5,541 15,688
M 79,187 11,048 1,403 1,233 1,661 1,782 1,382 1,484 1,511 1,888 3,572 9,266
F 49,621 8,495 645 535 761 760 643 713 616 674 1,969 6,422
Deçan
Total 5,383 417 96 96 83 70 68 62 68 86 1,254 1,311
M 3,259 308 66 70 65 47 46 43 48 64 672 722
F 2,124 109 30 26 18 23 22 19 20 22 582 589
Gjakovë
Total 5,635 900 104 80 115 102 88 81 75 101 185 603
M 3,499 544 74 58 80 81 65 68 58 78 125 335
F 2,136 356 30 22 35 21 23 13 17 23 60 268
Gllogoc
Total 2,972 421 47 40 67 89 58 60 65 74 140 202
M 2,171 337 43 35 54 71 44 46 54 65 109 143
F 801 84 4 5 13 18 14 14 11 9 31 59
Gjilan
Total 11,016 2,650 203 148 183 160 170 215 236 248 256 1,733
M 5,960 1,285 104 82 99 91 84 117 131 148 158 991
F 5,056 1,365 99 66 84 69 86 98 105 100 98 742
Dragash
Total 3,645 436 82 55 74 51 56 84 52 85 103 269
M 2,402 325 57 40 52 35 44 52 42 62 81 190
F 1,243 111 25 15 22 16 12 32 10 23 22 79
Istog
Total 3,387 612 50 49 88 47 57 55 54 58 90 189
M 2,120 351 39 38 62 34 37 33 44 50 61 113
F 1,267 261 11 11 26 13 20 22 10 8 29 76
Kaçanik
Total 2,351 421 36 37 59 74 63 49 46 62 55 171
M 1,447 185 24 23 42 58 47 30 33 46 44 115
F 904 236 12 14 17 16 16 19 13 16 11 56
Klinë
Total 1,949 311 31 28 41 33 27 33 31 49 167 163
M 1,346 233 24 23 28 30 25 26 24 41 106 108
F 603 78 7 5 13 3 2 7 7 8 61 55
F. Kosovë
Total 4,725 346 22 21 36 74 27 36 33 38 116 1,034
M 2,647 189 13 13 22 47 16 19 23 25 67 586
F 2,078 157 9 8 14 27 11 17 10 13 49 448
Kamenicë
Total 3,025 1,046 90 56 89 57 50 60 53 67 81 133
M 1,475 406 51 30 45 27 26 31 30 31 43 72
F 1,550 640 39 26 44 30 24 29 23 36 38 61
Mitrovicë
Total 4,162 351 41 77 138 161 76 69 54 81 174 380
M 2,558 171 30 49 97 103 54 43 32 66 120 221
F 1,604 180 11 28 41 58 22 26 22 15 54 159
Leposaviq
Total : : : : : : : : : : : :
M : : : : : : : : : : : :
F : : : : : : : : : : : :
Lipjan
Total 3,883 421 75 69 110 126 99 96 94 137 203 370
M 2,693 289 61 60 91 95 70 74 73 106 154 243
F 1,190 132 14 9 19 31 29 22 21 31 49 127
Novobërdë
Total 496 62 3 5 4 3 10 1 9 9 15 68
M 290 23 1 4 4 3 6 1 5 4 8 45
F 206 39 2 1 0 0 4 0 4 5 7 23

43PAGE
KOSOVAN MIGRATION - CHAPTER II
Extention (Tab. 2.2.1)
Total Total
>198
9
1990
1991
1992
1993
1994
1995
1996
1997
1998
1999
Obiliq
Total 945 86 6 14 18 48 7 17 17 27 38 120
M 575 42 4 12 14 31 4 11 10 22 28 72
F 370 44 2 2 4 17 3 6 7 5 10 48
Rahovec
Total 3,431 418 66 53 87 89 73 76 93 97 233 326
M 2,579 353 57 44 66 73 60 59 75 79 141 208
F 852 65 9 9 21 16 13 17 18 18 92 118
Pejë
Total 7,337 1,632 154 147 152 83 106 87 98 94 293 715
M 3,985 744 94 84 94 45 58 42 66 53 188 407
F 3,352 888 60 63 58 38 48 45 32 41 105 308
Podujevë
Total 3,734 461 64 53 73 96 77 86 79 135 206 250
M 2,817 348 52 48 59 82 68 72 66 105 160 196
F 917 113 12 5 14 14 9 14 13 30 46 54
Prishtina
Total 19,872 3,056 213 145 218 276 216 236 253 275 320 2,796
M 10,741 1,539 118 90 129 163 120 150 143 164 205 1,526
F 9,131 1,517 95 55 89 113 96 86 110 111 115 1,270
Prizren
Total 10,845 1,529 196 148 205 191 168 192 186 180 345 822
M 6,772 869 141 106 139 134 120 132 140 139 230 523
F 4,073 660 55 42 66 57 48 60 46 41 115 299
Skënderaj
Total 2,634 341 25 31 45 89 48 65 48 73 134 121
M 2,013 272 22 29 38 78 39 43 41 61 109 104
F 621 69 3 2 7 11 9 22 7 12 25 17
Shtime
Total 1,640 206 25 34 24 36 38 50 31 44 297 233
M 1,097 140 21 28 17 26 30 38 24 35 170 147
F 543 66 4 6 7 10 8 12 7 9 127 86
Shtërpcë
Total 483 52 5 12 6 7 8 20 13 3 3 28
M 257 18 2 5 4 5 5 11 5 3 1 17
F 226 34 3 7 2 2 3 9 8 0 2 11
Suharekë
Total 3,873 629 64 63 70 80 80 71 78 104 134 273
M 3,059 533 57 55 64 61 73 64 70 95 111 186
F 814 96 7 8 6 19 7 7 8 9 23 87
Ferizaj
Total 9,603 1,156 173 148 175 249 177 170 145 195 353 2,204
M 5,856 682 119 95 116 172 114 113 114 149 233 1,268
F 3,747 474 54 53 59 77 63 57 31 46 120 936
44PAGE
KOSOVAN MIGRATION - CHAPTER II
Extention (Tab. 2.2.1)
Total Total
>198
9
1990
1991
1992
1993
1994
1995
1996
1997
1998
1999
Viti
Total 2,902 516 53 41 53 40 39 50 55 50 64 211
M 1,886 281 36 25 34 29 31 35 39 41 44 143
F 1,016 235 17 16 19 11 8 15 16 9 20 68
Vushtrri
Total 2,962 244 37 41 90 119 73 77 63 77 117 273
M 1,861 130 29 32 63 90 48 53 45 62 82 161
F 1,101 114 8 9 27 29 25 24 18 15 35 112
Z. Potok
Total : : : : : : : : : : : :
M : : : : : : : : : : : :
F : : : : : : : : : : : :
Zveqan
Total : : : : : : : : : : : :
M : : : : : : : : : : : :
F : : : : : : : : : : : :
Malishevë
Total 2,493 359 45 36 66 50 42 55 60 80 73 136
M 2,053 284 43 34 56 46 37 53 56 74 63 118
F 440 75 2 2 10 4 5 2 4 6 10 18
Junik
Total 1,529 60 5 3 5 15 6 5 2 15 51 456
M 900 45 5 1 5 9 5 4 2 10 36 250
F 629 15 0 2 0 6 1 1 0 5 15 206
Mamushë
Total 84 11 0 2 3 1 0 1 3 4 0 0
M 58 10 0 1 1 1 0 1 3 2 0 0
F 26 1 0 1 2 0 0 0 0 2 0 0
H.i Elezit
Total 789 249 22 21 24 15 14 12 6 5 19 29
M 334 57 9 9 10 10 4 7 4 4 13 16
F 455 192 13 12 14 5 10 5 2 1 6 13
Graçanicë
Total 576 62 5 11 5 3 0 13 16 3 3 57
M 267 27 2 8 2 2 0 6 6 1 2 33
F 309 35 3 3 3 1 0 7 10 2 1 24
Ranillug
Total 195 47 4 1 5 4 2 8 8 2 5 4
M 68 12 1 0 1 1 1 5 3 1 0 0
F 127 35 3 1 4 3 1 3 5 1 5 4
Partesh
Total 92 5 0 0 3 0 0 3 2 1 0 2
M 44 1 0 0 2 0 0 0 1 0 0 2
F 48 4 0 0 1 0 0 3 1 1 0 0
Kllokot
Total 160 30 6 3 8 4 2 2 1 3 14 6
M 98 15 4 2 6 2 1 2 1 2 8 5
F 62 15 2 1 2 2 1 0 0 1 6 1
45PAGE
KOSOVAN MIGRATION - CHAPTER II
Extention (Tab. 2.2.1)
Total 2000
2001
2002
2003
2004
2005
2006
2007
2008
2009
2010
2011
19,977 7,445 4,481 3,370 3,318 3,607 3,113 3,312 4,026 5,722 8,986 2,988
M 12,080 4,504 2,674 2,046 1,901 2,117 1,898 2,024 2,496 3,606 5,620 1,991
F 7,897 2,941 1,807 1,324 1,417 1,490 1,215 1,288 1,530 2,116 3,366 997
Deçan
Total 516 205 115 90 84 102 64 73 96 163 215 49
M 314 125 75 51 52 65 41 42 67 113 133 30
F 202 80 40 39 32 37 23 31 29 50 82 19
Gjakovë
Total 930 366 186 125 171 157 157 140 180 296 402 91
M 555 222 102 73 90 85 96 92 113 187 255 63
F 375 144 84 52 81 72 61 48 67 109 147 28
Gllogoc
Total 384 148 113 74 67 82 72 54 80 133 321 181
M 262 102 68 56 42 57 55 44 61 89 199 135
F 122 46 45 18 25 25 17 10 19 44 122 46
Gjilan
Total 1,705 561 358 268 222 251 198 212 263 299 417 60
M 963 309 192 145 108 135 101 112 140 166 255 44
F 742 252 166 123 114 116 97 100 123 133 162 16
Dragash
Total 267 116 103 115 115 112 152 162 131 226 459 340
M 183 78 61 75 72 67 95 103 82 146 266 194
F 84 38 42 40 43 45 57 59 49 80 193 146
Istog
Total 547 193 149 101 87 111 81 96 119 164 307 83
M 340 119 95 62 54 73 53 55 77 103 177 50
F 207 74 54 39 33 38 28 41 42 61 130 33
Kaçanik
Total 389 126 92 38 67 61 37 63 68 120 194 23
M 245 80 55 27 39 29 21 41 36 80 129 18
F 144 46 37 11 28 32 16 22 32 40 65 5
Klinë
Total 253 101 57 45 66 47 72 64 66 96 105 63
M 162 70 34 28 48 31 46 44 50 61 65 39
F 91 31 23 17 18 16 26 20 16 35 40 24
Fushë Kosovë
Total 1,205 391 193 113 135 138 92 132 135 194 168 46
M 654 219 106 57 73 81 56 71 77 104 99 30
F 551 172 87 56 62 57 36 61 58 90 69 16
Kamenicë
Total 243 83 58 67 63 72 66 73 85 124 267 42
M 139 51 27 33 27 37 30 38 40 72 162 27
F 104 32 31 34 36 35 36 35 45 52 105 15
Mitrovicë
Total 1,083 356 165 110 81 76 58 57 96 158 247 73
M 661 202 97 74 45 48 40 32 66 99 156 52
F 422 154 68 36 36 28 18 25 30 59 91 21
Leposaviq
Total : : : : : : : : : : : :
M : : : : : : : : : : : :
F : : : : : : : : : : : :
Lipjan
Total 566 270 119 80 76 89 59 99 116 197 317 95
M 370 188 78 59 42 58 42 64 84 127 196 69
F 196 82 41 21 34 31 17 35 32 70 121 26
Novobërdë
Total 63 22 21 29 20 36 31 11 11 26 28 9
M 40 14 9 19 11 25 17 6 7 17 14 7
F 23 8 12 10 9 11 14 5 4 9 14 2
46PAGE
KOSOVAN MIGRATION - CHAPTER II
Extention (Tab. 2.2.1)
Total
2000
2001
2002
2003
2004
2005
2006
2007
2008
2009
2010
2011
Obiliq
Total 204 79 52 22 29 37 19 17 10 22 47 9
M 117 46 31 13 20 21 13 8 5 15 30 6
F 87 33 21 9 9 16 6 9 5 7 17 3
Rahovec
Total 450 143 81 83 83 78 70 93 135 191 305 108
M 310 91 55 57 63 59 55 78 107 169 243 77
F 140 52 26 26 20 19 15 15 28 22 62 31
Pejë
Total 1,095 380 227 178 225 226 188 159 232 318 382 166
M 651 213 116 88 127 116 96 83 116 177 229 98
F 444 167 111 90 98 110 92 76 116 141 153 68
Podujevë
Total 741 266 190 112 96 95 84 75 88 137 203 67
M 519 191 130 85 62 66 61 59 71 108 151 58
F 222 75 60 27 34 29 23 16 17 29 52 9
Prishtina
Total 3,411 1,303 811 599 564 646 551 641 659 931 1,380 372
M 1,898 701 441 347 292 317 289 330 343 468 742 226
F 1,513 602 370 252 272 329 262 311 316 463 638 146
Prizren
Total 1,154 457 340 356 385 442 352 304 427 669 1,259 538
M 693 292 209 199 213 254 209 175 260 431 790 374
F 461 165 131 157 172 188 143 129 167 238 469 164
Skënderaj
Total 582 230 122 83 57 64 50 64 81 107 136 38
M 374 163 91 62 45 51 42 50 71 89 110 29
F 208 67 31 21 12 13 8 14 10 18 26 9
Shtime
Total 219 62 31 35 15 30 20 26 21 39 98 26
M 136 35 24 26 14 26 14 21 16 29 62 18
F 83 27 7 9 1 4 6 5 5 10 36 8
Shtërpcë
Total 115 25 11 23 14 13 10 11 19 37 36 12
M 65 15 5 16 7 5 9 5 14 17 18 5
F 50 10 6 7 7 8 1 6 5 20 18 7
Suharekë
Total 506 187 147 110 91 133 89 137 183 236 346 62
M 367 129 109 85 58 102 78 113 137 190 271 51
F 139 58 38 25 33 31 11 24 46 46 75 11
Ferizaj
Total 1,527 524 298 195 181 184 203 183 254 293 434 182
M 938 313 178 111 107 97 118 107 146 185 260 121
F 589 211 120 84 74 87 85 76 108 108 174 61
47PAGE
KOSOVAN MIGRATION - CHAPTER II
Extention (Tab. 2.2.1)
Total
2000
2001
2002
2003
2004
2005
2006
2007
2008
2009
2010
2011
Viti
Total 337 324 91 61 75 80 86 79 132 155 251 59
M 213 199 58 39 47 53 62 60 85 111 176 45
F 124 125 33 22 28 27 24 19 47 44 75 14
Vushtrri
Total 654 217 160 66 79 83 52 64 68 103 149 56
M 398 134 99 41 42 47 30 39 42 62 97 35
F 256 83 61 25 37 36 22 25 26 41 52 21
Zubin Potok
Total : : : : : : : : : : : :
M : : : : : : : : : : : :
F : : : : : : : : : : : :
Zveqan
Total : : : : : : : : : : : :
M : : : : : : : : : : : :
F : : : : : : : : : : : :
Malishevë
Total 343 111 72 63 68 71 90 102 130 135 232 74
M 249 85 55 45 51 63 72 88 112 119 191 59
F 94 26 17 18 17 8 18 14 18 16 41 15
Junik
Total 349 123 47 45 25 26 37 48 51 54 73 28
M 188 69 32 31 16 17 21 36 31 34 41 12
F 161 54 15 14 9 9 16 12 20 20 32 16
Mamushë
Total 8 1 5 13 1 4 2 1 12 5 6 1
M 5 1 3 8 1 4 2 1 5 5 3 1
F 3 0 2 5 0 0 0 0 7 0 3 0
Hani i Elezit
Total 47 28 25 20 26 26 35 28 28 36 65 9
M 26 24 13 9 9 13 17 11 13 17 33 6
F 21 4 12 11 17 13 18 17 15 19 32 3
Graçanicë
Total 67 29 27 43 37 20 15 19 21 41 69 10
M 35 15 15 20 19 8 7 2 9 12 32 4
F 32 14 12 23 18 12 8 17 12 29 37 6
Ranillug
Total 9 3 8 0 7 9 6 9 7 11 32 4
M 4 1 4 0 2 3 1 5 4 3 14 2
F 5 2 4 0 5 6 5 4 3 8 18 2
Partesh
Total 0 4 0 3 5 2 4 12 13 3 26 4
M 0 1 0 2 3 1 2 7 4 1 15 2
F 0 3 0 1 2 1 2 5 9 2 11 2
Kllokot
Total 8 11 7 5 1 4 11 4 9 3 10 8
M 6 7 7 3 0 3 7 2 5 0 6 4
F 2 4 0 2 1 1 4 2 4 3 4 4
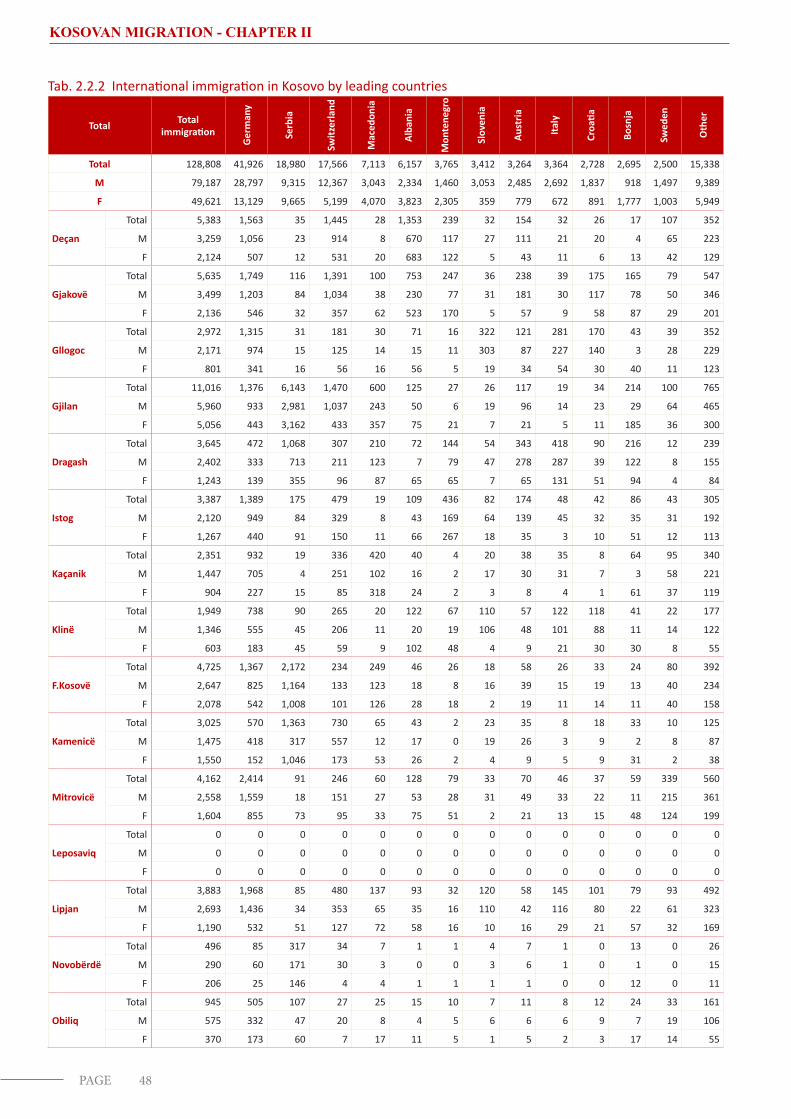
48PAGE
KOSOVAN MIGRATION - CHAPTER II
Tab. 2.2.2 International immigration in Kosovo by leading countries
Total Total immigration
Ger
man
y
Serb
ia
Switz
erla
nd
Mac
edon
ia
Alba
nia
Mon
tene
gro
Slov
enia
Aust
ria
Italy
Croa
tia
Bosn
ja
Swed
en
Oth
er
Total 128,808 41,926 18,980 17,566 7,113 6,157 3,765 3,412 3,264 3,364 2,728 2,695 2,500 15,338
M 79,187 28,797 9,315 12,367 3,043 2,334 1,460 3,053 2,485 2,692 1,837 918 1,497 9,389
F 49,621 13,129 9,665 5,199 4,070 3,823 2,305 359 779 672 891 1,777 1,003 5,949
Deçan
Total 5,383 1,563 35 1,445 28 1,353 239 32 154 32 26 17 107 352
M 3,259 1,056 23 914 8 670 117 27 111 21 20 4 65 223
F 2,124 507 12 531 20 683 122 5 43 11 6 13 42 129
Gjakovë
Total 5,635 1,749 116 1,391 100 753 247 36 238 39 175 165 79 547
M 3,499 1,203 84 1,034 38 230 77 31 181 30 117 78 50 346
F 2,136 546 32 357 62 523 170 5 57 9 58 87 29 201
Gllogoc
Total 2,972 1,315 31 181 30 71 16 322 121 281 170 43 39 352
M 2,171 974 15 125 14 15 11 303 87 227 140 3 28 229
F 801 341 16 56 16 56 5 19 34 54 30 40 11 123
Gjilan
Total 11,016 1,376 6,143 1,470 600 125 27 26 117 19 34 214 100 765
M 5,960 933 2,981 1,037 243 50 6 19 96 14 23 29 64 465
F 5,056 443 3,162 433 357 75 21 7 21 5 11 185 36 300
Dragash
Total 3,645 472 1,068 307 210 72 144 54 343 418 90 216 12 239
M 2,402 333 713 211 123 7 79 47 278 287 39 122 8 155
F 1,243 139 355 96 87 65 65 7 65 131 51 94 4 84
Istog
Total 3,387 1,389 175 479 19 109 436 82 174 48 42 86 43 305
M 2,120 949 84 329 8 43 169 64 139 45 32 35 31 192
F 1,267 440 91 150 11 66 267 18 35 3 10 51 12 113
Kaçanik
Total 2,351 932 19 336 420 40 4 20 38 35 8 64 95 340
M 1,447 705 4 251 102 16 2 17 30 31 7 3 58 221
F 904 227 15 85 318 24 2 3 8 4 1 61 37 119
Klinë
Total 1,949 738 90 265 20 122 67 110 57 122 118 41 22 177
M 1,346 555 45 206 11 20 19 106 48 101 88 11 14 122
F 603 183 45 59 9 102 48 4 9 21 30 30 8 55
F.Kosovë
Total 4,725 1,367 2,172 234 249 46 26 18 58 26 33 24 80 392
M 2,647 825 1,164 133 123 18 8 16 39 15 19 13 40 234
F 2,078 542 1,008 101 126 28 18 2 19 11 14 11 40 158
Kamenicë
Total 3,025 570 1,363 730 65 43 2 23 35 8 18 33 10 125
M 1,475 418 317 557 12 17 0 19 26 3 9 2 8 87
F 1,550 152 1,046 173 53 26 2 4 9 5 9 31 2 38
Mitrovicë
Total 4,162 2,414 91 246 60 128 79 33 70 46 37 59 339 560
M 2,558 1,559 18 151 27 53 28 31 49 33 22 11 215 361
F 1,604 855 73 95 33 75 51 2 21 13 15 48 124 199
Leposaviq
Total 0 0 0 0 0 0 0 0 0 0 0 0 0 0
M 0 0 0 0 0 0 0 0 0 0 0 0 0 0
F 0 0 0 0 0 0 0 0 0 0 0 0 0 0
Lipjan
Total 3,883 1,968 85 480 137 93 32 120 58 145 101 79 93 492
M 2,693 1,436 34 353 65 35 16 110 42 116 80 22 61 323
F 1,190 532 51 127 72 58 16 10 16 29 21 57 32 169
Novobërdë
Total 496 85 317 34 7 1 1 4 7 1 0 13 0 26
M 290 60 171 30 3 0 0 3 6 1 0 1 0 15
F 206 25 146 4 4 1 1 1 1 0 0 12 0 11
Obiliq
Total 945 505 107 27 25 15 10 7 11 8 12 24 33 161
M 575 332 47 20 8 4 5 6 6 6 9 7 19 106
F 370 173 60 7 17 11 5 1 5 2 3 17 14 55
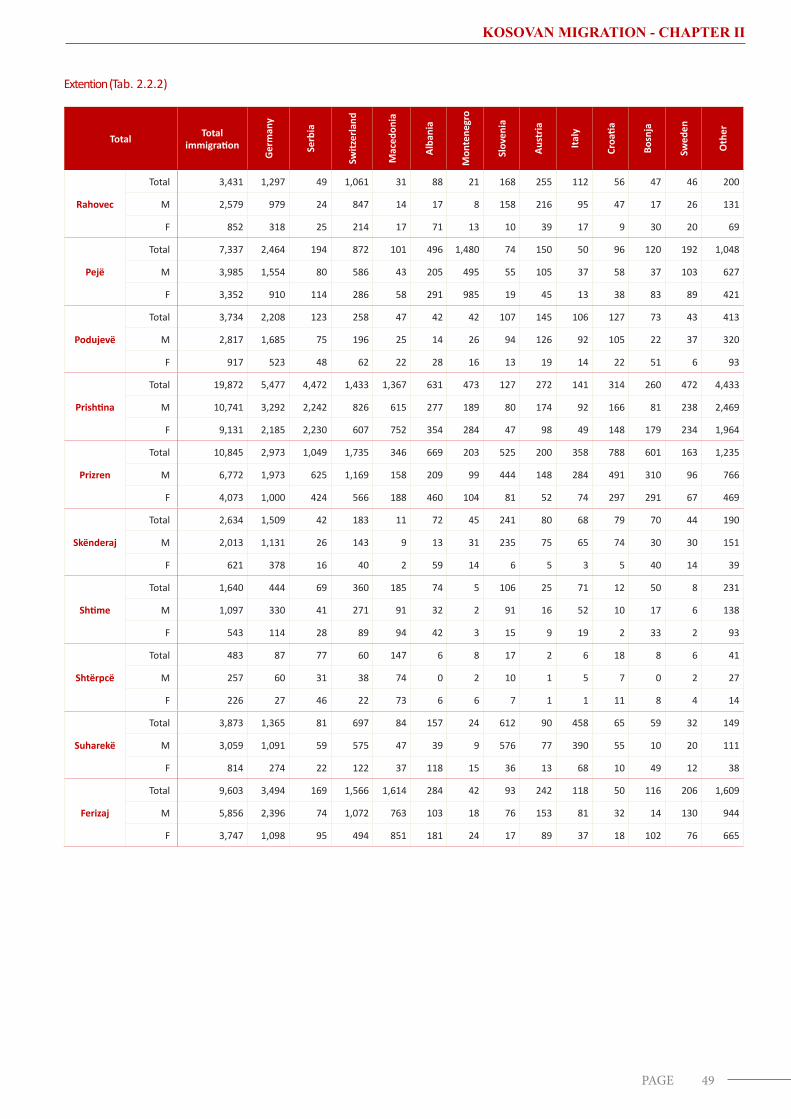
49PAGE
KOSOVAN MIGRATION - CHAPTER II
Extention (Tab. 2.2.2)
Total Total immigration
Ger
man
y
Serb
ia
Switz
erla
nd
Mac
edon
ia
Alba
nia
Mon
tene
gro
Slov
enia
Aust
ria
Italy
Croa
tia
Bosn
ja
Swed
en
Oth
er
Rahovec
Total 3,431 1,297 49 1,061 31 88 21 168 255 112 56 47 46 200
M 2,579 979 24 847 14 17 8 158 216 95 47 17 26 131
F 852 318 25 214 17 71 13 10 39 17 9 30 20 69
Pejë
Total 7,337 2,464 194 872 101 496 1,480 74 150 50 96 120 192 1,048
M 3,985 1,554 80 586 43 205 495 55 105 37 58 37 103 627
F 3,352 910 114 286 58 291 985 19 45 13 38 83 89 421
Podujevë
Total 3,734 2,208 123 258 47 42 42 107 145 106 127 73 43 413
M 2,817 1,685 75 196 25 14 26 94 126 92 105 22 37 320
F 917 523 48 62 22 28 16 13 19 14 22 51 6 93
Prishtina
Total 19,872 5,477 4,472 1,433 1,367 631 473 127 272 141 314 260 472 4,433
M 10,741 3,292 2,242 826 615 277 189 80 174 92 166 81 238 2,469
F 9,131 2,185 2,230 607 752 354 284 47 98 49 148 179 234 1,964
Prizren
Total 10,845 2,973 1,049 1,735 346 669 203 525 200 358 788 601 163 1,235
M 6,772 1,973 625 1,169 158 209 99 444 148 284 491 310 96 766
F 4,073 1,000 424 566 188 460 104 81 52 74 297 291 67 469
Skënderaj
Total 2,634 1,509 42 183 11 72 45 241 80 68 79 70 44 190
M 2,013 1,131 26 143 9 13 31 235 75 65 74 30 30 151
F 621 378 16 40 2 59 14 6 5 3 5 40 14 39
Shtime
Total 1,640 444 69 360 185 74 5 106 25 71 12 50 8 231
M 1,097 330 41 271 91 32 2 91 16 52 10 17 6 138
F 543 114 28 89 94 42 3 15 9 19 2 33 2 93
Shtërpcë
Total 483 87 77 60 147 6 8 17 2 6 18 8 6 41
M 257 60 31 38 74 0 2 10 1 5 7 0 2 27
F 226 27 46 22 73 6 6 7 1 1 11 8 4 14
Suharekë
Total 3,873 1,365 81 697 84 157 24 612 90 458 65 59 32 149
M 3,059 1,091 59 575 47 39 9 576 77 390 55 10 20 111
F 814 274 22 122 37 118 15 36 13 68 10 49 12 38
Ferizaj
Total 9,603 3,494 169 1,566 1,614 284 42 93 242 118 50 116 206 1,609
M 5,856 2,396 74 1,072 763 103 18 76 153 81 32 14 130 944
F 3,747 1,098 95 494 851 181 24 17 89 37 18 102 76 665
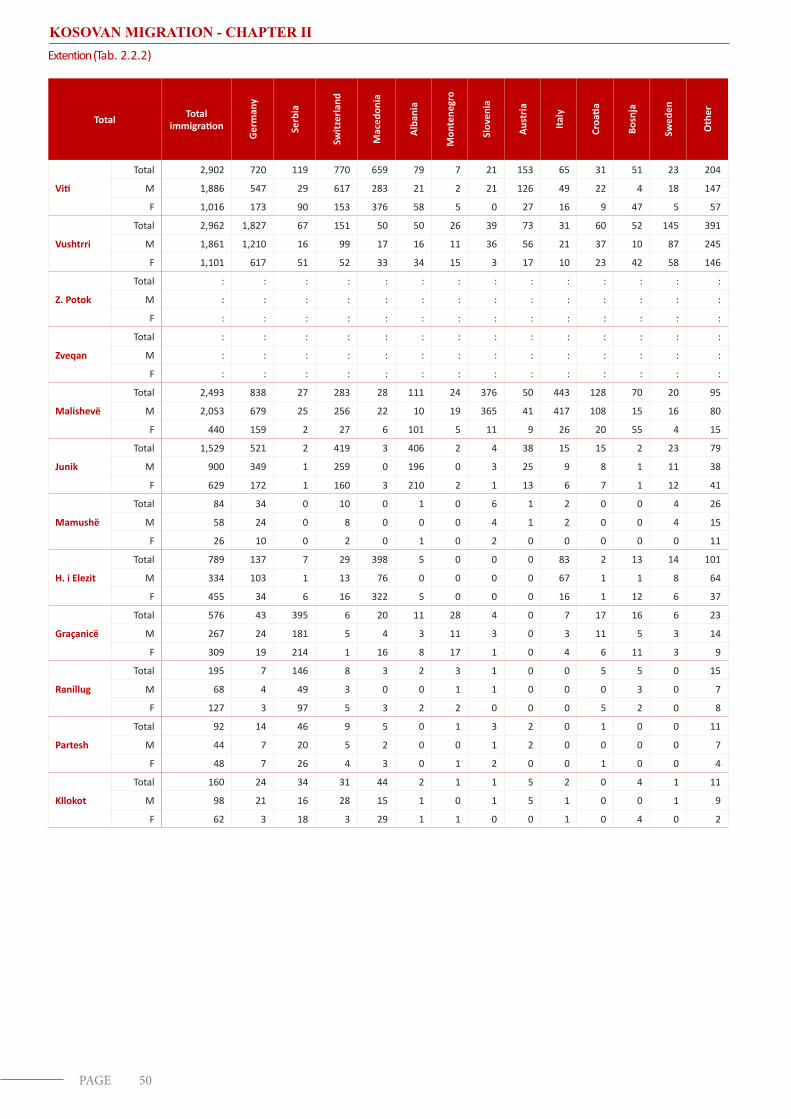
50PAGE
KOSOVAN MIGRATION - CHAPTER IIExtention (Tab. 2.2.2)
Total Total immigration
Ger
man
y
Serb
ia
Switz
erla
nd
Mac
edon
ia
Alba
nia
Mon
tene
gro
Slov
enia
Aust
ria
Italy
Croa
tia
Bosn
ja
Swed
en
Oth
er
Viti
Total 2,902 720 119 770 659 79 7 21 153 65 31 51 23 204
M 1,886 547 29 617 283 21 2 21 126 49 22 4 18 147
F 1,016 173 90 153 376 58 5 0 27 16 9 47 5 57
Vushtrri
Total 2,962 1,827 67 151 50 50 26 39 73 31 60 52 145 391
M 1,861 1,210 16 99 17 16 11 36 56 21 37 10 87 245
F 1,101 617 51 52 33 34 15 3 17 10 23 42 58 146
Z. Potok
Total : : : : : : : : : : : : : :
M : : : : : : : : : : : : : :
F : : : : : : : : : : : : : :
Zveqan
Total : : : : : : : : : : : : : :
M : : : : : : : : : : : : : :
F : : : : : : : : : : : : : :
Malishevë
Total 2,493 838 27 283 28 111 24 376 50 443 128 70 20 95
M 2,053 679 25 256 22 10 19 365 41 417 108 15 16 80
F 440 159 2 27 6 101 5 11 9 26 20 55 4 15
Junik
Total 1,529 521 2 419 3 406 2 4 38 15 15 2 23 79
M 900 349 1 259 0 196 0 3 25 9 8 1 11 38
F 629 172 1 160 3 210 2 1 13 6 7 1 12 41
Mamushë
Total 84 34 0 10 0 1 0 6 1 2 0 0 4 26
M 58 24 0 8 0 0 0 4 1 2 0 0 4 15
F 26 10 0 2 0 1 0 2 0 0 0 0 0 11
H. i Elezit
Total 789 137 7 29 398 5 0 0 0 83 2 13 14 101
M 334 103 1 13 76 0 0 0 0 67 1 1 8 64
F 455 34 6 16 322 5 0 0 0 16 1 12 6 37
Graçanicë
Total 576 43 395 6 20 11 28 4 0 7 17 16 6 23
M 267 24 181 5 4 3 11 3 0 3 11 5 3 14
F 309 19 214 1 16 8 17 1 0 4 6 11 3 9
Ranillug
Total 195 7 146 8 3 2 3 1 0 0 5 5 0 15
M 68 4 49 3 0 0 1 1 0 0 0 3 0 7
F 127 3 97 5 3 2 2 0 0 0 5 2 0 8
Partesh
Total 92 14 46 9 5 0 1 3 2 0 1 0 0 11
M 44 7 20 5 2 0 0 1 2 0 0 0 0 7
F 48 7 26 4 3 0 1 2 0 0 1 0 0 4
Kllokot
Total 160 24 34 31 44 2 1 1 5 2 0 4 1 11
M 98 21 16 28 15 1 0 1 5 1 0 0 1 9
F 62 3 18 3 29 1 1 0 0 1 0 4 0 2

KOSOVAN MIGRATION
51PAGE
CHAPTER III

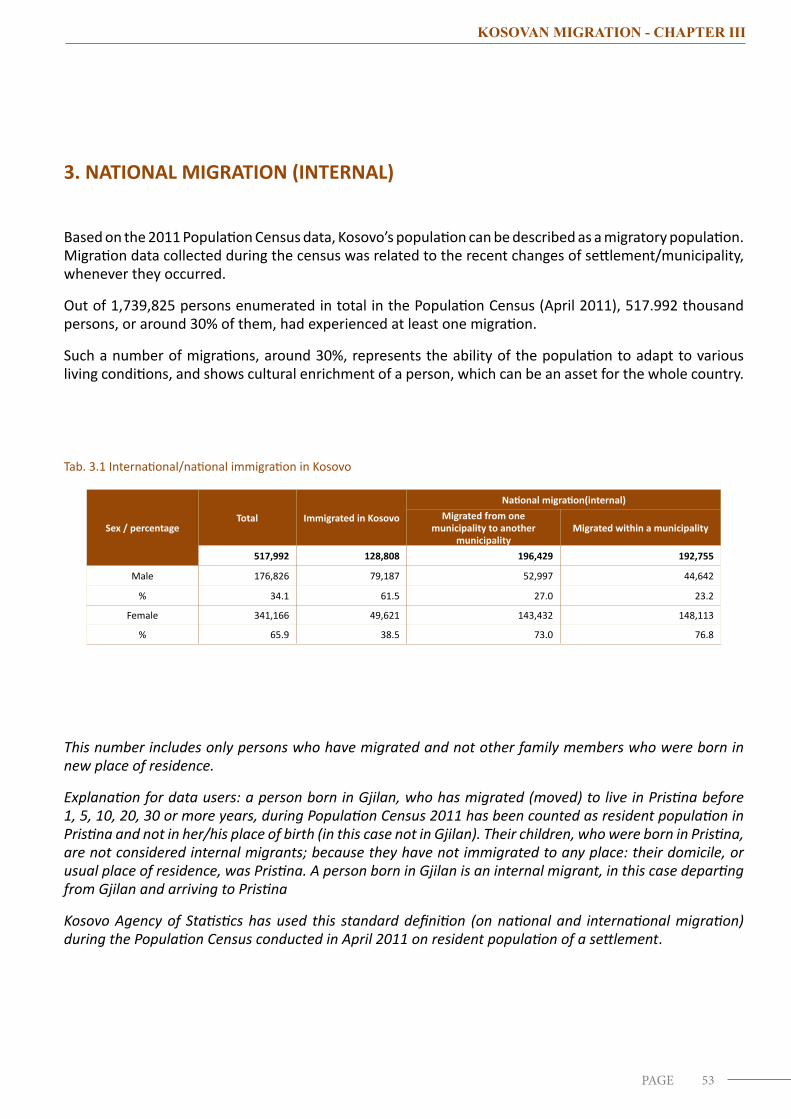
53PAGE
KOSOVAN MIGRATION - CHAPTER III
3. NATIONAL MIGRATION (INTERNAL)
Based on the 2011 Population Census data, Kosovo’s population can be described as a migratory population. Migration data collected during the census was related to the recent changes of settlement/municipality, whenever they occurred.
Out of 1,739,825 persons enumerated in total in the Population Census (April 2011), 517.992 thousand persons, or around 30% of them, had experienced at least one migration.
Such a number of migrations, around 30%, represents the ability of the population to adapt to various living conditions, and shows cultural enrichment of a person, which can be an asset for the whole country.
Tab. 3.1 International/national immigration in Kosovo
Sex / percentageTotal Immigrated in Kosovo
National migration(internal)Migrated from one
municipality to another municipality
Migrated within a municipality
517,992 128,808 196,429 192,755
Male 176,826 79,187 52,997 44,642
% 34.1 61.5 27.0 23.2
Female 341,166 49,621 143,432 148,113
% 65.9 38.5 73.0 76.8
This number includes only persons who have migrated and not other family members who were born in new place of residence.
Explanation for data users: a person born in Gjilan, who has migrated (moved) to live in Pristina before 1, 5, 10, 20, 30 or more years, during Population Census 2011 has been counted as resident population in Pristina and not in her/his place of birth (in this case not in Gjilan). Their children, who were born in Pristina, are not considered internal migrants; because they have not immigrated to any place: their domicile, or usual place of residence, was Pristina. A person born in Gjilan is an internal migrant, in this case departing from Gjilan and arriving to Pristina
Kosovo Agency of Statistics has used this standard definition (on national and international migration) during the Population Census conducted in April 2011 on resident population of a settlement.
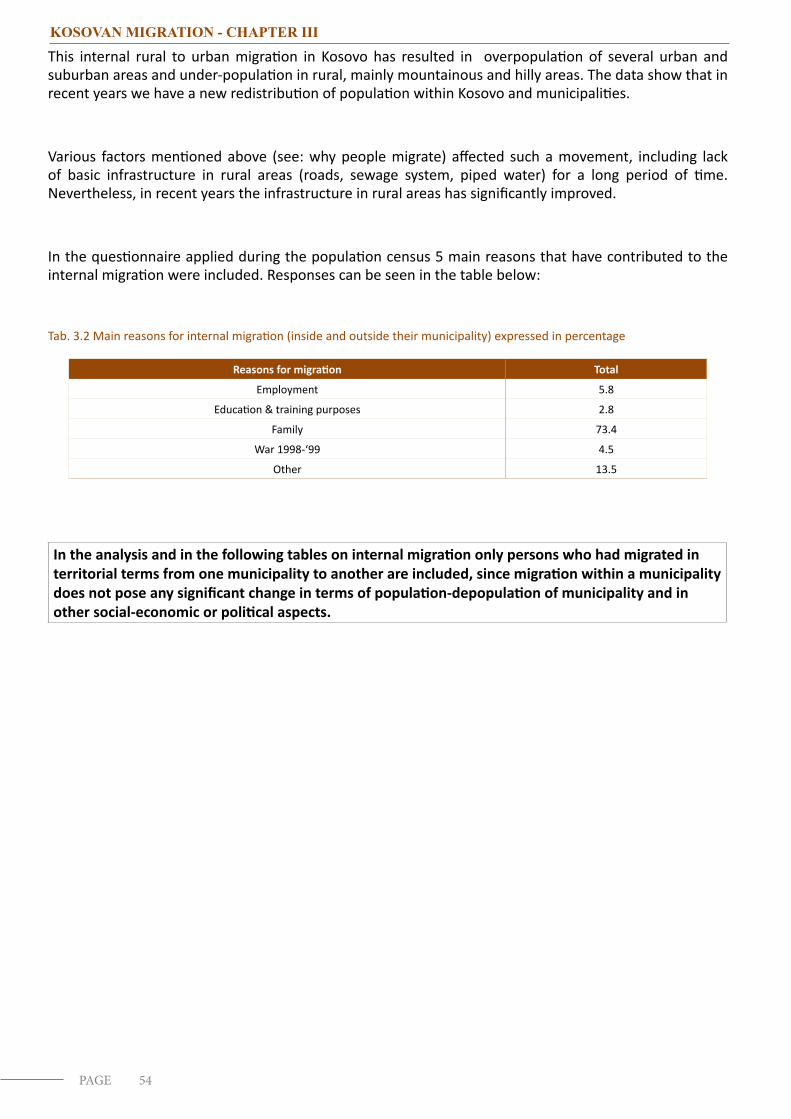
54PAGE
KOSOVAN MIGRATION - CHAPTER III
This internal rural to urban migration in Kosovo has resulted in overpopulation of several urban and suburban areas and under-population in rural, mainly mountainous and hilly areas. The data show that in recent years we have a new redistribution of population within Kosovo and municipalities.
Various factors mentioned above (see: why people migrate) affected such a movement, including lack of basic infrastructure in rural areas (roads, sewage system, piped water) for a long period of time. Nevertheless, in recent years the infrastructure in rural areas has significantly improved.
In the questionnaire applied during the population census 5 main reasons that have contributed to the internal migration were included. Responses can be seen in the table below:
Tab. 3.2 Main reasons for internal migration (inside and outside their municipality) expressed in percentage
Reasons for migration Total
Employment 5.8
Education & training purposes 2.8
Family 73.4
War 1998-‘99 4.5
Other 13.5
In the analysis and in the following tables on internal migration only persons who had migrated in territorial terms from one municipality to another are included, since migration within a municipality does not pose any significant change in terms of population-depopulation of municipality and in other social-economic or political aspects.
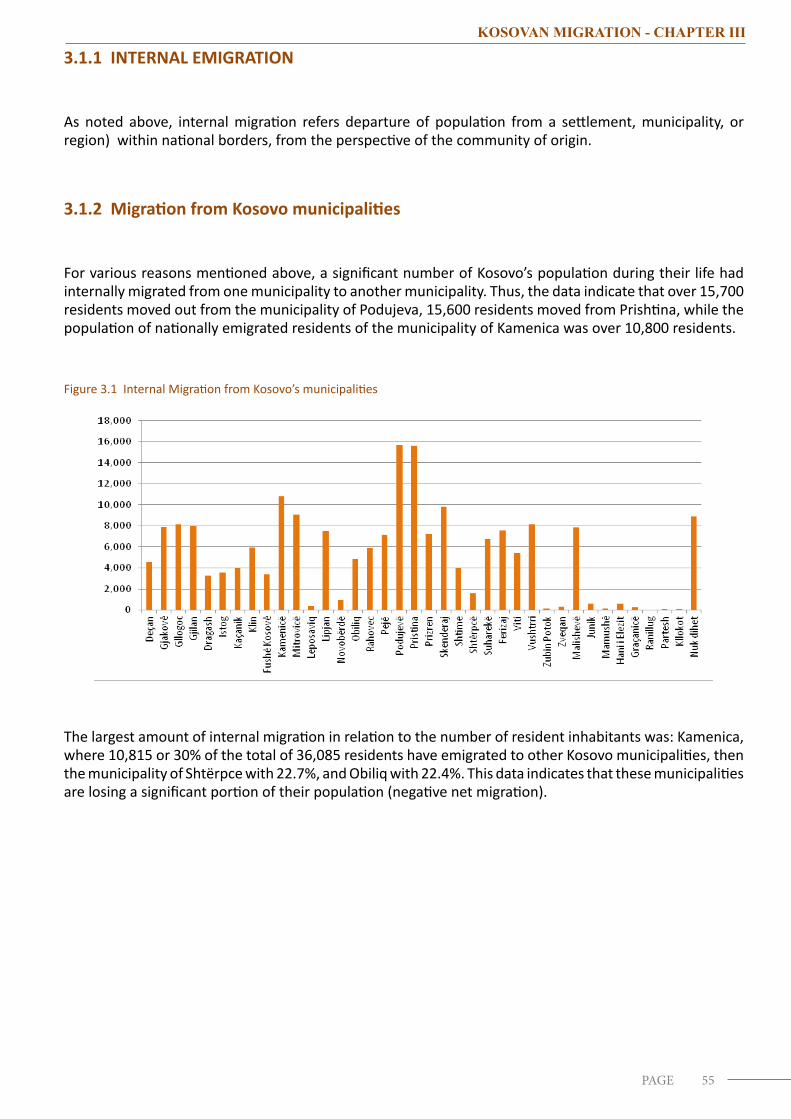
55PAGE
KOSOVAN MIGRATION - CHAPTER III
3.1.1 INTERNAL EMIGRATION
As noted above, internal migration refers departure of population from a settlement, municipality, or region) within national borders, from the perspective of the community of origin.
3.1.2 Migration from Kosovo municipalities
For various reasons mentioned above, a significant number of Kosovo’s population during their life had internally migrated from one municipality to another municipality. Thus, the data indicate that over 15,700 residents moved out from the municipality of Podujeva, 15,600 residents moved from Prishtina, while the population of nationally emigrated residents of the municipality of Kamenica was over 10,800 residents.
Figure 3.1 Internal Migration from Kosovo’s municipalities
The largest amount of internal migration in relation to the number of resident inhabitants was: Kamenica, where 10,815 or 30% of the total of 36,085 residents have emigrated to other Kosovo municipalities, then the municipality of Shtërpce with 22.7%, and Obiliq with 22.4%. This data indicates that these municipalities are losing a significant portion of their population (negative net migration).
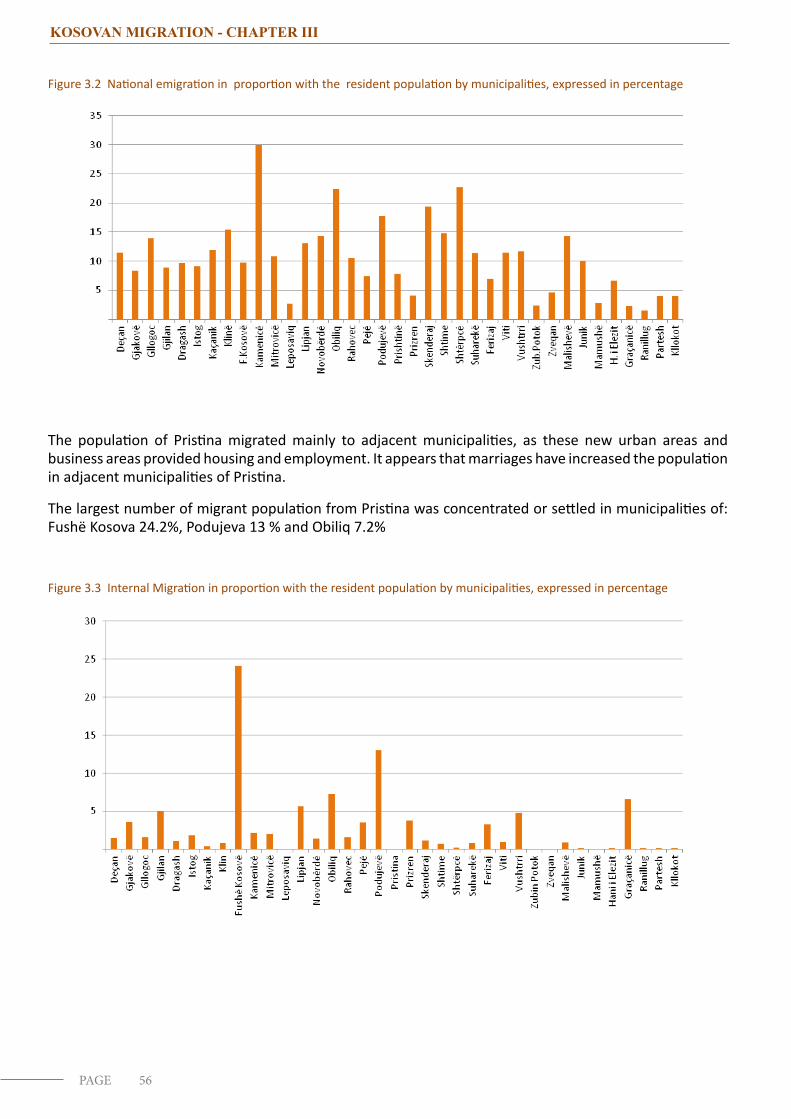
56PAGE
KOSOVAN MIGRATION - CHAPTER III
Figure 3.2 National emigration in proportion with the resident population by municipalities, expressed in percentage
The population of Pristina migrated mainly to adjacent municipalities, as these new urban areas and business areas provided housing and employment. It appears that marriages have increased the population in adjacent municipalities of Pristina.
The largest number of migrant population from Pristina was concentrated or settled in municipalities of: Fushë Kosova 24.2%, Podujeva 13 % and Obiliq 7.2%
Figure 3.3 Internal Migration in proportion with the resident population by municipalities, expressed in percentage
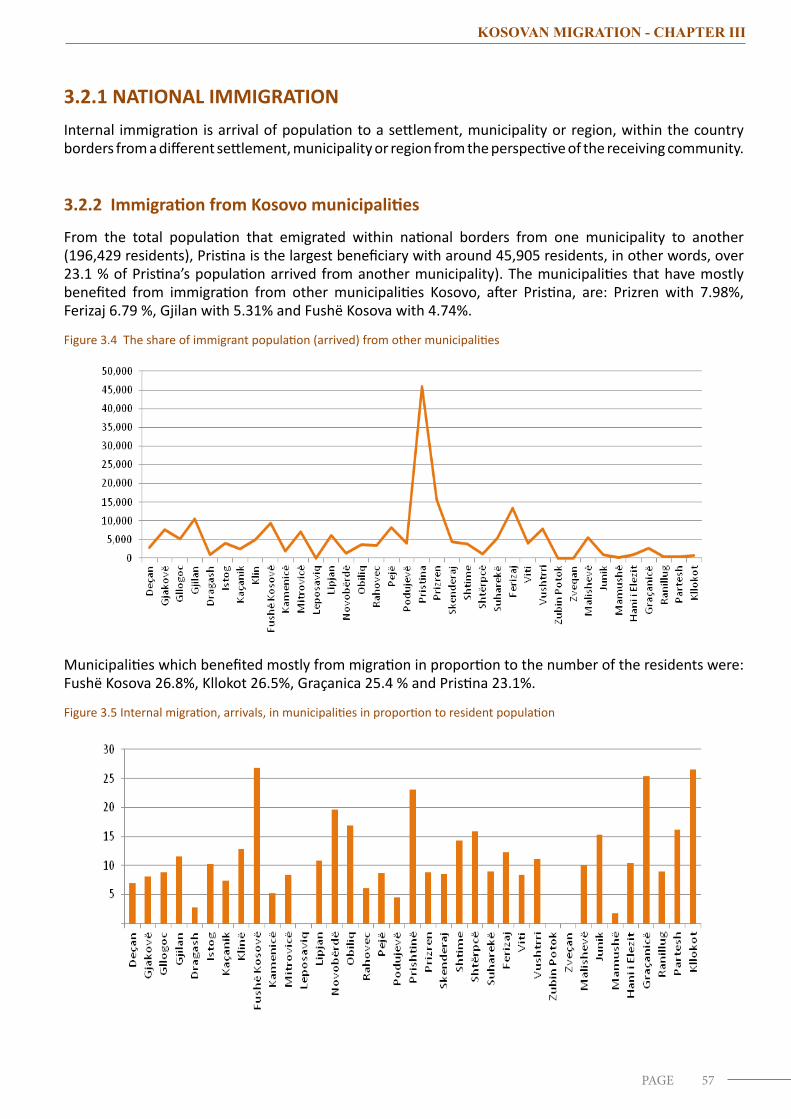
57PAGE
KOSOVAN MIGRATION - CHAPTER III
3.2.1 NATIONAL IMMIGRATIONInternal immigration is arrival of population to a settlement, municipality or region, within the country borders from a different settlement, municipality or region from the perspective of the receiving community.
3.2.2 Immigration from Kosovo municipalities
From the total population that emigrated within national borders from one municipality to another (196,429 residents), Pristina is the largest beneficiary with around 45,905 residents, in other words, over 23.1 % of Pristina’s population arrived from another municipality). The municipalities that have mostly benefited from immigration from other municipalities Kosovo, after Pristina, are: Prizren with 7.98%, Ferizaj 6.79 %, Gjilan with 5.31% and Fushë Kosova with 4.74%.
Figure 3.4 The share of immigrant population (arrived) from other municipalities
Municipalities which benefited mostly from migration in proportion to the number of the residents were: Fushë Kosova 26.8%, Kllokot 26.5%, Graçanica 25.4 % and Pristina 23.1%.
Figure 3.5 Internal migration, arrivals, in municipalities in proportion to resident population
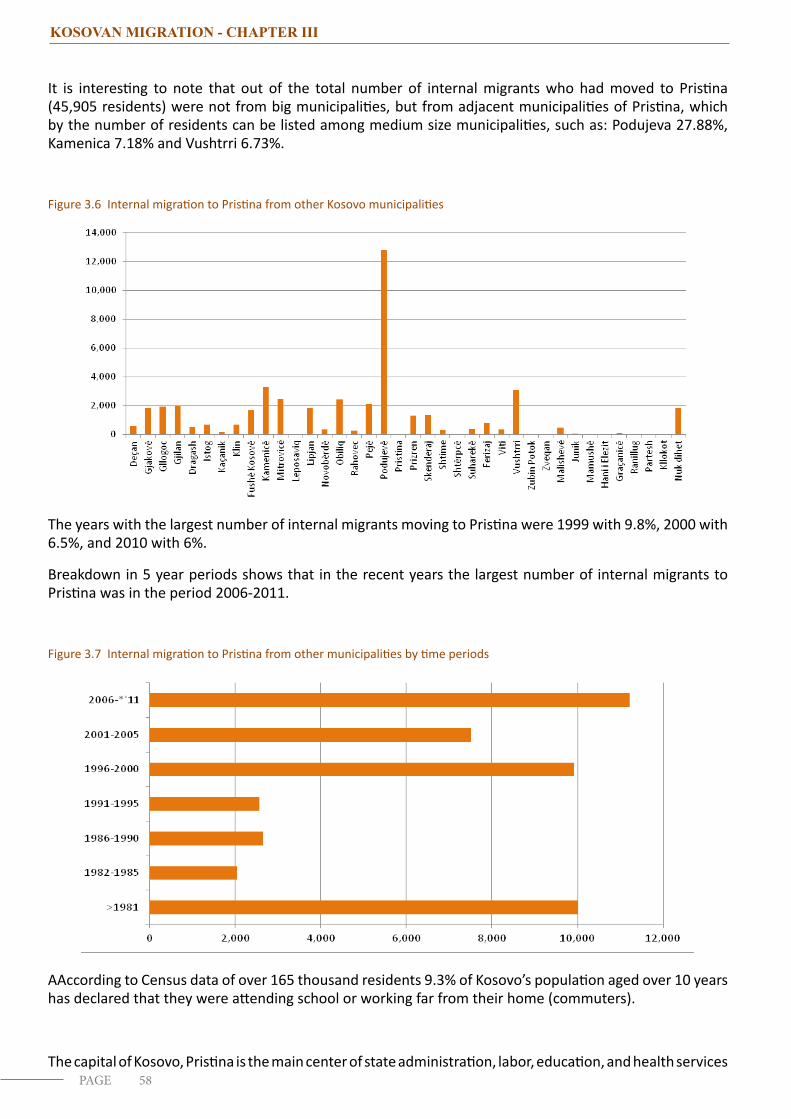
58PAGE
KOSOVAN MIGRATION - CHAPTER III
It is interesting to note that out of the total number of internal migrants who had moved to Pristina (45,905 residents) were not from big municipalities, but from adjacent municipalities of Pristina, which by the number of residents can be listed among medium size municipalities, such as: Podujeva 27.88%, Kamenica 7.18% and Vushtrri 6.73%.
Figure 3.6 Internal migration to Pristina from other Kosovo municipalities
The years with the largest number of internal migrants moving to Pristina were 1999 with 9.8%, 2000 with 6.5%, and 2010 with 6%.
Breakdown in 5 year periods shows that in the recent years the largest number of internal migrants to Pristina was in the period 2006-2011.
Figure 3.7 Internal migration to Pristina from other municipalities by time periods
AAccording to Census data of over 165 thousand residents 9.3% of Kosovo’s population aged over 10 years has declared that they were attending school or working far from their home (commuters).
The capital of Kosovo, Pristina is the main center of state administration, labor, education, and health services
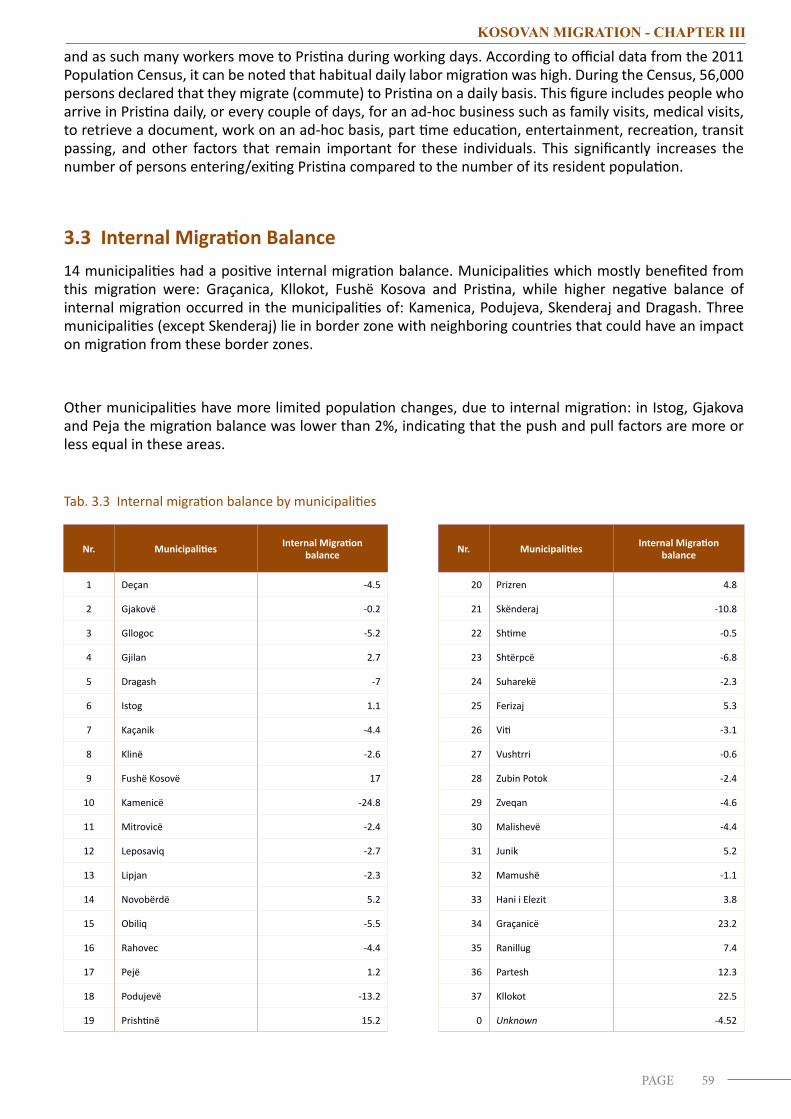
59PAGE
KOSOVAN MIGRATION - CHAPTER III
and as such many workers move to Pristina during working days. According to official data from the 2011 Population Census, it can be noted that habitual daily labor migration was high. During the Census, 56,000 persons declared that they migrate (commute) to Pristina on a daily basis. This figure includes people who arrive in Pristina daily, or every couple of days, for an ad-hoc business such as family visits, medical visits, to retrieve a document, work on an ad-hoc basis, part time education, entertainment, recreation, transit passing, and other factors that remain important for these individuals. This significantly increases the number of persons entering/exiting Pristina compared to the number of its resident population.
3.3 Internal Migration Balance 14 municipalities had a positive internal migration balance. Municipalities which mostly benefited from this migration were: Graçanica, Kllokot, Fushë Kosova and Pristina, while higher negative balance of internal migration occurred in the municipalities of: Kamenica, Podujeva, Skenderaj and Dragash. Three municipalities (except Skenderaj) lie in border zone with neighboring countries that could have an impact on migration from these border zones.
Other municipalities have more limited population changes, due to internal migration: in Istog, Gjakova and Peja the migration balance was lower than 2%, indicating that the push and pull factors are more or less equal in these areas.
Tab. 3.3 Internal migration balance by municipalities
Nr. Municipalities Internal Migration balance Nr. Municipalities Internal Migration
balance
1 Deçan -4.5 20 Prizren 4.8
2 Gjakovë -0.2 21 Skënderaj -10.8
3 Gllogoc -5.2 22 Shtime -0.5
4 Gjilan 2.7 23 Shtërpcë -6.8
5 Dragash -7 24 Suharekë -2.3
6 Istog 1.1 25 Ferizaj 5.3
7 Kaçanik -4.4 26 Viti -3.1
8 Klinë -2.6 27 Vushtrri -0.6
9 Fushë Kosovë 17 28 Zubin Potok -2.4
10 Kamenicë -24.8 29 Zveqan -4.6
11 Mitrovicë -2.4 30 Malishevë -4.4
12 Leposaviq -2.7 31 Junik 5.2
13 Lipjan -2.3 32 Mamushë -1.1
14 Novobërdë 5.2 33 Hani i Elezit 3.8
15 Obiliq -5.5 34 Graçanicë 23.2
16 Rahovec -4.4 35 Ranillug 7.4
17 Pejë 1.2 36 Partesh 12.3
18 Podujevë -13.2 37 Kllokot 22.5
19 Prishtinë 15.2 0 Unknown -4.52
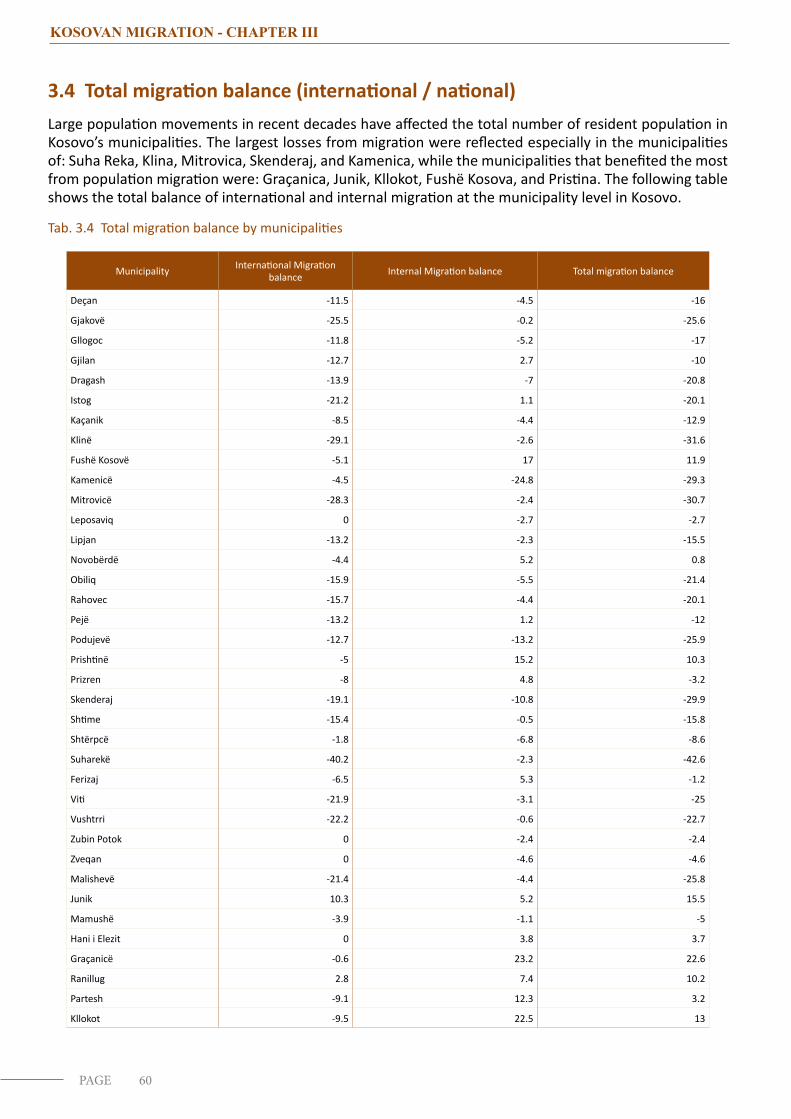
60PAGE
KOSOVAN MIGRATION - CHAPTER III
3.4 Total migration balance (international / national)Large population movements in recent decades have affected the total number of resident population in Kosovo’s municipalities. The largest losses from migration were reflected especially in the municipalities of: Suha Reka, Klina, Mitrovica, Skenderaj, and Kamenica, while the municipalities that benefited the most from population migration were: Graçanica, Junik, Kllokot, Fushë Kosova, and Pristina. The following table shows the total balance of international and internal migration at the municipality level in Kosovo.
Tab. 3.4 Total migration balance by municipalities
Municipality International Migration balance Internal Migration balance Total migration balance
Deçan -11.5 -4.5 -16
Gjakovë -25.5 -0.2 -25.6
Gllogoc -11.8 -5.2 -17
Gjilan -12.7 2.7 -10
Dragash -13.9 -7 -20.8
Istog -21.2 1.1 -20.1
Kaçanik -8.5 -4.4 -12.9
Klinë -29.1 -2.6 -31.6
Fushë Kosovë -5.1 17 11.9
Kamenicë -4.5 -24.8 -29.3
Mitrovicë -28.3 -2.4 -30.7
Leposaviq 0 -2.7 -2.7
Lipjan -13.2 -2.3 -15.5
Novobërdë -4.4 5.2 0.8
Obiliq -15.9 -5.5 -21.4
Rahovec -15.7 -4.4 -20.1
Pejë -13.2 1.2 -12
Podujevë -12.7 -13.2 -25.9
Prishtinë -5 15.2 10.3
Prizren -8 4.8 -3.2
Skenderaj -19.1 -10.8 -29.9
Shtime -15.4 -0.5 -15.8
Shtërpcë -1.8 -6.8 -8.6
Suharekë -40.2 -2.3 -42.6
Ferizaj -6.5 5.3 -1.2
Viti -21.9 -3.1 -25
Vushtrri -22.2 -0.6 -22.7
Zubin Potok 0 -2.4 -2.4
Zveqan 0 -4.6 -4.6
Malishevë -21.4 -4.4 -25.8
Junik 10.3 5.2 15.5
Mamushë -3.9 -1.1 -5
Hani i Elezit 0 3.8 3.7
Graçanicë -0.6 23.2 22.6
Ranillug 2.8 7.4 10.2
Partesh -9.1 12.3 3.2
Kllokot -9.5 22.5 13
61PAGE
KOSOVAN MIGRATION - CHAPTER III
TABLES
INTERNAL EMIGRATION

62PAGE
KOSOVAN MIGRATION - CHAPTER III
Tab. 3.1.1 1 Internal emigration, departures, the share in proportion with the resident population at municipal and national level
Municipality Total number of national emigration
Percentage of emigration compared to resident population
of municipality Total share of national emigration
Total 196,429 100 %
1 Deçan 4,580 11.44 2.33
2 Gjakovë 7,889 8.34 4.02
3 Gllogoc 8,160 13.94 4.15
4 Gjilan 8,045 8.92 4.10
5 Dragash 3,293 9.69 1.68
6 Istog 3,582 9.12 1.82
7 Kaçanik 3,967 11.87 2.02
8 Klinë 5,949 15.45 3.03
9 Fushë Kosovë 3,403 9.77 1.73
10 Kamenicë 10,815 29.97 5.51
11 Mitrovicë 9,072 10.77 4.62
12 Leposaviq 373 2.71 0.19
13 Lipjan 7,521 13.06 3.83
14 Novobërdë 966 14.36 0.49
15 Obiliq 4,823 22.38 2.46
16 Rahovec 5,910 10.51 3.01
17 Pejë 7,144 7.41 3.64
18 Podujevë 15,704 17.74 7.99
19 Prishtina 15,596 7.84 7.94
20 Prizren 7,226 4.06 3.68
21 Skenderaj 9,850 19.37 5.01
22 Shtime 4,035 14.77 2.05
23 Shtërpcë 1,579 22.72 0.80
24 Suharekë 6,747 11.3 3.43
25 Ferizaj 7,566 6.97 3.85
26 Viti 5,408 11.51 2.75
27 Vushtrri 8,146 11.66 4.15
28 Zubin Potok 157 2.37 0.08
29 Zveqan 346 4.63 0.18
30 Malishevë 7,836 14.35 3.99
31 Junik 615 10.11 0.31
32 Mamushë 155 2.81 0.08
33 Hani i Elezit 624 6.64 0.32
34 Graçanicë 236 2.21 0.12
35 Ranillug 59 1.53 0.03
36 Partesh 70 3.92 0.04
37 Kllokot 102 3.99 0.05
Nuk dihet 8,880 4.52
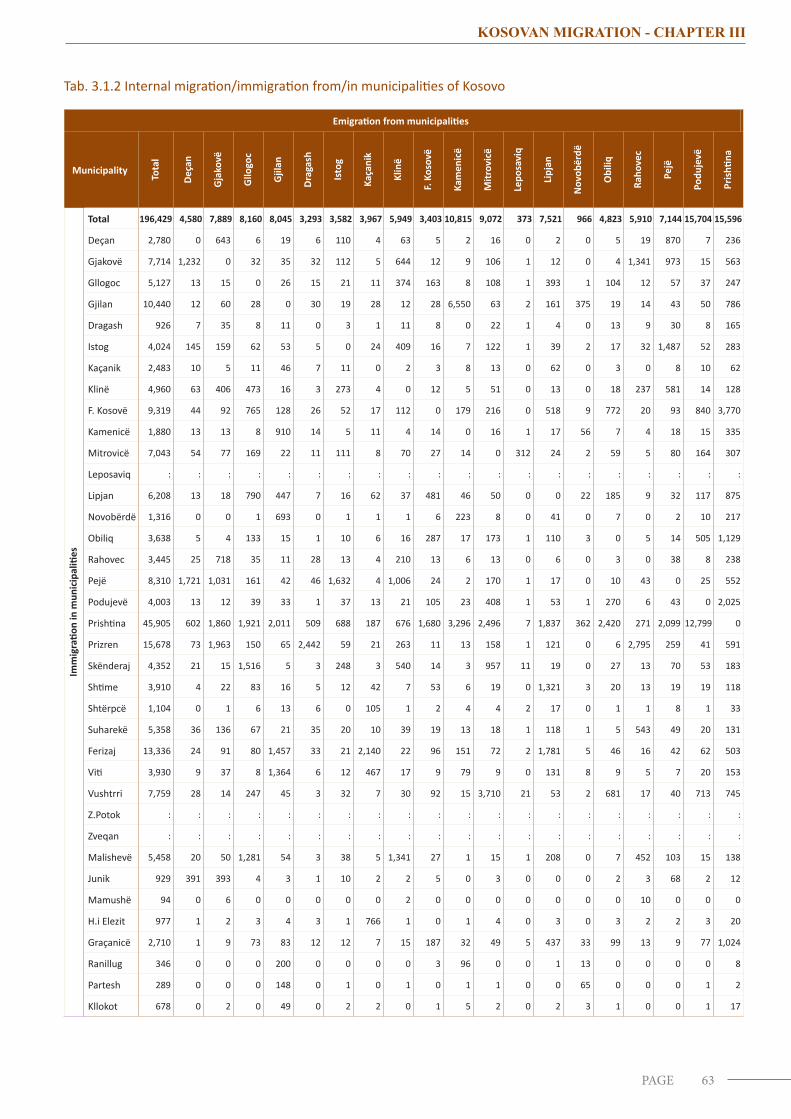
63PAGE
KOSOVAN MIGRATION - CHAPTER III
Tab. 3.1.2 Internal migration/immigration from/in municipalities of Kosovo
Emigration from municipalities
Municipality
Tota
l
Deça
n
Gja
kovë
Gllo
goc
Gjil
an
Drag
ash
Isto
g
Kaça
nik
Klin
ë
F. K
osov
ë
Kam
enic
ë
Mitr
ovic
ë
Lepo
savi
q
Lipj
an
Nov
obër
dë
Obi
liq
Raho
vec
Pejë
Podu
jevë
Pris
htina
Imm
igra
tion
in m
unic
ipal
ities
Total 196,429 4,580 7,889 8,160 8,045 3,293 3,582 3,967 5,949 3,403 10,815 9,072 373 7,521 966 4,823 5,910 7,144 15,704 15,596
Deçan 2,780 0 643 6 19 6 110 4 63 5 2 16 0 2 0 5 19 870 7 236
Gjakovë 7,714 1,232 0 32 35 32 112 5 644 12 9 106 1 12 0 4 1,341 973 15 563
Gllogoc 5,127 13 15 0 26 15 21 11 374 163 8 108 1 393 1 104 12 57 37 247
Gjilan 10,440 12 60 28 0 30 19 28 12 28 6,550 63 2 161 375 19 14 43 50 786
Dragash 926 7 35 8 11 0 3 1 11 8 0 22 1 4 0 13 9 30 8 165
Istog 4,024 145 159 62 53 5 0 24 409 16 7 122 1 39 2 17 32 1,487 52 283
Kaçanik 2,483 10 5 11 46 7 11 0 2 3 8 13 0 62 0 3 0 8 10 62
Klinë 4,960 63 406 473 16 3 273 4 0 12 5 51 0 13 0 18 237 581 14 128
F. Kosovë 9,319 44 92 765 128 26 52 17 112 0 179 216 0 518 9 772 20 93 840 3,770
Kamenicë 1,880 13 13 8 910 14 5 11 4 14 0 16 1 17 56 7 4 18 15 335
Mitrovicë 7,043 54 77 169 22 11 111 8 70 27 14 0 312 24 2 59 5 80 164 307
Leposaviq : : : : : : : : : : : : : : : : : : : :
Lipjan 6,208 13 18 790 447 7 16 62 37 481 46 50 0 0 22 185 9 32 117 875
Novobërdë 1,316 0 0 1 693 0 1 1 1 6 223 8 0 41 0 7 0 2 10 217
Obiliq 3,638 5 4 133 15 1 10 6 16 287 17 173 1 110 3 0 5 14 505 1,129
Rahovec 3,445 25 718 35 11 28 13 4 210 13 6 13 0 6 0 3 0 38 8 238
Pejë 8,310 1,721 1,031 161 42 46 1,632 4 1,006 24 2 170 1 17 0 10 43 0 25 552
Podujevë 4,003 13 12 39 33 1 37 13 21 105 23 408 1 53 1 270 6 43 0 2,025
Prishtina 45,905 602 1,860 1,921 2,011 509 688 187 676 1,680 3,296 2,496 7 1,837 362 2,420 271 2,099 12,799 0
Prizren 15,678 73 1,963 150 65 2,442 59 21 263 11 13 158 1 121 0 6 2,795 259 41 591
Skënderaj 4,352 21 15 1,516 5 3 248 3 540 14 3 957 11 19 0 27 13 70 53 183
Shtime 3,910 4 22 83 16 5 12 42 7 53 6 19 0 1,321 3 20 13 19 19 118
Shtërpcë 1,104 0 1 6 13 6 0 105 1 2 4 4 2 17 0 1 1 8 1 33
Suharekë 5,358 36 136 67 21 35 20 10 39 19 13 18 1 118 1 5 543 49 20 131
Ferizaj 13,336 24 91 80 1,457 33 21 2,140 22 96 151 72 2 1,781 5 46 16 42 62 503
Viti 3,930 9 37 8 1,364 6 12 467 17 9 79 9 0 131 8 9 5 7 20 153
Vushtrri 7,759 28 14 247 45 3 32 7 30 92 15 3,710 21 53 2 681 17 40 713 745
Z.Potok : : : : : : : : : : : : : : : : : : : :
Zveqan : : : : : : : : : : : : : : : : : : : :
Malishevë 5,458 20 50 1,281 54 3 38 5 1,341 27 1 15 1 208 0 7 452 103 15 138
Junik 929 391 393 4 3 1 10 2 2 5 0 3 0 0 0 2 3 68 2 12
Mamushë 94 0 6 0 0 0 0 0 2 0 0 0 0 0 0 0 10 0 0 0
H.i Elezit 977 1 2 3 4 3 1 766 1 0 1 4 0 3 0 3 2 2 3 20
Graçanicë 2,710 1 9 73 83 12 12 7 15 187 32 49 5 437 33 99 13 9 77 1,024
Ranillug 346 0 0 0 200 0 0 0 0 3 96 0 0 1 13 0 0 0 0 8
Partesh 289 0 0 0 148 0 1 0 1 0 1 1 0 0 65 0 0 0 1 2
Kllokot 678 0 2 0 49 0 2 2 0 1 5 2 0 2 3 1 0 0 1 17
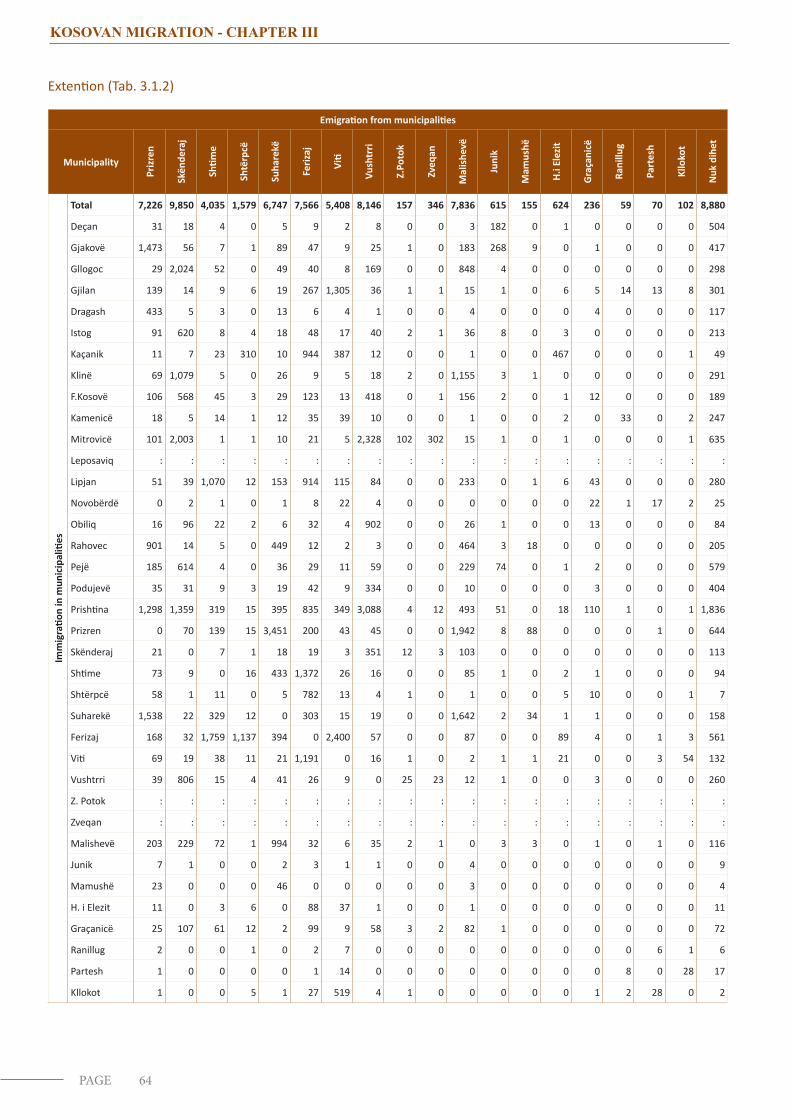
64PAGE
KOSOVAN MIGRATION - CHAPTER III
Extention (Tab. 3.1.2)
Emigration from municipalities
MunicipalityPr
izre
n
Skën
dera
j
Shtim
e
Shtë
rpcë
Suha
rekë
Feriz
aj
Viti
Vush
trri
Z.Po
tok
Zveq
an
Mal
ishe
vë
Juni
k
Mam
ushë
H.i E
lezi
t
Gra
çani
cë
Rani
llug
Part
esh
Kllo
kot
Nuk
dih
et
Imm
igra
tion
in m
unic
ipal
ities
Total 7,226 9,850 4,035 1,579 6,747 7,566 5,408 8,146 157 346 7,836 615 155 624 236 59 70 102 8,880
Deçan 31 18 4 0 5 9 2 8 0 0 3 182 0 1 0 0 0 0 504
Gjakovë 1,473 56 7 1 89 47 9 25 1 0 183 268 9 0 1 0 0 0 417
Gllogoc 29 2,024 52 0 49 40 8 169 0 0 848 4 0 0 0 0 0 0 298
Gjilan 139 14 9 6 19 267 1,305 36 1 1 15 1 0 6 5 14 13 8 301
Dragash 433 5 3 0 13 6 4 1 0 0 4 0 0 0 4 0 0 0 117
Istog 91 620 8 4 18 48 17 40 2 1 36 8 0 3 0 0 0 0 213
Kaçanik 11 7 23 310 10 944 387 12 0 0 1 0 0 467 0 0 0 1 49
Klinë 69 1,079 5 0 26 9 5 18 2 0 1,155 3 1 0 0 0 0 0 291
F.Kosovë 106 568 45 3 29 123 13 418 0 1 156 2 0 1 12 0 0 0 189
Kamenicë 18 5 14 1 12 35 39 10 0 0 1 0 0 2 0 33 0 2 247
Mitrovicë 101 2,003 1 1 10 21 5 2,328 102 302 15 1 0 1 0 0 0 1 635
Leposaviq : : : : : : : : : : : : : : : : : : :
Lipjan 51 39 1,070 12 153 914 115 84 0 0 233 0 1 6 43 0 0 0 280
Novobërdë 0 2 1 0 1 8 22 4 0 0 0 0 0 0 22 1 17 2 25
Obiliq 16 96 22 2 6 32 4 902 0 0 26 1 0 0 13 0 0 0 84
Rahovec 901 14 5 0 449 12 2 3 0 0 464 3 18 0 0 0 0 0 205
Pejë 185 614 4 0 36 29 11 59 0 0 229 74 0 1 2 0 0 0 579
Podujevë 35 31 9 3 19 42 9 334 0 0 10 0 0 0 3 0 0 0 404
Prishtina 1,298 1,359 319 15 395 835 349 3,088 4 12 493 51 0 18 110 1 0 1 1,836
Prizren 0 70 139 15 3,451 200 43 45 0 0 1,942 8 88 0 0 0 1 0 644
Skënderaj 21 0 7 1 18 19 3 351 12 3 103 0 0 0 0 0 0 0 113
Shtime 73 9 0 16 433 1,372 26 16 0 0 85 1 0 2 1 0 0 0 94
Shtërpcë 58 1 11 0 5 782 13 4 1 0 1 0 0 5 10 0 0 1 7
Suharekë 1,538 22 329 12 0 303 15 19 0 0 1,642 2 34 1 1 0 0 0 158
Ferizaj 168 32 1,759 1,137 394 0 2,400 57 0 0 87 0 0 89 4 0 1 3 561
Viti 69 19 38 11 21 1,191 0 16 1 0 2 1 1 21 0 0 3 54 132
Vushtrri 39 806 15 4 41 26 9 0 25 23 12 1 0 0 3 0 0 0 260
Z. Potok : : : : : : : : : : : : : : : : : : :
Zveqan : : : : : : : : : : : : : : : : : : :
Malishevë 203 229 72 1 994 32 6 35 2 1 0 3 3 0 1 0 1 0 116
Junik 7 1 0 0 2 3 1 1 0 0 4 0 0 0 0 0 0 0 9
Mamushë 23 0 0 0 46 0 0 0 0 0 3 0 0 0 0 0 0 0 4
H. i Elezit 11 0 3 6 0 88 37 1 0 0 1 0 0 0 0 0 0 0 11
Graçanicë 25 107 61 12 2 99 9 58 3 2 82 1 0 0 0 0 0 0 72
Ranillug 2 0 0 1 0 2 7 0 0 0 0 0 0 0 0 0 6 1 6
Partesh 1 0 0 0 0 1 14 0 0 0 0 0 0 0 0 8 0 28 17
Kllokot 1 0 0 5 1 27 519 4 1 0 0 0 0 0 1 2 28 0 2
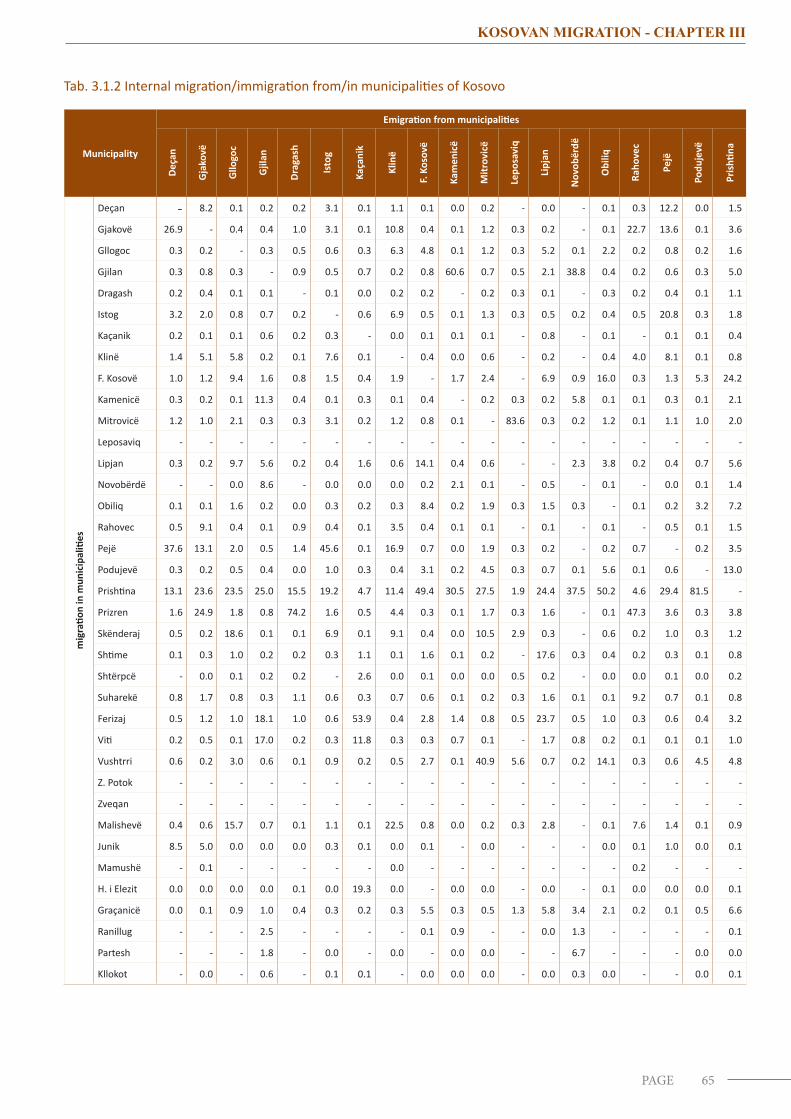
65PAGE
KOSOVAN MIGRATION - CHAPTER III
Tab. 3.1.2 Internal migration/immigration from/in municipalities of Kosovo
Municipality
Emigration from municipalities
Deça
n
Gja
kovë
Gllo
goc
Gjil
an
Drag
ash
Isto
g
Kaça
nik
Klin
ë
F. K
osov
ë
Kam
enic
ë
Mitr
ovic
ë
Lepo
savi
q
Lipj
an
Nov
obër
dë
Obi
liq
Raho
vec
Pejë
Podu
jevë
Pris
htina
mig
ratio
n in
mun
icip
aliti
es
Deçan - 8.2 0.1 0.2 0.2 3.1 0.1 1.1 0.1 0.0 0.2 - 0.0 - 0.1 0.3 12.2 0.0 1.5
Gjakovë 26.9 - 0.4 0.4 1.0 3.1 0.1 10.8 0.4 0.1 1.2 0.3 0.2 - 0.1 22.7 13.6 0.1 3.6
Gllogoc 0.3 0.2 - 0.3 0.5 0.6 0.3 6.3 4.8 0.1 1.2 0.3 5.2 0.1 2.2 0.2 0.8 0.2 1.6
Gjilan 0.3 0.8 0.3 - 0.9 0.5 0.7 0.2 0.8 60.6 0.7 0.5 2.1 38.8 0.4 0.2 0.6 0.3 5.0
Dragash 0.2 0.4 0.1 0.1 - 0.1 0.0 0.2 0.2 - 0.2 0.3 0.1 - 0.3 0.2 0.4 0.1 1.1
Istog 3.2 2.0 0.8 0.7 0.2 - 0.6 6.9 0.5 0.1 1.3 0.3 0.5 0.2 0.4 0.5 20.8 0.3 1.8
Kaçanik 0.2 0.1 0.1 0.6 0.2 0.3 - 0.0 0.1 0.1 0.1 - 0.8 - 0.1 - 0.1 0.1 0.4
Klinë 1.4 5.1 5.8 0.2 0.1 7.6 0.1 - 0.4 0.0 0.6 - 0.2 - 0.4 4.0 8.1 0.1 0.8
F. Kosovë 1.0 1.2 9.4 1.6 0.8 1.5 0.4 1.9 - 1.7 2.4 - 6.9 0.9 16.0 0.3 1.3 5.3 24.2
Kamenicë 0.3 0.2 0.1 11.3 0.4 0.1 0.3 0.1 0.4 - 0.2 0.3 0.2 5.8 0.1 0.1 0.3 0.1 2.1
Mitrovicë 1.2 1.0 2.1 0.3 0.3 3.1 0.2 1.2 0.8 0.1 - 83.6 0.3 0.2 1.2 0.1 1.1 1.0 2.0
Leposaviq - - - - - - - - - - - - - - - - - - -
Lipjan 0.3 0.2 9.7 5.6 0.2 0.4 1.6 0.6 14.1 0.4 0.6 - - 2.3 3.8 0.2 0.4 0.7 5.6
Novobërdë - - 0.0 8.6 - 0.0 0.0 0.0 0.2 2.1 0.1 - 0.5 - 0.1 - 0.0 0.1 1.4
Obiliq 0.1 0.1 1.6 0.2 0.0 0.3 0.2 0.3 8.4 0.2 1.9 0.3 1.5 0.3 - 0.1 0.2 3.2 7.2
Rahovec 0.5 9.1 0.4 0.1 0.9 0.4 0.1 3.5 0.4 0.1 0.1 - 0.1 - 0.1 - 0.5 0.1 1.5
Pejë 37.6 13.1 2.0 0.5 1.4 45.6 0.1 16.9 0.7 0.0 1.9 0.3 0.2 - 0.2 0.7 - 0.2 3.5
Podujevë 0.3 0.2 0.5 0.4 0.0 1.0 0.3 0.4 3.1 0.2 4.5 0.3 0.7 0.1 5.6 0.1 0.6 - 13.0
Prishtina 13.1 23.6 23.5 25.0 15.5 19.2 4.7 11.4 49.4 30.5 27.5 1.9 24.4 37.5 50.2 4.6 29.4 81.5 -
Prizren 1.6 24.9 1.8 0.8 74.2 1.6 0.5 4.4 0.3 0.1 1.7 0.3 1.6 - 0.1 47.3 3.6 0.3 3.8
Skënderaj 0.5 0.2 18.6 0.1 0.1 6.9 0.1 9.1 0.4 0.0 10.5 2.9 0.3 - 0.6 0.2 1.0 0.3 1.2
Shtime 0.1 0.3 1.0 0.2 0.2 0.3 1.1 0.1 1.6 0.1 0.2 - 17.6 0.3 0.4 0.2 0.3 0.1 0.8
Shtërpcë - 0.0 0.1 0.2 0.2 - 2.6 0.0 0.1 0.0 0.0 0.5 0.2 - 0.0 0.0 0.1 0.0 0.2
Suharekë 0.8 1.7 0.8 0.3 1.1 0.6 0.3 0.7 0.6 0.1 0.2 0.3 1.6 0.1 0.1 9.2 0.7 0.1 0.8
Ferizaj 0.5 1.2 1.0 18.1 1.0 0.6 53.9 0.4 2.8 1.4 0.8 0.5 23.7 0.5 1.0 0.3 0.6 0.4 3.2
Viti 0.2 0.5 0.1 17.0 0.2 0.3 11.8 0.3 0.3 0.7 0.1 - 1.7 0.8 0.2 0.1 0.1 0.1 1.0
Vushtrri 0.6 0.2 3.0 0.6 0.1 0.9 0.2 0.5 2.7 0.1 40.9 5.6 0.7 0.2 14.1 0.3 0.6 4.5 4.8
Z. Potok - - - - - - - - - - - - - - - - - - -
Zveqan - - - - - - - - - - - - - - - - - - -
Malishevë 0.4 0.6 15.7 0.7 0.1 1.1 0.1 22.5 0.8 0.0 0.2 0.3 2.8 - 0.1 7.6 1.4 0.1 0.9
Junik 8.5 5.0 0.0 0.0 0.0 0.3 0.1 0.0 0.1 - 0.0 - - - 0.0 0.1 1.0 0.0 0.1
Mamushë - 0.1 - - - - - 0.0 - - - - - - - 0.2 - - -
H. i Elezit 0.0 0.0 0.0 0.0 0.1 0.0 19.3 0.0 - 0.0 0.0 - 0.0 - 0.1 0.0 0.0 0.0 0.1
Graçanicë 0.0 0.1 0.9 1.0 0.4 0.3 0.2 0.3 5.5 0.3 0.5 1.3 5.8 3.4 2.1 0.2 0.1 0.5 6.6
Ranillug - - - 2.5 - - - - 0.1 0.9 - - 0.0 1.3 - - - - 0.1
Partesh - - - 1.8 - 0.0 - 0.0 - 0.0 0.0 - - 6.7 - - - 0.0 0.0
Kllokot - 0.0 - 0.6 - 0.1 0.1 - 0.0 0.0 0.0 - 0.0 0.3 0.0 - - 0.0 0.1
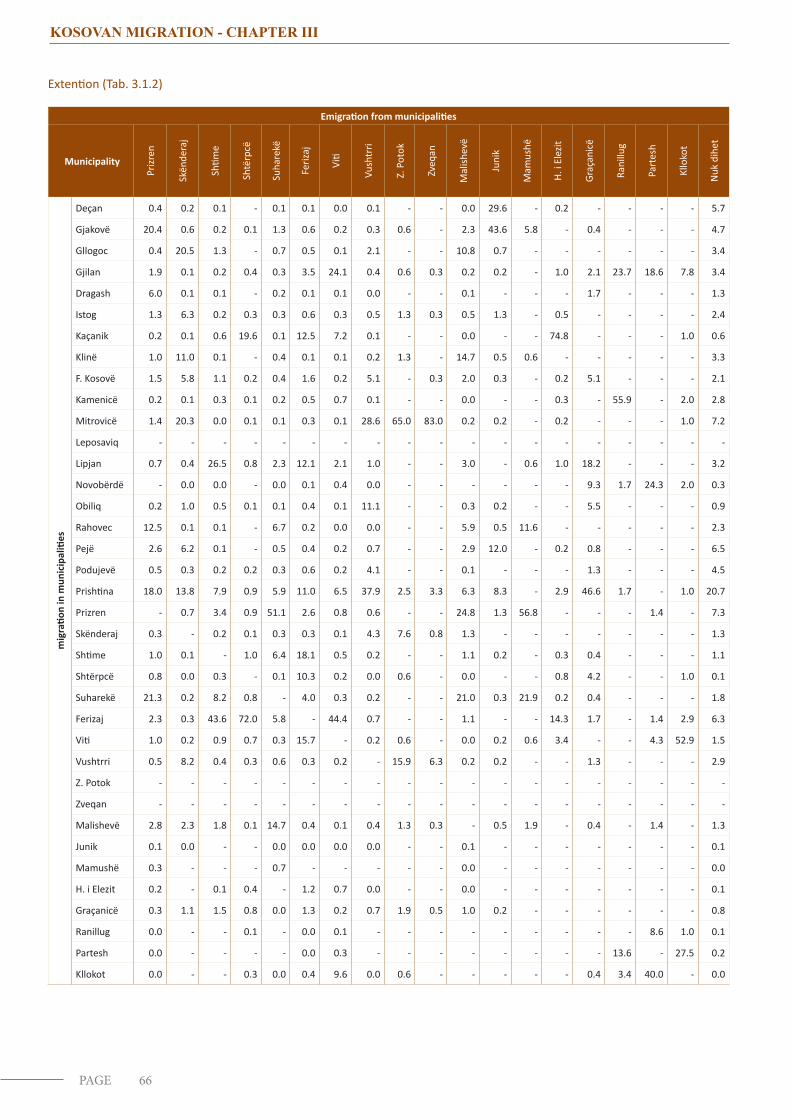
66PAGE
KOSOVAN MIGRATION - CHAPTER III
Extention (Tab. 3.1.2)
Emigration from municipalities
MunicipalityPr
izren
Skën
dera
j
Shtim
e
Shtë
rpcë
Suha
rekë
Feriz
aj
Viti
Vush
trri
Z. P
otok
Zveq
an
Mal
ishev
ë
Juni
k
Mam
ushë
H. i
Elez
it
Graç
anic
ë
Rani
llug
Part
esh
Kllo
kot
Nuk
dih
et
mig
ratio
n in
mun
icip
aliti
es
Deçan 0.4 0.2 0.1 - 0.1 0.1 0.0 0.1 - - 0.0 29.6 - 0.2 - - - - 5.7
Gjakovë 20.4 0.6 0.2 0.1 1.3 0.6 0.2 0.3 0.6 - 2.3 43.6 5.8 - 0.4 - - - 4.7
Gllogoc 0.4 20.5 1.3 - 0.7 0.5 0.1 2.1 - - 10.8 0.7 - - - - - - 3.4
Gjilan 1.9 0.1 0.2 0.4 0.3 3.5 24.1 0.4 0.6 0.3 0.2 0.2 - 1.0 2.1 23.7 18.6 7.8 3.4
Dragash 6.0 0.1 0.1 - 0.2 0.1 0.1 0.0 - - 0.1 - - - 1.7 - - - 1.3
Istog 1.3 6.3 0.2 0.3 0.3 0.6 0.3 0.5 1.3 0.3 0.5 1.3 - 0.5 - - - - 2.4
Kaçanik 0.2 0.1 0.6 19.6 0.1 12.5 7.2 0.1 - - 0.0 - - 74.8 - - - 1.0 0.6
Klinë 1.0 11.0 0.1 - 0.4 0.1 0.1 0.2 1.3 - 14.7 0.5 0.6 - - - - - 3.3
F. Kosovë 1.5 5.8 1.1 0.2 0.4 1.6 0.2 5.1 - 0.3 2.0 0.3 - 0.2 5.1 - - - 2.1
Kamenicë 0.2 0.1 0.3 0.1 0.2 0.5 0.7 0.1 - - 0.0 - - 0.3 - 55.9 - 2.0 2.8
Mitrovicë 1.4 20.3 0.0 0.1 0.1 0.3 0.1 28.6 65.0 83.0 0.2 0.2 - 0.2 - - - 1.0 7.2
Leposaviq - - - - - - - - - - - - - - - - - - -
Lipjan 0.7 0.4 26.5 0.8 2.3 12.1 2.1 1.0 - - 3.0 - 0.6 1.0 18.2 - - - 3.2
Novobërdë - 0.0 0.0 - 0.0 0.1 0.4 0.0 - - - - - - 9.3 1.7 24.3 2.0 0.3
Obiliq 0.2 1.0 0.5 0.1 0.1 0.4 0.1 11.1 - - 0.3 0.2 - - 5.5 - - - 0.9
Rahovec 12.5 0.1 0.1 - 6.7 0.2 0.0 0.0 - - 5.9 0.5 11.6 - - - - - 2.3
Pejë 2.6 6.2 0.1 - 0.5 0.4 0.2 0.7 - - 2.9 12.0 - 0.2 0.8 - - - 6.5
Podujevë 0.5 0.3 0.2 0.2 0.3 0.6 0.2 4.1 - - 0.1 - - - 1.3 - - - 4.5
Prishtina 18.0 13.8 7.9 0.9 5.9 11.0 6.5 37.9 2.5 3.3 6.3 8.3 - 2.9 46.6 1.7 - 1.0 20.7
Prizren - 0.7 3.4 0.9 51.1 2.6 0.8 0.6 - - 24.8 1.3 56.8 - - - 1.4 - 7.3
Skënderaj 0.3 - 0.2 0.1 0.3 0.3 0.1 4.3 7.6 0.8 1.3 - - - - - - - 1.3
Shtime 1.0 0.1 - 1.0 6.4 18.1 0.5 0.2 - - 1.1 0.2 - 0.3 0.4 - - - 1.1
Shtërpcë 0.8 0.0 0.3 - 0.1 10.3 0.2 0.0 0.6 - 0.0 - - 0.8 4.2 - - 1.0 0.1
Suharekë 21.3 0.2 8.2 0.8 - 4.0 0.3 0.2 - - 21.0 0.3 21.9 0.2 0.4 - - - 1.8
Ferizaj 2.3 0.3 43.6 72.0 5.8 - 44.4 0.7 - - 1.1 - - 14.3 1.7 - 1.4 2.9 6.3
Viti 1.0 0.2 0.9 0.7 0.3 15.7 - 0.2 0.6 - 0.0 0.2 0.6 3.4 - - 4.3 52.9 1.5
Vushtrri 0.5 8.2 0.4 0.3 0.6 0.3 0.2 - 15.9 6.3 0.2 0.2 - - 1.3 - - - 2.9
Z. Potok - - - - - - - - - - - - - - - - - - -
Zveqan - - - - - - - - - - - - - - - - - - -
Malishevë 2.8 2.3 1.8 0.1 14.7 0.4 0.1 0.4 1.3 0.3 - 0.5 1.9 - 0.4 - 1.4 - 1.3
Junik 0.1 0.0 - - 0.0 0.0 0.0 0.0 - - 0.1 - - - - - - - 0.1
Mamushë 0.3 - - - 0.7 - - - - - 0.0 - - - - - - - 0.0
H. i Elezit 0.2 - 0.1 0.4 - 1.2 0.7 0.0 - - 0.0 - - - - - - - 0.1
Graçanicë 0.3 1.1 1.5 0.8 0.0 1.3 0.2 0.7 1.9 0.5 1.0 0.2 - - - - - - 0.8
Ranillug 0.0 - - 0.1 - 0.0 0.1 - - - - - - - - - 8.6 1.0 0.1
Partesh 0.0 - - - - 0.0 0.3 - - - - - - - - 13.6 - 27.5 0.2
Kllokot 0.0 - - 0.3 0.0 0.4 9.6 0.0 0.6 - - - - - 0.4 3.4 40.0 - 0.0
67PAGE
KOSOVAN MIGRATION - CHAPTER III
TABLES
INTERNAL MIGRATION
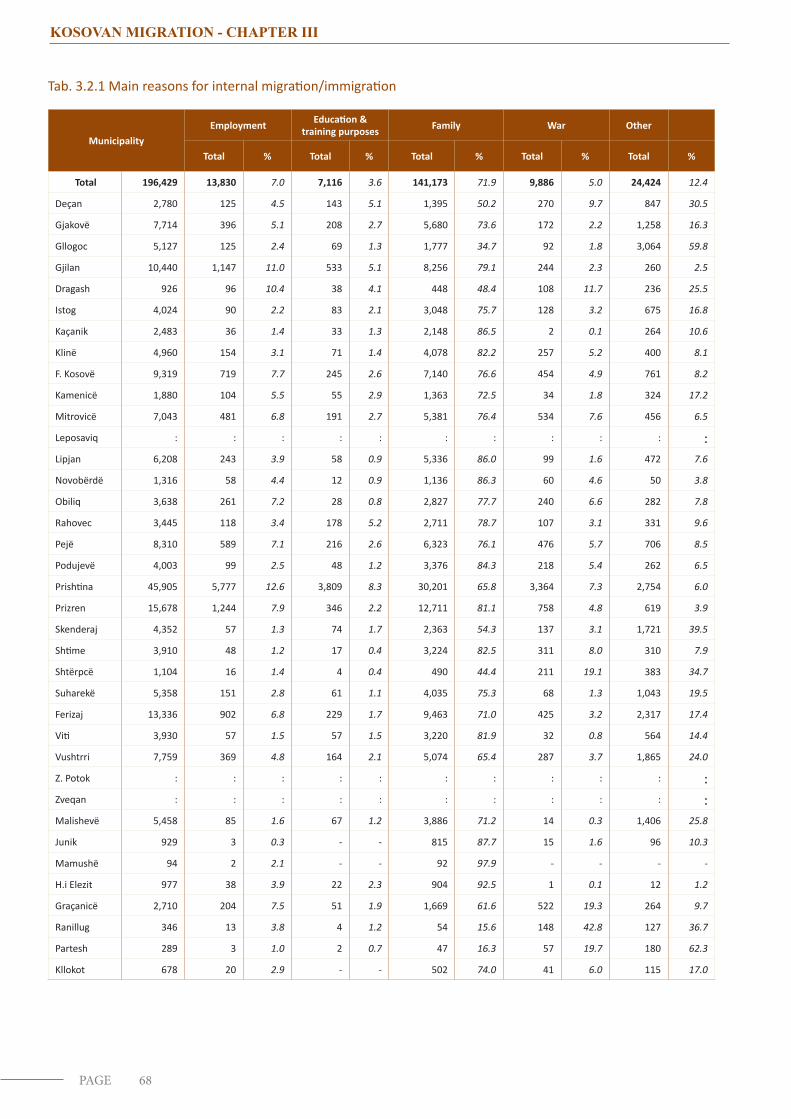
68PAGE
KOSOVAN MIGRATION - CHAPTER III
Tab. 3.2.1 Main reasons for internal migration/immigration
MunicipalityEmployment Education &
training purposes Family War Other
Total % Total % Total % Total % Total %
Total 196,429 13,830 7.0 7,116 3.6 141,173 71.9 9,886 5.0 24,424 12.4
Deçan 2,780 125 4.5 143 5.1 1,395 50.2 270 9.7 847 30.5
Gjakovë 7,714 396 5.1 208 2.7 5,680 73.6 172 2.2 1,258 16.3
Gllogoc 5,127 125 2.4 69 1.3 1,777 34.7 92 1.8 3,064 59.8
Gjilan 10,440 1,147 11.0 533 5.1 8,256 79.1 244 2.3 260 2.5
Dragash 926 96 10.4 38 4.1 448 48.4 108 11.7 236 25.5
Istog 4,024 90 2.2 83 2.1 3,048 75.7 128 3.2 675 16.8
Kaçanik 2,483 36 1.4 33 1.3 2,148 86.5 2 0.1 264 10.6
Klinë 4,960 154 3.1 71 1.4 4,078 82.2 257 5.2 400 8.1
F. Kosovë 9,319 719 7.7 245 2.6 7,140 76.6 454 4.9 761 8.2
Kamenicë 1,880 104 5.5 55 2.9 1,363 72.5 34 1.8 324 17.2
Mitrovicë 7,043 481 6.8 191 2.7 5,381 76.4 534 7.6 456 6.5
Leposaviq : : : : : : : : : : :Lipjan 6,208 243 3.9 58 0.9 5,336 86.0 99 1.6 472 7.6
Novobërdë 1,316 58 4.4 12 0.9 1,136 86.3 60 4.6 50 3.8
Obiliq 3,638 261 7.2 28 0.8 2,827 77.7 240 6.6 282 7.8
Rahovec 3,445 118 3.4 178 5.2 2,711 78.7 107 3.1 331 9.6
Pejë 8,310 589 7.1 216 2.6 6,323 76.1 476 5.7 706 8.5
Podujevë 4,003 99 2.5 48 1.2 3,376 84.3 218 5.4 262 6.5
Prishtina 45,905 5,777 12.6 3,809 8.3 30,201 65.8 3,364 7.3 2,754 6.0
Prizren 15,678 1,244 7.9 346 2.2 12,711 81.1 758 4.8 619 3.9
Skenderaj 4,352 57 1.3 74 1.7 2,363 54.3 137 3.1 1,721 39.5
Shtime 3,910 48 1.2 17 0.4 3,224 82.5 311 8.0 310 7.9
Shtërpcë 1,104 16 1.4 4 0.4 490 44.4 211 19.1 383 34.7
Suharekë 5,358 151 2.8 61 1.1 4,035 75.3 68 1.3 1,043 19.5
Ferizaj 13,336 902 6.8 229 1.7 9,463 71.0 425 3.2 2,317 17.4
Viti 3,930 57 1.5 57 1.5 3,220 81.9 32 0.8 564 14.4
Vushtrri 7,759 369 4.8 164 2.1 5,074 65.4 287 3.7 1,865 24.0
Z. Potok : : : : : : : : : : :Zveqan : : : : : : : : : : :Malishevë 5,458 85 1.6 67 1.2 3,886 71.2 14 0.3 1,406 25.8
Junik 929 3 0.3 - - 815 87.7 15 1.6 96 10.3
Mamushë 94 2 2.1 - - 92 97.9 - - - -
H.i Elezit 977 38 3.9 22 2.3 904 92.5 1 0.1 12 1.2
Graçanicë 2,710 204 7.5 51 1.9 1,669 61.6 522 19.3 264 9.7
Ranillug 346 13 3.8 4 1.2 54 15.6 148 42.8 127 36.7
Partesh 289 3 1.0 2 0.7 47 16.3 57 19.7 180 62.3
Kllokot 678 20 2.9 - - 502 74.0 41 6.0 115 17.0
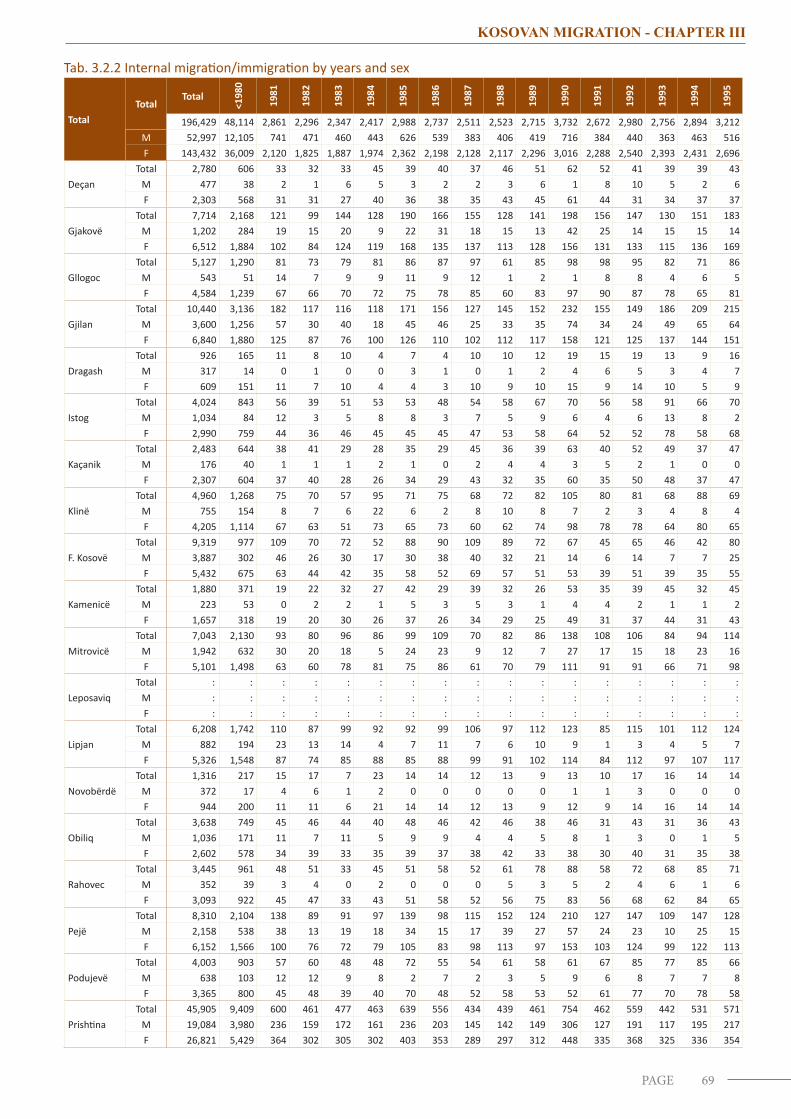
69PAGE
KOSOVAN MIGRATION - CHAPTER III
Tab. 3.2.2 Internal migration/immigration by years and sex
TotalTotal
Total
<198
0
1981
1982
1983
1984
1985
1986
1987
1988
1989
1990
1991
1992
1993
1994
1995
196,429 48,114 2,861 2,296 2,347 2,417 2,988 2,737 2,511 2,523 2,715 3,732 2,672 2,980 2,756 2,894 3,212M 52,997 12,105 741 471 460 443 626 539 383 406 419 716 384 440 363 463 516F 143,432 36,009 2,120 1,825 1,887 1,974 2,362 2,198 2,128 2,117 2,296 3,016 2,288 2,540 2,393 2,431 2,696
DeçanTotal 2,780 606 33 32 33 45 39 40 37 46 51 62 52 41 39 39 43
M 477 38 2 1 6 5 3 2 2 3 6 1 8 10 5 2 6F 2,303 568 31 31 27 40 36 38 35 43 45 61 44 31 34 37 37
GjakovëTotal 7,714 2,168 121 99 144 128 190 166 155 128 141 198 156 147 130 151 183
M 1,202 284 19 15 20 9 22 31 18 15 13 42 25 14 15 15 14F 6,512 1,884 102 84 124 119 168 135 137 113 128 156 131 133 115 136 169
GllogocTotal 5,127 1,290 81 73 79 81 86 87 97 61 85 98 98 95 82 71 86
M 543 51 14 7 9 9 11 9 12 1 2 1 8 8 4 6 5F 4,584 1,239 67 66 70 72 75 78 85 60 83 97 90 87 78 65 81
GjilanTotal 10,440 3,136 182 117 116 118 171 156 127 145 152 232 155 149 186 209 215
M 3,600 1,256 57 30 40 18 45 46 25 33 35 74 34 24 49 65 64F 6,840 1,880 125 87 76 100 126 110 102 112 117 158 121 125 137 144 151
DragashTotal 926 165 11 8 10 4 7 4 10 10 12 19 15 19 13 9 16
M 317 14 0 1 0 0 3 1 0 1 2 4 6 5 3 4 7F 609 151 11 7 10 4 4 3 10 9 10 15 9 14 10 5 9
IstogTotal 4,024 843 56 39 51 53 53 48 54 58 67 70 56 58 91 66 70
M 1,034 84 12 3 5 8 8 3 7 5 9 6 4 6 13 8 2F 2,990 759 44 36 46 45 45 45 47 53 58 64 52 52 78 58 68
KaçanikTotal 2,483 644 38 41 29 28 35 29 45 36 39 63 40 52 49 37 47
M 176 40 1 1 1 2 1 0 2 4 4 3 5 2 1 0 0F 2,307 604 37 40 28 26 34 29 43 32 35 60 35 50 48 37 47
KlinëTotal 4,960 1,268 75 70 57 95 71 75 68 72 82 105 80 81 68 88 69
M 755 154 8 7 6 22 6 2 8 10 8 7 2 3 4 8 4F 4,205 1,114 67 63 51 73 65 73 60 62 74 98 78 78 64 80 65
F. KosovëTotal 9,319 977 109 70 72 52 88 90 109 89 72 67 45 65 46 42 80
M 3,887 302 46 26 30 17 30 38 40 32 21 14 6 14 7 7 25F 5,432 675 63 44 42 35 58 52 69 57 51 53 39 51 39 35 55
KamenicëTotal 1,880 371 19 22 32 27 42 29 39 32 26 53 35 39 45 32 45
M 223 53 0 2 2 1 5 3 5 3 1 4 4 2 1 1 2F 1,657 318 19 20 30 26 37 26 34 29 25 49 31 37 44 31 43
MitrovicëTotal 7,043 2,130 93 80 96 86 99 109 70 82 86 138 108 106 84 94 114
M 1,942 632 30 20 18 5 24 23 9 12 7 27 17 15 18 23 16F 5,101 1,498 63 60 78 81 75 86 61 70 79 111 91 91 66 71 98
LeposaviqTotal : : : : : : : : : : : : : : : : :
M : : : : : : : : : : : : : : : : :F : : : : : : : : : : : : : : : : :
LipjanTotal 6,208 1,742 110 87 99 92 92 99 106 97 112 123 85 115 101 112 124
M 882 194 23 13 14 4 7 11 7 6 10 9 1 3 4 5 7F 5,326 1,548 87 74 85 88 85 88 99 91 102 114 84 112 97 107 117
NovobërdëTotal 1,316 217 15 17 7 23 14 14 12 13 9 13 10 17 16 14 14
M 372 17 4 6 1 2 0 0 0 0 0 1 1 3 0 0 0F 944 200 11 11 6 21 14 14 12 13 9 12 9 14 16 14 14
ObiliqTotal 3,638 749 45 46 44 40 48 46 42 46 38 46 31 43 31 36 43
M 1,036 171 11 7 11 5 9 9 4 4 5 8 1 3 0 1 5F 2,602 578 34 39 33 35 39 37 38 42 33 38 30 40 31 35 38
RahovecTotal 3,445 961 48 51 33 45 51 58 52 61 78 88 58 72 68 85 71
M 352 39 3 4 0 2 0 0 0 5 3 5 2 4 6 1 6F 3,093 922 45 47 33 43 51 58 52 56 75 83 56 68 62 84 65
PejëTotal 8,310 2,104 138 89 91 97 139 98 115 152 124 210 127 147 109 147 128
M 2,158 538 38 13 19 18 34 15 17 39 27 57 24 23 10 25 15F 6,152 1,566 100 76 72 79 105 83 98 113 97 153 103 124 99 122 113
PodujevëTotal 4,003 903 57 60 48 48 72 55 54 61 58 61 67 85 77 85 66
M 638 103 12 12 9 8 2 7 2 3 5 9 6 8 7 7 8F 3,365 800 45 48 39 40 70 48 52 58 53 52 61 77 70 78 58
PrishtinaTotal 45,905 9,409 600 461 477 463 639 556 434 439 461 754 462 559 442 531 571
M 19,084 3,980 236 159 172 161 236 203 145 142 149 306 127 191 117 195 217F 26,821 5,429 364 302 305 302 403 353 289 297 312 448 335 368 325 336 354
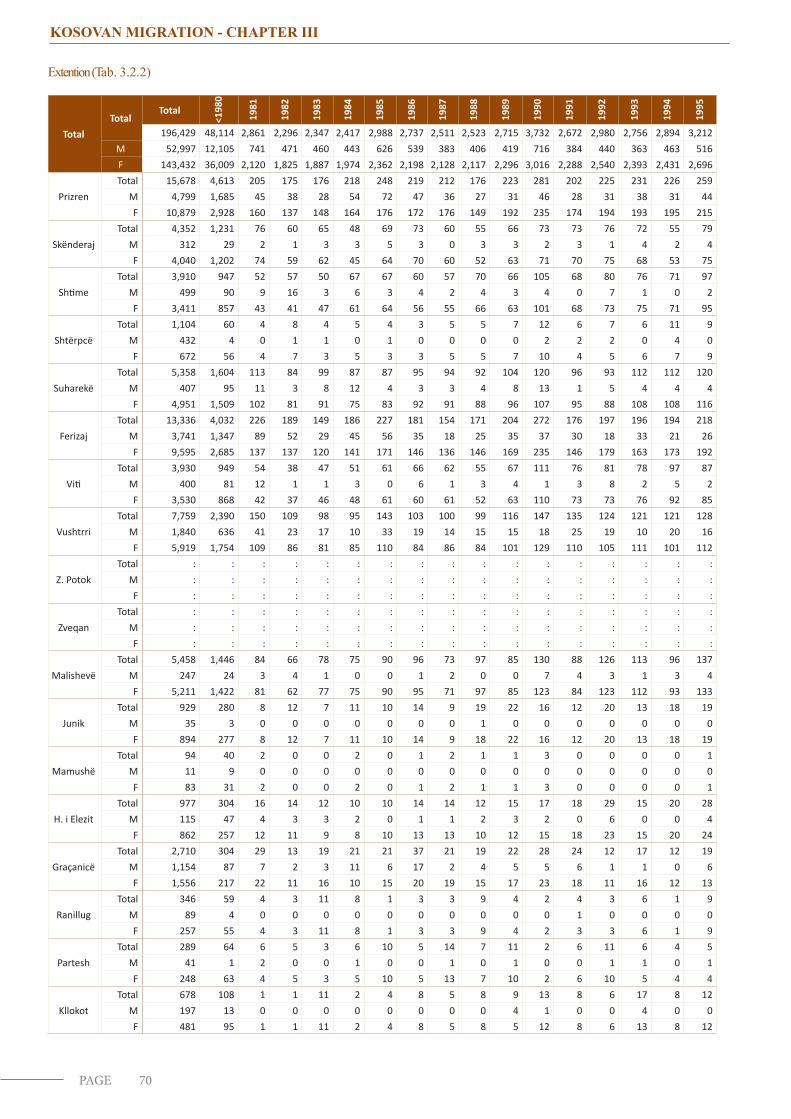
70PAGE
KOSOVAN MIGRATION - CHAPTER III
Extention (Tab. 3.2.2)
TotalTotal
Total
<198
0
1981
1982
1983
1984
1985
1986
1987
1988
1989
1990
1991
1992
1993
1994
1995
196,429 48,114 2,861 2,296 2,347 2,417 2,988 2,737 2,511 2,523 2,715 3,732 2,672 2,980 2,756 2,894 3,212M 52,997 12,105 741 471 460 443 626 539 383 406 419 716 384 440 363 463 516F 143,432 36,009 2,120 1,825 1,887 1,974 2,362 2,198 2,128 2,117 2,296 3,016 2,288 2,540 2,393 2,431 2,696
PrizrenTotal 15,678 4,613 205 175 176 218 248 219 212 176 223 281 202 225 231 226 259
M 4,799 1,685 45 38 28 54 72 47 36 27 31 46 28 31 38 31 44F 10,879 2,928 160 137 148 164 176 172 176 149 192 235 174 194 193 195 215
SkënderajTotal 4,352 1,231 76 60 65 48 69 73 60 55 66 73 73 76 72 55 79
M 312 29 2 1 3 3 5 3 0 3 3 2 3 1 4 2 4F 4,040 1,202 74 59 62 45 64 70 60 52 63 71 70 75 68 53 75
ShtimeTotal 3,910 947 52 57 50 67 67 60 57 70 66 105 68 80 76 71 97
M 499 90 9 16 3 6 3 4 2 4 3 4 0 7 1 0 2F 3,411 857 43 41 47 61 64 56 55 66 63 101 68 73 75 71 95
ShtërpcëTotal 1,104 60 4 8 4 5 4 3 5 5 7 12 6 7 6 11 9
M 432 4 0 1 1 0 1 0 0 0 0 2 2 2 0 4 0F 672 56 4 7 3 5 3 3 5 5 7 10 4 5 6 7 9
SuharekëTotal 5,358 1,604 113 84 99 87 87 95 94 92 104 120 96 93 112 112 120
M 407 95 11 3 8 12 4 3 3 4 8 13 1 5 4 4 4F 4,951 1,509 102 81 91 75 83 92 91 88 96 107 95 88 108 108 116
FerizajTotal 13,336 4,032 226 189 149 186 227 181 154 171 204 272 176 197 196 194 218
M 3,741 1,347 89 52 29 45 56 35 18 25 35 37 30 18 33 21 26F 9,595 2,685 137 137 120 141 171 146 136 146 169 235 146 179 163 173 192
VitiTotal 3,930 949 54 38 47 51 61 66 62 55 67 111 76 81 78 97 87
M 400 81 12 1 1 3 0 6 1 3 4 1 3 8 2 5 2F 3,530 868 42 37 46 48 61 60 61 52 63 110 73 73 76 92 85
VushtrriTotal 7,759 2,390 150 109 98 95 143 103 100 99 116 147 135 124 121 121 128
M 1,840 636 41 23 17 10 33 19 14 15 15 18 25 19 10 20 16F 5,919 1,754 109 86 81 85 110 84 86 84 101 129 110 105 111 101 112
Z. PotokTotal : : : : : : : : : : : : : : : : :
M : : : : : : : : : : : : : : : : :F : : : : : : : : : : : : : : : : :
ZveqanTotal : : : : : : : : : : : : : : : : :
M : : : : : : : : : : : : : : : : :F : : : : : : : : : : : : : : : : :
MalishevëTotal 5,458 1,446 84 66 78 75 90 96 73 97 85 130 88 126 113 96 137
M 247 24 3 4 1 0 0 1 2 0 0 7 4 3 1 3 4F 5,211 1,422 81 62 77 75 90 95 71 97 85 123 84 123 112 93 133
JunikTotal 929 280 8 12 7 11 10 14 9 19 22 16 12 20 13 18 19
M 35 3 0 0 0 0 0 0 0 1 0 0 0 0 0 0 0F 894 277 8 12 7 11 10 14 9 18 22 16 12 20 13 18 19
MamushëTotal 94 40 2 0 0 2 0 1 2 1 1 3 0 0 0 0 1
M 11 9 0 0 0 0 0 0 0 0 0 0 0 0 0 0 0F 83 31 2 0 0 2 0 1 2 1 1 3 0 0 0 0 1
H. i ElezitTotal 977 304 16 14 12 10 10 14 14 12 15 17 18 29 15 20 28
M 115 47 4 3 3 2 0 1 1 2 3 2 0 6 0 0 4F 862 257 12 11 9 8 10 13 13 10 12 15 18 23 15 20 24
GraçanicëTotal 2,710 304 29 13 19 21 21 37 21 19 22 28 24 12 17 12 19
M 1,154 87 7 2 3 11 6 17 2 4 5 5 6 1 1 0 6F 1,556 217 22 11 16 10 15 20 19 15 17 23 18 11 16 12 13
RanillugTotal 346 59 4 3 11 8 1 3 3 9 4 2 4 3 6 1 9
M 89 4 0 0 0 0 0 0 0 0 0 0 1 0 0 0 0F 257 55 4 3 11 8 1 3 3 9 4 2 3 3 6 1 9
ParteshTotal 289 64 6 5 3 6 10 5 14 7 11 2 6 11 6 4 5
M 41 1 2 0 0 1 0 0 1 0 1 0 0 1 1 0 1F 248 63 4 5 3 5 10 5 13 7 10 2 6 10 5 4 4
KllokotTotal 678 108 1 1 11 2 4 8 5 8 9 13 8 6 17 8 12
M 197 13 0 0 0 0 0 0 0 0 4 1 0 0 4 0 0F 481 95 1 1 11 2 4 8 5 8 5 12 8 6 13 8 12
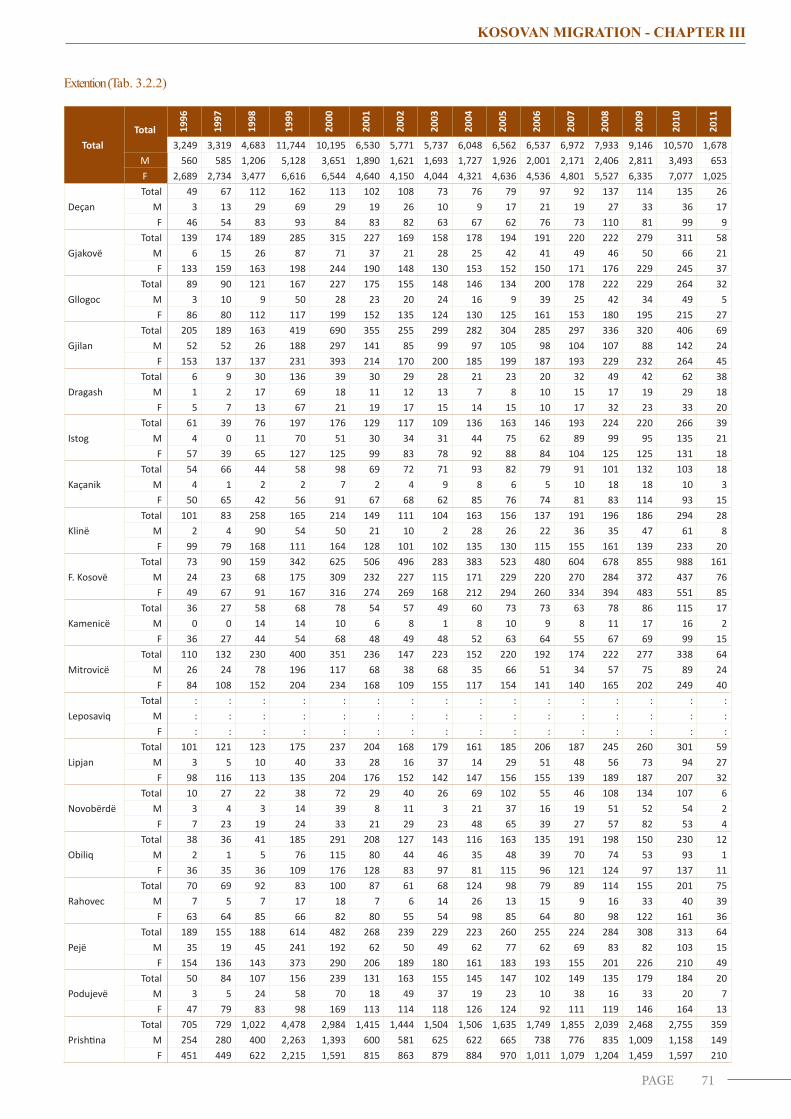
71PAGE
KOSOVAN MIGRATION - CHAPTER III
Extention (Tab. 3.2.2)
TotalTotal 19
96
1997
1998
1999
2000
2001
2002
2003
2004
2005
2006
2007
2008
2009
2010
2011
3,249 3,319 4,683 11,744 10,195 6,530 5,771 5,737 6,048 6,562 6,537 6,972 7,933 9,146 10,570 1,678M 560 585 1,206 5,128 3,651 1,890 1,621 1,693 1,727 1,926 2,001 2,171 2,406 2,811 3,493 653F 2,689 2,734 3,477 6,616 6,544 4,640 4,150 4,044 4,321 4,636 4,536 4,801 5,527 6,335 7,077 1,025
DeçanTotal 49 67 112 162 113 102 108 73 76 79 97 92 137 114 135 26
M 3 13 29 69 29 19 26 10 9 17 21 19 27 33 36 17F 46 54 83 93 84 83 82 63 67 62 76 73 110 81 99 9
GjakovëTotal 139 174 189 285 315 227 169 158 178 194 191 220 222 279 311 58
M 6 15 26 87 71 37 21 28 25 42 41 49 46 50 66 21F 133 159 163 198 244 190 148 130 153 152 150 171 176 229 245 37
GllogocTotal 89 90 121 167 227 175 155 148 146 134 200 178 222 229 264 32
M 3 10 9 50 28 23 20 24 16 9 39 25 42 34 49 5F 86 80 112 117 199 152 135 124 130 125 161 153 180 195 215 27
GjilanTotal 205 189 163 419 690 355 255 299 282 304 285 297 336 320 406 69
M 52 52 26 188 297 141 85 99 97 105 98 104 107 88 142 24F 153 137 137 231 393 214 170 200 185 199 187 193 229 232 264 45
DragashTotal 6 9 30 136 39 30 29 28 21 23 20 32 49 42 62 38
M 1 2 17 69 18 11 12 13 7 8 10 15 17 19 29 18F 5 7 13 67 21 19 17 15 14 15 10 17 32 23 33 20
IstogTotal 61 39 76 197 176 129 117 109 136 163 146 193 224 220 266 39
M 4 0 11 70 51 30 34 31 44 75 62 89 99 95 135 21F 57 39 65 127 125 99 83 78 92 88 84 104 125 125 131 18
KaçanikTotal 54 66 44 58 98 69 72 71 93 82 79 91 101 132 103 18
M 4 1 2 2 7 2 4 9 8 6 5 10 18 18 10 3F 50 65 42 56 91 67 68 62 85 76 74 81 83 114 93 15
KlinëTotal 101 83 258 165 214 149 111 104 163 156 137 191 196 186 294 28
M 2 4 90 54 50 21 10 2 28 26 22 36 35 47 61 8F 99 79 168 111 164 128 101 102 135 130 115 155 161 139 233 20
F. KosovëTotal 73 90 159 342 625 506 496 283 383 523 480 604 678 855 988 161
M 24 23 68 175 309 232 227 115 171 229 220 270 284 372 437 76F 49 67 91 167 316 274 269 168 212 294 260 334 394 483 551 85
KamenicëTotal 36 27 58 68 78 54 57 49 60 73 73 63 78 86 115 17
M 0 0 14 14 10 6 8 1 8 10 9 8 11 17 16 2F 36 27 44 54 68 48 49 48 52 63 64 55 67 69 99 15
MitrovicëTotal 110 132 230 400 351 236 147 223 152 220 192 174 222 277 338 64
M 26 24 78 196 117 68 38 68 35 66 51 34 57 75 89 24F 84 108 152 204 234 168 109 155 117 154 141 140 165 202 249 40
LeposaviqTotal : : : : : : : : : : : : : : : :
M : : : : : : : : : : : : : : : :F : : : : : : : : : : : : : : : :
LipjanTotal 101 121 123 175 237 204 168 179 161 185 206 187 245 260 301 59
M 3 5 10 40 33 28 16 37 14 29 51 48 56 73 94 27F 98 116 113 135 204 176 152 142 147 156 155 139 189 187 207 32
NovobërdëTotal 10 27 22 38 72 29 40 26 69 102 55 46 108 134 107 6
M 3 4 3 14 39 8 11 3 21 37 16 19 51 52 54 2F 7 23 19 24 33 21 29 23 48 65 39 27 57 82 53 4
ObiliqTotal 38 36 41 185 291 208 127 143 116 163 135 191 198 150 230 12
M 2 1 5 76 115 80 44 46 35 48 39 70 74 53 93 1F 36 35 36 109 176 128 83 97 81 115 96 121 124 97 137 11
RahovecTotal 70 69 92 83 100 87 61 68 124 98 79 89 114 155 201 75
M 7 5 7 17 18 7 6 14 26 13 15 9 16 33 40 39F 63 64 85 66 82 80 55 54 98 85 64 80 98 122 161 36
PejëTotal 189 155 188 614 482 268 239 229 223 260 255 224 284 308 313 64
M 35 19 45 241 192 62 50 49 62 77 62 69 83 82 103 15F 154 136 143 373 290 206 189 180 161 183 193 155 201 226 210 49
PodujevëTotal 50 84 107 156 239 131 163 155 145 147 102 149 135 179 184 20
M 3 5 24 58 70 18 49 37 19 23 10 38 16 33 20 7F 47 79 83 98 169 113 114 118 126 124 92 111 119 146 164 13
PrishtinaTotal 705 729 1,022 4,478 2,984 1,415 1,444 1,504 1,506 1,635 1,749 1,855 2,039 2,468 2,755 359
M 254 280 400 2,263 1,393 600 581 625 622 665 738 776 835 1,009 1,158 149F 451 449 622 2,215 1,591 815 863 879 884 970 1,011 1,079 1,204 1,459 1,597 210
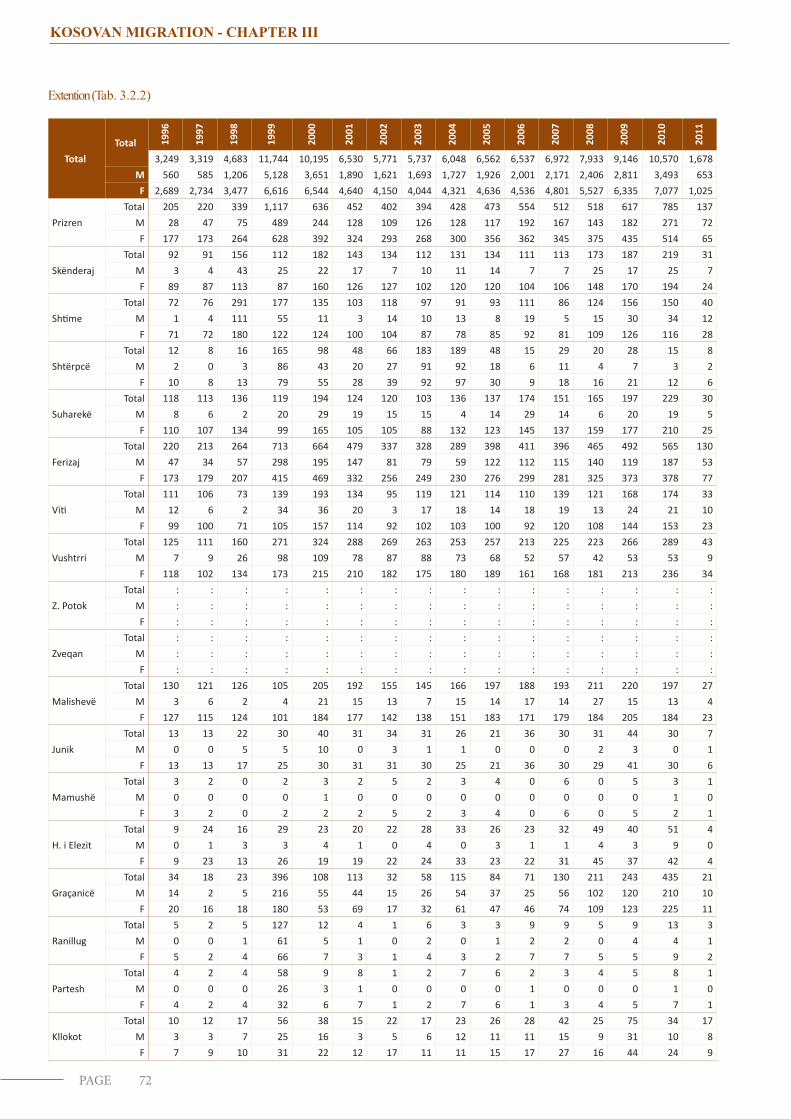
72PAGE
KOSOVAN MIGRATION - CHAPTER III
Extention (Tab. 3.2.2)
TotalTotal 19
96
1997
1998
1999
2000
2001
2002
2003
2004
2005
2006
2007
2008
2009
2010
2011
3,249 3,319 4,683 11,744 10,195 6,530 5,771 5,737 6,048 6,562 6,537 6,972 7,933 9,146 10,570 1,678M 560 585 1,206 5,128 3,651 1,890 1,621 1,693 1,727 1,926 2,001 2,171 2,406 2,811 3,493 653F 2,689 2,734 3,477 6,616 6,544 4,640 4,150 4,044 4,321 4,636 4,536 4,801 5,527 6,335 7,077 1,025
PrizrenTotal 205 220 339 1,117 636 452 402 394 428 473 554 512 518 617 785 137
M 28 47 75 489 244 128 109 126 128 117 192 167 143 182 271 72F 177 173 264 628 392 324 293 268 300 356 362 345 375 435 514 65
SkënderajTotal 92 91 156 112 182 143 134 112 131 134 111 113 173 187 219 31
M 3 4 43 25 22 17 7 10 11 14 7 7 25 17 25 7F 89 87 113 87 160 126 127 102 120 120 104 106 148 170 194 24
ShtimeTotal 72 76 291 177 135 103 118 97 91 93 111 86 124 156 150 40
M 1 4 111 55 11 3 14 10 13 8 19 5 15 30 34 12F 71 72 180 122 124 100 104 87 78 85 92 81 109 126 116 28
ShtërpcëTotal 12 8 16 165 98 48 66 183 189 48 15 29 20 28 15 8
M 2 0 3 86 43 20 27 91 92 18 6 11 4 7 3 2F 10 8 13 79 55 28 39 92 97 30 9 18 16 21 12 6
SuharekëTotal 118 113 136 119 194 124 120 103 136 137 174 151 165 197 229 30
M 8 6 2 20 29 19 15 15 4 14 29 14 6 20 19 5F 110 107 134 99 165 105 105 88 132 123 145 137 159 177 210 25
FerizajTotal 220 213 264 713 664 479 337 328 289 398 411 396 465 492 565 130
M 47 34 57 298 195 147 81 79 59 122 112 115 140 119 187 53F 173 179 207 415 469 332 256 249 230 276 299 281 325 373 378 77
VitiTotal 111 106 73 139 193 134 95 119 121 114 110 139 121 168 174 33
M 12 6 2 34 36 20 3 17 18 14 18 19 13 24 21 10F 99 100 71 105 157 114 92 102 103 100 92 120 108 144 153 23
VushtrriTotal 125 111 160 271 324 288 269 263 253 257 213 225 223 266 289 43
M 7 9 26 98 109 78 87 88 73 68 52 57 42 53 53 9F 118 102 134 173 215 210 182 175 180 189 161 168 181 213 236 34
Z. PotokTotal : : : : : : : : : : : : : : : :
M : : : : : : : : : : : : : : : :F : : : : : : : : : : : : : : : :
ZveqanTotal : : : : : : : : : : : : : : : :
M : : : : : : : : : : : : : : : :F : : : : : : : : : : : : : : : :
MalishevëTotal 130 121 126 105 205 192 155 145 166 197 188 193 211 220 197 27
M 3 6 2 4 21 15 13 7 15 14 17 14 27 15 13 4F 127 115 124 101 184 177 142 138 151 183 171 179 184 205 184 23
JunikTotal 13 13 22 30 40 31 34 31 26 21 36 30 31 44 30 7
M 0 0 5 5 10 0 3 1 1 0 0 0 2 3 0 1F 13 13 17 25 30 31 31 30 25 21 36 30 29 41 30 6
MamushëTotal 3 2 0 2 3 2 5 2 3 4 0 6 0 5 3 1
M 0 0 0 0 1 0 0 0 0 0 0 0 0 0 1 0F 3 2 0 2 2 2 5 2 3 4 0 6 0 5 2 1
H. i ElezitTotal 9 24 16 29 23 20 22 28 33 26 23 32 49 40 51 4
M 0 1 3 3 4 1 0 4 0 3 1 1 4 3 9 0F 9 23 13 26 19 19 22 24 33 23 22 31 45 37 42 4
GraçanicëTotal 34 18 23 396 108 113 32 58 115 84 71 130 211 243 435 21
M 14 2 5 216 55 44 15 26 54 37 25 56 102 120 210 10F 20 16 18 180 53 69 17 32 61 47 46 74 109 123 225 11
RanillugTotal 5 2 5 127 12 4 1 6 3 3 9 9 5 9 13 3
M 0 0 1 61 5 1 0 2 0 1 2 2 0 4 4 1F 5 2 4 66 7 3 1 4 3 2 7 7 5 5 9 2
ParteshTotal 4 2 4 58 9 8 1 2 7 6 2 3 4 5 8 1
M 0 0 0 26 3 1 0 0 0 0 1 0 0 0 1 0F 4 2 4 32 6 7 1 2 7 6 1 3 4 5 7 1
KllokotTotal 10 12 17 56 38 15 22 17 23 26 28 42 25 75 34 17
M 3 3 7 25 16 3 5 6 12 11 11 15 9 31 10 8F 7 9 10 31 22 12 17 11 11 15 17 27 16 44 24 9

KOSOVAN MIGRATION
73PAGE
CHAPTER IV

75PAGE
KOSOVAN MIGRATION - CHAPTER IV
4.KOSOVAN POPULATION/ WITH KOSOVO ORIGIN
According to official data, the population Kosovo in April 2011 was 1,780,645 residents. The Kosovan migrant population, that was registered-counted in the ‘’supplementary list on household members living outside of Kosovo (FORM S1), applied in the 2011 Population Census, in total, was 380,826 residents.
According to KAS’ estimates (based on vital statistics, natural growth, fertility, the KAS’ surveys in previous years, 2011 Population Census, population projections 2011 - 2061) starting from 1969 , the representative number of the Kosovan population who had emigrated from Kosovo (from all communities) until April 2011 was estimated to be around 550.000 residents . Therefore, KAS will use this number as the basis when accounting Kosovo’s migrant population in the period 1969-2011, while in the future it will update the emigration data based on available data, respecting the best practices.
If children born outside of Kosovo, with at least one Kosovan parent, are included, the population of the Kosovo Diaspora will be significantly greater. Based on the rate of population growth and the tradition of Kosovan families, three variants of natural growth have been used for estimation (counting) of the population born outside of Kosovo.
According to the estimates, the rate of natural growth of Kosovan families living abroad (children born abroad) was almost constant (parallel) with the rate of natural growth in Kosovo. Since the population abroad had younger age-groups (young reproductive age emigrates more) natural growth may be slightly higher. However, other factors, such as: delayed marriage and a smaller number of children (of population outside of Kosovo), led to the approximation of the rate of natural growth abroad being similar to the natural growth in Kosovo. We have done the potential evaluation of the natural growth of the population of Kosovo born abroad with three variants for the period between 1969 and 2011
.
• According to the high variant of natural growth, the number of children born outside of Kosovo (1969-2011) by Kosovan migrants was estimated to be 172,520 children.
• According to the medium variant, the number of children born outside of Kosovo was estimated to be 153,978 children.
• According to the low variant, the number of children born outside Kosovo was estimated to be 112,625 children
KAS will use, for its needs as a representative value, the medium variant of natural growth which is 153,978 children born outside of Kosovo. Thus, the emigrated population of Kosovo and the population with Kosovan origin (1969-2011) was estimated to be around 703,978 residents
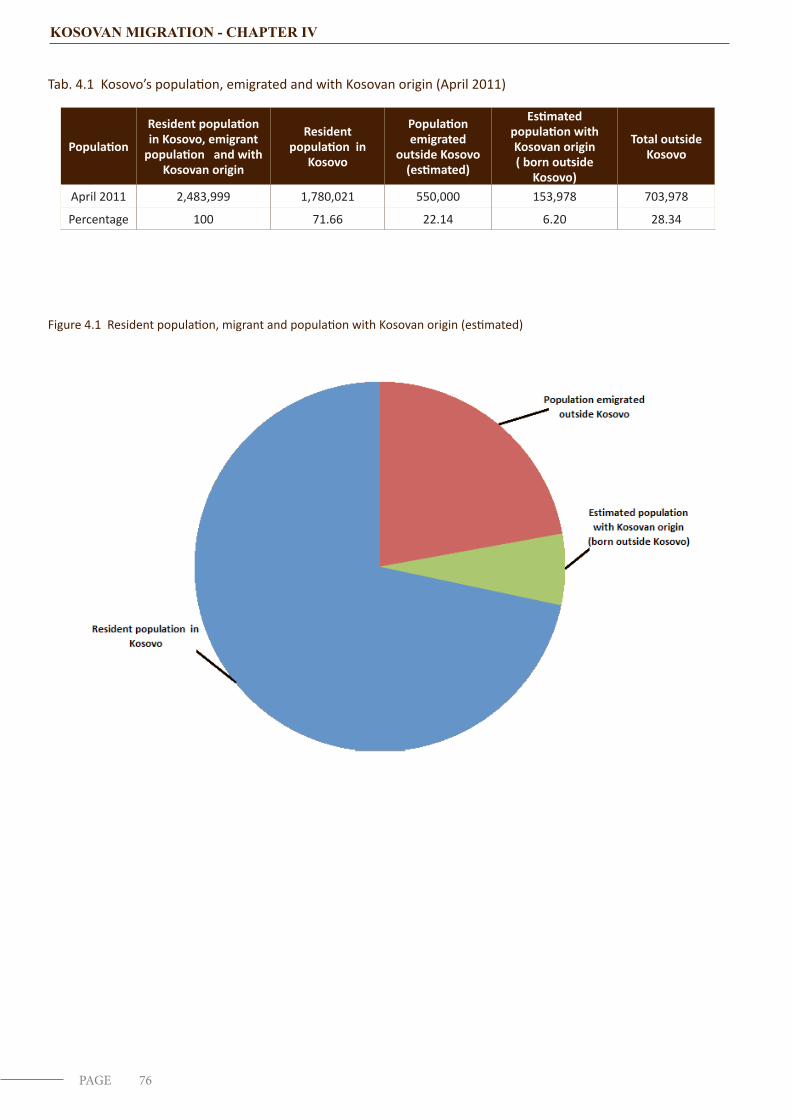
76PAGE
KOSOVAN MIGRATION - CHAPTER IV
Tab. 4.1 Kosovo’s population, emigrated and with Kosovan origin (April 2011)
Population
Resident population in Kosovo, emigrant
population and with Kosovan origin
Resident population in
Kosovo
Population emigrated
outside Kosovo (estimated)
Estimated population with Kosovan origin ( born outside
Kosovo)
Total outside Kosovo
April 2011 2,483,999 1,780,021 550,000 153,978 703,978
Percentage 100 71.66 22.14 6.20 28.34
Figure 4.1 Resident population, migrant and population with Kosovan origin (estimated)
77PAGE
KOSOVAN MIGRATION - CHAPTER IV
Important note
It is international standard, criteria, and practice to include the population of a country of only persons living within the country or residents (persons who have been settled there for more than a year or intend to reside there for more than a year).
This is due to the fact that all calculations of indicators in statistical terms are done for the resident population on calculations on: gender, age-group, fertility rate, level of education, employment, unemployment, the calculation of GDP, allocation of municipal budget, grants, donors, planning for kindergarten, schools, universities, planning of transportation, tourism, social aspect of housing conditions, heating, water supply, electricity, sewage system, and many other services.
If the Kosovan population living within Kosovo and the population with Kosovan origin living abroad were included in the resident population of Kosovo then all calculations based on those data (figures) would present biased figures.
Thus, if GDP per capita includes all Kosovans living worldwide, than Kosovo would be the poorest country in the planet. If children born abroad were included in these statistics, then planning for kindergartens, schools, and other institutions which they may attend, would not be realistic.
In addition, Kosovans living abroad are included in the population of the country where they live. Indeed, the main purpose of the population census was to determine the profile of residents of the country in order to assess the needs of the citizens of the country.
Therefore, the Population Census conducted in 2011 has followed international standards where the main goal of the countries during the population census is to enumerate the resident population.
Because the data on emigration is very much needed, in spite of all criteria, Kosovo applied a supplementary form for collecting data on the migrant population of Kosovo.
2 Source: Estimation, Kosovo population 2011. The number of resident population in Kosovo in April 2011. Final data and estimated data for 2011 by municipalities