Korsnäs AB - billerudkorsnas.com · 1 Contents Board of Directors, Senior Executives and Auditors...
39
KORSNäS AB Annual Report 2009 Corporate registration number 556023-8338
Transcript of Korsnäs AB - billerudkorsnas.com · 1 Contents Board of Directors, Senior Executives and Auditors...
Korsnäs AB
Annual Report 2009
Corporate registration number 556023-8338

1
Contents
Board of Directors, Senior Executives and Auditors 2
Annual and consolidated reports for 2009
Board of Directors’ report 3
Income statements, balance sheets and notes 9
Audit report 36
Definitions of financial key ratios 37
2
Board of Directors, Senior Executives and Auditors
Vigo Carlund
Chairman
Board member since 2001 and Chairman since 2002.
Born 1946. Member of the Board of Investment AB Kinnevik
since August 2006, President and CEo of Kinnevik 1999-
2006. Chairman of the Board of Tele2 AB since 2006 and
member of the Board since 1995. Member of the Board of
Academic Work solutions AB since 2006 and net Entertain-
ment nE AB since 2008. CEo of Korsnäs 1998-2000.
Mia Brunell Livfors
Board member since 2006.
studies Business Administration at stockholm University,
born 1965. President and CEo of Investment AB Kinnevik
since August 2006. Chairman of the Board of Metro Inter-
national s.A. since 2008, member of the Board since 2006.
Member of the Board of Mellersta sveriges Lantbruks AB
since 2006, Tele2 AB since 2006, Transcom WorldWide s.A.
since 2006, Millicom International Cellular s.A. since 2007,
Modern Times Group MTG AB since 2007 and H & M Hen-
nes & Mauritz AB since 2008.
Leif Brodén
Board member since 2007.
International Economics, Gothenburg school of Economics
and MBA stockholm school of Economics, born 1960. Presi-
dent and CEo of södra skogsägarna. Chairman of the Board
of the swedish Forest Industries Federation. Chairman of the
Board of södra Cell, södra Timber and Gapro. Member of the
Board of Växjö University.
Edvard von Horn
Board member between 1991-2000 and since 2002.
Degree in Agricultural rural Management, Alnarp, swedish
University of Agricultural sciences and B.sc. Lund University,
born 1943. Member of the Board of Investment AB Kinnevik
2004-2007 and Industriförvaltnings AB Kinnevik 1992-2004.
Chairman of the Board of Mellersta sveriges Lantbruks AB.
Ole Kjörrefjord
Board member since 2004.
MBA Harvard Business school, UsA, born 1955. Chairman of
the Board of Hector rail AB, Fleetech AB and Fleet 101 AB.
CEo of EuroMaint AB.
Wilhelm Klingspor
Board member 1999-2000 and since 2003.
Forest Engineer, skinnskatteberg, swedish University of
Agricultural sciences, born 1962. Member of the Board of
Investment AB Kinnevik since 2004, Industriförvaltnings AB
Kinnevik 1999-2004. CEo of Hellekis säteri AB.
Stig Nordin
Board member between 1992-2000 and since 2004.
M.sc. Engineering, Chalmers University of Technology, born
1943. Member of the Board of Investment AB Kinnevik since
2004 and Industriförvaltnings AB Kinnevik 1992-2004. Presi-
dent and CEo of Industriförvaltnings AB Kinnevik 1992-1999
and CEo of Korsnäs 1993-1998.
Cristina Stenbeck
Board member since 2003.
B.sc. Georgetown University, Washington DC, UsA, born
1977. Chairman of the Board of Investment AB Kinnevik
since 2007. Vice Chairman of Investment AB Kinnevik
2004-2007 and Industriförvaltnings AB Kinnevik 2003-2004.
Chairman of Emesco AB since 2002. Member of the Board
of Metro International s.A., Modern Times Group MTG AB,
Tele2 AB and Transcom WorldWide s.A. since 2003.
Ola Hallberg
Employee representative/Board member since 2007 and Em-
ployee representative/Deputy since 2006.
Timber Controller, born 1965.
Bo Myrberg
Employee representative/Deputy since 2009 and Employee
representative Board member since 2008.
Process operator, born 1967. Employee representative/Board
member in Investment AB Kinnevik since 2009 and was Em-
ployee representative/Deputy 2008.
Hans Holmén
Employee representative/Deputy since 2007. Mechanic, born
1955.
Per Eriksson
Employee representative/Board member since 2009 and Em-
ployee/Deputy since 2006.
Assistant boiler-man, born 1955.
Christer Simrén
Chief Executive Officer.
(not a member of the Board.)
Dr science Industrial Management and Economics and M.sc.
Electrical & Computer Engineering at Chalmers University
of Technology, BA Accounting and Financial Control at
Gothenburg school of Economics, born 1961. started present
position as Chief Executive officer of Korsnäs on september
1, 2008. Previously President and CEo of Wermland Paper
AB, President and CEo of Mediabricks (today Handmark
Us), vice President and CEo of Korsnäs 1999 2001, Mana-
ging Director Applied Value scandinavia, Managing Direc-
tor CHAMPs (Chalmers Advanced Management Programs).
Chairman of the Board of sia Latgran. Member of the Board
of AB Geveko.
AuditorsAt the Annual General Meeting 2008 the audit firm Ernst &
Young AB with Thomas Forslund as auditor in charge, was
appointed Company auditor for the period extending to the
close of the 2012 Annual General Meeting.
Thomas Forslund
Authorized Public Accountant, born 1965.
Thomas Forslund has audit engagements in a number of
listed companies such as Feelgood, systemair and WesC.
3
Board of Directors’ report
Korsnäs AB is a wholly-owned subsidiary of Investment
AB Kinnevik 556023-8338, corporate registration number
556047-9742 with registered office in stockholm.
The financial reports were approved by the Board on 22
February 2010 and the Board of Directors and CEo herewith
present the annual and consolidated financial statements for
the financial year 2009. The balance sheets and the income
statements for the Group and Parent Company will be
presented at the Annual General Meeting to be held on 23
February 2010 for approval.
Key date (SEK million) 2009 2008 1)
Revenue 8 039 7 396
Operating profit, EBIT 851 500
Investments in tangible fixed assets 740 171
Depreciation -611 -624
Operational capital employed, average 7 849 8 175
Return on operational capital employed 10,8% 6,1%
Number of employees 1 811 1 867
1) Excluding restructuring costs of SEK 71 million.
History Korsnäs was established as a company in 1855, with sawmill
operations commencing in 1858 in Korsnäs in the province
of Dalarna. In 1899, operations moved to Gävle and in 1910
pulp manufacturing got under way at the Korsnäs mill in
Gävle, followed in 1925 by the installation of the company’s
first paper machine. Paperboard and paper manufacturing
were steadily expanded to become Korsnäs’ primary ope-
rations and Korsnäs Industrial is today one of the leading
manufacturers of virgin fiber-based packaging materials,
primarily for consumer products. As part of the expansion in
packaging materials, Korsnäs acquired the Frövi paperboard
mill in 2006. The industrial operations center on the Korsnäs
mill in Gävle and on the production facility in Frövi with
annual capacity of 700 thousand tons and 425 thousand tons,
respectively, of paper and paperboard products. The com-
pany currently has four production machines: Paper Machine
(“PM”) 2, 4 and 5 in Gävle as well as the Board Machine
(“BM”) 5 in Frövi. The plant in Gävle is self-sufficient in pulp,
while the annual pulp capacity in Frövi is 300 thousand tons.
In 2009, Korsnäs acquired a facility for production of CTMP
pulp in rockhammar. After implementation of existing plans
to increase production in rockhammar, Korsnäs will become
self-sufficient in pulp for its entire production of paper and
cartonboard.
Korsnäs has long pursued a targeted strategy of focusing
on highly processed products. As a result, paperboard has
become the largest product area in terms of volume, with
liquid packaging board used for beverage packaging and
White Top Kraft Liner (“WTL”) used as the outer layer in
corrugated packaging, while cartonboard is used primarily
for pack aging cosmetics, luxury drinks, confectionery and
frozen food.
In 2002 Korsnäs terminated its involvement in the saw-
mill business by selling the Kastet sawmill. During 2002 and
2004, swedish forest holdings were also sold via two transac-
tions. In 2002, more than a third of the forest holdings were
sold to sveaskog and in 2004 the remainder was transferred
to Bergvik skog, a newly established company in which
Korsnäs holds 5% of the shares. After these divestments,
Korsnäs swedish forest holdings consist of about 15,000
hectares of special land and rights.
Key events during 2009The investment project pertaining to a new evaporation plant
in Gävle, which commenced in autumn 2008, continued. of
the total anticipated investment amount of sEK 570 million,
sEK 329 million was paid during the year. The evaporation
plant is scheduled to be put into production in May 2010.
In April, Korsnäs acquired the operation in rockhammars
Bruk from rottneros for a purchase consideration of sEK 147
million. The purpose of the acquisition was to make Korsnäs
self-sufficient in terms of pulp for the entire Group’s paper
and cartonboard production
In December, a decision was made to invest in a bioen-
ergy plant in Gävle. For Korsnäs, this means that about sEK
320 million will be invested in shares and debenture loans,
corresponding to 50%, in a jointly owned company, Bomhus
Energi AB. In addition to this investment, Korsnäs will be
spending about sEK 145 million on energy saving invest-
ments in its existing facilities. overall, the total environmen-
tal impact from Korsnäs Gävle, including the new evapora-
tion plant under construction, will decrease from the existing
level of 125,000 tons to 10,000 tons of Co2 per year.
Consolidated earningsTotal revenue for the year amounted to sEK 8,039 million,
compared with sEK 7,396 million in the preceding year.
operating profit amounted to sEK 851 million (429). The
profit for 2008 includes costs for the restructuring program-
me of sEK 71 million. other financial income and expenses
amounted to a net expense of sEK 64 million (expense of
251), of which net interest expenses were sEK 101 million
(expense of 259) and exchange rate differences were a loss
of sEK 0 million (loss of 16). The reduced net interest was
due to positive cash flow and lower interest rates.
Profit after financial items amounted to sEK 787 million
(177).
reported tax expense amounted to sEK 197 million
(income of 42)
Cashflow and investmentsThe Group’s cash flow from current operations excluding
change in working capital amounted to sEK 1,461 million
(895) during the year. The improved cash flow is attributable
mainly to increased operating profit and lower tax payments
compared to the previous year. Working capital decreased
by sEK 337 million (increase 234). This year’s change in
working capital includes the positive effect of a reduction in
inventories of sEK 298 million, which is primarily explained
by a lower level of finished goods and pulpwood.
Investments in tangible fixed assets amounted to sEK 642
million (171) during the year, of which sEK 329 million rela-
ted to the on-going investment project for a new evaporation
plant at the pulp mill in Gävle.
Investments in subsidiaries amounted to sEK 147 million.
4
Liquidity and financing The Group’s available liquidity, including short-term invest-
ments and available credit facilities, totaled sEK 632 million
on 31 December, 2009 and sEK 608 million at 31 December,
2008.
The Group’s interest-bearing net debt amounted to
sEK 2,504 million at 31 December, 2009 and sEK 4,096
million at 31 December, 2008. All loans have fixed interest
terms of no longer than three months and carry an interest
rate according to stibor or similar base rate and an average
margin of 0.8%. of the Group’s interest expenses and other
financial costs of sEK 116 million (expense of 347), interest
expenses amounted to sEK 109 million (expense of 318)
and exchange rate differences was sEK 0 million (negative
9). This means that the average interest rate for the year was
1.7% (5.6%) (calculated as interest expense in relation to
average interest-bearing liabilities).
on 31 December, the average remaining duration for all
credit facilities amounted to 1.4 years. The Group’s bor-
rowing is primarily arranged in sEK. on an annual basis,
the net flow in foreign currencies is a net inflow of about
sEK 600 million, comprised mainly of Korsnäs’ sales in Euro.
Korsnäs Industrial
Key data (SEK million) 2009 2008 1)
Revenue 7 098 6 608
Operating profit, EBIT 826 472
Investments in tangible fiixed assets 721 167
Depreciation -605 -618
Operational capital employed, average 7 411 7 746
Return on operational capital employed 11,1% 6,1%
Number of employees 1 571 1 590
1) Excluding restructuring costs of SEK 71 million.
The global recession resulted in continued general weak
demand in 2009. However, the downturn leveled out during
the year and demand stabilized. Despite the weak market,
Korsnäs succeeded in increasing its delivery volumes for car-
tonboard and paper products by 4.1% to a total of 1,034,000
tons in 2009, compared with 993,000 tons in 2008.
Customers today are increasingly demanding various
types of products and delivery solutions and Korsnäs is
seeking to meet these demands using high quality and lower
overall customer cost. Korsnäs’ long-term strategy of focusing
on growth markets and offering differentiated, niche pro-
ducts that meet stringent requirements in terms of strength,
printability, formability and runnability in converting, proved
successful during the year with increasing volumes within
prioritized growth areas. Thus, the targeted focus on highly
refined products in selected segments will continue.
Production for 2009 amounted to 1,025,000 tons, compa-
red with 1,052,000 tons in 2008. The decline was attributable
primarily to market related production shutdowns of indivi-
dual paper machines during the first quarter (approximately
20,000 tons) and during the fourth quarter (approximately
6,000 tons). The purpose of the marketrelated production
shutdowns was to reduce capital tied-up in inventories.
Cartonboard production in Frövi amounted to 396,000 tons
(398,000), while cartonboard and paper production in Gävle
amounted to 629,000 tons (654,000).
In conjunction with the maintenance shutdown in Gävle
in the second quarter, the drying and press section of Paper
Machine 5 was rebuilt for approximately sEK 65 million. The
investment resulted in anticipated improvements in product
properties and better production economy.
In the autumn of 2008, a decision was made to invest
in a new evaporation plant at the pulp mill in Gävle, which
will reduce oil consumption by around 50% at the Gävle
plant. The investment is expected to total sEK 570 mil-
lion, of which sEK 329 million has been paid in 2009. The
investment project is proceeding according to plan and the
evaporation plant is scheduled to be put into operation in
May 2010.
In november 2008, an earnings-enhancement program
was launched to restore Korsnäs’ profitability to an operating
margin of more than 10% (actual 2009 10.6%). The program,
which entails staff reductions of 125 positions, is proceeding
according to plan and had a positive impact on operating
profit and tied-up capital in 2009.
In March, Korsnäs signed an agreement to acquire opera-
tions in rockhammar Mill from rottneros. rockhammar Mill
was at the time it was acquired licensed to produce 60,000
tons of chemical thermo-mechanical pulp, CTMP, annually,
and has a present application for permission to increase
production to 90,000 tons annually. The production increase
in rockhammar will enable Korsnäs to become self-sufficient
in pulp for its entire production of paper and cartonboard,
which is expected to reduce production costs. The purchase
consideration, including transaction costs, amounted to sEK
147 million. According to the acquisition analysis, the acqui-
sition cost is distributed as follows: goodwill in the amount
of sEK 37 million. Korsnäs rockhammar has contributed to
the Group’s result with a sEK 10 million since the transaction
was completed on 1 April. The result includes costs in rela-
tion to the integration work between rockhammar and the
plant in Frövi, which entails a staff reduction negotiated with
the trade union organizations. The entire volume produced
in rockhammar after the acquisition has been sold internally
within the Korsnäs Group. If Korsnäs rockhammar had been
included in the Group from 1 January, it is estimated that
profit would have been approximately sEK 8 million higher.
In December, a decision was made to, in cooperation
with Gävle municipality establish a jointly owned company
named Bomhus Energi AB, and invest sEK 1.8 billion in a
bio-energy plant in the Korsnäs industrial area in Gävle. For
Korsnäs, the investment will total approximately sEK 320
million consisting of shares and debenture loans, correspon-
ding to a holding of 50% in Bomhus Energi AB. In addition
to this investment, Korsnäs will be spending approxima-
tely sEK 145 million on energy investments in its existing
plant for the delivery of waste heat to Gävle Energi AB. The
objective of the investments is to, from 2013, secure delivery
of environmentally compatible electricity and steam to the
Korsnäs plant, as well as district heating to Gävle Energi’s
customers. The investments will enable a significant reduc-
5
tion in Korsnäs’ oil consumption, while increasing electricity
production and the use of waste heat from Korsnäs’ plant.
As a result of the investments, Korsnäs Gävle will raise the
proportion of internally produced electricity from 38% till
45%. The investments will also lead to a decreased oil con-
sumption of 21,000 m3 per year. on the whole, with the new
evaporation plant, the oil consumption will reduce from the
current level of 44,000 m3 per year to 4,000 m3 per year and
will thus reduce the total environmental impact from Korsnäs
Gävle from the current level of 125,000 tons to 10,000 tons
of Co2 per year. The new bioenergy plant will be ready for
operation during the autumn 2012. The investments totalling
approximately sEK 465 million will impact Korsnäs’ cash
flow during 2010-2012. The investment decision is subject to
the signing of the definitive agreements by the parties and to
Bomhus Energi AB securing the necessary external financing.
Korsnäs Industrial’s revenues for the year amounted to
sEK 7,098 million (6,608), with an operating profit of sEK
826 million (401). The comparative figure for 2008 includes
restructuring expenses of sEK 71 million. reduced costs for
pulpwood and external pulp of about sEK 285 million and
higher sales prices, including currency effects, of about sEK
190 million had a positive impact on earnings. Lower produc-
tion volumes and a change in product mix had a negative
impact on earnings of about sEK 15 million. other items
negatively affecting profitability included higher costs for
energy, chemicals and salaries of about sEK 105 million.
Liquid Packaging BoardLiquid Packaging Board is used to manufacture packaging,
primarily for dairy products and other beverages, a mar-
ket that is continuing to grow, mainly in Asia and Eastern
Europe. Primarily, coated Liquid Packaging Board is showing
growth, as a result of end-users’ increased demand for print
quality on the finished packaging. The global market for
Liquid Packaging Board usually increases at an annual rate
of 2-3%, but growth for 2009 is estimated to have been about
1%. For 2009, Korsnäs Liquid Packaging Board deliveries
remained at the same level as 2008. Price increases were im-
plemented in accordance with the multi-year agreements that
Korsnäs has with a number of customers regarding Liquid
Packaging Board deliveries. other major suppliers of Liquid
Packaging Board include stora Enso and Klabin. There is
also competition from other packaging materials, primarily
plastic bottles.
CartonboardKorsnäs cartonboard is used primarily in selected segments
for packaging cosmetics, luxury drinks, confectionery and
frozen food. The cartonboard market in Europe generally
grows 2-3% annually, but declined by about 6% in 2009.
Cartonboard capacity was reduced during the year in Europe
through the shutdown of a number of machines. European
imports, primarily from Brazil, continued to rise. Despite
lower demand and continued tough competition, Korsnäs
succeeded in increasing delivery volumes marginally, with
retained prices. Deliveries of cartonboard with white reverse
side, Korsnäs White, increased during the year in accordance
with the company’s goal, while deliveries of cartonboard
with brown reverse side, Korsnäs Light and Korsnäs Carry,
decreased marginally. Cartonboard competitors include stora
Enso, M-real and Holmen.
White Top Kraft Liner (WTL)WTL is used as the surface layer on corrugated packaging.
The WTL market in Europe declined by about 1% in 2009
compared with 2008, which shall be compared with growth
that is usually about 2-3%. The first half year was marked by
weak demand and falling prices. During the second half year,
demand strengthened, leading to the implementation of price
increases. Korsnäs’ total deliveries of WTL increased in 2009,
which was primarily attributable to deliveries of coated WTL
increasing in line with the company’s long-term strategy.
There are a number of suppliers in the market, with M-real
as the main competitor.
Sack and kraft paper sack and kraft paper are used for sacks, carrier bags and
food packaging. Following a weak start to 2009, demand for
sacks, carrier bags and food packaging gradually improved
during the year. The market for white paper, the segment on
which Korsnäs has focused for the past several years, is in
better balance between supply and demand than for brown
paper. Korsnäs’ deliveries of sack paper increased in 2009,
compared with the preceding year, of which brown paper
accounted for the majority of the increase. supported by the
strong demand, Korsnäs announced price increases during
the fourth quarter. Billerud and UPM Kymmene are the main
competitors in this area. Korsnäs’ market position is highligh-
ted primarily by its high-strength products offering favorable
converting potential.
Korsnäs Forestry
Key data (SEK million) 2009 2008Revenue 941 788
Operating profit, EBIT 25 28
Investments in tangible fixed assets 19 4
Depreciation -6 -6
Operational capital employed, average 438 429
Return on operational capital employed 5,7% 6,5%
Number of employees 240 277
Korsnäs Forestry is responsible for the purchase of wood and
fiber for Korsnäs’ pulp and paper mills and for the perfor-
mance of forestry services in line with agreements with Berg-
vik skog. Korsnäs Forestry’s external customers are primarily
sawmills and spruce fiber users in central sweden and Latvia.
From a weak start of the year, with continued declining
prices for pulpwood, the timber market turned upwards
during the second and third quarters, with increased demand
and higher prices for sawtimber. During the fourth quarter,
pulpwood prices began to rise, first in southern and northern
sweden to also include Korsnäs’ catchment areas by the end
of the year.
During the year, Korsnäs Forestry succeeded in its pro-
gram to reduce capital tied-up in inventories of felling rights
6
and pulpwood.
Korsnäs Forestry’s revenue, excluding internal sales to
Korsnäs Industrial, amounted to sEK 941 million (788) for
the year. operating profit amounted to sEK 25 million (28).
Research and developmentKorsnäs’ work with renewal of the product portfolio conti-
nued during 2009, whereby a number of new products were
introduced. Within existing segments, work was dominated
by product care and improved profitability. Competency
groups were created within three strategically important
future areas, with the task of monitoring the technical de-
velopment, controlling external research and development
within the area, as well as generating product ideas. During
the year, the development organization was reorganized with
a focus on customer orientation and cooperation with pro-
duction units. Korsnäs’ spent a total of sEK 49 million (58)
on research and development during the year.
Environmental workFor Korsnäs, the environmental work is an improvement
process that is always in progress. Korsnäs goal is to operate
in a sustainable balance with nature.
All Korsnäs’ products are based on renewable raw materi-
als from the forest. This places demands on the environmen-
tal considerations in the company’s forest operations, where,
without being a major forest owner, Korsnäs nevertheless has
a major impact through its forest management organization,
as well as in the production of cartonboard and paper.
Certified forestry management Korsnäs has extensive experience in working with environ-
mental issues within forestry and was the first forest com-
pany to be certified according to Iso 14001 in 1997, from
plants to end products.
The customers’ interest in the environmental work in the
forest and the certified products from Korsnäs has increased
significantly. Consequently, Korsnäs conducts customer visits
in the forest, where customers can take a closer look at what
certified, environmentally-adapted forest management entails.
Korsnäs’ certified products are made of raw materials from
certified, well-managed forests, where consideration has
been given to the environment, economic forest production
and social aspects.
The company’s traceability certification demonstrates
that all raw materials derive from legal logging, where no
high natural values were threatened and any serious social
conflicts occurred. Consequently, by purchasing certified
products, Korsnäs supports a positive trend pertaining to,
for example, long-term finance, biological diversity, working
conditions and local communities’ utilization of the forest.
Korsnäs is certified according to the systems of the Forest
stewardship Council (FsC) and the Program for the Endor-
sement of Forest Certification (PEFC), which both strive for
responsible and sustainable forest management worldwide.
The company can thus offer customers the product labeling
in which they are interested. Korsnäs purchases certified
pulpwood from many different suppliers to satisfy custo-
mers’ requirements. However, all forest land in sweden is not
certified. Consequently, Korsnäs tries to motivate suppliers
to certify their forest management or their timber supply and
has also obtained permission to group-certify small, private,
forest owners to contribute to increasing certified forest
land areas. There is a connection between today’s sustained
forest management and the market’s increased interest in the
environment.
Climate impactKorsnäs conduct industrial operations in Gävle, Frövi and
rockhammar requiring permits from relevant authorities with
threshold limit values regarding environmental impact on air
and water, which is followed-up and disclosed on a regular
basis. The current permit for Gävle covers 700 thousand tons
of pulp and 755 thousand tons of end products in the form
of paper and cartonboard. For Frövi the Environmental Court
approved a new permit in the end of 2008 for 300 thousand
tons of kraft pulp production, of which 140 thousand tons
may be bleached. During 2009, Korsnäs has successfully
maintained a healthy margin between limits and emission
levels.
Application pertaining to a new production permit for
the facility in rockhammar was submitted to the Environ-
mental Court in 2009. In the beginning of 2010 the Envi-
ronmental Court is expected to grant permission to increase
production at the plant from 60,000 tons to 90,000 tons
CTMP pulp annually.
During the past 20-year period, Korsnäs has significantly
decreased the fossil carbon-dioxide impact from the manu-
facturing process of pulp, paper and cartonboard. Between
1990 and 2007, the fossil carbon-dioxide impact dropped by
57% through more efficient energy utilization and lower con-
sumption of fossil fuel. This was accomplished simultaneous-
ly with an increase of more than 30% in production volume.
The development of Korsnäs’ environmental work has,
during 2009, been focused on areas like life cycle analysis
(analysis of the environmental impact in all stages of pro-
duction including energy and other resources), projects to
decrease the climate impact and increased energy efficiency.
In 2007, Korsnäs set a target to reduce the Co2 impact
by an additional 25%, per unit of produced end product by
2020. Through two major investments, it appears that this
target will be surpassed both in size and time.
In the autumn of 2008, a decision was made to invest in
a new evaporation plant at the pulp mill in Gävle. The plant,
which is under construction and scheduled for completion
in the spring of 2010, will reduce oil consumption by about
19,000 m3 per year.
In December 2009, a decision was made to, in coope-
ration with Gävle municipality establish a jointly owned
company named Bomhus Energi AB, and invest sEK 1.8
billion in a bio-energy plant in the Korsnäs industrial area in
Gävle. For Korsnäs, the investment will total approximately
sEK 320 million consisting of shares and debenture loans,
corresponding to a holding of 50% in Bomhus Energi AB. In
addition to this investment, Korsnäs will be spending approx-
imately sEK 145 million on energy investments in its existing
7
plant for the delivery of waste heat to Gävle Energi AB. The
objective of the investments is from 2013, to secure delivery
of environmentally compatible electricity and steam to the
Korsnäs plant, as well as district heating to Gävle Energi’s
customers. The investments will enable a significant reduc-
tion in Korsnäs’ oil consumption, while increasing electricity
production and the use of waste heat from Korsnäs’ plant. As
a result of the investments, Korsnäs Gävle will raise the pro-
portion of internally produced electricity from 38% till 45%.
The new bioenergy plant will be ready for operation during
the autumn 2012.
on the whole, with the new evaporation plant, the oil
consumption will reduce from the current level of 44,000 m3
per year to 4,000 m3 per year and will thus reduce the total
environmental impact from Korsnäs Gävle from the current
level of 125,000 tons to 10,000 tons of Co2 per year. The de-
crease corresponds to the annual consumption of more than
10,000 oil-fired, single-family homes.
Risk managementThe Group’s financing and management of financial risks is
centralized within Kinnevik’s finance function and is conduc-
ted on the basis of a finance policy established by the Board
of Directors. The Group’s operational risks are primarily
evaluated and managed within the particular business area
and then reported to the Board.
Korsnäs’ operational risks consist primarily of customer
relations in respect of payment capacity and the risk of
losing established relationships, as well as with suppliers in
terms of reliability, quality and price, in addition to major ac-
cidents in the production. Korsnäs conducts regular surveys
of customers and suppliers and undertakes extensive checks
and maintenance to minimize the risk of production disrup-
tions.
The risk that customers fail to fulfill their payment
obligations is limited by means of credit checks, whereby all
customers are analyzed by sales managers and a credit coun-
cil quarterly. Customers are also monitored continuously by
the credit function using, for example, information from Dun
& Bradstreet. Deviations in relation to concluded agreements
are managed on an ongoing basis by the credit council.
In production operations, risk inventories are conducted
with the focus on areas that could be expected to give rise
to serious production disruptions. For identified risk areas,
plans are drawn up regarding how these can be prevented as
far as possible and how the management of abnormal situa-
tions is to be done. A corresponding inventory is also made
for safety purposes and the work environment.
Korsnäs’ net purchases of power during 2009 totaled 902
GWh. In addition, 546 GWh of in-house generated power
was consumed. since the nordic electricity market was dere-
gulated, financial hedging has been used to reduce exposure
to temporary fluctuations in electricity prices. At the end of
2009, a decision was made to cease financial hedging since
most other cost items, as well as a large portion of revenue,
are immediately impacted by changes in market prices, and
that electricity costs represent a small, and – following the
conclusion of ongoing energy investments – ever smaller
portion of the company’s cost base. Consequently, no new
hedging contracts will be signed and the result of the portfo-
lio held at year-end will be recognized as they fall due. As of
31 December, the market value of financial hedges amounted
to a negative sEK 22 million (negative 103), and comprises
77% of the estimated net power purchases in sweden for
2010, 44% for 2011 and 17% for 2012.
With regard to the purchase of pulpwood during 2009,
approximately half of Korsnäs’ pulpwood consumption was
supplied from Bergvik skog and sveaskog, and split between
them almost equally. The remaining pulpwood derives from
purchases in sweden and from Åland and the Baltic states.
Most of the swedish wood consists of softwood fiber, with
most of the imported material consisting of hardwood fiber.
Korsnäs’ agreement with Bergvik is long-term and prices are
updated continually.
on an annual basis, Korsnäs’ net flow in foreign cur-
rencies is a net inflow of about sEK 600 million, comprised
mainly of sales in Euro. The Group’s policy is not to hedge
this transaction exposure. The reason for this approach is
that the Group is dealing with a continuously even net inflow
of foreign currency for which, over time, hedging measures
would also be affected by exchange rate changes.
For a more detailed description of the management of
financial risks, refer to note 30.
Employees and organizationKorsnäs’ work on developing the company’s competency,
working methods and organization, which are key issues for
meeting global development as well as ensuring a modern
and cost-efficient organization, continued during the year.
Within the framework of the implemented earnings-en-
hancement program, extensive negotiations were conducted
and personnel changes were implemented according to plan
and without initiating termination negotiations. During the
year, personnel changes were implemented in conjunction
with the integration of Korsnäs rockhammar.
To secure the long-term competency requirements in ma-
nagement and in key positions, a trainee program consisting
of seven individuals commenced during the year.
As part of a more long-term recruitment strategy, but also
part of assuming social responsibility, pupils and students
are offered insight into and experience of the company on
different levels. During the year, work has been conducted to
increase the attraction and effect of this exchange.
Work to harmonize the Hr operations between Korsnäs
Gävle and Korsnäs Frövi continues and during the year,
Korsnäs rockhammar was also included. Within the area of
occupational health and safety, Korsnäs Frövi and Korsnäs
rockhammar implemented a change in direction to the more
preventive form of corporate healthcare, which already exists
at Korsnäs Gävle. In connection with this, extensive training
courses were conducted for managers, safety representatives
and union representatives.
Parent companyDuring 2009 the wholly-owned subsidiary Korsnäs Frövi AB
8
was merged into the parent company. revenues and costs
are included in the figures for the parent company from 1
January 2009.
The Parent Company’s revenue for the year amounted to
sEK 7,776 million (4,611). operating profit amounted to sEK
778 million (236).
Dividends received amounted to sEK 21 million (6). The
net of other financial income and expenses amounted to an
expense of sEK 104 million (expense of 306).
The Parent Company’s earnings after financial items
amounted to a loss of sEK 695 million (loss of 64).
Investments in tangible fixed assets amounted to sEK 611
million (115).
The Parent Company’s interest-bearing external liabilities
amounted to sEK 4,449 million (4,006).
Future developmentFor 2010, the market situation remains somewhat uncer-
tain with short visibility in terms of demand. Implemented
earnings-enhancement program is expected to continue
having a positive impact, as will the commissioning of the
new evaporation plant in Gävle in May. The price increase of
sEK 25 per m3 fub of pulpwood in Korsnäs’ catchment area,
which was announced in December 2009, will have a nega-
tive impact on results of about three to six months’ delay.
Events after the end of the reporting period During January and February 2010, production in Gävle as
well as Frövi were affected by unscheduled shutdowns of the
recovery boilers, which caused a production loss of about
14,000 tons of paper and cartonboard products.
Proposed treatment of unappropriated ear-ningsThe following amounts are at the disposal of the Parent
Company’s Annual General Meeting:
Unrestricted equity, sEK 780,861,545
The Board and the CEo propose that the unappropriated
earnings at the disposal of the Annual General Meeting be
disposed of as follows:
Carried forward 780,861,545
Total 780,861,545

9
Consolidated Statement of Income
for the period 1 January-31 December (SEK million)
Note 2009 2008Revenue 2 8 039 7 396
Cost of goods and services -6 821 -6 737
Gross profit 1 218 659
Selling costs -144 -137
Administration costs -202 -176
Research and development costs -49 -58
Other operating income 3 224 222
Other operating expenses 3 -196 -82
Operating profit 2, 3, 4 851 429
Dividends received 5 6 4
Change in fair value of financial assets 6 40 33
Interest income and other financial income 7 7 59
Interest expenses and other financial expenses 7 -116 -347
Profit after financial items 787 177
Taxes 8 -197 42
Net profit for the year 590 219
Attributable to equity holders of the Parent Company 590 219
Earnings per share before and after dilution, SEK 11 4
Proposed dividend per share, SEK - -
Average number of shares outstanding before/after dilution 53 613 270 53 613 270
Consolidated Statement of Comprehensive Income
for the period 1 January-31 December (SEK million) 2009 2008Net profit for the year 590 219
Other comprehensive income for the year
Translation reserve -10 14
Cash flow hedging transer to income statement 78 102
Cash flow hedging transfer to other comprehensive income 3 -314
Actuarial profit/loss -1 -59
Tax attributable to other comprehensive income -21 72
Total other comprehensive income for the year 50 -184
Total comprehensive income for the year 640 35
Total comprehensive invome for the year attributable to:
Equity holders of the Parent Company 640 35

10
Consolidated Balance Sheet
31 December (SEK million)
Note 2009 2008ASSETS
Fixed assets
Intangible assets 10 771 734
Tangible and biological fixed assets 10 5 985 5 858
Financial assets accounted at fair value through profit and loss 11 502 460
Receivables from Group company 11 2 415 246
Investment in companies accounted for using the equitymethod 12 1 1
Other fixed assets - 0
Total fixed assets 9 674 7 299
Current assets
Inventories 14 1 635 1 916
Trade and other receivables 15,16 852 871
Prepayments 17 23 38
Cash and cash equivalents 18 81 206
Total current assets 2 591 3 031
TOTAL ASSETS 12 265 10 330
SHAREHOLDERS’ EQUITY AND LIABILITIES
Shareholders’ equity 19
Shareholders’ equity attributable to equity holders of the Parent Company
Share capital 54 54
Other contributed capital 17 17
Reserves -14 -65
Retained earnings including net profit for the year 4 170 2 866
Total shareholders’ equity 4 227 2 873
11
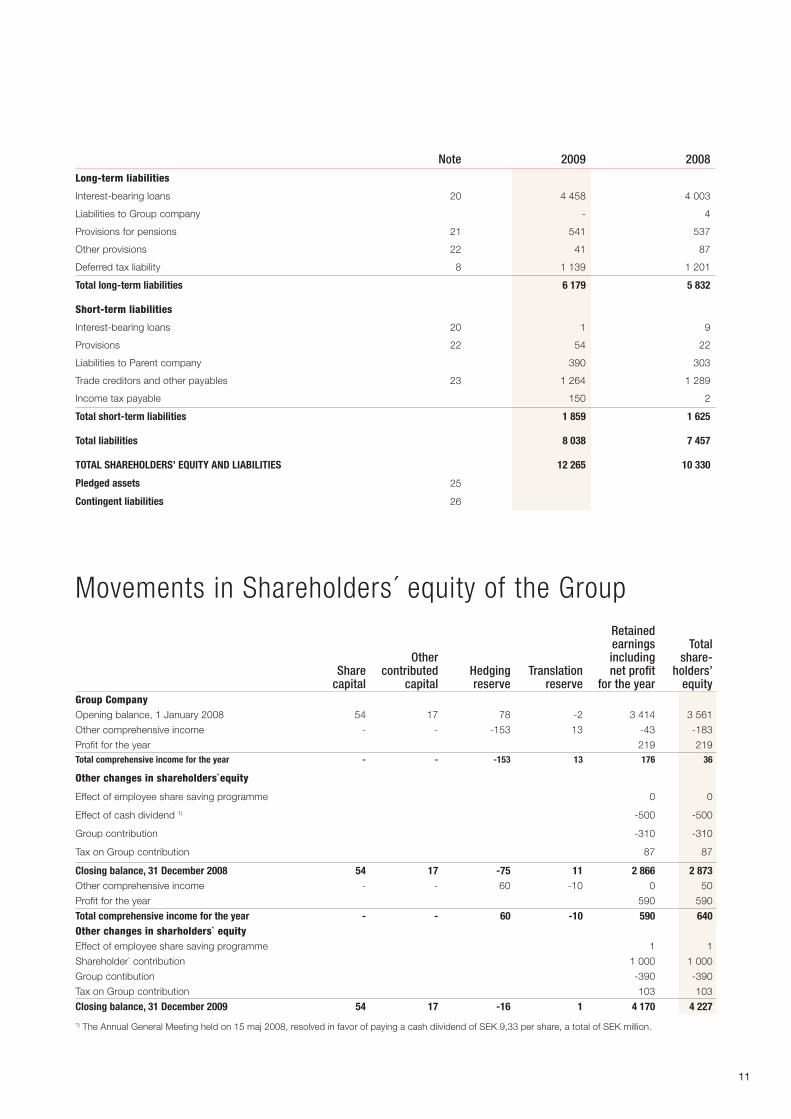
Note 2009 2008Long-term liabilities
Interest-bearing loans 20 4 458 4 003
Liabilities to Group company - 4
Provisions for pensions 21 541 537
Other provisions 22 41 87
Deferred tax liability 8 1 139 1 201
Total long-term liabilities 6 179 5 832
Short-term liabilities
Interest-bearing loans 20 1 9
Provisions 22 54 22
Liabilities to Parent company 390 303
Trade creditors and other payables 23 1 264 1 289
Income tax payable 150 2
Total short-term liabilities 1 859 1 625
Total liabilities 8 038 7 457
TOTAL SHAREHOLDERS’ EQUITY AND LIABILITIES 12 265 10 330
Pledged assets 25
Contingent liabilities 26
Movements in Shareholders´ equity of the Group
Share capital
Other contributed
capitalHedging reserve
Translation reserve
Retained earnings including net profit
for the year
Total share-
holders’ equity
Group CompanyOpening balance, 1 January 2008 54 17 78 -2 3 414 3 561
Other comprehensive income - - -153 13 -43 -183
Profit for the year 219 219Total comprehensive income for the year - - -153 13 176 36
Other changes in shareholders`equity
Effect of employee share saving programme 0 0
Effect of cash dividend 1) -500 -500
Group contribution -310 -310
Tax on Group contribution 87 87
Closing balance, 31 December 2008 54 17 -75 11 2 866 2 873Other comprehensive income - - 60 -10 0 50
Profit for the year 590 590
Total comprehensive income for the year - - 60 -10 590 640Other changes in sharholders` equityEffect of employee share saving programme 1 1
Shareholder` contribution 1 000 1 000
Group contibution -390 -390
Tax on Group contribution 103 103
Closing balance, 31 December 2009 54 17 -16 1 4 170 4 227 1) The Annual General Meeting held on 15 maj 2008, resolved in favor of paying a cash diividend of SEK 9,33 per share, a total of SEK million.
12
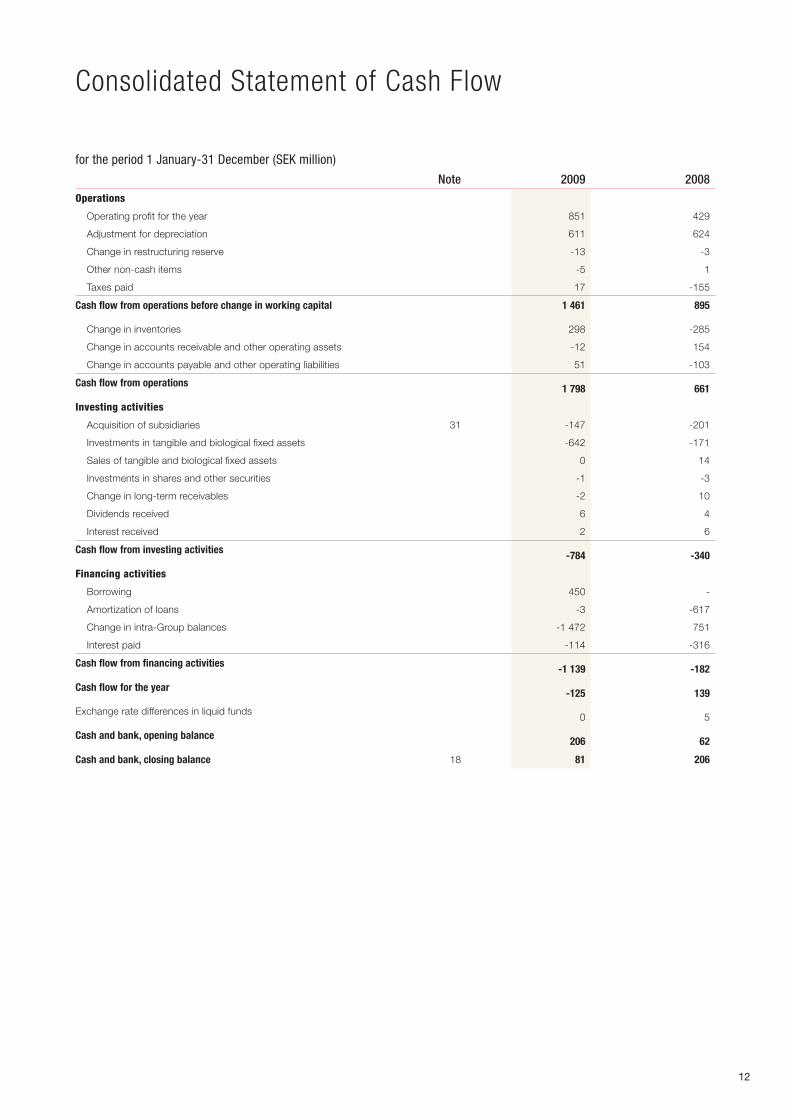
Consolidated Statement of Cash Flow
for the period 1 January-31 December (SEK million)
Note 2009 2008Operations
Operating profit for the year 851 429
Adjustment for depreciation 611 624
Change in restructuring reserve -13 -3
Other non-cash items -5 1
Taxes paid 17 -155
Cash flow from operations before change in working capital 1 461 895
Change in inventories 298 -285
Change in accounts receivable and other operating assets -12 154
Change in accounts payable and other operating liabilities 51 -103
Cash flow from operations 1 798 661
Investing activities
Acquisition of subsidiaries 31 -147 -201
Investments in tangible and biological fixed assets -642 -171
Sales of tangible and biological fixed assets 0 14
Investments in shares and other securities -1 -3
Change in long-term receivables -2 10
Dividends received 6 4
Interest received 2 6
Cash flow from investing activities -784 -340
Financing activities
Borrowing 450 -
Amortization of loans -3 -617
Change in intra-Group balances -1 472 751
Interest paid -114 -316
Cash flow from financing activities -1 139 -182
Cash flow for the year -125 139
Exchange rate differences in liquid funds0 5
Cash and bank, opening balance 206 62
Cash and bank, closing balance 18 81 206
13
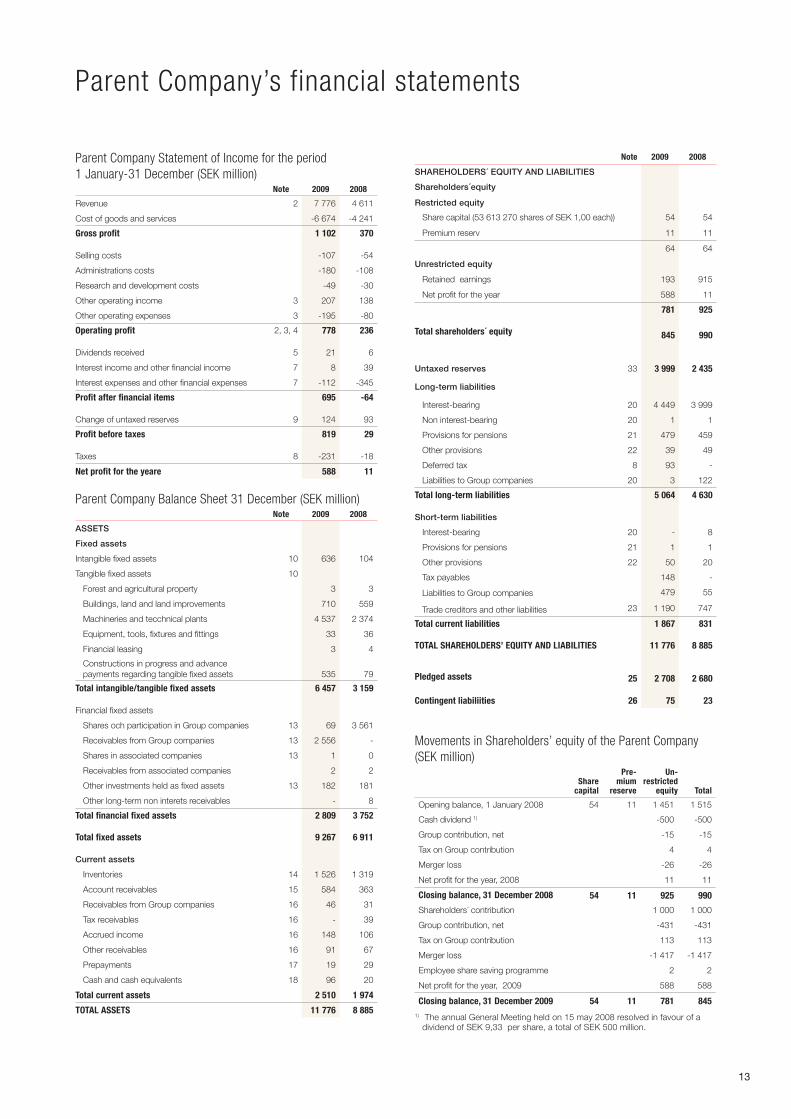
Parent Company’s financial statements
Parent Company Statement of Income for the period 1 January-31 December (SEK million)
Note 2009 2008
Revenue 2 7 776 4 611
Cost of goods and services -6 674 -4 241
Gross profit 1 102 370
Selling costs -107 -54
Administrations costs -180 -108
Research and development costs -49 -30
Other operating income 3 207 138
Other operating expenses 3 -195 -80
Operating profit 2, 3, 4 778 236
Dividends received 5 21 6
Interest income and other financial income 7 8 39
Interest expenses and other financial expenses 7 -112 -345
Profit after financial items 695 -64
Change of untaxed reserves 9 124 93
Profit before taxes 819 29
Taxes 8 -231 -18
Net profit for the yeare 588 11
Parent Company Balance Sheet 31 December (SEK million)Note 2009 2008
ASSETS
Fixed assets
Intangible fixed assets 10 636 104
Tangible fixed assets 10
Forest and agricultural property 3 3
Buildings, land and land improvements 710 559
Machineries and tecchnical plants 4 537 2 374
Equipment, tools, fixtures and fittings 33 36
Financial leasing 3 4
Constructions in progress and advance payments regarding tangible fixed assets 535 79
Total intangible/tangible fixed assets 6 457 3 159
Financial fixed assets
Shares och participation in Group companies 13 69 3 561
Receivables from Group companies 13 2 556 -
Shares in associated companies 13 1 0
Receivables from associated companies 2 2
Other investments held as fixed assets 13 182 181
Other long-term non interets receivables - 8
Total financial fixed assets 2 809 3 752
Total fixed assets 9 267 6 911
Current assets
Inventories 14 1 526 1 319
Account receivables 15 584 363
Receivables from Group companies 16 46 31
Tax receivables 16 - 39
Accrued income 16 148 106
Other receivables 16 91 67
Prepayments 17 19 29
Cash and cash equivalents 18 96 20
Total current assets 2 510 1 974
TOTAL ASSETS 11 776 8 885
Note 2009 2008
SHAREHOLDERS´ EQUITY AND LIABILITIES
Shareholders´equity
Restricted equity
Share capital (53 613 270 shares of SEK 1,00 each)) 54 54
Premium reserv 11 11
64 64
Unrestricted equity
Retained earnings 193 915
Net profit for the year 588 11
781 925
Total shareholders´ equity 845 990
Untaxed reserves 33 3 999 2 435
Long-term liabilities
Interest-bearing 20 4 449 3 999
Non interest-bearing 20 1 1
Provisions for pensions 21 479 459
Other provisions 22 39 49
Deferred tax 8 93 -
Liabilities to Group companies 20 3 122
Total long-term liabilities 5 064 4 630
Short-term liabilities
Interest-bearing 20 - 8
Provisions for pensions 21 1 1
Other provisions 22 50 20
Tax payables 148 -
Liabilities to Group companies 479 55
Trade creditors and other liabilities 23 1 190 747
Total current liabilities 1 867 831
TOTAL SHAREHOLDERS’ EQUITY AND LIABILITIES 11 776 8 885
Pledged assets 25 2 708 2 680
Contingent liabiliities 26 75 23
Movements in Shareholders’ equity of the Parent Company (SEK million)
Share capital
Pre-mium
reserve
Un- restricted
equity Total
Opening balance, 1 January 2008 54 11 1 451 1 515
Cash dividend 1) -500 -500
Group contribution, net -15 -15
Tax on Group contribution 4 4
Merger loss -26 -26
Net profit for the year, 2008 11 11
Closing balance, 31 December 2008 54 11 925 990
Shareholders´ contribution 1 000 1 000
Group contribution, net -431 -431
Tax on Group contribution 113 113
Merger loss -1 417 -1 417
Employee share saving programme 2 2
Net profit for the year, 2009 588 588
Closing balance, 31 December 2009 54 11 781 8451) The annual General Meeting held on 15 may 2008 resolved in favour of a
dividend of SEK 9,33 per share, a total of SEK 500 million.
14
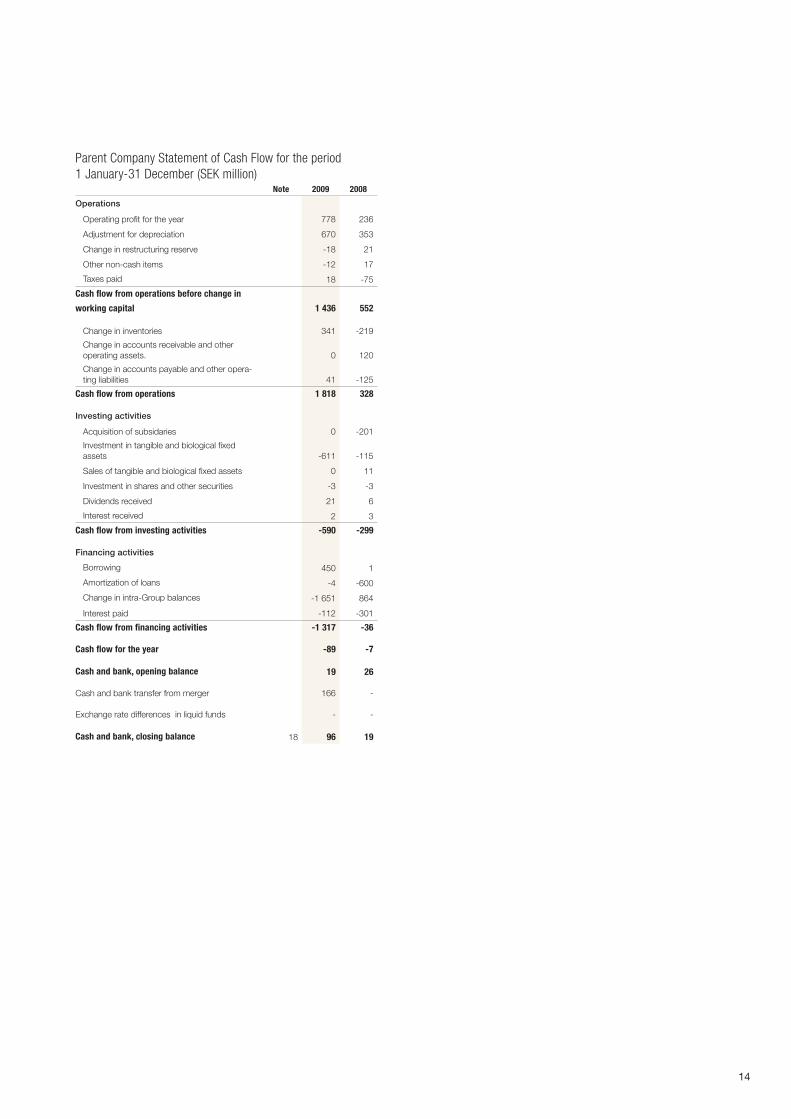
Parent Company Statement of Cash Flow for the period1 January-31 December (SEK million)
Note 2009 2008
Operations
Operating profit for the year 778 236
Adjustment for depreciation 670 353
Change in restructuring reserve -18 21
Other non-cash items -12 17
Taxes paid 18 -75
Cash flow from operations before change in
working capital 1 436 552
Change in inventories 341 -219
Change in accounts receivable and other operating assets. 0 120
Change in accounts payable and other opera-ting liabilities 41 -125
Cash flow from operations 1 818 328
Investing activities
Acquisition of subsidaries 0 -201
Investment in tangible and biological fixed assets -611 -115
Sales of tangible and biological fixed assets 0 11
Investment in shares and other securities -3 -3
Dividends received 21 6
Interest received 2 3
Cash flow from investing activities -590 -299
Financing activities
Borrowing 450 1
Amortization of loans -4 -600
Change in intra-Group balances -1 651 864
Interest paid -112 -301
Cash flow from financing activities -1 317 -36
Cash flow for the year -89 -7
Cash and bank, opening balance 19 26
Cash and bank transfer from merger 166 -
Exchange rate differences in liquid funds - -
Cash and bank, closing balance 18 96 19
15
Notes
Note 1 Summary of significant accounting policies
Statement of compliance The consolidated accounts have been prepared in accordance with International Financial Reporting Standards (IFRS).
Since the Parent Company is a company that is active in the EU, only EU-approved IFRS are applied. The consolidated accounts have also been prepared in accordance with Swedish law, with application of the Swedish Financial Reporting Board’s recom-mendation RFR 1.2 Supplementary accounting regulations for Groups.
The Parent Company’s annual accounts have been prepared in accordance with Swedish law, and with application of the Swedish Financial Reporting Board’s recommendation RFR 2.2 Reporting for legal entities, which replaces the Financial Accounting Standards Council’s recommendation RR 32.06.
The Parent Company’s accounting principles depart from the principles governing consolidated accounting in respect of the valuation of financial instruments and pension liabilities. The Parent Company applies RFR 2.1 in respect of the option not to observe IAS 39. Financial instruments are thus not valued at fair value as in the Group but at their acquisition cost. Pension liabilities are reported in accordance with Swedish principles.
New and revised standards 2009 The revised IAS 1 Presentation of financial statements has been applied for the Group from 1 January 2009 with additional information regarding comprehensive income specified as a separate report directly after Consolidated Income Statement and a new Report of changes in equity for the Group. The Group also applies IFRS 7, which entails additional supplementary disclosures. Other new or revised IFRS principles and interpretations of the IFRIC have not had any effect on the financial position, results or additional information for the Group or the Parent Company.
Basis of preparation of consolidated accounts The consolidated financial statements have been prepared on a historical cost basis, except for investments in forest and other biological assets, derivative financial in-struments and certain financial assets valued at fair value through profit and loss. The consolidated statements are presented in Swedish kronor (SEK) and all values are rounded to the nearest million except when otherwise indicated.
Basis of consolidation The consolidated financial statements comprise the financial statements of the Group as of 31 December each year. The financial statements of subsidiaries are prepared for the same reporting year as the Parent Company, using consistent accounting policies. The consolidated financial statements include the Parent Company and all companies in which the Parent controls more than 50% of the votes or in any other way exercises a controlling influence. Subsidiaries are consolidated from the date on which control is transferred to the Group and cease to be consolidated from the date on which control is transferred out of the Group. Where there is a loss of control of a subsidiary, the consolidated financial statements include the result for the part of the reporting year during which the Group has control. The consolidated accounts are prepared using the purchase method. The difference between the acquisition value of shares in a subsidiary and the fair value of identifiable assets and liabilities of that subsidiary at the time of acquisition is reported as goodwill. Intercompany transactions, balance sheet items and unrealized gains on transactions between com-panies are eliminated. Unrealized losses are also eliminated, unless the transaction evidences the need to write down the transferred asset.
Foreign currency translation The functional and presentation currency of the Parent Company and its Swedish subsidiaries is Swedish kronor (SEK). Transactions in foreign currencies are initially recorded in the functional currency exchange rate ruling at the date of the transaction. Monetary assets and liabilities denominated in foreign currencies are translated at the functional currency rate of exchange ruling at the balance sheet date. Realized and unrealized exchange gains/losses on receivables and liabilities of an operating nature are reported in operating income, while exchange rate differences on financial assets and liabilities in foreign currencies are reported among financial items. Korsnäs
has elements of its borrowing in foreign currency, which is aimed at balancing net exposure of current receivables and liabilities. The translation differences of these loans are recognized in operating profit. As at the reporting date, the assets and liabilities of subsidiaries that have not the same functional currency as the Parent Company are translated into the presentation currency of the Group at the rate of exchange ruling at the balance sheet date. Their income statements are translated at the average exchange rates for the year. The exchange differences arising on the translation are taken in other comprehensive income and as a separate component of equity. On disposal of a foreign entity, the deferred cumulative amount recognized in equity relating to that particular foreign operation shall be recognized in the income statement. Long-term monetary balances between the Parent Company and subsidiaries may be deemed to represent an extension or a contraction of the Parent Company’s net investment in the subsidiary. Foreign currency differences arising on such balances are therefore charged as other comprehensive income as a translation difference.
Intangible assets Intangible assets with a finite useful life are measured on initial recognition at cost and are then carried at cost less accumulated amortization and any accumulated impairment losses. Amortization is calculated on a straight-line schedule based on the acquisition value of the asset and its estimated useful life. Goodwill consists of the amount by which the acquisition value exceeds the fair value of the Group’s share in the identifiable net assets of the acquired subsidiary/ associated company at the time of acquisition. Goodwill from the acquisition of subsidiaries is reported as intangible assets. Intangible assets including goodwill are tested for impairment annually to identify any possible need of a write-down and is reported at its acquisition value less accumulated write-downs. Gains or losses on the divestment of a unit include the remaining reported value of the goodwill relating to the divested unit. Goodwill is distributed among cash-generating units when it is tested with respect to a possible need for a write-down.
Tangible and biological assets Tangible assets are shown as an asset in the balance sheet if probability implies future financial benefits for the group, and the asset’s acquisition value can be estimated in a reliable manner. Tangible assets are recognized at cost less deduction of ac-cumulated depreciation and any impairment. The cost includes the purchase price, as well as expenses directly attributable to the asset being put into position and in working order for utilization according to the purpose of the acquisition. In cases where tangible assets consist of parts with different useful lives they will be treated as separate tangible asset components and depreciation will be based on their useful lives. The reported value for a tangible asset is excluded from the balance sheet when disposed of, or when no future financial benefits are expected from usage. Profit or loss that arises during sale or disposal of an asset consists of the difference between the sale price and the asset’s recorded value with deduction for direct sales costs. Forest and other biological assets are recorded at their fair value.
Additional expensesAdditional expenses are added to the acquisition value only if probability implies future financial benefits associated therewith will be bestowed the group, and the acquisition value can be estimated in a reliable manner. All other additional expenses are reported as a cost in the period they arise. A decisive factor in assessing when an additional expense is added to the acquisition value is if the expense concerns exchange of identifiable components or parts thereof, in which case they can be treated as assets. The expense is also added to the acquisition value when new components are created. Any possible remaining reported value on replaced components or parts thereof, are disposed of and are written off in connection to the replacement. Repairs are written off currently.
Impairment Assets are assessed with respect to the reduction in their value whenever events or changes in circumstances indicate that the reported value might not be recoverable. To calculate the impairment requirement, assets are grouped in cash-generating units. An impairment loss is done in the amount by which the assets’ reported value
16
exceeds its recovery value. The recovery value is the higher of an assets’ fair value, less the cost of sale and the value in use.
Financial instruments A financial asset or financial liability is recognized in the balance sheet when the Company becomes a party to the instrument’s contractual terms. Accounts receivable are recognized when the invoice is sent. A liability is recognized when the counter- party has performed and there is a contractual obligation to pay, even if the invoice has not yet been sent. A financial asset is derecognized from the balance sheet when the rights in the contract are realized, expired or the Company loses control over them. The same applies for a portion of a financial asset. A financial liability is derecognized from the notes for the Group balance sheet when the obligation in the contract is met or in some other manner is extinguished. The same applies for a portion of a financial liability. Acquisition and divestment of financial assets are reported on the transaction date, which is the date on which the Company commits to acquire or divest the assets, except in the case the Company acquires or divests listed securities when settlement date reporting is applied.
Financial assets Financial assets, with the exception of loan receivables and trade receivables, are valued at their fair value through profit and loss. The fair value of financial instruments traded on an active market is based on the market prices listed on the closing date. The listed market price used for the Group’s financial assets is the current bid price. When establishing the fair value of other financial instruments, methods that in every individual case are assumed to provide the best estimation of fair value have been used. For assets and liabilities maturing within one year, a nominal value adjusted for interest payments and premiums is assumed to provide a good approximation to fair value.
Associates Companies in which the Group has significant influence and which is not a subsidiary are regarded as associated companies. Unlisted associated companies are accoun-ted for using the equity method. Adjustments for intra-group profits/losses arising out of transactions with associated companies are made in connection with the calculation of the Group’s consolidated interest in earnings and capital. Elimination of such intra-groups profits/losses occurs in pace with their realization through the sale of the particular assets to external parties and/or by reduction of the Group’s ownership interest in the associated company.
Loan receivables and trade receivables Loan receivables and other receivables are non-derivative financial assets with defined or definable payments and defined maturities that are not listed on an active market. The values established are amortized cost, and the valuation is based on the effective interest method (using the effective interest method that is the rate that exactly discounts estimated future cash receipts through the expected life of the financial instrument). Trade receivables, which generally have 30-90 day terms, are recognized and carried at invoice amount less an allowance for any uncollectible amounts. An estimate for doubtful debts is made when collection of the full amount is no longer probable. Bad debts are written off when identified. Trade receivable pertain to a large number of customers mainly in Sweden and the rest of Europe. The Group deals solely with well-established and creditworthy counterparties, which redu-ces the credit risk. Credit risks pertaining to the Group’s other financial assets, which include cash and cash equivalents, are the risks of failure to pay by counterparties. The maximum risk corresponds to the financial instruments’ reported value.
Financial liabilities Financial liabilities not held for trading are measured at accrued acquisition value, which is determined based on the effective interest rate calculated when the liability was assumed. This means that surplus and deficit values as well as direct costs in conjunction with assuming of loans are distributed over the term of the liability. Long-term liabilities have an expected term of exceeding one year, while current liabilities have a term of less than one year. Trade payables have short expected term and are valued at nominal value.
Accounting for derivaties and hedgingThe Group`s derivative instruments consist primarily of futures contracts to cover the risk of changes in power prices. All derivatives are reported initially and continually at their fair value in the balance sheet. Changes in the value of derivatives categorized as a cash flow hedge are reported as other comprehensive income and are reversed to the income statement in pace with effect of the hedge cash flow on earnings. Any ineffective portion of the change in value is reported directly in the income statement.
Inventories Inventory of raw materials, consumables, work in progress and finished goods are valued at the lower of cost and net sales value. Inventory is valued on a First-In, First-Out (FIFO) basis. Felling rights, representing the cost to acquire the right to fell timber on land that the Group does not own, are valued at acquisition cost and are expensed when the corresponding wood is used in production or sold. Felling rights are reclassified as raw materials (logs and timber) as the timber is harvested based on the relationship between the remaining book value of the felling rights and the es-timated volume of recoverable timber. The costs of purchase of inventories comprise the purchase price, import duties and other taxes (other than VAT), and transport, handling and other costs directly attributable to the acquisition of inventories. Trade discounts, rebates and other similar items are deducted in determining the costs of purchase. Net sales value is the estimated selling price in the ordinary course of business less the estimated costs necessary to make the sale.
Employee remuneration Pension commitments are reported as a liability in the balance sheet. The liability is calculated on the basis of company-specific actuarial assumptions, with due conside-ration of such features as the estimated future pay adjustments. The Group has one defined benefit multi-employer plan, which is insured with the mutual insurance com-pany Alecta (ITP plan). There is a lack of information to permit the reporting of the Group’s proportional share of the defined benefit commitment and of the plan assets and costs associated with this plan. Consequently, the plan is reported as if it were a defined contribution plan, which means that the expenses notes for the Group incur-red are reported as a cost. In addition, the Group has one defined benefit pension plan covering employees in Sweden. The cost of providing benefits in accordance with this plan is determined via the Projected Unit Credit Method (PUCM method) on the basis of actuarial assumptions. Deviation from the actual pension expenses and return represent actuarial gains and losses. All actuarial gains and losses, plus any supplements for payroll taxes, are charged to other comprehensive income.
Share-based remuneration Kinnevik has running share saving programmes for which the fair value, calculated at the date of valuation, of the allotted share-based instruments is expensed over the vesting period and is recognized directly in equity. The cost is based on the Group’s assessment of the number of shares that will be allotted. Fair value is restated on every balance-sheet date, to reflect calculations of social security costs expensed continuously over the vesting period in the various companies. Senior executives within Korsnäs participate in the Plan.
Other provisions Provisions are reported when the Group has a legal or contractual obligation to fulfill the obligation, when it is likely that a payment or some other form of compensation is required to settle the undertaking and a reliable estimate of the amount can be made. Provisions are reported at their discounted present value when the time horizon exceeds two years. A provision for restructuring is reported when the Group has pre-sented a detailed plan for the implementation of the measures and the plan has been communicated to the parties involved and soundly based anticipation is created.
Revenue recognition
Sale of products
Revenue from the sale of products, net of allowance for returns and discounts, is recognized when products are delivered and significant risks and benefits associated with ownership of the goods are transferred and can be reliably measured.
17
Rendering of services
Revenue from the sale of services is recognized at the time the service is rendered to the customer, after deductions for discounts.
Interest
Revenue is recognized as the interest accrues to the net carrying amount of the financial assets.
Dividends received Dividends received are recognized when the shareholders’ right to receive the payment is assessed as certain.
Research and Development costs Research and development costs are charged to the income statement during the year they arise, unless the Company can demonstrate that the amount will be able to generate future economic benefit.
Marketing costs Advertising costs and other marketing activities are expensed as they arise.
Income tax The total tax on the year’s income consists of current and deferred tax. Taxes are stated in the income statement except when the underlying transaction is charged directly against equity, in which case the related tax effect is also stated in equity. Cur-rent tax expense is the tax that is to be paid or received for the year in question, plus correction of tax expense for earlier periods. Deferred tax is calculated on the basis of the temporary differences between the book values of assets and liabilities and their value for tax purposes. The amounts are calculated on the basis of how these dif-ferences can be expected to be evened out and using the tax rates and rules in effect or announced as of the closing date. Temporary differences are not recorded in the case of differences attributable to interests in subsidiaries and associated companies that are not expected to be taxable in the foreseeable future. In the consolidated financial statements, untaxed reserves are divided into deferred tax liability and equity. The deferred tax asset component of deductible temporary differences and tax loss carry forwards is only recorded in so far as it is likely that these will result in a lower tax payment in the future.
Dividends paid For dividends in kind, the net assets value is recorded as dividend. Cash dividends to shareholders are recorded in the accounting period the dividend is approved.
Leases Leases are classified in the consolidated accounts as financial leases or operational leases. A financial lease is when the financial risk and benefits are associated with the ownership of an item is essentially transferred from the lessee to the lessor, regardless of whether or not the lessee retains the legal right of ownership of the asset. For financial leases, the leasing asset is reported as an asset and the obligation for future payments as a liability in the balance sheet. An operating lease is a lease that does not fulfill the conditions for financial leases. For operating leases, the rental expense is reported in the lessee’s accounts distributed equally over the period during which the asset is used, even if the payments are made according to some other schedule.
Cash flow statement For purposes of the Parent Company and the consolidated cash-flow statements, the Group include cash and investments with original duration of maximum three months among cash and bank. The book value of these items corresponds to fair value.
New accounting rules The following standards and amendments to standards, which came into effect as of 1 January 2010 or later, have not been applied for 2009 but are expected to have effect on the consolidated financial statements, apart from additional information: - Changes to IFRS 3 involve a number of changes in the reporting of business combinations, which will impact the size of reported goodwill, reported earnings for the period when the acquisition occurred, and future reported earnings (starting in 2010). Other new standards, changes in standards and interpretation of standards are deemed to not be applicable to Korsnäs operations.
Significant judgments and assumptions The preparation of the annual financial statements and consolidated financial statements includes a number of estimates and assumptions. The application of these estimates and assumptions affects the reporting and disclosures. Accounting policies that require more significant judgments by the Board and the management in the application of IFRS, and assumptions and estimations in matters that are inherently uncertain, are summarized below. Actuarial assumptions and other assumptions and estimations when estimating the provisions for pensions (Note 21) and other provisions (Note 22) could have a material impact on the financial statements. The estimates used are based on experience, market information and practice, and are regularly reviewed.
Note 2 Segment reporting
The segment reporting consists of two business areas, Korsnäs Industrial and Korsnäs Forestry. This distribution coincides with management’s internal structure for controlling and monitoring the Group’s operations. The accounting policies for the business segments coincide with the Group’s accounting policies. The operations in the business areas are: 1. Korsnäs Industrial – following the acquisition of Frövi – conducts operations at two
facilities: Korsnäs Gävle and Korsnäs Frövi, with annual capacity of 1,125,000 tons of paper and board products. Paperboard is the largest product area in terms of volume with Folding Carton, Liquid Packaging Board used for packaging beverages and White Top Kraft Liner used as the outer layer in corrugated board packaging.
2. Korsnäs Forestry supplies Korsnäs Industrial’s pulp and paper mill with wood har-vested from purchased felling rights, and wood purchased from outside suppliers, as well as pursuing forestry in line with external wood delivery agreements.
18
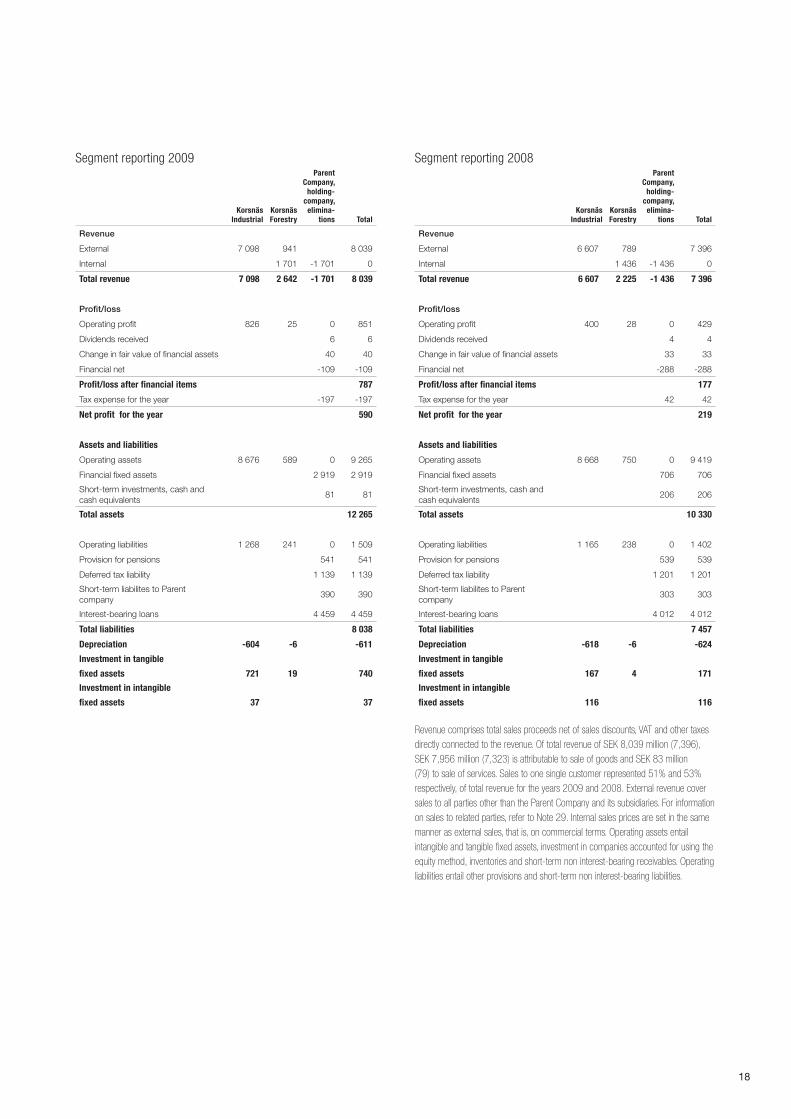
Segment reporting 2009
Korsnäs Industrial
Korsnäs Forestry
Parent Company,
holding-company,
elimina-tions Total
Revenue
External 7 098 941 8 039
Internal 1 701 -1 701 0
Total revenue 7 098 2 642 -1 701 8 039
Profit/loss
Operating profit 826 25 0 851
Dividends received 6 6
Change in fair value of financial assets 40 40
Financial net -109 -109
Profit/loss after financial items 787
Tax expense for the year -197 -197
Net profit for the year 590
Assets and liabilities
Operating assets 8 676 589 0 9 265
Financial fixed assets 2 919 2 919
Short-term investments, cash and cash equivalents
81 81
Total assets 12 265
Operating liabilities 1 268 241 0 1 509
Provision for pensions 541 541
Deferred tax liability 1 139 1 139
Short-term liabilites to Parent company
390 390
Interest-bearing loans 4 459 4 459
Total liabilities 8 038
Depreciation -604 -6 -611
Investment in tangible
fixed assets 721 19 740
Investment in intangible
fixed assets 37 37
Segment reporting 2008
Korsnäs Industrial
Korsnäs Forestry
Parent Company,
holding-company,
elimina-tions Total
Revenue
External 6 607 789 7 396
Internal 1 436 -1 436 0
Total revenue 6 607 2 225 -1 436 7 396
Profit/loss
Operating profit 400 28 0 429
Dividends received 4 4
Change in fair value of financial assets 33 33
Financial net -288 -288
Profit/loss after financial items 177
Tax expense for the year 42 42
Net profit for the year 219
Assets and liabilities
Operating assets 8 668 750 0 9 419
Financial fixed assets 706 706
Short-term investments, cash and cash equivalents
206 206
Total assets 10 330
Operating liabilities 1 165 238 0 1 402
Provision for pensions 539 539
Deferred tax liability 1 201 1 201
Short-term liabilites to Parent company
303 303
Interest-bearing loans 4 012 4 012
Total liabilities 7 457
Depreciation -618 -6 -624
Investment in tangible
fixed assets 167 4 171
Investment in intangible
fixed assets 116 116
Revenue comprises total sales proceeds net of sales discounts, VAT and other taxes directly connected to the revenue. Of total revenue of SEK 8,039 million (7,396), SEK 7,956 million (7,323) is attributable to sale of goods and SEK 83 million (79) to sale of services. Sales to one single customer represented 51% and 53% respectively, of total revenue for the years 2009 and 2008. External revenue cover sales to all parties other than the Parent Company and its subsidiaries. For information on sales to related parties, refer to Note 29. Internal sales prices are set in the same manner as external sales, that is, on commercial terms. Operating assets entail intangible and tangible fixed assets, investment in companies accounted for using the equity method, inventories and short-term non interest-bearing receivables. Operating liabilities entail other provisions and short-term non interest-bearing liabilities.
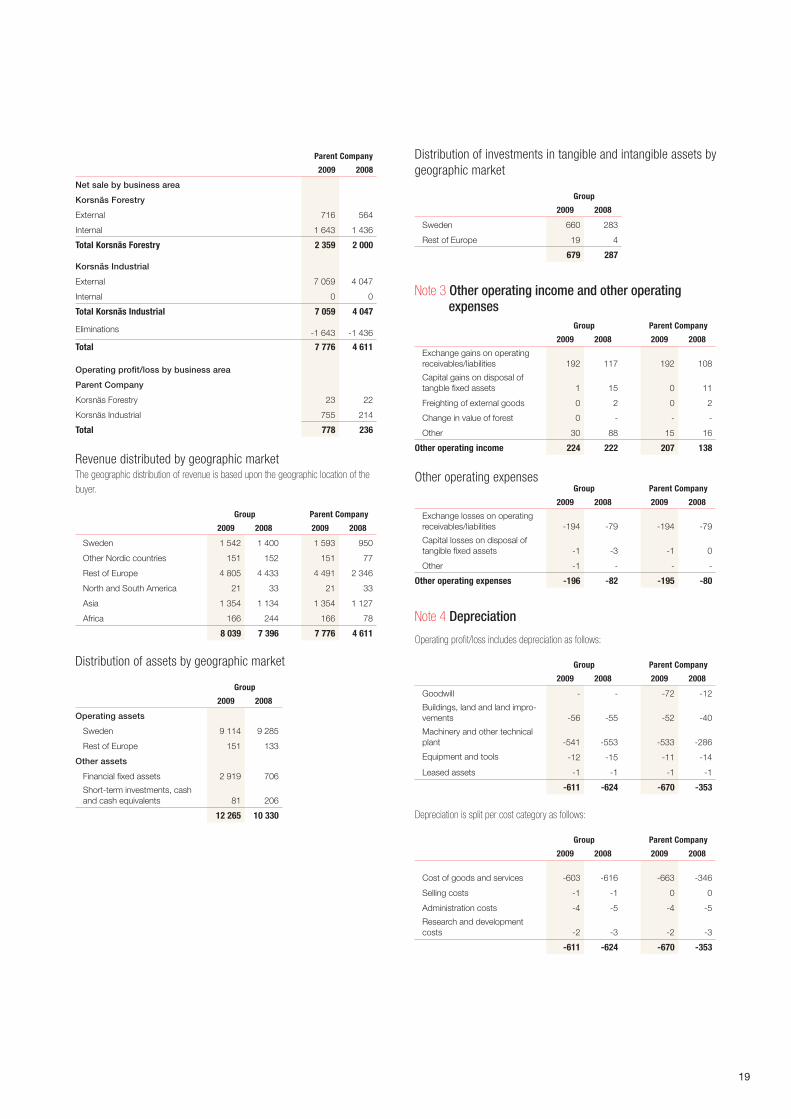
19
Parent Company
2009 2008
Net sale by business area
Korsnäs Forestry
External 716 564
Internal 1 643 1 436
Total Korsnäs Forestry 2 359 2 000
Korsnäs Industrial
External 7 059 4 047
Internal 0 0
Total Korsnäs Industrial 7 059 4 047
Eliminations -1 643 -1 436
Total 7 776 4 611
Operating profit/loss by business area
Parent Company
Korsnäs Forestry 23 22
Korsnäs Industrial 755 214
Total 778 236
Revenue distributed by geographic marketThe geographic distribution of revenue is based upon the geographic location of the buyer.
Group Parent Company
2009 2008 2009 2008
Sweden 1 542 1 400 1 593 950
Other Nordic countries 151 152 151 77
Rest of Europe 4 805 4 433 4 491 2 346
North and South America 21 33 21 33
Asia 1 354 1 134 1 354 1 127
Africa 166 244 166 78
8 039 7 396 7 776 4 611
Distribution of assets by geographic market
Group
2009 2008
Operating assets
Sweden 9 114 9 285
Rest of Europe 151 133
Other assets
Financial fixed assets 2 919 706
Short-term investments, cash and cash equivalents 81 206
12 265 10 330
Distribution of investments in tangible and intangible assets by geographic market
Group
2009 2008
Sweden 660 283
Rest of Europe 19 4
679 287
Note 3 Other operating income and other operating expenses
Group Parent Company
2009 2008 2009 2008
Exchange gains on operating receivables/liabilities 192 117 192 108
Capital gains on disposal of tangble fixed assets 1 15 0 11
Freighting of external goods 0 2 0 2
Change in value of forest 0 - - -
Other 30 88 15 16
Other operating income 224 222 207 138
Other operating expensesGroup Parent Company
2009 2008 2009 2008
Exchange losses on operating receivables/liabilities -194 -79 -194 -79
Capital losses on disposal of tangible fixed assets -1 -3 -1 0
Other -1 - - -
Other operating expenses -196 -82 -195 -80
Note 4 Depreciation
Operating profit/loss includes depreciation as follows:
Group Parent Company
2009 2008 2009 2008
Goodwill - - -72 -12
Buildings, land and land impro-vements -56 -55 -52 -40
Machinery and other technical plant -541 -553 -533 -286
Equipment and tools -12 -15 -11 -14
Leased assets -1 -1 -1 -1
-611 -624 -670 -353
Depreciation is split per cost category as follows:
Group Parent Company
2009 2008 2009 2008
Cost of goods and services -603 -616 -663 -346
Selling costs -1 -1 0 0
Administration costs -4 -5 -4 -5
Research and development costs -2 -3 -2 -3
-611 -624 -670 -353
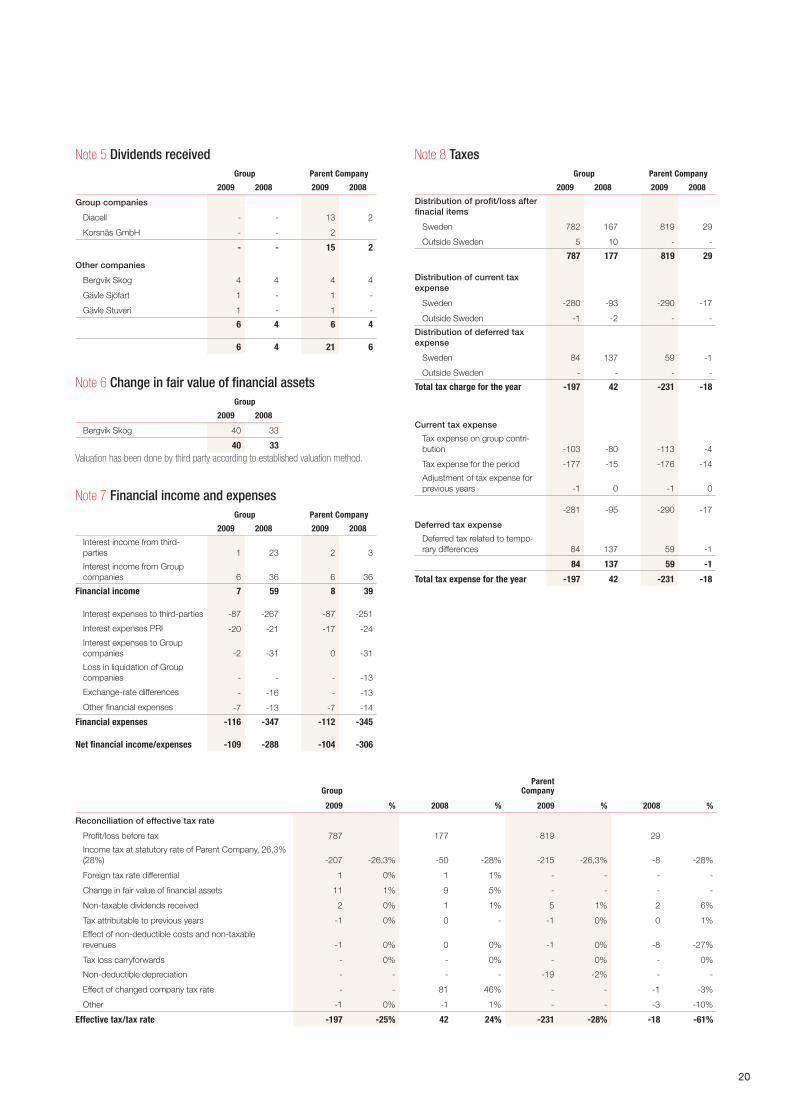
20
Note 5 Dividends receivedGroup Parent Company
2009 2008 2009 2008
Group companies
Diacell - - 13 2
Korsnäs GmbH - - 2
- - 15 2
Other companies
Bergvik Skog 4 4 4 4
Gävle Sjöfart 1 - 1 -
Gävle Stuveri 1 - 1 -
6 4 6 4
6 4 21 6
Note 6 Change in fair value of financial assetsGroup
2009 2008
Bergvik Skog 40 33
40 33Valuation has been done by third party according to established valuation method.
Note 7 Financial income and expensesGroup Parent Company
2009 2008 2009 2008
Interest income from third-parties 1 23 2 3
Interest income from Group companies 6 36 6 36
Financial income 7 59 8 39
Interest expenses to third-parties -87 -267 -87 -251
Interest expenses PRI -20 -21 -17 -24
Interest expenses to Group companies -2 -31 0 -31
Loss in liquidation of Group companies - - - -13
Exchange-rate differences - -16 - -13
Other financial expenses -7 -13 -7 -14
Financial expenses -116 -347 -112 -345
Net financial income/expenses -109 -288 -104 -306
GroupParent
Company
2009 % 2008 % 2009 % 2008 %
Reconciliation of effective tax rate
Profit/loss before tax 787 177 819 29
Income tax at statutory rate of Parent Company, 26,3% (28%) -207 -26,3% -50 -28% -215 -26,3% -8 -28%
Foreign tax rate differential 1 0% 1 1% - - - -
Change in fair value of financial assets 11 1% 9 5% - - - -
Non-taxable dividends received 2 0% 1 1% 5 1% 2 6%
Tax attributable to previous years -1 0% 0 - -1 0% 0 1%
Effect of non-deductible costs and non-taxable revenues -1 0% 0 0% -1 0% -8 -27%
Tax loss carryforwards - 0% - 0% - 0% - 0%
Non-deductible depreciation - - - - -19 -2% - -
Effect of changed company tax rate - - 81 46% - - -1 -3%
Other -1 0% -1 1% - - -3 -10%
Effective tax/tax rate -197 -25% 42 24% -231 -28% -18 -61%
Note 8 TaxesGroup Parent Company
2009 2008 2009 2008
Distribution of profit/loss after finacial items
Sweden 782 167 819 29
Outside Sweden 5 10 - -
787 177 819 29
Distribution of current tax expense
Sweden -280 -93 -290 -17
Outside Sweden -1 -2 - -
Distribution of deferred tax expense
Sweden 84 137 59 -1
Outside Sweden - - - -
Total tax charge for the year -197 42 -231 -18
Current tax expense
Tax expense on group contri-bution -103 -80 -113 -4
Tax expense for the period -177 -15 -176 -14
Adjustment of tax expense for previous years -1 0 -1 0
-281 -95 -290 -17
Deferred tax expense
Deferred tax related to tempo-rary differences 84 137 59 -1
84 137 59 -1
Total tax expense for the year -197 42 -231 -18
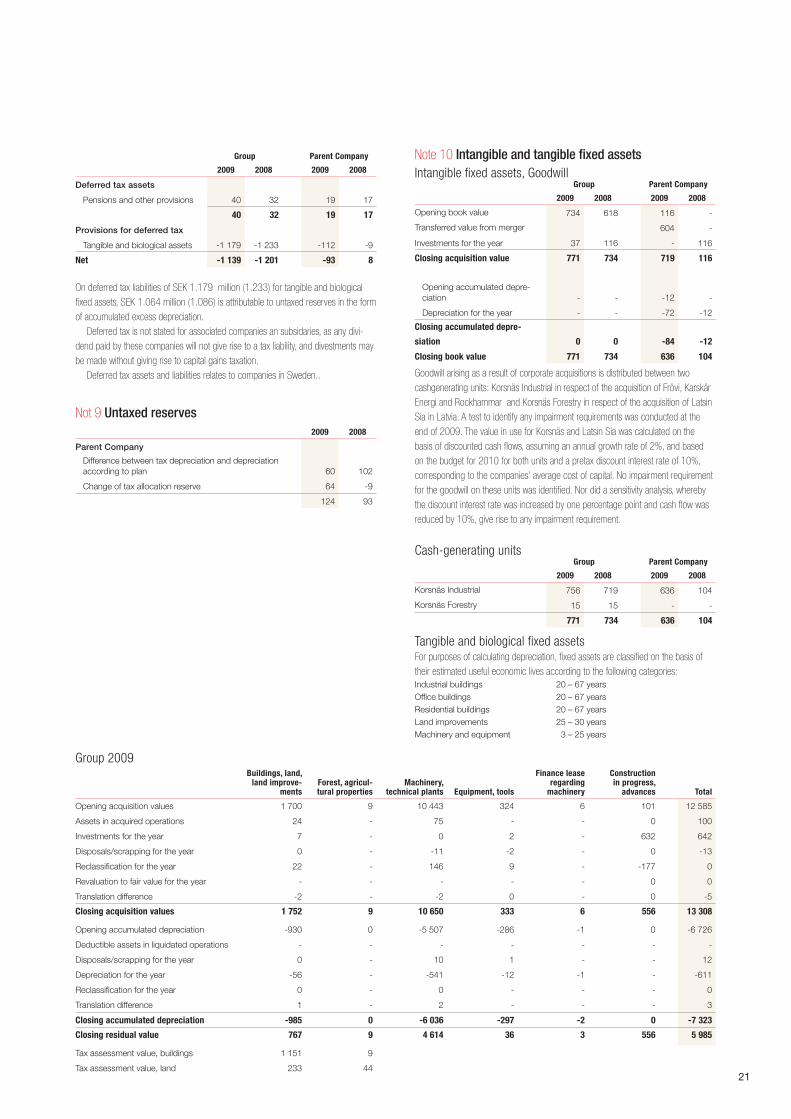
21
Group Parent Company
2009 2008 2009 2008
Deferred tax assets
Pensions and other provisions 40 32 19 17
40 32 19 17
Provisions for deferred tax
Tangible and biological assets -1 179 -1 233 -112 -9
Net -1 139 -1 201 -93 8
On deferred tax liabilities of SEK 1.179 million (1.233) for tangible and biological fixed assets, SEK 1.064 million (1.086) is attributable to untaxed reserves in the form of accumulated excess depreciation.
Deferred tax is not stated for associated companies an subsidaries, as any divi-dend paid by these companies will not give rise to a tax liability, and divestments may be made without giving rise to capital gains taxation.
Deferred tax assets and liabilities relates to companies in Sweden..
Not 9 Untaxed reserves2009 2008
Parent Company
Difference between tax depreciation and depreciation according to plan 60 102
Change of tax allocation reserve 64 -9
124 93
Group 2009Buildings, land,
land improve-ments
Forest, agricul-tural properties
Machinery, technical plants Equipment, tools
Finance lease regarding
machinery
Construction in progress,
advances Total
Opening acquisition values 1 700 9 10 443 324 6 101 12 585
Assets in acquired operations 24 - 75 - - 0 100
Investments for the year 7 - 0 2 - 632 642
Disposals/scrapping for the year 0 - -11 -2 - 0 -13
Reclassification for the year 22 - 146 9 - -177 0
Revaluation to fair value for the year - - - - - 0 0
Translation difference -2 - -2 0 - 0 -5
Closing acquisition values 1 752 9 10 650 333 6 556 13 308
Opening accumulated depreciation -930 0 -5 507 -286 -1 0 -6 726
Deductible assets in liquidated operations - - - - - - -
Disposals/scrapping for the year 0 - 10 1 - - 12
Depreciation for the year -56 - -541 -12 -1 - -611
Reclassification for the year 0 - 0 - - - 0
Translation difference 1 - 2 - - - 3
Closing accumulated depreciation -985 0 -6 036 -297 -2 0 -7 323
Closing residual value 767 9 4 614 36 3 556 5 985
Tax assessment value, buildings 1 151 9
Tax assessment value, land 233 44
Note 10 Intangible and tangible fixed assetsIntangible fixed assets, Goodwill
Group Parent Company
2009 2008 2009 2008
Opening book value 734 618 116 -
Transferred value from merger 604 -
Investments for the year 37 116 - 116
Closing acquisition value 771 734 719 116
Opening accumulated depre-ciation - - -12 -
Depreciation for the year - - -72 -12
Closing accumulated depre-
siation 0 0 -84 -12
Closing book value 771 734 636 104
Goodwill arising as a result of corporate acquisitions is distributed between two cashgenerating units: Korsnäs Industrial in respect of the acquisition of Frövi, Karskär Energi and Rockhammar and Korsnäs Forestry in respect of the acquisition of Latsin Sia in Latvia. A test to identify any impairment requirements was conducted at the end of 2009. The value in use for Korsnäs and Latsin Sia was calculated on the basis of discounted cash flows, assuming an annual growth rate of 2%, and based on the budget for 2010 for both units and a pretax discount interest rate of 10%, corresponding to the companies’ average cost of capital. No impairment requirement for the goodwill on these units was identified. Nor did a sensitivity analysis, whereby the discount interest rate was increased by one percentage point and cash flow was reduced by 10%, give rise to any impairment requirement.
Cash-generating unitsGroup Parent Company
2009 2008 2009 2008
Korsnäs Industrial 756 719 636 104
Korsnäs Forestry 15 15 - -
771 734 636 104
Tangible and biological fixed assetsFor purposes of calculating depreciation, fixed assets are classified on the basis of their estimated useful economic lives according to the following categories:Industrial buildings 20 – 67 yearsOffice buildings 20 – 67 yearsResidential buildings 20 – 67 yearsLand improvements 25 – 30 yearsMachinery and equipment 3 – 25 years
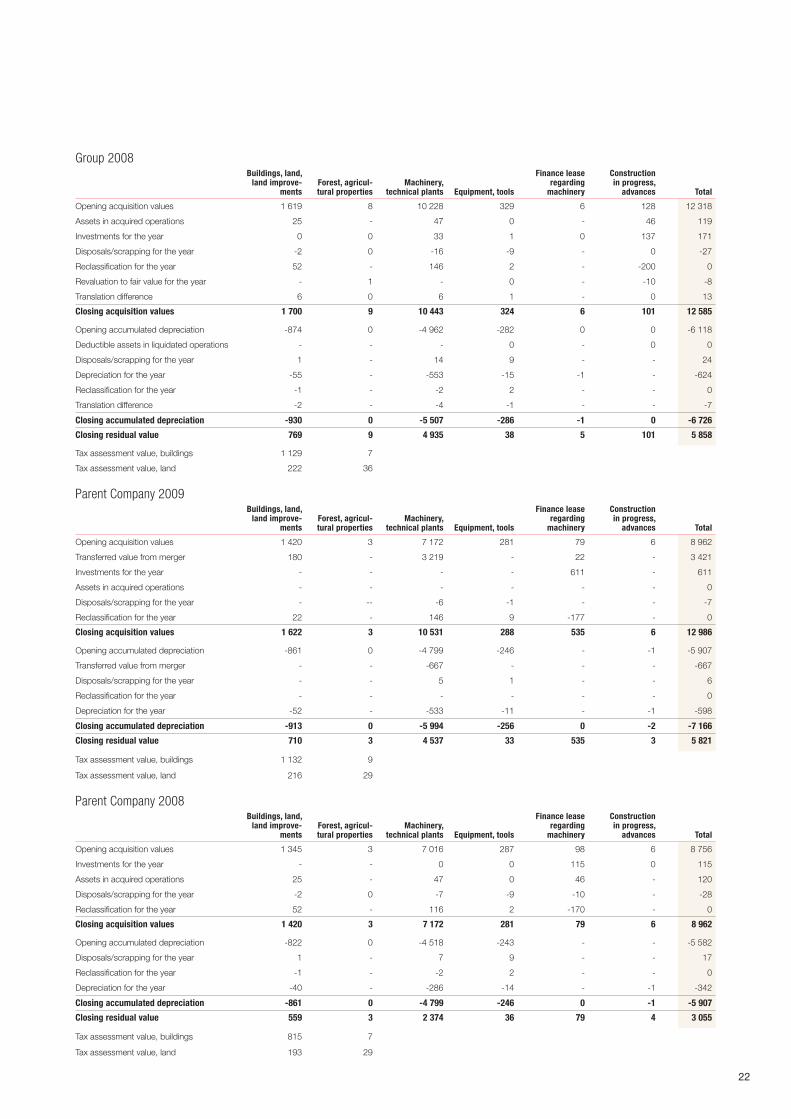
22
Group 2008Buildings, land,
land improve-ments
Forest, agricul-tural properties
Machinery, technical plants Equipment, tools
Finance lease regarding
machinery
Construction in progress,
advances Total
Opening acquisition values 1 619 8 10 228 329 6 128 12 318
Assets in acquired operations 25 - 47 0 - 46 119
Investments for the year 0 0 33 1 0 137 171
Disposals/scrapping for the year -2 0 -16 -9 - 0 -27
Reclassification for the year 52 - 146 2 - -200 0
Revaluation to fair value for the year - 1 - 0 - -10 -8
Translation difference 6 0 6 1 - 0 13
Closing acquisition values 1 700 9 10 443 324 6 101 12 585
Opening accumulated depreciation -874 0 -4 962 -282 0 0 -6 118
Deductible assets in liquidated operations - - - 0 - 0 0
Disposals/scrapping for the year 1 - 14 9 - - 24
Depreciation for the year -55 - -553 -15 -1 - -624
Reclassification for the year -1 - -2 2 - - 0
Translation difference -2 - -4 -1 - - -7
Closing accumulated depreciation -930 0 -5 507 -286 -1 0 -6 726
Closing residual value 769 9 4 935 38 5 101 5 858
Tax assessment value, buildings 1 129 7
Tax assessment value, land 222 36
Parent Company 2009Buildings, land,
land improve-ments
Forest, agricul-tural properties
Machinery, technical plants Equipment, tools
Finance lease regarding
machinery
Construction in progress,
advances Total
Opening acquisition values 1 420 3 7 172 281 79 6 8 962
Transferred value from merger 180 - 3 219 - 22 - 3 421
Investments for the year - - - - 611 - 611
Assets in acquired operations - - - - - - 0
Disposals/scrapping for the year - -- -6 -1 - - -7
Reclassification for the year 22 - 146 9 -177 - 0
Closing acquisition values 1 622 3 10 531 288 535 6 12 986
Opening accumulated depreciation -861 0 -4 799 -246 - -1 -5 907
Transferred value from merger - - -667 - - - -667
Disposals/scrapping for the year - - 5 1 - - 6
Reclassification for the year - - - - - - 0
Depreciation for the year -52 - -533 -11 - -1 -598
Closing accumulated depreciation -913 0 -5 994 -256 0 -2 -7 166
Closing residual value 710 3 4 537 33 535 3 5 821
Tax assessment value, buildings 1 132 9
Tax assessment value, land 216 29
Parent Company 2008Buildings, land,
land improve-ments
Forest, agricul-tural properties
Machinery, technical plants Equipment, tools
Finance lease regarding
machinery
Construction in progress,
advances Total
Opening acquisition values 1 345 3 7 016 287 98 6 8 756
Investments for the year - - 0 0 115 0 115
Assets in acquired operations 25 - 47 0 46 - 120
Disposals/scrapping for the year -2 0 -7 -9 -10 - -28
Reclassification for the year 52 - 116 2 -170 - 0
Closing acquisition values 1 420 3 7 172 281 79 6 8 962
Opening accumulated depreciation -822 0 -4 518 -243 - - -5 582
Disposals/scrapping for the year 1 - 7 9 - - 17
Reclassification for the year -1 - -2 2 - - 0
Depreciation for the year -40 - -286 -14 - -1 -342
Closing accumulated depreciation -861 0 -4 799 -246 0 -1 -5 907
Closing residual value 559 3 2 374 36 79 4 3 055
Tax assessment value, buildings 815 7
Tax assessment value, land 193 29
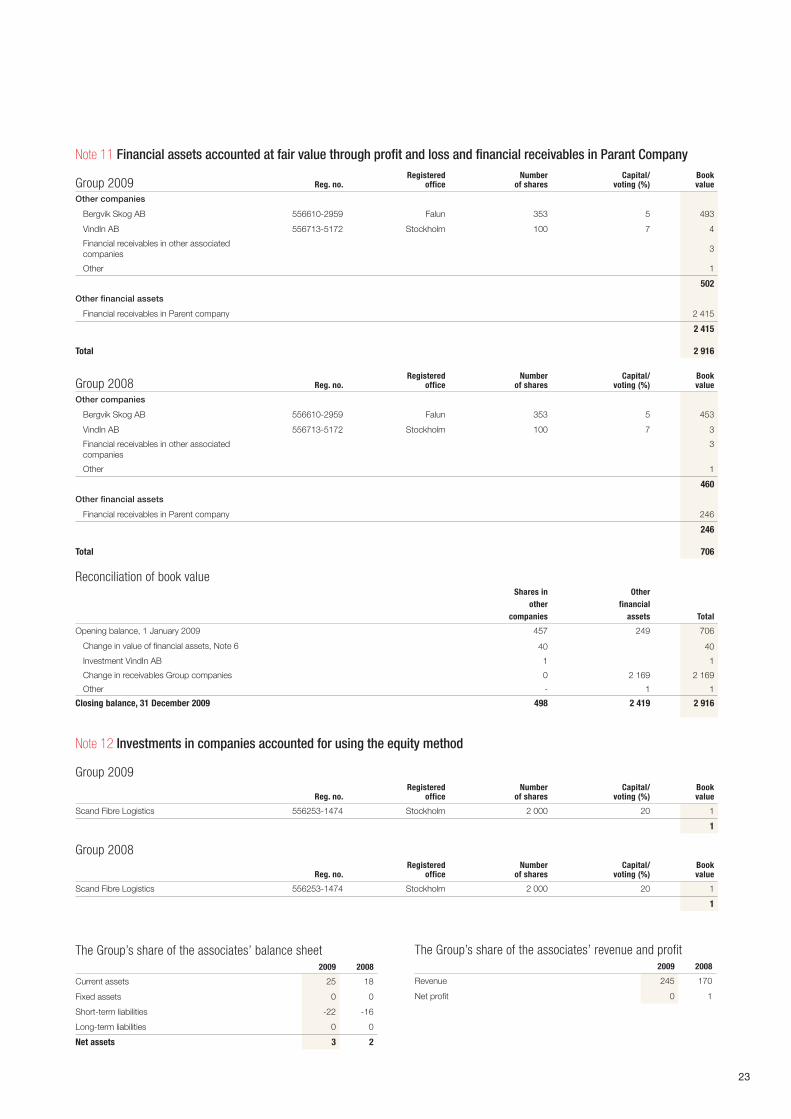
23
Note 11 Financial assets accounted at fair value through profit and loss and financial receivables in Parant Company
Group 2009 Reg. no.Registered
officeNumber
of sharesCapital/
voting (%)Book value
Other companies
Bergvik Skog AB 556610-2959 Falun 353 5 493
VindIn AB 556713-5172 Stockholm 100 7 4
Financial receivables in other associated companies
3
Other 1
502
Other financial assets
Financial receivables in Parent company 2 415
2 415
Total 2 916
Group 2008 Reg. no.Registered
officeNumber
of sharesCapital/
voting (%)Book value
Other companies
Bergvik Skog AB 556610-2959 Falun 353 5 453
VindIn AB 556713-5172 Stockholm 100 7 3
Financial receivables in other associated companies
3
Other 1
460
Other financial assets
Financial receivables in Parent company 246
246
Total 706
Reconciliation of book valueShares in
other companies
Other financial
assets Total
Opening balance, 1 January 2009 457 249 706
Change in value of financial assets, Note 6 40 40
Investment VindIn AB 1 1
Change in receivables Group companies 0 2 169 2 169
Other - 1 1
Closing balance, 31 December 2009 498 2 419 2 916
Note 12 Investments in companies accounted for using the equity method
Group 2009
Reg. no.Registered
officeNumber
of sharesCapital/
voting (%)Book value
Scand Fibre Logistics 556253-1474 Stockholm 2 000 20 1
1
Group 2008
Reg. no.Registered
officeNumber
of sharesCapital/
voting (%)Book value
Scand Fibre Logistics 556253-1474 Stockholm 2 000 20 1
1
The Group’s share of the associates’ balance sheet2009 2008
Current assets 25 18
Fixed assets 0 0
Short-term liabilities -22 -16
Long-term liabilities 0 0
Net assets 3 2
The Group’s share of the associates’ revenue and profit2009 2008
Revenue 245 170
Net profit 0 1
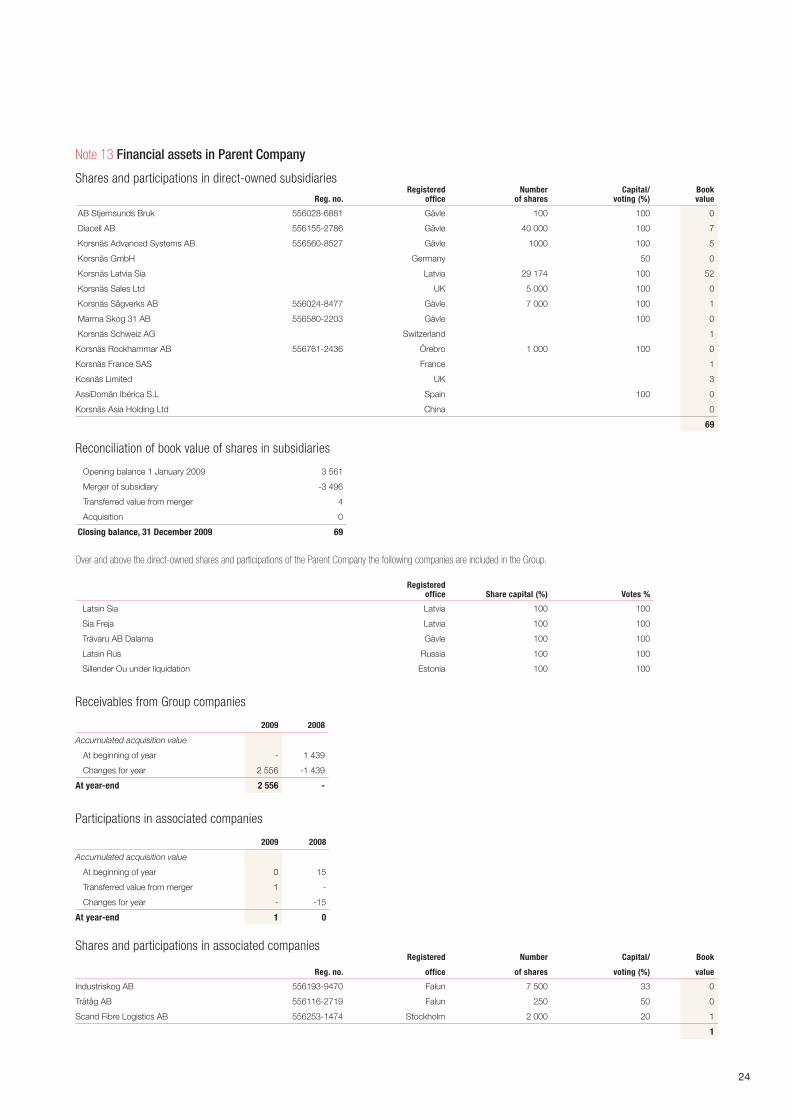
24
Note 13 Financial assets in Parent Company
Shares and participations in direct-owned subsidiaries
Reg. no.Registered
officeNumber
of sharesCapital/
voting (%)Book value
AB Stjernsunds Bruk 556028-6881 Gävle 100 100 0
Diacell AB 556155-2786 Gävle 40 000 100 7
Korsnäs Advanced Systems AB 556560-8527 Gävle 1000 100 5
Korsnäs GmbH Germany 50 0
Korsnäs Latvia Sia Latvia 29 174 100 52
Korsnäs Sales Ltd UK 5 000 100 0
Korsnäs Sågverks AB 556024-8477 Gävle 7 000 100 1
Marma Skog 31 AB 556580-2203 Gävle 100 0
Korsnäs Schweiz AG Switzerland 1
Korsnäs Rockhammar AB 556761-2436 Örebro 1 000 100 0
Korsnäs France SAS France 1
Kosnäs Limited UK 3
AssiDomän Ibérica S.L Spain 100 0
Korsnäs Asia Holding Ltd China 0
69
Reconciliation of book value of shares in subsidiaries
Opening balance 1 January 2009 3 561
Merger of subsidiary -3 496
Transferred value from merger 4
Acquisition 0
Closing balance, 31 December 2009 69
Over and above the direct-owned shares and participations of the Parent Company the following companies are included in the Group.
Registered office Share capital (%) Votes %
Latsin Sia Latvia 100 100
Sia Freja Latvia 100 100
Trävaru AB Dalarna Gävle 100 100
Latsin Rus Russia 100 100
Sillender Ou under liquidation Estonia 100 100
Receivables from Group companies
2009 2008
Accumulated acquisition value
At beginning of year - 1 439
Changes for year 2 556 -1 439
At year-end 2 556 -
Participations in associated companies
2009 2008
Accumulated acquisition value
At beginning of year 0 15
Transferred value from merger 1 -
Changes for year - -15
At year-end 1 0
Shares and participations in associated companies
Reg. no.
Registered
office
Number
of shares
Capital/
voting (%)
Book
value
Industriskog AB 556193-9470 Falun 7 500 33 0
Trätåg AB 556116-2719 Falun 250 50 0
Scand Fibre Logistics AB 556253-1474 Stockholm 2 000 20 1
1
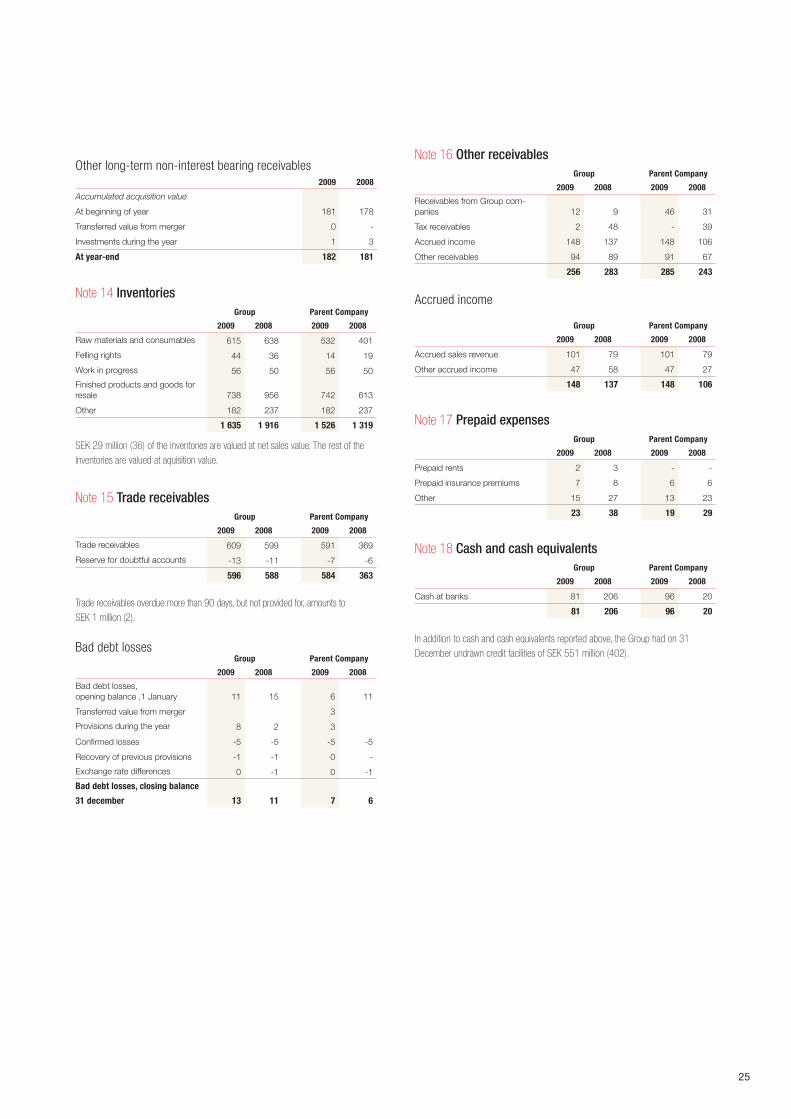
25
Other long-term non-interest bearing receivables2009 2008
Accumulated acquisition value
At beginning of year 181 178
Transferred value from merger 0 -
Investments during the year 1 3
At year-end 182 181
Note 14 InventoriesGroup Parent Company
2009 2008 2009 2008
Raw materials and consumables 615 638 532 401
Felling rights 44 36 14 19
Work in progress 56 50 56 50
Finished products and goods for resale 738 956 742 613
Other 182 237 182 237
1 635 1 916 1 526 1 319
SEK 29 million (36) of the inventories are valued at net sales value. The rest of the inventories are valued at aquisition value.
Note 15 Trade receivablesGroup Parent Company
2009 2008 2009 2008
Trade receivables 609 599 591 369
Reserve for doubtful accounts -13 -11 -7 -6
596 588 584 363
Trade receivables overdue more than 90 days, but not provided for, amounts to SEK 1 million (2).
Bad debt lossesGroup Parent Company
2009 2008 2009 2008
Bad debt losses,opening balance ,1 January 11 15 6 11
Transferred value from merger 3
Provisions during the year 8 2 3
Confirmed losses -5 -5 -5 -5
Recovery of previous provisions -1 -1 0 -
Exchange rate differences 0 -1 0 -1
Bad debt losses, closing balance
31 december 13 11 7 6
Note 16 Other receivablesGroup Parent Company
2009 2008 2009 2008
Receivables from Group com-panies 12 9 46 31
Tax receivables 2 48 - 39
Accrued income 148 137 148 106
Other receivables 94 89 91 67
256 283 285 243
Accrued income
Group Parent Company
2009 2008 2009 2008
Accrued sales revenue 101 79 101 79
Other accrued income 47 58 47 27
148 137 148 106
Note 17 Prepaid expensesGroup Parent Company
2009 2008 2009 2008
Prepaid rents 2 3 - -
Prepaid insurance premiums 7 8 6 6
Other 15 27 13 23
23 38 19 29
Note 18 Cash and cash equivalentsGroup Parent Company
2009 2008 2009 2008
Cash at banks 81 206 96 20
81 206 96 20
In addition to cash and cash equivalents reported above, the Group had on 31 December undrawn credit facilities of SEK 551 million (402).
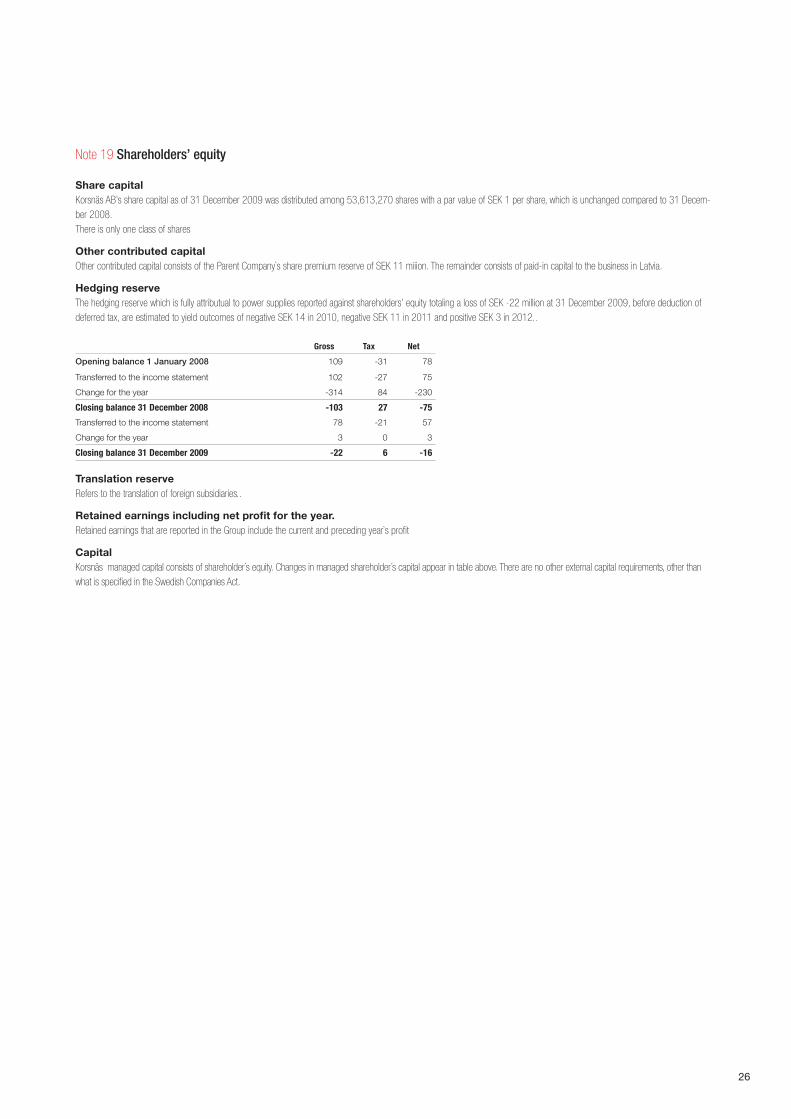
26
Note 19 Shareholders’ equity
Share capitalKorsnäs AB’s share capital as of 31 December 2009 was distributed among 53,613,270 shares with a par value of SEK 1 per share, which is unchanged compared to 31 Decem-ber 2008.There is only one class of shares
Other contributed capital Other contributed capital consists of the Parent Company`s share premium reserve of SEK 11 miiion. The remainder consists of paid-in capital to the business in Latvia.
Hedging reserve The hedging reserve which is fully attributual to power supplies reported against shareholders’ equity totaling a loss of SEK -22 million at 31 December 2009, before deduction of deferred tax, are estimated to yield outcomes of negative SEK 14 in 2010, negative SEK 11 in 2011 and positive SEK 3 in 2012..
Gross Tax Net
Opening balance 1 January 2008 109 -31 78
Transferred to the income statement 102 -27 75
Change for the year -314 84 -230
Closing balance 31 December 2008 -103 27 -75
Transferred to the income statement 78 -21 57
Change for the year 3 0 3
Closing balance 31 December 2009 -22 6 -16
Translation reserve Refers to the translation of foreign subsidiaries..
Retained earnings including net profit for the year. Retained earnings that are reported in the Group include the current and preceding year`s profit
CapitalKorsnäs managed capital consists of shareholder´s equity. Changes in managed shareholder´s capital appear in table above. There are no other external capital requirements, other than what is specified in the Swedish Companies Act.
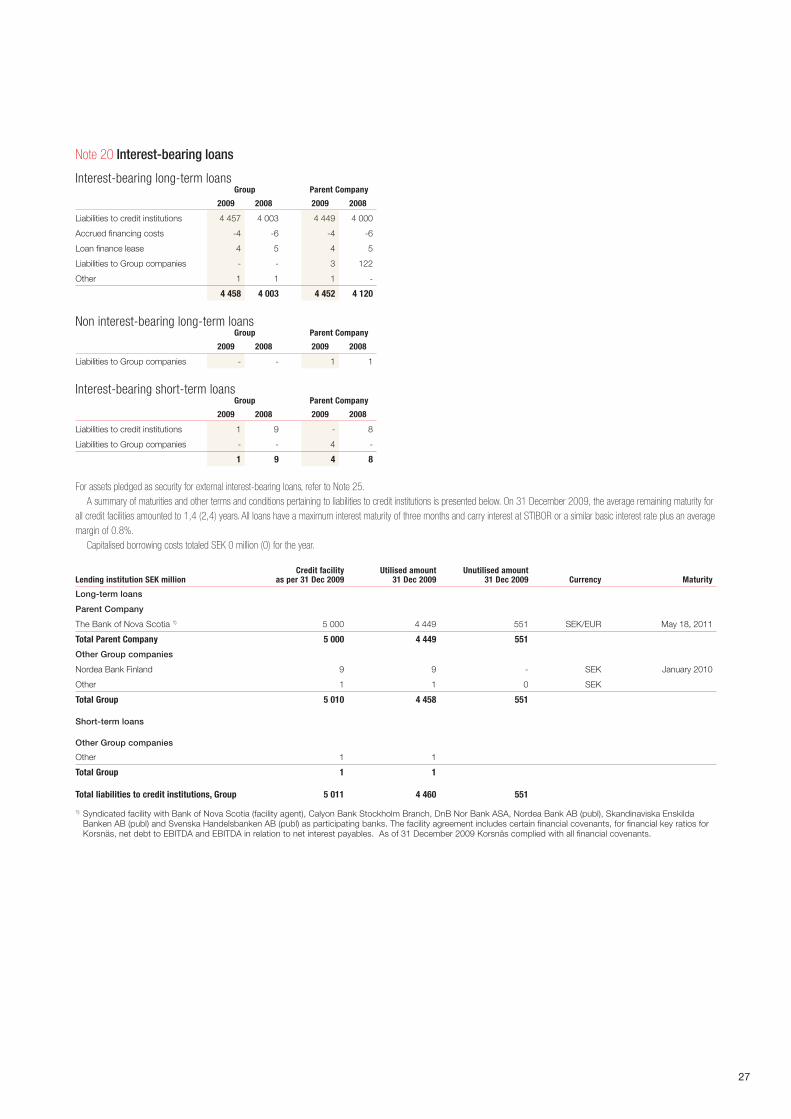
27
Note 20 Interest-bearing loans
Interest-bearing long-term loansGroup Parent Company
2009 2008 2009 2008
Liabilities to credit institutions 4 457 4 003 4 449 4 000
Accrued financing costs -4 -6 -4 -6
Loan finance lease 4 5 4 5
Liabilities to Group companies - - 3 122
Other 1 1 1 -
4 458 4 003 4 452 4 120
Non interest-bearing long-term loansGroup Parent Company
2009 2008 2009 2008
Liabilities to Group companies - - 1 1
Interest-bearing short-term loansGroup Parent Company
2009 2008 2009 2008
Liabilities to credit institutions 1 9 - 8
Liabilities to Group companies - - 4 -
1 9 4 8
For assets pledged as security for external interest-bearing loans, refer to Note 25.A summary of maturities and other terms and conditions pertaining to liabilities to credit institutions is presented below. On 31 December 2009, the average remaining maturity for
all credit facilities amounted to 1,4 (2,4) years. All loans have a maximum interest maturity of three months and carry interest at STIBOR or a similar basic interest rate plus an average margin of 0.8%.
Capitalised borrowing costs totaled SEK 0 million (0) for the year.
Lending institution SEK millionCredit facility
as per 31 Dec 2009Utilised amount
31 Dec 2009Unutilised amount
31 Dec 2009 Currency Maturity
Long-term loans
Parent Company
The Bank of Nova Scotia 1) 5 000 4 449 551 SEK/EUR May 18, 2011
Total Parent Company 5 000 4 449 551
Other Group companies
Nordea Bank Finland 9 9 - SEK January 2010
Other 1 1 0 SEK
Total Group 5 010 4 458 551
Short-term loans
Other Group companies
Other 1 1
Total Group 1 1
Total liabilities to credit institutions, Group 5 011 4 460 551
1) Syndicated facility with Bank of Nova Scotia (facility agent), Calyon Bank Stockholm Branch, DnB Nor Bank ASA, Nordea Bank AB (publ), Skandinaviska Enskilda Banken AB (publ) and Svenska Handelsbanken AB (publ) as participating banks. The facility agreement includes certain financial covenants, for financial key ratios for Korsnäs, net debt to EBITDA and EBITDA in relation to net interest payables. As of 31 December 2009 Korsnäs complied with all financial covenants.
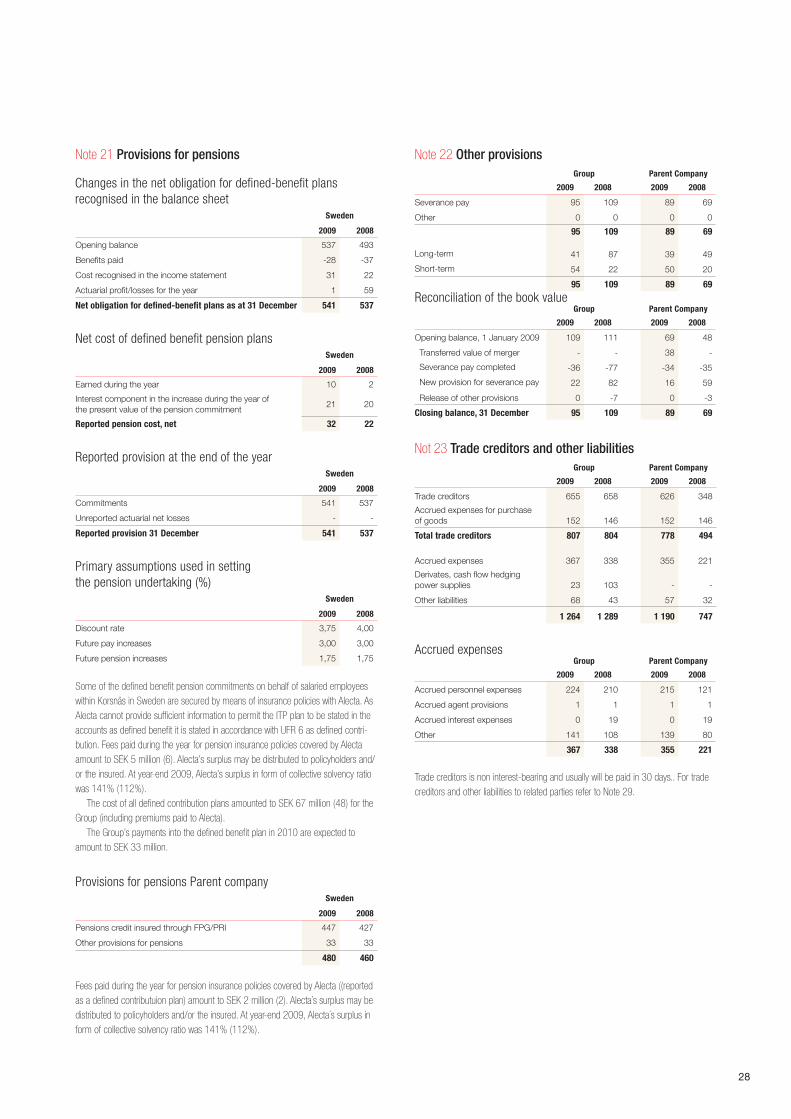
28
Note 21 Provisions for pensions
Changes in the net obligation for defined-benefit plans recognised in the balance sheet
Sweden
2009 2008
Opening balance 537 493
Benefits paid -28 -37
Cost recognised in the income statement 31 22
Actuarial profit/losses for the year 1 59
Net obligation for defined-benefit plans as at 31 December 541 537
Net cost of defined benefit pension plansSweden
2009 2008
Earned during the year 10 2
Interest component in the increase during the year ofthe present value of the pension commitment
21 20
Reported pension cost, net 32 22
Reported provision at the end of the yearSweden
2009 2008
Commitments 541 537
Unreported actuarial net losses - -
Reported provision 31 December 541 537
Primary assumptions used in setting the pension undertaking (%)
Sweden
2009 2008
Discount rate 3,75 4,00
Future pay increases 3,00 3,00
Future pension increases 1,75 1,75
Some of the defined benefit pension commitments on behalf of salaried employees within Korsnäs in Sweden are secured by means of insurance policies with Alecta. As Alecta cannot provide sufficient information to permit the ITP plan to be stated in the accounts as defined benefit it is stated in accordance with UFR 6 as defined contri-bution. Fees paid during the year for pension insurance policies covered by Alecta amount to SEK 5 million (6). Alecta’s surplus may be distributed to policyholders and/or the insured. At year-end 2009, Alecta’s surplus in form of collective solvency ratio was 141% (112%).
The cost of all defined contribution plans amounted to SEK 67 million (48) for the Group (including premiums paid to Alecta).
The Group’s payments into the defined benefit plan in 2010 are expected to amount to SEK 33 million.
Provisions for pensions Parent companySweden
2009 2008
Pensions credit insured through FPG/PRI 447 427
Other provisions for pensions 33 33
480 460
Fees paid during the year for pension insurance policies covered by Alecta ((reported as a defined contributuion plan) amount to SEK 2 million (2). Alecta´s surplus may be distributed to policyholders and/or the insured. At year-end 2009, Alecta´s surplus in form of collective solvency ratio was 141% (112%).
Note 22 Other provisionsGroup Parent Company
2009 2008 2009 2008
Severance pay 95 109 89 69
Other 0 0 0 0
95 109 89 69
Long-term 41 87 39 49
Short-term 54 22 50 20
95 109 89 69
Reconciliation of the book valueGroup Parent Company
2009 2008 2009 2008
Opening balance, 1 January 2009 109 111 69 48
Transferred value of merger - - 38 -
Severance pay completed -36 -77 -34 -35
New provision for severance pay 22 82 16 59
Release of other provisions 0 -7 0 -3
Closing balance, 31 December 95 109 89 69
Not 23 Trade creditors and other liabilitiesGroup Parent Company
2009 2008 2009 2008
Trade creditors 655 658 626 348
Accrued expenses for purchase of goods 152 146 152 146
Total trade creditors 807 804 778 494
Accrued expenses 367 338 355 221
Derivates, cash flow hedging power supplies 23 103 - -
Other liabilities 68 43 57 32
1 264 1 289 1 190 747
Accrued expenses Group Parent Company
2009 2008 2009 2008
Accrued personnel expenses 224 210 215 121
Accrued agent provisions 1 1 1 1
Accrued interest expenses 0 19 0 19
Other 141 108 139 80
367 338 355 221
Trade creditors is non interest-bearing and usually will be paid in 30 days.. For trade creditors and other liabilities to related parties refer to Note 29.
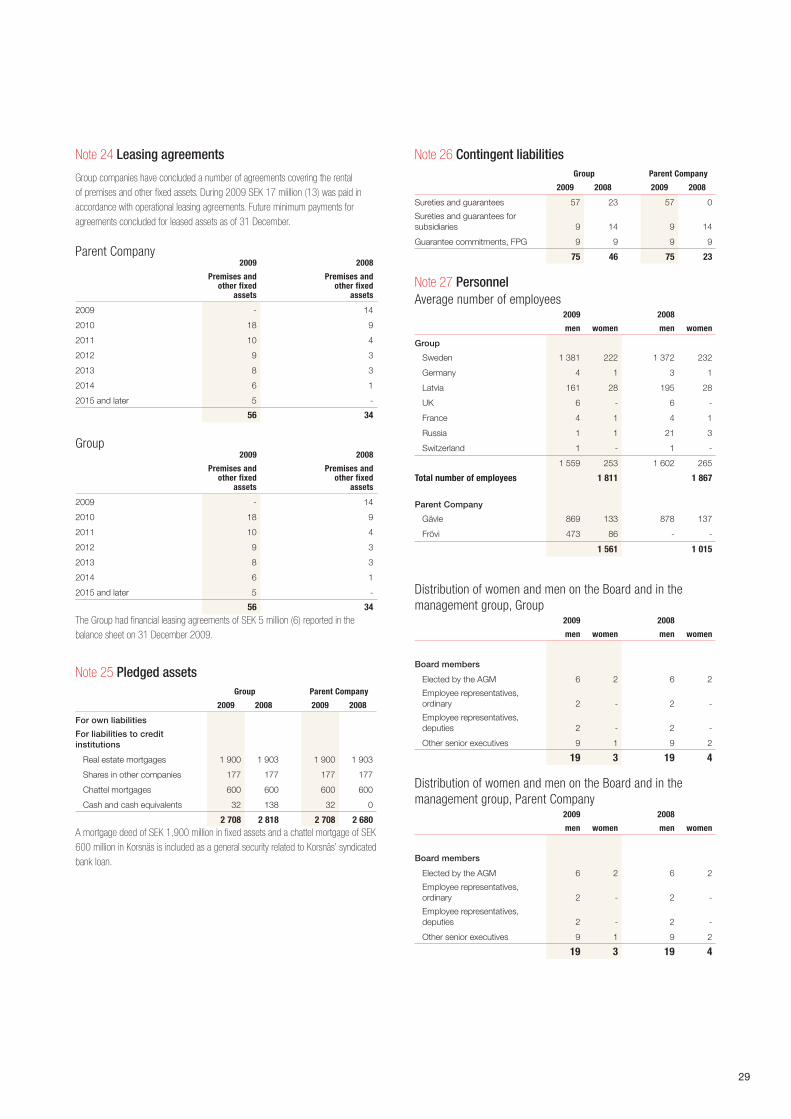
29
Note 24 Leasing agreements
Group companies have concluded a number of agreements covering the rental of premises and other fixed assets. During 2009 SEK 17 miillion (13) was paid in accordance with operational leasing agreements. Future minimum payments for agreements concluded for leased assets as of 31 December.
Parent Company2009 2008
Premises and other fixed
assets
Premises and other fixed
assets
2009 - 14
2010 18 9
2011 10 4
2012 9 3
2013 8 3
2014 6 1
2015 and later 5 -
56 34
Group2009 2008
Premises and other fixed
assets
Premises and other fixed
assets
2009 - 14
2010 18 9
2011 10 4
2012 9 3
2013 8 3
2014 6 1
2015 and later 5 -
56 34The Group had financial leasing agreements of SEK 5 million (6) reported in the balance sheet on 31 December 2009.
Note 25 Pledged assetsGroup Parent Company
2009 2008 2009 2008
For own liabilities
For liabilities to credit institutions
Real estate mortgages 1 900 1 903 1 900 1 903
Shares in other companies 177 177 177 177
Chattel mortgages 600 600 600 600
Cash and cash equivalents 32 138 32 0
2 708 2 818 2 708 2 680A mortgage deed of SEK 1,900 million in fixed assets and a chattel mortgage of SEK 600 million in Korsnäs is included as a general security related to Korsnäs’ syndicated bank loan.
Note 26 Contingent liabilitiesGroup Parent Company
2009 2008 2009 2008
Sureties and guarantees 57 23 57 0
Sureties and guarantees for subsidiaries 9 14 9 14
Guarantee commitments, FPG 9 9 9 9
75 46 75 23
Note 27 PersonnelAverage number of employees
2009 2008
men women men women
Group
Sweden 1 381 222 1 372 232
Germany 4 1 3 1
Latvia 161 28 195 28
UK 6 - 6 -
France 4 1 4 1
Russia 1 1 21 3
Switzerland 1 - 1 -
1 559 253 1 602 265
Total number of employees 1 811 1 867
Parent Company
Gävle 869 133 878 137
Frövi 473 86 - -
1 561 1 015
Distribution of women and men on the Board and in themanagement group, Group
2009 2008
men women men women
Board members
Elected by the AGM 6 2 6 2
Employee representatives, ordinary 2 - 2 -
Employee representatives, deputies 2 - 2 -
Other senior executives 9 1 9 2
19 3 19 4
Distribution of women and men on the Board and in themanagement group, Parent Company
2009 2008
men women men women
Board members
Elected by the AGM 6 2 6 2
Employee representatives, ordinary 2 - 2 -
Employee representatives, deputies 2 - 2 -
Other senior executives 9 1 9 2
19 3 19 4
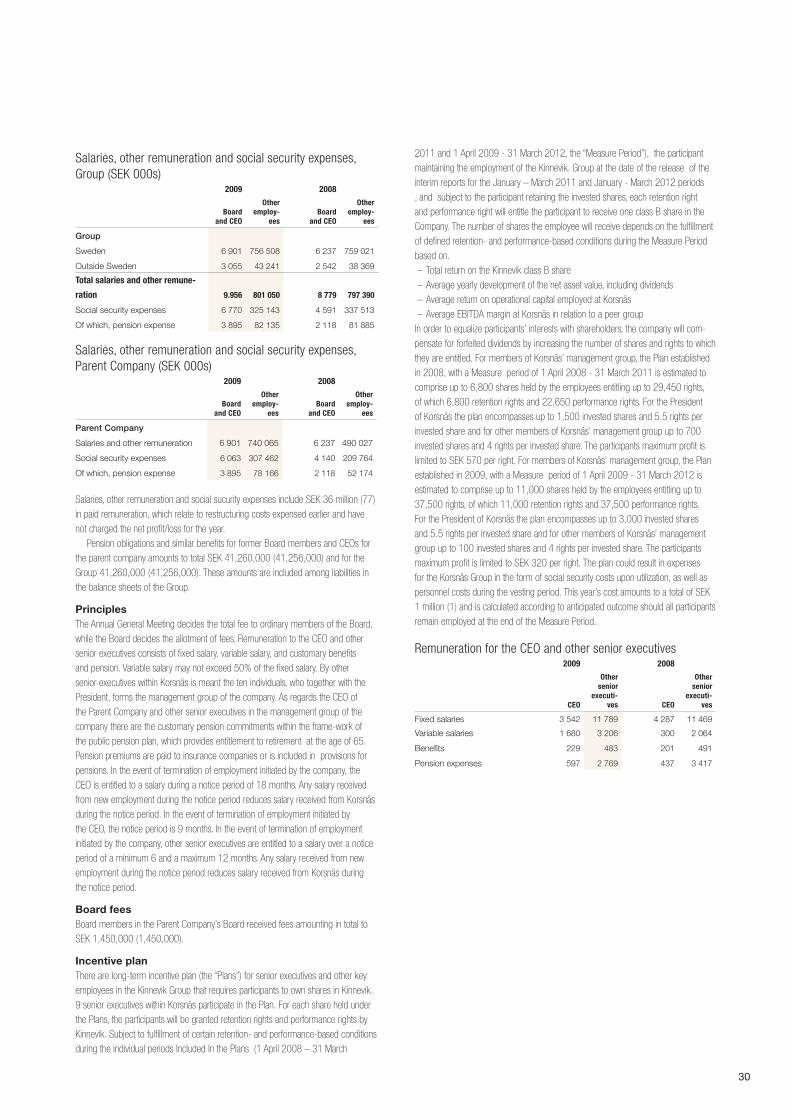
30
Salaries, other remuneration and social security expenses, Group (SEK 000s)
2009 2008
Board and CEO
Other employ-
eesBoard
and CEO
Other employ-
ees
Group
Sweden 6 901 756 508 6 237 759 021
Outside Sweden 3 055 43 241 2 542 38 369
Total salaries and other remune-
ration 9.956 801 050 8 779 797 390
Social security expenses 6 770 325 143 4 591 337 513
Of which, pension expense 3 895 82 135 2 118 81 885
Salaries, other remuneration and social security expenses, Parent Company (SEK 000s)
2009 2008
Board and CEO
Other employ-
eesBoard
and CEO
Other employ-
ees
Parent Company
Salaries and other remuneration 6 901 740 065 6 237 490 027
Social security expenses 6 063 307 462 4 140 209 764
Of which, pension expense 3 895 78 166 2 118 52 174
Salaries, other remuneration and social sucurity expenses include SEK 36 million (77)in paid remuneration, which relate to restructuring costs expensed earlier and havenot charged the net profit/loss for the year.
Pension obligations and similar benefits for former Board members and CEOs for the parent company amounts to total SEK 41,260,000 (41,256,000) and for the Group 41,260,000 (41,256,000). These amounts are included among liabilities in the balance sheets of the Group.
PrinciplesThe Annual General Meeting decides the total fee to ordinary members of the Board, while the Board decides the allotment of fees. Remuneration to the CEO and other senior executives consists of fixed salary, variable salary, and customary benefits and pension. Variable salary may not exceed 50% of the fixed salary. By other senior executives within Korsnäs is meant the ten individuals, who together with the President, forms the management group of the company. As regards the CEO of the Parent Company and other senior executives in the management group of the company there are the customary pension commitments within the frame-work of the public pension plan, which provides entitlement to retirement at the age of 65. Pension premiums are paid to insurance companies or is included in provisions for pensions. In the event of termination of employment initiated by the company, the CEO is entitled to a salary during a notice period of 18 months. Any salary received from new employment during the notice period reduces salary received from Korsnäs during the notice period. In the event of termination of employment initiated by the CEO, the notice period is 9 months. In the event of termination of employment initiated by the company, other senior executives are entitled to a salary over a notice period of a minimum 6 and a maximum 12 months. Any salary received from new employment during the notice period reduces salary received from Korsnäs during the notice period.
Board feesBoard members in the Parent Company’s Board received fees amounting in total to SEK 1,450,000 (1,450,000).
Incentive planThere are long-term incentive plan (the “Plans”) for senior executives and other key employees in the Kinnevik Group that requires participants to own shares in Kinnevik. 9 senior executives within Korsnäs participate in the Plan. For each share held under the Plans, the participants will be granted retention rights and performance rights by Kinnevik. Subject to fulfillment of certain retention- and performance-based conditions during the individual periods Included In the Plans (1 April 2008 – 31 March
2011 and 1 April 2009 - 31 March 2012, the “Measure Period”), the participant maintaining the employment of the Kinnevik. Group at the date of the release of the interim reports for the January – March 2011 and January - March 2012 periods , and subject to the participant retaining the invested shares, each retention right and performance right will entitle the participant to receive one class B share in the Company. The number of shares the employee will receive depends on the fulfillment of defined retention- and performance-based conditions during the Measure Period based on. – Total return on the Kinnevik class B share – Average yearly development of the net asset value, including dividends – Average return on operational capital employed at Korsnäs – Average EBITDA margin at Korsnäs in relation to a peer group In order to equalize participants’ interests with shareholders, the company will com-pensate for forfeited dividends by increasing the number of shares and rights to which they are entitled. For members of Korsnäs’ management group, the Plan established in 2008, with a Measure period of 1 April 2008 - 31 March 2011 is estimated to comprise up to 6,800 shares held by the employees entitling up to 29,450 rights, of which 6,800 retention rights and 22,650 performance rights. For the President of Korsnäs the plan encompasses up to 1,500 invested shares and 5.5 rights per invested share and for other members of Korsnäs’ management group up to 700 invested shares and 4 rights per invested share. The participants maximum profit is limited to SEK 570 per right. For members of Korsnäs’ management group, the Plan established in 2009, with a Measure period of 1 April 2009 - 31 March 2012 is estimated to comprise up to 11,000 shares held by the employees entitling up to 37,500 rights, of which 11,000 retention rights and 37,500 performance rights. For the President of Korsnäs the plan encompasses up to 3,000 invested shares and 5.5 rights per invested share and for other members of Korsnäs’ management group up to 100 invested shares and 4 rights per invested share. The participants maximum profit is limited to SEK 320 per right. The plan could result in expenses for the Korsnäs Group in the form of social security costs upon utilization, as well as personnel costs during the vesting period. This year’s cost amounts to a total of SEK 1 million (1) and is calculated according to anticipated outcome should all participants remain employed at the end of the Measure Period.
Remuneration for the CEO and other senior executives2009 2008
CEO
Other senior
executi-ves CEO
Other senior
executi-ves
Fixed salaries 3 542 11 789 4 287 11 469
Variable salaries 1 680 3 206 300 2 064
Benefits 229 483 201 491
Pension expenses 597 2 769 437 3 417
31
Information regarding sick leave, Parent company2009 2008
Sick leave for women 3,2% 3,4%
Sick leave for men 2,6% 3,3%
Sick leave for employees under 30 years of age 2,4% 2,0%
Sick leave for employees between 30 -49 yrs. of age 2,3% 2,7%
Sick leave for employees above 49 years. of age 3,4% 4,3%
Sick leave for each above group is given in per cent of the groups´ total regular working hours
Total sick leave 2,7% 3,3%
Long-term sick leave 0,8% 1,0%
Total sick leave is given in per cent of employees total regular working hours. Long-term sick leave is the part of the sick leave that refers to a continuing period of time of 60 days or more..
Regular working hours is defined as the working hours according to union agree-ment or other agreement with employee. Vacation and leave of absence is included in regular working hours..
Note 28 Auditors’ feesGroup Parent Company
2009 2008 2009 2008
Audit assignments, Ernst & Young 1,3 1,5 1,0 0,9
Other assignments, Ernst & Young 0,9 0,3 0,9 0,3
Other assignments to Ernst & Young refer to consultation in connection with internal control, questions regarding IFRS and tax advice.
Note 29 Related-party transactions
During 2009 and 2008, Korsnäs engaged in transactions with following related companies.
Related companies RelationshipTele2 AB (”Tele2”) Associated company of Kinnevik.Metro International S.A (”Metro”) Associated company of KinnevikAudit Value S.A. (”Audit Value”) Parties related to Kinnevik own shares
in Audit Value, providing considerable influence over Audit Value.
Sia Latgran Kinnevik owns 51% of the shares.
All transactions with related parties have taken place at arm`s length basis, i.e on market conditions. In connection with acquisitions and divestment independent valuations were used as a basis for negoliations on the final price. in all agreements relating to good and service prices are compared witrh up-to-date prices from independent suppliers in the market to ensure that all agreement are entered into on market conditions.
Commercial agreement with related parties– Korsnäs buys telephony services from Tele2 and Tele2 rent office premises from
Korsnäs.– Korsnäs buys internal audit services from Audit Value..– Korsnäs has bought advertisement from Metro.– Korsnäs sales raw-material for pellets to Sia Latgran.
Financial loan transactions with related partiesNone.
The following is a summary of Korsnäs revenues, expenses, receivables and liabilities to and from related parties..
RevenueGroup Parent Company
2009 2008 2009 2008
Tele2 0,8 0,6 0,8 0,6
Latgran 62,0 128,0 62,0 128,0
62,8 128,6 62,8 128,6
Operating expensesGroup Parent Company
2009 2008 2009 2008
Metro - 0,0 - 0,0
Audit Value 0,1 -0,1 - -0,1
Tele2 -3,1 -2,5 -3,1 -2,5
-3,0 -2,6 -3,1 -2,6
Trade creditors and other non-interest bearing liabilities
Group Parent Company
2009 2008 2009 2008
Tele2 0,1 0,1 0,1 0,1
Note 30 Financial risk management
The Group’s financing and management of financial risks is centralized within Kinnevik’s finance function and is conducted on the basis of a finance policy established by the Board of Directors. The Group has established a model for risk management, the aims of which are to identify, control and reduce risks. The identified risks and how they are managed are reported to the Kinnevik Board on a quarterly basis. Korsnäs is exposed to financial risks mainly in respect of– the interest rate risk resulting from changes in market interest rates– the exchange rate risk comprising transaction exposure and translation exposure– liquidity and refinancing risk, meaning the risk that the cost of financing opportuni-
ties will increase or that such opportunities will be limited when loans are renego-tiated, and that payment obligations cannot be met due to insufficient liquidity.
Interest rate riskThe Group´s policy is to maintain short interest periods because the Company believes that this leads to lower interest expense over time. The Group has no bor-rowing subject to periods of fixed interest exceeding three months. On 31 December 2009, all of Korsnäs’ liabilities to credit institutions, SEK 4,452 million, was exposed to interest rate changes, of which SEK 4,221 million to changes in Stibor, SEK 228 million to changes in Euribor and the rest against interest rates in other currencies. It would take three months for an increase in short-term interest rates to gain its full impact on Korsnäs’ interest expense. Accordingly, if the interest rate will rise with 1%, the interest expense on an annualized basis will rise by SEK 45 million. According to Korsnäs, effects of any increase of the interest rate is managed efficiently via the operating cash flow
Exchange rate risk
Transaction exposure
The Group’s revenues and operating expenses arise mainly in SEK and EUR. The Group’s policy is to endeavour to match revenues and costs in the same currency. The net flow of the Group’s inflow and outflow in foreign currency amounted to a net inflow of approximately SEK 600 million (800) for the year, which consisted mainly of EUR. The Group’s policy is not to hedge this transaction exposure by using, for example, forward contracts. The reason for this approach is that the Group is dealing with a continuously even net inflow of foreign currency for which, over time, hedging measures would also be affected by exchange rate changes. A change in the EUR/SEK rate by SEK 0.10 would have affected consolidated profit in 2009 by approx-imately SEK 6 million.

32
Not 32 Financial assets and liabilities allocated by catagory
Group 2009
Financial assets accounted at fair
value through profit and loss
Loan receivables and
trade receivables Cash flow hedging Financial liabilities
Total book value
Financial assets accounted at fair value 502 502 502
Receiivables from Group companies 2 415 2 415
Trade receivables 596 596
Other current assets 279 279
Cash at bank 81 81
Total financial assets 583 3 290 0 0 3 873
Interest-bearing liabilities 4 459 4 459
Liabilities to Group companies 390 390
Trade creditors 1 017 1 017
Other liabilities 23 23
Total financial liabilities 0 0 23 5 866 5 889
Translation exposure
Translation exposure arises when the earnings and shareholders’ equity of foreign subsidiaries are translated into SEK, and insofar as capital employed within the Group is financed in a currency other than the capital employed in the particular company. The Group´s policy is to use external borrowing in various currencies to finance capital employed in the same currency. If this is not possible and significant temporary currency exposures exist, the Group’s finance policy permits the use of forward contracts. On 31 December 2009, there were no outstanding forward contracts. Translation exposure arising from the translation of the foreign subsidiaries’ earnings and shareholders’ equity is not hedged since the exposure is considered being of no material importance to Korsnäs.
Liquidity and refinancing risk
The Group’s refinancing risk is limited by having loans from a number of different cre-dit institutions maturing at different times as well as striving for refinancing all loans at least six months prior to maturity. On 31 December 2009, the available credit facility amounts from credit institutions totaled SEK 5,011 (4,414) million and the average remaining term to maturity was 1.4 (2.4) years.
Note 31 Business combinations
2009
Korsnäs Rockhammar ABIn March, Korsnäs signed an agreement to acquire operations in Rockhammar Mill from Rottneros. Rockhammar Mill was at the time it was acquired licensed to produce 60,000 tons of chemical thermo-mechanical pulp, CTMP, annually, and has a present application for permission to increase production to 90,000 tons annually. The production increase in Rockhammar will enable Korsnäs to become self-sufficient in pulp for its entire production of paper and cartonboard, which is expected to reduce production costs. The purchase consideration, including transaction costs, amounted to SEK 147 million. The acquisition was made through a recently formed subsidiary, Korsnäs Rockhanmmar AB. According to the acquisition analysis, the acquisition cost
is distributed as follows: goodwill in the amount of SEK 37 million, tangible assets SEK 100 million, inventories 17 million and accrued personnel costs SEK 6 million. Korsnäs Rockhammar has contributed to the Group’s result with a SEK 10 million since the transaction was completed on 1 April. The result includes costs in relation to the integration work between Rockhammar and the plant in Frövi, which entails a staff reduction negotiated with the trade union organizations. The entire volume produ-ced in Rockhammar after the acquisition has been sold internally within the Korsnäs Group. If Korsnäs Rockhammar had been included in the Group from 1 January, it is estimated that profit would have been approximately SEK 8 million higher
2008
Karskär Energi ABHaving previously held 41% of the shares in Karskär Energi AB, Korsnäs acquired the remaining 59% in January 2008 from E.ON Sverige AB for the purchase price of SEK 200 million. The transaction encompasses a combined heating and power plant that has been in the Korsnäs industrial area in Gävle since 1971. Karskär Energi produces 350 GWh of electricity a year and the acquisition implies that from now on Korsnäs will produce 38% of the annual electricity consumption internally at its plants in Gävle and Frövi. Karskär Energi has been fully consolidated with the Group since 1 January 2008 and, according to the purchase price allocation, the transaction generated SEK 116 million in goodwill after Karskär Energi’s book value of tangible fixed assets had been adjusted by SEK 31 million, provisions increased by SEK 14 million, and a deferred tax liability of SEK 5 million had been reported. In the purchase price allocation the total value of Karskär SEK 254 million, including previously held shares SEK 54 million, was allocated to : Goodwill SEK 116 million, tangible fixed assets SEK 120 million, current assets SEK 165 million whereof cash and bank SEK 0 million, provisions SEK 14 million, deferred tax liability SEK 33 million and liabilities SEK 100 million. The goodwill is entirely assignable to expected synergy effects. Karskär Energi is expected to contribute approximately SEK 40 million a year in profit, the full effect of which will appear once the operations have been fully integrated with Korsnäs Industrial during 2009. During 2008 Karskär Energi AB was merged into Korsnäs AB.

33
Group 2008
Financial assets accounted at fair
value through profit and loss
Loan receivables and
trade receivables Cash flow hedging Financial liabilities
Total book value
Financial assets accounted at fair value 459 459
Receivables from Parent company 247 247
Other fixed assets 0 0
Trade receivables 588 588
Other current assets 321 321
Cash at bank 206 206
Total financial assets 665 1 156 0 0 1 821
Interest-bearing liabilities 4 012 4 012
Liabilities to Group companies 307 307
Trade creditors 658 658
Other liabilities 103 317 420
Total financial liabilities 0 0 103 5 294 5 397
Fair valueFair value of all financial assets and liabilities correspond with book value.
Parent Company 2009Financial assets
acccounted for at cost
Loan receivables and trade receivables
Financial liabilities
Total book value
Receivables from Group companies 1 599 1 599
Receivables from associated companies 2 2
Shares and participation in other companies 183 183
Trade receivables 584 584
Interest bearing receivables 0
Other receivables 258 258
Cash at bank 96 96
Total financial assets 279 2 443 0 2 722
Interest-bearing liabilities 4 449 4 449
Liabilities to Group companies 479 479
Trade creditors 778 778
Other liabilities 197 197
Total financial liabilities 0 0 5 903 5 903
Parent Company 2008Financial assets
acccounted for at cost
Loan receivables and trade receivables
Financial liabilities
Total book value
Receivables from Group companies 31 31
Receivables from associated companies 2 2
Shares and participation in other companies 181 181
Trade receivables 363 363
Interest bearing receivables 0
Other receivables 241 241
Cash at bank 20 20
Total financial assets 201 637 0 838
Interest-bearing liabilities 4 007 4 007
Liabilities to Group companies 55 55
Trade creditors 348 348
Other liabilities 278 278
Total financial liabilities 0 0 4 688 4 688
Fair valueFair value of all financial assets and liabilities correspond with book value.
34
Note 33 Untaxed reservesParent Company
2009 2008
Additional depreciation, machinery and equipment 3 741 2 097
Additional depreciation, buildings 248 263
Additional depreciation, land improvments 10 11
Tax allocation reserve - 64
Total untaxed reserves 3 999 2 435
Note 34 Merger of subsidiary
On May 15, 2009, the wholly-owned subsidiary Korsnäs Frövi AB, with corporate identity number 556004-5097 was merged into the parent company Korsnäs AB. The complete income statement of the transferring company for 2009 is included in the income statement of the takeover company and is recorded in each income statement item. The balance sheet as per January 1, 2009 transferred through the merger is shown as follows, including goodwill on consolidation and adjusted subsidiary shares.
Assets
Shares in Subsidiary companies -3 496
Goodwill 604
Tangible fixed assets 2 754
Financial fixed assets 16
Inventories 548
Short-term receivables 364
Cash at bank 166
Total assets 956
Shareholders` equity and
liabilities
Shareholders` equity -1 416
Untaxed reserves 1 688
Provisions 68
Deferred tax liability 171
Long-term liabilities 1
Short-term liabilities 444
Total sharholders`equity and
liabilities 956
35
The undersigned certify that the consolidated accounts and the annual report have been prepared in accordance with Internatio-
nal Financial reporting standards (“IFrs”), as adopted for use in the European Union, and generally accepted accounting prin-
ciples respectively, and give a true and fair view of the financial positions and results of the Group and the Parent Company, and
that the Board of Director’s report gives a fair review of the development of the operations, financial positions and results of the
Group and the Parent Company and describes substantial risks and uncertainties that the Group companies face.
Gävle, 22 February 2010
Vigo Carlund Leif Brodén Mia Brunell Livfors
Chairman of the Board Member of the Board Member of the Board
ola Hallberg Edward von Horn ole Kjörrefjord
Member of the Board, Member of the Board Member of the Board
Employee representative
Wilhelm Klingspor Per Eriksson stig nordin
Member of the Board Member of the Board Member of the Board
Employee representative
Cristina stenbeck Christer simrén
Member of the Board CEO
our Audit report was issued on 22 February 2010
Ernst & Young AB
Thomas Forslund
Authorized Public Accountant
36
Audit Report
To the annual meeting of the shareholders of Korsnäs AB
Corporate identity number 556023-8338
We have audited the annual accounts, the consolidated accounts, the accounting records and the administration of the board of
directors and the managing director of Korsnäs AB for the financial year 2008. The company’s annual accounts and consolidated
accounts are included in this document on page 3-34. The board of directors and the managing director are responsible for these
accounts and the administration of the company as well as for the application of the Annual Accounts Act when preparing the
annual accounts and the application of international financial reporting standards IFrss as adopted by the EU and the Annual
Accounts Act when preparing the consolidated accounts. our responsibility is to express an opinion on the annual accounts, the
consolidated accounts and the administration based on our audit.
We conducted our audit in accordance with generally accepted auditing standards in sweden. Those standards require that we
plan and perform the audit to obtain reasonable assurance that the annual accounts and the consolidated accounts are free of
material misstatement. An audit includes examining, on a test basis, evidence supporting the amounts and disclosures in the ac-
counts. An audit also includes assessing the accounting principles used and their application by the board of directors and the
managing director and significant estimates made by the board of directors and the managing director when preparing the annual
accounts and consolidated accounts as well as evaluating the overall presentation of information in the annual accounts and the
consolidated accounts. As a basis for our opinion concerning discharge from liability, we examined significant decisions, actions
taken and circumstances of the company in order to be able to determine the liability, if any, to the company of any board mem-
ber or the managing director. We also examined whether any board member or the managing director has, in any other way, acted
in contravention of the Companies Act, the Annual Accounts Act or the Articles of Association. We believe that our audit provides a
reasonable basis for our opinion set out below.
The annual accounts have been prepared in accordance with the Annual Accounts Act and give a true and fair view of the
company’s financial position and results of operations in accordance with generally accepted accounting principles in sweden.
The consolidated accounts have been prepared in accordance with the international financial reporting standards IFrss as adop-
ted by the EU and the Annual Accounts Act and give a true and fair view of the group´s financial position and results of opera-
tions. The statutory administration report is consistent with the other parts of the annual accounts and the consolidated accounts.
We recommend to the annual meeting of shareholders that the income statements and balance sheets of the parent company and
the group be adopted, that the profit of the parent company be dealt with in accordance with the proposal in the administration
report and that the members of the board of directors and the managing director be discharged from liability for the financial
year.
damöter och verkställande direktören ansvarsfrihet för räkenskapsåret.
stockholm, 22 February 2010
Ernst & Young AB
Thomas Forslund
Authorized Public Accountant
37
Definitions of financial key ratios
Return on shareholders’ equitynet profit divided by average shareholders’ equity.
Equity/assets ratioshareholders’ equity, including minority holding as a percen-
tage of total assets.
Net debtInterest-bearing liabilities including provisions for pensions
less total interest-bearing receivables, short-term investments
and cash and cash equivalents.
Earnings per shareIncome for the year, attributable to equity holders of the
Parent Company, divided by average number of shares.
Shareholders’ equity per shareshareholders’ equity, attributable to equity holders of the
Parent Company, divided by number of shares.
Dividend per shareProposed dividend per share adjusted for share issues and
splits.
Operational capital employedAverage intangible and tangible fixed assets, investment in
companies accounted for using the equity method, inventory
and current non-interest-bearing receivables after deductions
for other provisions and short-term non interest-bearing
liabilities.
Return on operational capital employedoperating income divided by average operational capital
employed.