Korea: Forest Profile - state.sc.us KOREA MARKET PROFILE KOREA MARKET PROFILE KOREA: FOREST PROFILE1...
12
SOUTH KOREA MARKET PROFILE KOREA MARKET PROFILE KOREA: FOREST PROFILE 1 Korea is a heavily forested country, with 65% (6.5M hectares) of its total area covered with forest. Despite this, Korea is not yet self-sufficient in wood. To large extent, this is because of a lack of mature timber. The Korean government has initiated a forest policy which will result in a well stocked forest. As part of this policy, and in an effort to reduce abusive harvests, there are now restrictions on cutting that apply to forest product companies and individuals. As a result of the new forest policies, the total standing volume increased to 257 mill. cbm in 1984, 70 % higher than 10 years ago (152M m³). Korean forests were badly degraded through the first half of the 20th Century, due to: logging under Japanese occupation; intense demands for fuelwood; and war damage during the Korean conflict. Between 1961 and 1995, however, stocked forest land increased from 4M hectares to 6.3M hectares, as a result of a large-scale reforestation. KOREA’S FOREST DISTRIBUTION Coniferous forests predominate, comprising almost half the forest area. The remaining forests are almost evenly divided between deciduous forest and mixed species forest. The predominant coniferous species are Japanese Larch (Larix leptolepis), Pitch pine (Pinus rigida) and Korean pine (Pinus koraiensis). A high proportion of the South Korea’s forests are the result of large-scale reforestation programmes. Broad-leaved forests include species such as oak, and occupy 28% of the total forest area. The other 27% is covered with mixed forest. By age class, young trees less than 20 years old amount 35% of the growing stock, while trees between the ages of 21 and represent 40%, and trees more than 31 years old are 25%. Harvestable standing volume is 65M m³. Average volume per hectare increased 3.7%, from 39.78 m³ to 38.36 m³ in the late 1970s. This is roughly equivalent to 4 times the volume (11.3m³/ha) in the 1970’s when the government embarked on its current forest policy. POLICIES/ISSUES The goal of the current silvicultural treatments that are being applied is the logical and efficient management of Korea's forest resource. As part of this objective, the government has realized the importance of mechanization in forest practice and has initiated forest road construction in most regions. Ownership of the forest is divided into two types: national forest, and other. National forest is mainly controlled by government organizations and institutes (such as the Forestry Administration) This area represents 1.4M ha, or 21.4% of the total forest area. Other forest ownership can be also separated into two groups by owner: public or private. Between these two types, the majority is private (71.0%). Regardless of forest type all management of forests in mountainous regions are controlled by government policy. PRODUCTS AND TRADE Korea depends on timber imports from Indonesia, Malaysia, the US, New Zealand, Chile and other countries to supply its domestic market and industries. Until now, because Korea has depended on imports for timber, most raw forest products, such as logs, lumber, plywood, and bamboo, are imported and manufactured into secondary products such as plywood, hardboard, particle board, medium density fiberboard, paper, and pulp. Most of these primary products are also consumed by the domestic market, and will continue to be until the forest is in better condition than at present. The vast majority of Korea´s industrial logs is imported, with significant quantities of wood pulp also imported. Korea has an extensive wood processing industry based largely on imported wood. The main products from forests in Korea are non-wood forest products, such as chestnuts and mushrooms, which are major exports. 1 Source: World Forest Institute. http://www.worldforestry.org/wfi/world-forests.htm Forest Cover 2000 Distribution of land cover/use % (1999) ´000 ha Forest Other Wooded Land Other land Korea 6,248 63.3 .0 36.7 Asia 547,791 17.8 4.6 78.3 World 3,869,453 29.4 11.2 58.6 123
Transcript of Korea: Forest Profile - state.sc.us KOREA MARKET PROFILE KOREA MARKET PROFILE KOREA: FOREST PROFILE1...

SOUTH KOREA MARKET PROFILE KOREA MARKET PROFILE KOREA: FOREST PROFILE1
Korea is a heavily forested country, with 65% (6.5M hectares) of its total area covered with forest. Despite this, Korea is not yet self-sufficient in wood. To large extent, this is because of a lack of mature timber. The Korean government has initiated a forest policy which will result in a well stocked forest. As part of this policy, and in an effort to reduce abusive harvests, there are now restrictions on cutting that apply to forest product companies and individuals. As a result of the new forest policies, the total standing volume increased to 257 mill. cbm in 1984, 70 % higher than 10 years ago (152M m³). Korean forests were badly degraded through the first half of the 20th Century, due to: logging under Japanese occupation; intense demands for fuelwood; and war damage during the Korean conflict. Between 1961 and 1995, however, stocked forest land increased from 4M hectares to 6.3M hectares, as a result of a large-scale reforestation. KOREA’S FOREST DISTRIBUTION Coniferous forests predominate, comprising almost half the forest area. The remaining forests are almost evenly divided between deciduous forest and mixed species forest. The predominant coniferous species are Japanese Larch (Larix leptolepis), Pitch pine (Pinus rigida) and Korean pine (Pinus koraiensis). A high proportion of the South Korea’s forests are the result of large-scale reforestation programmes. Broad-leaved forests include species such as oak, and occupy 28% of the total forest area. The other 27% is covered with mixed forest. By age class, young trees less than 20 years old amount 35% of the growing stock, while trees between the ages of 21 and represent 40%, and trees more than 31 years old are 25%. Harvestable standing volume is 65M m³. Average volume per hectare increased 3.7%, from 39.78 m³ to 38.36 m³ in the late 1970s. This is roughly equivalent to 4 times the volume (11.3m³/ha) in the 1970’s when the government embarked on its current forest policy. POLICIES/ISSUES The goal of the current silvicultural treatments that are being applied is the logical and efficient management of Korea's forest resource. As part of this objective, the government has realized the importance of mechanization in forest practice and has initiated forest road construction in most regions. Ownership of the forest is divided into two types: national forest, and other. National forest is mainly controlled by government organizations and institutes (such as the Forestry Administration) This area represents 1.4M ha, or 21.4% of the total forest area. Other forest ownership can be also separated into two groups by owner: public or private. Between these two types, the majority is private (71.0%). Regardless of forest type all management of forests in mountainous regions are controlled by government policy. PRODUCTS AND TRADE Korea depends on timber imports from Indonesia, Malaysia, the US, New Zealand, Chile and other countries to supply its domestic market and industries. Until now, because Korea has depended on imports for timber, most raw forest products, such as logs, lumber, plywood, and bamboo, are imported and manufactured into secondary products such as plywood, hardboard, particle board, medium density fiberboard, paper, and pulp. Most of these primary products are also consumed by the domestic market, and will continue to be until the forest is in better condition than at present. The vast majority of Korea´s industrial logs is imported, with significant quantities of wood pulp also imported. Korea has an extensive wood processing industry based largely on imported wood. The main products from forests in Korea are non-wood forest products, such as chestnuts and mushrooms, which are major exports. 1 Source: World Forest Institute. http://www.worldforestry.org/wfi/world-forests.htm
Forest Cover 2000 Distribution of land cover/use % (1999) ´000 ha Forest Other Wooded Land Other land
Korea 6,248 63.3 .0 36.7
Asia 547,791 17.8 4.6 78.3
World 3,869,453 29.4 11.2 58.6
123

SOUTH KOREA MARKET PROFILE
SOUTH KOREA TRADE OVERVIEW
South Korea Export Stats South Korea Import Stats Commodity: Wood Products (44) Commodity: Wood Products (44) Value: $1,000,000 Value: $1,000,000 Partner Country 2003 SHARE 1YR ∆ 5YR ∆ Partner Country 2003 SHARE 1YR ∆ 5YR ∆ World 1,351.4 100.0% -4.8% 22.1% World 1,769.7 100.0% -3.1% 26.0% Indonesia 235.1 17.4% -7.1% 5.6% New Zealand 295.6 16.7% 3.0% 37.4% Malaysia 212.6 15.7% -2.4% 27.0% Indonesia 290.5 16.4% -5.7% 11.7% China 208.7 15.4% -1.4% 65.9% Malaysia 243.9 13.8% -3.3% 28.5% New Zealand 193.9 14.3% 0.2% 15.7% China 225.7 12.8% -1.6% 60.3% United States 139.6 10.3% 4.0% -11.7% United States 147.8 8.4% -2.3% -16.3% Russia 76.1 5.6% 1.5% 64.0% Russia 111.7 6.3% 2.0% 49.5% Canada 60.5 4.5% 53.9% 168.5% Canada 89.1 5.0% 32.7% 193.9% Australia 42.3 3.1% -13.7% 24.8% Australia 69.3 3.9% -18.0% 41.9% Thailand 25.3 1.9% -21.8% -19.2% Thailand 30.2 1.7% -24.0% -12.3% Germany 20.2 1.5% -29.8% 112.6% Papua N. Guinea 24.0 1.4% -0.6% -47.5%
TOP IMPORTED PRODUCTS
S. KOREA IMPORT STATISTICS FROM WORLD UNITS: $1,000 TYPE HS DESCRIPTION 2001 2002 2003 1YR ∆ 5YR ∆ % Share ALL 44+94 Wood + Furniture 1,721,971 2,064,858 2,068,362 0.2% 37.4% 100.0% ALL 44 ALL WOOD PRODUCTS (EX-FURNITURE) 1,570,942 1,826,477 1,769,728 -3.1% 26.0% 85.6% TOTAL PRIMARY 1,453,036 1,684,026 1,629,418 -3.2% 24.6% 78.8% PRIMARY 4403 Logs 536,326 597,473 610,394 2.2% 17.2% 29.5% PRIMARY 4412 Plywood & Panels 311,991 382,799 417,201 9.0% 60.3% 20.2% PRIMARY 4407 Lumber 223,743 233,322 205,468 -11.9% -21.3% 9.9% PRIMARY 4411 Fiberboard 94,923 146,326 109,044 -25.5% 161.6% 5.3% PRIMARY 4408 Veneers Sheets 93,096 112,166 99,406 -11.4% 91.0% 4.8% PRIMARY 4410 Particle Board 77,593 110,242 78,067 -29.2% 42.6% 3.8% PRIMARY 4401 Fuel Wood & Wood Chips 80,853 64,588 73,904 14.4% -19.1% 3.6% PRIMARY 4402 Wood Charcoal 30,531 33,201 31,621 -4.8% 46.6% 1.5% PRIMARY 4413 Densified Wood Shapes 2,757 2,600 3,069 18.1% 4.5% 0.1% PRIMARY 4405 Wood Wool or Flour 1,088 1,210 1,144 -5.4% 21.7% 0.1% PRIMARY 4404 Hoopwood, Poles, Pickets, Stakes 131 72 90 25.1% -53.6% 0.0% PRIMARY 4406 RR Ties 3 28 9 -65.9% -92.4% 0.0% TOTAL SECONDARY 268,935 380,832 438,944 15.3% 122.3% 21.2% SECONDARY 94 ALL WOOD FURNITURE 151,029 238,381 298,634 25.3% 196.5% 14.4% SECONDARY 4409 Wood, Continuously Shaped 33,828 33,983 38,373 12.9% 36.0% 1.9% SECONDARY 4418 Builders' Carpentry 31,610 44,329 36,032 -18.7% 11.7% 1.7% SECONDARY 4421 Articles Of Wood, Nesoi 18,420 21,445 21,392 -0.2% 76.3% 1.0% SECONDARY 4419 Wood Tableware & Kitchenware 16,933 21,600 19,826 -8.2% 58.4% 1.0% SECONDARY 4420 Wood Marquetry Etc. 3,822 7,124 8,313 16.7% 159.5% 0.4% SECONDARY 4415 Wood Packing Material 6,377 5,720 7,715 34.9% 75.4% 0.4% SECONDARY 4414 Wood Frames Etc. 4,404 5,782 5,837 1.0% 174.1% 0.3% SECONDARY 4417 Tool & Broom Bodies 2,428 2,400 2,401 0.0% 36.5% 0.1% SECONDARY 4416 Cooperage Products 84 68 421 520.5% 164.5% 0.0%
124

SOUTH KOREA MARKET PROFILE
IMPORT OVERVIEW Korea imported $2.07Bn in forestry products in 2003, making it one of the top importers in the world. Imports have increased by over 37.0% since 1999, with trade dominated by Asian and Pacific Rim partners. Top suppliers to the Korean market in 2003 were: New Zealand (16.7%), Indonesia (16.4%), Malaysia (13.8%), China (12.8%), and the U.S. (8.4%). Korean imports of Canadian forest products saw the largest percentage gain, rising 193.9% over the period analyzed. The U.S. has seen marginal declines in export values over the period, with market share given up to the aforementioned competitors. Primary imports account for 78.8% of total demand, while secondary imports retained the rest (21.2%).
PRIMARY PRODUCTS IMPORTS LOGS
Korean imports of logs saw moderate growth of 17.2% over the 5-yr period, reaching $610Bn in total value. Logs represent just over 29% of total wood products demand with Softwood logs being the dominant category. SW Log imports accounted for 84% of the import market for all logs. Major suppliers of the Korean log market were: New Zealand (45.2%), Russia (17.0%), the U.S. (15.5%), and Australia (5.8%). Imports of U.S. logs saw significant growth of 37.5%, nearly double the average, for the period. Top performing countries were New Zealand, Russia, and Canada. Canadian logs rose by over 600% from 1999 levels making Canada the 5th larger supplier of logs to Korea.
SOUTH KOREA IMPORTS: PRIMARY
UNITS: $1,000
PRODUCT 2003 % Share
1 YR AGR
5 YR AGR
TOTAL PRIMARY 1,629,418 78.8% -3.2% 24.6% SW Logs 514,348 24.9% 2.8% 38.9% HW Plywood 395,451 19.1% 10.9% 64.8% HW Lumber 143,241 6.9% -15.7% -25.9% MDF 97,890 4.7% -21.3% 248.9% HW Veneers 97,835 4.7% -10.7% 118.7% HW Logs 95,582 4.6% -1.8% -36.4% HW Chips 73,304 3.5% 14.2% -17.9% SW Lumber 62,227 3.0% -1.9% -7.9% Particleboard 46,318 2.2% -12.6% 9.7% Other Panel Products 28,726 1.4% -39.7% 32.7% OSB-WB 24,652 1.2% -37.8% 448.8% Hardboard 19,170 0.9% 20.5% 42.7% SW Plywood 4,062 0.2% -36.8% -55.6% SW Veneers 1,571 0.1% -40.9% -78.5% SW Chips 39 0.0% 107.9% -96.6% Poles 9 0.0% -65.9% -92.4%
LUMBER Lumber imports, in terms of total value, were down -21% over the 5-yr period reaching $205M in 2003. Hardwood lumber accounted for the lion’s share of demand at $143M, while SW lumber saw significantly less “bleeding” than its counterpart. Top suppliers to the Korean lumber market were: Indonesia (29.7%), Malaysia (14.0%), the U.S. (12.4%), China (12.1%), and Canada (11.9%). PANEL PRODUCTS: PLYWOOD, VENEERS, FIBERBOARD, AND PARTICLEBOARD Plywood, at $417M, was the second most imported primary product in Korea in 2003, accounting for 20.2% of the entire market. HW Plywood represented 94% of total Plywood imports making it the dominant category. Indonesia, Malaysia, and China were the largest suppliers to Korea, with a combined market share of 89.9%. The U.S. ranked a distant 8th with only .3% of the market, giving evidence to a highly concentrated supply chain for Plywood. Veneer imports nearly doubled over the 5-yr period, ending at 166M kg or $99.4M in value. Growth from 1999 to 2003 reached 91% with preference given to New Zealand, Malaysian, and Chinese sourced veneers. New Zealand, with several years of underperformance, ramped up exports to 1.8M kg in 2003. The U.S. reached a 2.7% market share in Korea on modest growth of 29.3% over the period, ending at 4.4M kg shipped. In terms of total value of products, the U.S. ranked 3rd with 12.8% of the total value of Korean veneer imports. Fiberboard reached 407M kg in 2003, up almost 150% from 1999 volumes, but down -27.9% from 2002. Total value of fiberboard imports reached $109M, with Medium Density Fiberboard being the preferred category at $98M in 2003. MDF was up almost 250% over 1999 levels. Top suppliers of Fiberboard to Korea were: Australia (18.6%), Indonesia (13.4%), Malaysia (11.2%), and New Zealand (10.4%) once
125

SOUTH KOREA MARKET PROFILE again. Imports of U.S. manufactured fiberboard dropped 94% over the period, ending at 711,000 kg shipped. The U.S. had almost 8% of the market in 1999. Strong gains were made by Malaysia and Australia at the top to take up the lost market share of U.S. underperformance. Particleboard imports reached highs of 650M kg in 2002, dropping back off to 442M kg in 2003. Still, imports of particleboard showed significant improvement over 1999 volumes with growth of 56.4% over the period. Imports of particleboard yielded $78M in sales in 2003, up 42.6%. The largest supplier to the Korean market was Belgium at 19.6%, followed closely by Thailand at 18.1%. Again, OSB/Waferboard showed marked growth at almost 360% from 1999-2003, reaching a value of $24.6M.
SECONDARY PRODUCTS IMPORTS Korean imports of secondary products reached $439M, increasing by 122% from 1999 totals. This growth came on the back of huge increases in imports of Wood Furniture, gaining 196% over the period. As evidenced by the adjacent chart, Wood Furniture dominates the Korean import market, with significant growth in all major sub-categories. Sub-categories dominating secondary imports were Wood Framed Seats, Wood Furniture Parts, Kitchen Furniture, and Builders Carpentry. HW FMS also held a sizeable amount of the secondary
market at $29.7M in 2003.
SOUTH KOREA IMPORTS: SECONDARY UNITS: $1,000
PRODUCT 2003 % Share
1 YR AGR
5 YR AGR
TOTAL SECONDARY 438,944 21.2% 15.3% 122.3% Wood Framed Seats 126,525 6.1% 26.0% 189.2% Wood Furniture Parts 67,411 3.3% 22.9% 261.2% Kitchen Furniture 67,411 3.3% 22.9% 261.2% Builders Carpentry 34,830 1.7% -20.2% 9.8% HW Flooring, Molding, Siding 29,740 1.4% -1.7% 10.5% Household/Bedroom Furniture 21,147 1.0% 45.3% 209.1% Pencil Slats 18,633 0.9% -2.4% 76.8% Office Furniture 10,637 0.5% 22.4% 228.9% SW Flooring, Molding, Siding 9,835 0.5% 121.1% 437.4% Packing Material 7,715 0.4% 34.9% 75.4% Cooperage Products 421 0.0% 520.5% 164.5%
126
SOUTH KOREA MARKET PROFILE
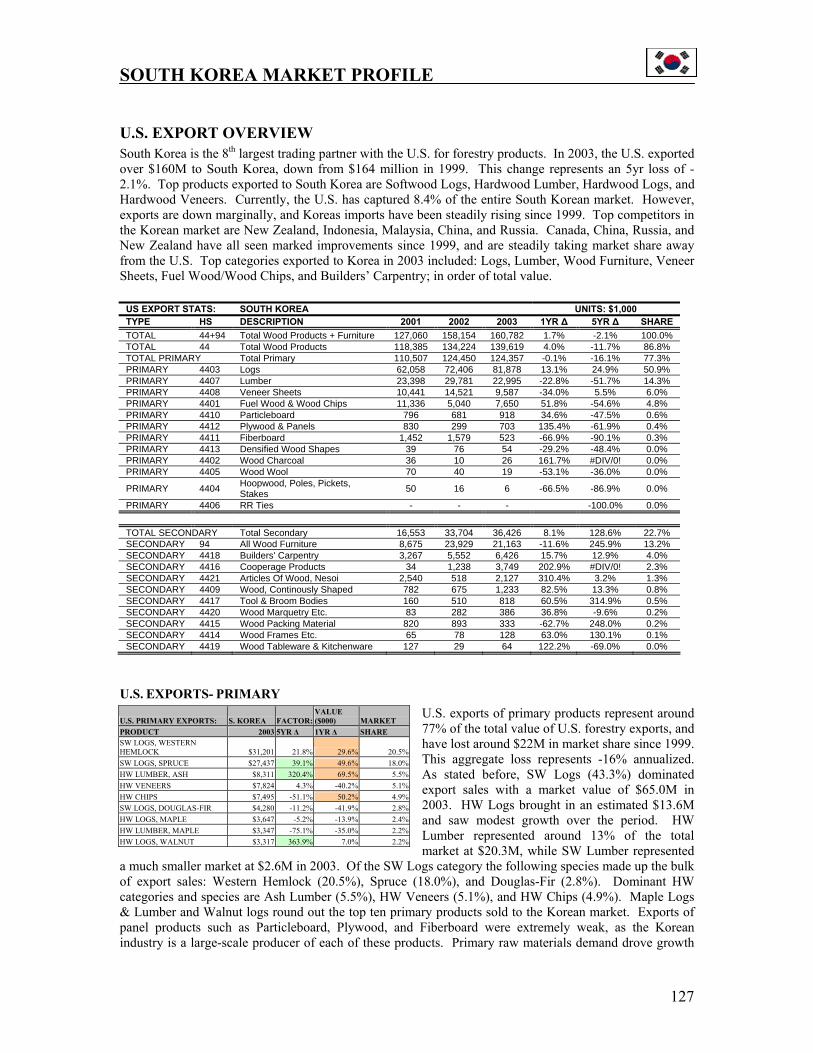
U.S. EXPORT OVERVIEW South Korea is the 8th largest trading partner with the U.S. for forestry products. In 2003, the U.S. exported over $160M to South Korea, down from $164 million in 1999. This change represents an 5yr loss of -2.1%. Top products exported to South Korea are Softwood Logs, Hardwood Lumber, Hardwood Logs, and Hardwood Veneers. Currently, the U.S. has captured 8.4% of the entire South Korean market. However, exports are down marginally, and Koreas imports have been steadily rising since 1999. Top competitors in the Korean market are New Zealand, Indonesia, Malaysia, China, and Russia. Canada, China, Russia, and New Zealand have all seen marked improvements since 1999, and are steadily taking market share away from the U.S. Top categories exported to Korea in 2003 included: Logs, Lumber, Wood Furniture, Veneer Sheets, Fuel Wood/Wood Chips, and Builders’ Carpentry; in order of total value.
US EXPORT STATS: SOUTH KOREA UNITS: $1,000 TYPE HS DESCRIPTION 2001 2002 2003 1YR ∆ 5YR ∆ SHARE TOTAL 44+94 Total Wood Products + Furniture 127,060 158,154 160,782 1.7% -2.1% 100.0% TOTAL 44 Total Wood Products 118,385 134,224 139,619 4.0% -11.7% 86.8% TOTAL PRIMARY Total Primary 110,507 124,450 124,357 -0.1% -16.1% 77.3% PRIMARY 4403 Logs 62,058 72,406 81,878 13.1% 24.9% 50.9% PRIMARY 4407 Lumber 23,398 29,781 22,995 -22.8% -51.7% 14.3% PRIMARY 4408 Veneer Sheets 10,441 14,521 9,587 -34.0% 5.5% 6.0% PRIMARY 4401 Fuel Wood & Wood Chips 11,336 5,040 7,650 51.8% -54.6% 4.8% PRIMARY 4410 Particleboard 796 681 918 34.6% -47.5% 0.6% PRIMARY 4412 Plywood & Panels 830 299 703 135.4% -61.9% 0.4% PRIMARY 4411 Fiberboard 1,452 1,579 523 -66.9% -90.1% 0.3% PRIMARY 4413 Densified Wood Shapes 39 76 54 -29.2% -48.4% 0.0% PRIMARY 4402 Wood Charcoal 36 10 26 161.7% #DIV/0! 0.0% PRIMARY 4405 Wood Wool 70 40 19 -53.1% -36.0% 0.0%
PRIMARY 4404 Hoopwood, Poles, Pickets, Stakes 50 16 6 -66.5% -86.9% 0.0%
PRIMARY 4406 RR Ties - - - -100.0% 0.0% TOTAL SECONDARY Total Secondary 16,553 33,704 36,426 8.1% 128.6% 22.7% SECONDARY 94 All Wood Furniture 8,675 23,929 21,163 -11.6% 245.9% 13.2% SECONDARY 4418 Builders' Carpentry 3,267 5,552 6,426 15.7% 12.9% 4.0% SECONDARY 4416 Cooperage Products 34 1,238 3,749 202.9% #DIV/0! 2.3% SECONDARY 4421 Articles Of Wood, Nesoi 2,540 518 2,127 310.4% 3.2% 1.3% SECONDARY 4409 Wood, Continously Shaped 782 675 1,233 82.5% 13.3% 0.8% SECONDARY 4417 Tool & Broom Bodies 160 510 818 60.5% 314.9% 0.5% SECONDARY 4420 Wood Marquetry Etc. 83 282 386 36.8% -9.6% 0.2% SECONDARY 4415 Wood Packing Material 820 893 333 -62.7% 248.0% 0.2% SECONDARY 4414 Wood Frames Etc. 65 78 128 63.0% 130.1% 0.1% SECONDARY 4419 Wood Tableware & Kitchenware 127 29 64 122.2% -69.0% 0.0%
U.S. EXPORTS- PRIMARY U.S. exports of primary products represent around 77% of the total value of U.S. forestry exports, and have lost around $22M in market share since 1999. This aggregate loss represents -16% annualized. As stated before, SW Logs (43.3%) dominated export sales with a market value of $65.0M in 2003. HW Logs brought in an estimated $13.6M and saw modest growth over the period. HW Lumber represented around 13% of the total market at $20.3M, while SW Lumber represented
a much smaller market at $2.6M in 2003. Of the SW Logs category the following species made up the bulk of export sales: Western Hemlock (20.5%), Spruce (18.0%), and Douglas-Fir (2.8%). Dominant HW categories and species are Ash Lumber (5.5%), HW Veneers (5.1%), and HW Chips (4.9%). Maple Logs & Lumber and Walnut logs round out the top ten primary products sold to the Korean market. Exports of panel products such as Particleboard, Plywood, and Fiberboard were extremely weak, as the Korean industry is a large-scale producer of each of these products. Primary raw materials demand drove growth
U.S. PRIMARY EXPORTS: S. KOREA FACTOR: VALUE ($000) MARKET
PRODUCT 2003 5YR ∆ 1YR ∆ SHARE SW LOGS, WESTERN HEMLOCK $31,201 21.8% 29.6% 20.5%SW LOGS, SPRUCE $27,437 39.1% 49.6% 18.0%HW LUMBER, ASH $8,311 320.4% 69.5% 5.5%HW VENEERS $7,824 4.3% -40.2% 5.1%HW CHIPS $7,495 -51.1% 50.2% 4.9%SW LOGS, DOUGLAS-FIR $4,280 -11.2% -41.9% 2.8%HW LOGS, MAPLE $3,647 -5.2% -13.9% 2.4%HW LUMBER, MAPLE $3,347 -75.1% -35.0% 2.2%HW LOGS, WALNUT $3,317 363.9% 7.0% 2.2%
127
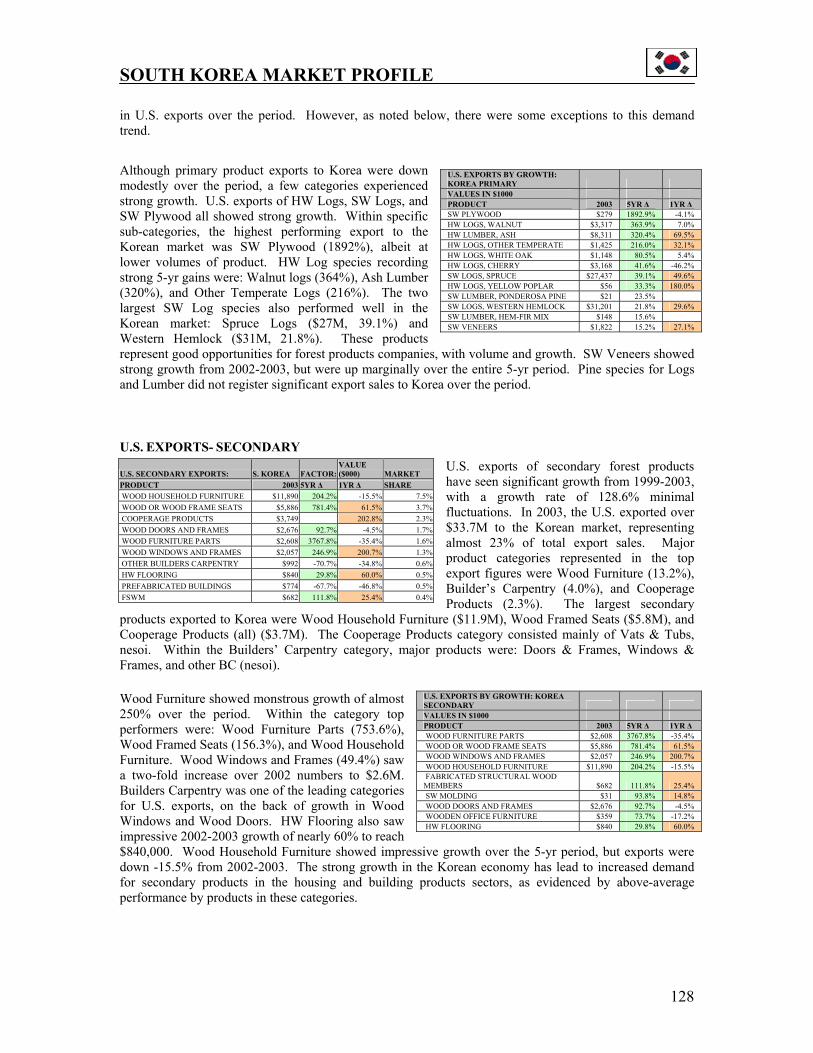
SOUTH KOREA MARKET PROFILE in U.S. exports over the period. However, as noted below, there were some exceptions to this demand trend.
Although primary product exports to Korea were down modestly over the period, a few categories experienced strong growth. U.S. exports of HW Logs, SW Logs, and SW Plywood all showed strong growth. Within specific sub-categories, the highest performing export to the Korean market was SW Plywood (1892%), albeit at lower volumes of product. HW Log species recording strong 5-yr gains were: Walnut logs (364%), Ash Lumber (320%), and Other Temperate Logs (216%). The two largest SW Log species also performed well in the Korean market: Spruce Logs ($27M, 39.1%) and Western Hemlock ($31M, 21.8%). These products represent good opportunities for forest products companies, with volume and growth. SW Veneers showed strong growth from 2002-2003, but were up marginally over the entire 5-yr period. Pine species for Logs and Lumber did not register significant export sales to Korea over the period.
U.S. EXPORTS- SECONDARY U.S. exports of secondary forest products have seen significant growth from 1999-2003, with a growth rate of 128.6% minimal fluctuations. In 2003, the U.S. exported over $33.7M to the Korean market, representing almost 23% of total export sales. Major product categories represented in the top export figures were Wood Furniture (13.2%), Builder’s Carpentry (4.0%), and Cooperage Products (2.3%). The largest secondary
products exported to Korea were Wood Household Furniture ($11.9M), Wood Framed Seats ($5.8M), and Cooperage Products (all) ($3.7M). The Cooperage Products category consisted mainly of Vats & Tubs, nesoi. Within the Builders’ Carpentry category, major products were: Doors & Frames, Windows & Frames, and other BC (nesoi).
Wood Furniture showed monstrous growth of almost 250% over the period. Within the category top performers were: Wood Furniture Parts (753.6%), Wood Framed Seats (156.3%), and Wood Household Furniture. Wood Windows and Frames (49.4%) saw a two-fold increase over 2002 numbers to $2.6M. Builders Carpentry was one of the leading categories for U.S. exports, on the back of growth in Wood Windows and Wood Doors. HW Flooring also saw impressive 2002-2003 growth of nearly 60% to reach $840,000. Wood Household Furniture showed impressive growth over the 5-yr period, but exports were down -15.5% from 2002-2003. The strong growth in the Korean economy has lead to increased demand for secondary products in the housing and building products sectors, as evidenced by above-average performance by products in these categories.
U.S. EXPORTS BY GROWTH: KOREA PRIMARY VALUES IN $1000 PRODUCT 2003 5YR ∆ 1YR ∆ SW PLYWOOD $279 1892.9% -4.1% HW LOGS, WALNUT $3,317 363.9% 7.0% HW LUMBER, ASH $8,311 320.4% 69.5% HW LOGS, OTHER TEMPERATE $1,425 216.0% 32.1% HW LOGS, WHITE OAK $1,148 80.5% 5.4% HW LOGS, CHERRY $3,168 41.6% -46.2% SW LOGS, SPRUCE $27,437 39.1% 49.6% HW LOGS, YELLOW POPLAR $56 33.3% 180.0% SW LUMBER, PONDEROSA PINE $21 23.5% SW LOGS, WESTERN HEMLOCK $31,201 21.8% 29.6% SW LUMBER, HEM-FIR MIX $148 15.6% SW VENEERS $1,822 15.2% 27.1%
U.S. SECONDARY EXPORTS: S. KOREA FACTOR:VALUE ($000) MARKET
PRODUCT 2003 5YR ∆ 1YR ∆ SHARE WOOD HOUSEHOLD FURNITURE $11,890 204.2% -15.5% 7.5% WOOD OR WOOD FRAME SEATS $5,886 781.4% 61.5% 3.7% COOPERAGE PRODUCTS $3,749 202.8% 2.3% WOOD DOORS AND FRAMES $2,676 92.7% -4.5% 1.7% WOOD FURNITURE PARTS $2,608 3767.8% -35.4% 1.6% WOOD WINDOWS AND FRAMES $2,057 246.9% 200.7% 1.3% OTHER BUILDERS CARPENTRY $992 -70.7% -34.8% 0.6% HW FLOORING $840 29.8% 60.0% 0.5% PREFABRICATED BUILDINGS $774 -67.7% -46.8% 0.5% FSWM $682 111.8% 25.4% 0.4%
U.S. EXPORTS BY GROWTH: KOREA SECONDARY VALUES IN $1000 PRODUCT 2003 5YR ∆ 1YR ∆ WOOD FURNITURE PARTS $2,608 3767.8% -35.4% WOOD OR WOOD FRAME SEATS $5,886 781.4% 61.5% WOOD WINDOWS AND FRAMES $2,057 246.9% 200.7% WOOD HOUSEHOLD FURNITURE $11,890 204.2% -15.5% FABRICATED STRUCTURAL WOOD MEMBERS $682 111.8% 25.4% SW MOLDING $31 93.8% 14.8% WOOD DOORS AND FRAMES $2,676 92.7% -4.5% WOODEN OFFICE FURNITURE $359 73.7% -17.2% HW FLOORING $840 29.8% 60.0%
128

SOUTH KOREA MARKET PROFILE SOUTH CAROLINA EXPORTS
SC EXPORTS TO KOREA TOTAL VALUE
HTS Description 2003 SC 1YR SC 5YR US 5YR % SHARE SC RANK % SC SHARE
44+94 Wood + Furniture 1,342,016 43.3% 33.0% -2.6% 100.0% 44 Wood 531,507 -18.5% -47.3% -11.7% 39.6% 25 0.38% All Wood Furniture 810,509 185.2% 290% 60.4% 4407 Lumber > 6Mm Thick 372,822 -31.2% -62.0% -51.7% 27.8% 16 1.62% 4417 Tool/Tl+Broom Body/Et 153,265 72.6% 314.9% 11.4% 2 18.74% 4403 Rough/Not Sapwood 5,420 -74.9% 24.9% 0.4% 29 0.01% 4408 Veneer Sheet 0 5.5% 0.0% 0.00% 4415 Pack/Etc;Pallet/Collr 0 248.0% 0.0% 0.00% 4411 Fibrbrd Of Wd/Ot Lign 0 -90.1% 0.0% 0.00% 4401 Fuel In Log;Chips/Etc 0 -54.6% 0.0% 0.00% 4404 Hoopwood;Pickets/Etc 0 -86.9% 0.0% 0.00%
South Korea is the one of the smaller markets for South Carolina exports in the top 15 countries. For non-furniture exports, Korea ranked 16th overall with $531,000 in 2003. Korea followed some notable countries that are not specifically included in this report: Taiwan, Portugal, Australia, Malaysia, Belgium, and Australia. For forest products, Korea owned less than 1.0% of the SC export market. However, when wood furniture is included in the analysis, Korea becomes the 13th largest export market for SC, with $1.3M in 2003. This aggregate number represents 2.1% of the total export market for SC. Also, the Korean market has seen moderate growth in demand for SC exports with a 33% increase in exports over the period analyzed. Gains from 2002-2003 reached a 43.4% increase, on strong gains from the furniture sector. As evidenced the U.S. export data, no SW timber products were export to South Korea over the period analyzed. HW Lumber exports, which dropped dramatically (-62%), accounted for 100% of Lumber exports to South Korea. Within this category, were Oak and Other HW exports. Oak exports lost almost 80% over the period, offsetting the strong gains made by other species of HW (177.2%). State level data does not allow for any further specification in the trade data analysis. Furniture exports represented 60.4% of the total export market to Korea at $810,000 in 2003. Lumber followed 2nd with 27.8% of the market at $372,000. Another notable category, which accounted for 11.4% of the Korean market, was Tools and Broom Handles. This category saw very strong growth in demand, increasing for $0 in 1999, to over $150,000 in 2003. SC growth in this category was inline with U.S. exports, which recorded 314.9% growth through the period. SC exports of Wood Furniture were dominated by Miscellaneous Wood Furniture in 2003 (89.4%). Various other furniture products have had success over the period, but with limited continued exports; Office and Bedroom furniture being the two largest categories.
BEST PROSPECTS BEST PROSPECTS- U.S. PRIMARY HW LOGS: WALNUT, CHERRY, WHITE OAK, OTHER TEMPERATE SW LOGS: WESTERN HEMLOCK, SPRUCE HW LUMBER: ASH VENEERS: HW (VOLUME), SW (GROWTH) BEST PROSPECTS- U.S. SECONDARY WOOD FURNITURE: HOUSEHOLD FURNITURE, WOOD FRAMED SEATS,
FURNITURE PARTS BUILDERS’ CARPENTRY: WOOD DOORS & FRAMES, WOOD WINDOWS & FRAMES WOOD, CONT. SHAPED: HW FLOORING BEST PROSPECTS- SOUTH CAROLINA LUMBER: OTHER HW WOOD FURNITURE: MISCELLANEOUS FURNITURE OTHER: TOOLS & BROOM BODIES
129

SOUTH KOREA MARKET PROFILE ECONOMIC FACTORS (GENERATING DEMAND) Despite near-term weakness of demand, over the next 3-5 years, the import volume of wood products is expected to increase in tandem with expectations that the Korean economy will continue to expand. One area expected to show particularly good growth is the repair and remodeling market for existing buildings. Regulations to curb the destruction of old apartment complexes will encourage repair and remodeling of old buildings instead of demolition and reconstruction. The Korea Remodeling Association projects the 2004 remodeling market at US$11.4 billion (equivalent to Korean Won 13.3 trillion), up 7 percent from last year. The repair and remodeling market is expected to continue to grow at roughly 6-8 percent annually through 2010.
GDP GROWTH
Boosted by strong growth in exports, and accommodative monetary and fiscal policies to lift domestic demand, economic growth in the Republic of Korea is expected to recover to 4.8% in 2004 and 5.2% in 2005, according to a major Asian Development Bank (ADB) report released in 2004.
KOREA: INDICATORS 2000 2001 2002 2003 GDP per head ($ at PPP) 15,194 15,941 17,006 17,580 GDP (% real change pa) 9.26 3.23 6.27 2.7 Government consumption (% of GDP) 10.03 10.33 10.56 10.9 Budget balance (% of GDP) 1.25 1.32 3.8 -0.4 Consumer prices (% change pa; av) 2.26 4.07 2.76 3.51 Public debt (% of GDP) 19.26 18.15 15.5 15.8 Labour costs per hour (USD)* 8.19 7.82 9.16 10.41 Recorded unemployment (%) 4.12 3.75 3.08 3.41 Current-account balance/GDP 2.65 1.93 1.28 2.4 Foreign-exchange reserves (mUS$) 96,130 102,753 121,345 155,281
The Asian Development Outlook 2004 (ADO), an annual ADB publication that forecasts economic trends in the region, says a recovery in the world economy will maintain growth in exports, which is likely to stimulate investment. After 7% growth in 2002, economic growth slowed to 3.1% in 2003, when domestic demand slumped due to a decline in private consumption as consumer credit dried up, and investment in machinery and equipment weakened. Growth in private consumption might resume only in the second half of 2004. The ADO warned that the household debt problem needs to be contained so that private consumption growth can resume. Investment is expected to recover in 2004, though the timing and magnitude may be subject to developments in the north of the Korean peninsula and the presidential impeachment. South Korea's gross domestic product (GDP) grew 5.5 per cent in the second quarter, compared with Singapore's 12.5 per cent and 12.1 per cent in Hong Kong, the Bank of Korea (BOK) said. Taiwan's GDP rose 7.7 per cent in the April-June period, while the potentially large economies of India and China gained 7.4 per cent and 9.6 per cent, respectively. Even Japan, which seems to be emerging from a decade of stagnation, grew 4.2 per cent. In the first quarter, South Korea's GDP grew 5.3 per cent while most other countries enjoyed higher growth rates ranging from 7.0 per cent to 9.8 per cent. Japan was also higher than South Korea with 5.9 per cent. Growth of the South Korean economy began to slow relative to rival Asian economies from the last quarter in 2003. "South Korea's GDP growth is likely to be lower than other Asian economies due to sagging consumption, weak construction activity and slowing exports," the BOK said.2
2 Source: Asian Development Bank. http://www.adb.org/Documents/News/2004/nr2004039.asp
130

SOUTH KOREA MARKET PROFILE
CONSTRUCTION MARKET South Korea continues to be a country in transition. The residential construction market in South Korea is large… in recent years over 500,000 units have been constructed annually – and the currently strong demand is expected to continue for a number of years. In the 1990s, most residential development in South Korea has consisted of reinforced concrete apartment structures. Very high land costs in urban areas (particularly in greater Seoul, which accommodates some 40 per cent of the South Korean population) have traditionally encouraged such development, with fewer than 10 per cent of recently constructed dwellings being of the single family-type.3
While Korean domestic construction is expected to increase by 10 per cent to $69.9 billion in 2004, it will be driven primarily by public sector initiatives relating to investments in South-North cooperation. Infrastructure investment and private sector construction is expected to decrease in 2004.
Though most single-family houses in South Korea are currently constructed of masonry or concrete, there has been a recent upsurge in North American-style single-family wood-frame construction in suburban areas. Moreover, given the size of the South Korean market, there is clear potential to expand the scope of residential construction to include wood-framed multi-unit residential buildings. Research suggests that there is both academic and small builder interest in such forms. On the other hand, the high quality of Korean concrete and masonry housing forms (low-, medium-, and high-rise alike) and the large size and competitiveness of the “designated” industrial conglomerates that deliver most housing in South Korea complicate market entry. Except where new technology and innovative design can improve productivity or performance, or where innovative design can reduce cost or capture market appeal, foreign businesses operate at a real disadvantage. 4
HOUSING STARTS Interest in wood-frame housing construction is on the rise. Single-family homes are of particular interest and residential developments are beginning to pop up near major metropolitan areas. At this time, housing starts are in the range of 350-400,000 annually. While Korea has experienced an economic downturn in recent years, it is expected that this situation will change over the next few years. A total of 404,715 residential housing units were constructed in 1999, an increase of 32 per cent over 1998. The public sector accounted for 151,000 of these units. Korea’s market for prefabricated homes and building products was $560 million in 1999. The total value of imports of prefabricated homes during this period was $5.1 million. In the first 6 months of 2004, Korea imported $3.2 million in imported homes.5 Strong government intervention to curb the speculative housing market further discourages Korean
3Source: FAS Korea- Solid Wood Products Annual, 2004. http://www.fas.usda.gov/ffpd/attache-reports.htm 4 Source: http://www.davislangdon.com.au/Publications/Documents/wcro03-04.pdf5 Source: Canadian Mortgage & Housing Corporation. http://www.cmhc-schl.gc.ca/
131
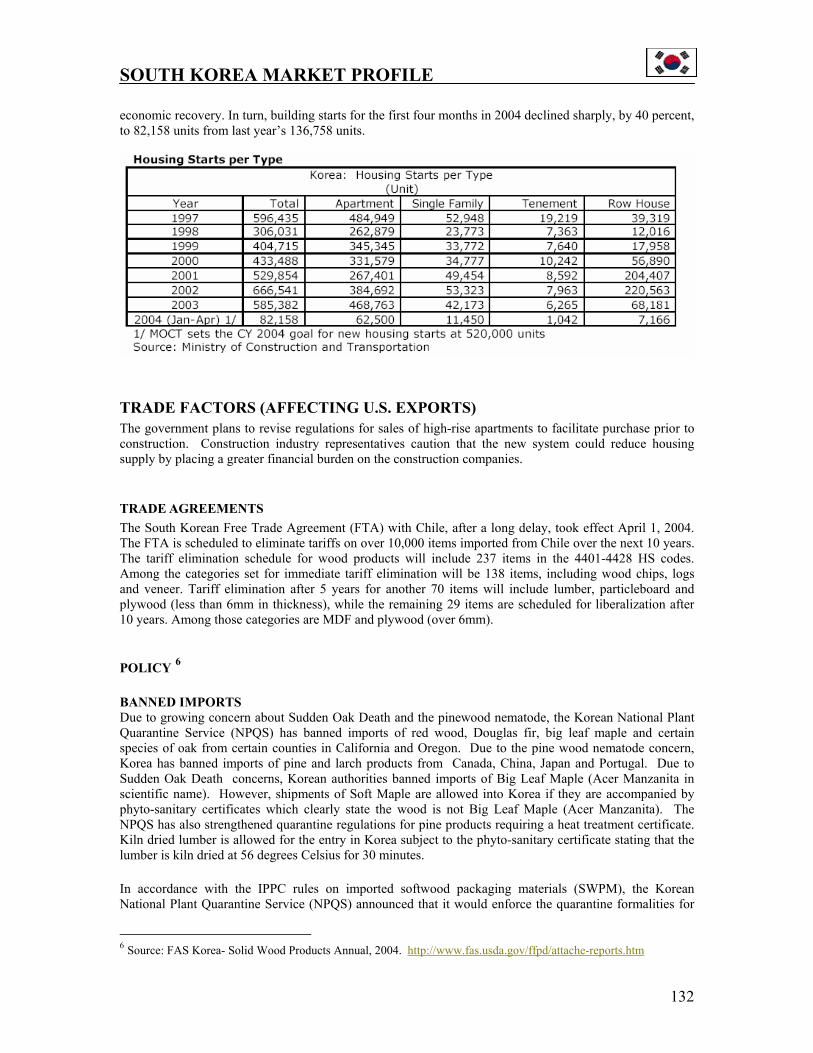
SOUTH KOREA MARKET PROFILE economic recovery. In turn, building starts for the first four months in 2004 declined sharply, by 40 percent, to 82,158 units from last year’s 136,758 units.
TRADE FACTORS (AFFECTING U.S. EXPORTS) The government plans to revise regulations for sales of high-rise apartments to facilitate purchase prior to construction. Construction industry representatives caution that the new system could reduce housing supply by placing a greater financial burden on the construction companies.
TRADE AGREEMENTS The South Korean Free Trade Agreement (FTA) with Chile, after a long delay, took effect April 1, 2004. The FTA is scheduled to eliminate tariffs on over 10,000 items imported from Chile over the next 10 years. The tariff elimination schedule for wood products will include 237 items in the 4401-4428 HS codes. Among the categories set for immediate tariff elimination will be 138 items, including wood chips, logs and veneer. Tariff elimination after 5 years for another 70 items will include lumber, particleboard and plywood (less than 6mm in thickness), while the remaining 29 items are scheduled for liberalization after 10 years. Among those categories are MDF and plywood (over 6mm). POLICY 6 BANNED IMPORTS Due to growing concern about Sudden Oak Death and the pinewood nematode, the Korean National Plant Quarantine Service (NPQS) has banned imports of red wood, Douglas fir, big leaf maple and certain species of oak from certain counties in California and Oregon. Due to the pine wood nematode concern, Korea has banned imports of pine and larch products from Canada, China, Japan and Portugal. Due to Sudden Oak Death concerns, Korean authorities banned imports of Big Leaf Maple (Acer Manzanita in scientific name). However, shipments of Soft Maple are allowed into Korea if they are accompanied by phyto-sanitary certificates which clearly state the wood is not Big Leaf Maple (Acer Manzanita). The NPQS has also strengthened quarantine regulations for pine products requiring a heat treatment certificate. Kiln dried lumber is allowed for the entry in Korea subject to the phyto-sanitary certificate stating that the lumber is kiln dried at 56 degrees Celsius for 30 minutes. In accordance with the IPPC rules on imported softwood packaging materials (SWPM), the Korean National Plant Quarantine Service (NPQS) announced that it would enforce the quarantine formalities for
6 Source: FAS Korea- Solid Wood Products Annual, 2004. http://www.fas.usda.gov/ffpd/attache-reports.htm
132

SOUTH KOREA MARKET PROFILE solid wood packaging materials (SWPM) imported after June 1, 2004, but decided to delay the effective date to June 2005 at the request of the Korean industries. The products subject to the quarantine include pallets, crates, wooden boxes, etc., which are used for export packaging. After June 1, 2005, the SWPM should be accompanied by a certificate showing heat treatment for more than 30 minutes at 56 Celsius. For more information on the requirements, refer to the American Lumber Standard Committee website at www.alsc.org/WPM_summary_mod.htm and the National Hardwood Lumber Association website at http://www.natlhardwood.org. Click on “Heat Treatment” WOOD-FRAME BUILDING STANDARDS On August 3, 2004, the Ministry of Construction and Transportation (MOCT) revised the building codes to allow for wood-frame construction up to five stories, an increase from the current three stories. According to MOCT officials, the decision was made due to improvements in the technology of wood-frame construction in Korea and the production of wood construction materials. BUILDING CODES After an extended joint effort by the American Forest & Paper Association (AF&PA)/Seoul, FAS/Seoul, the Korean Wood Construction Association (KWCA), the Korea Forest Service (KFS) and the Korea Forest Research Institute (KFRI) to revise the Korean standard for the assemblies of wood frame structures (KSF1611) since 1991, on May 28, 2004 the Ministry of Construction and Transportation (MOCT) announced its "proposal (draft)" to recognize wood assemblies as fire resistant and incorporate that determination into the National Building Code. The comment gathering process for this proposal ended June 17, 2004. After reviewing the comments and undergoing review by other relevant government agencies, the MOCT is expected to publish the final rules in October 2004. The proposed revision to the standard allows wood frame construction in multi-family structure of up to three stories.
133

SOUTH KOREA MARKET PROFILE
COUNTRY INFORMATION SOURCES GOVERNMENT Korea Trade- Investment Promotion Agency 300-9, Yomgok-dong, Seocho-gu, Seoul, Korea Profile: Promoting international commerce and
investment between Korea and it major trading partners
Phone: (82-2) 3460-7114 Fax: (82-2) 3460-7777 Website: http://www.kotra.or.kr/eng/file/sub7.jsp TRADE ASSOCIATIONS American Forest & Paper Association (shared) AF&PA - Korea U.S. Agricultural Trade Office Room #303, Leema Building 146-1, Susong-dong, Chongro-ku Seoul 110-140, Korea Phone: 011-82-2-722-3685/6 Fax: 011-82-2-720-1898 E-mail: [email protected] AHEC – Korea (shared) c/o American Forest & Paper Association Room #303, Leema Building 146-1, Susong-dong Chongro-ku Seoul (110-140), Korea Director: Kyoung-ho Ahn Phone: (82) 2-722-3685/6 Fax: (82) 2-720-1898 Website: http://www.afpa-korea.org Association of Foreign Trading Agents of Korea Koima Bldg, Hankangro 2-Ka, Yongsan-Ku, Seoul 140-875, Korea Phone: 82-2-792-1581/4 Fax: 82-2-785-4373 Email: [email protected] Website: http://www.aftak.or.kr Korea Federation of Furniture Industry Cooperatives #374-2, Changan-dong, Dontdaemun-gu, Seoul, Korea Profile: Korean style antique fumiture, Teaching implements knockdown-furniture, General furniture
Phone: 215-8838/9 Fax: 215-9729 Korea Shipbuilding Industry Cooperatives #915-14, Bangbae-dong, Seocho-gu, Seoul, Phone: 587-3121/3 Fax: 583-2922 Korea Plywood Industries Association Rm. 606, KFSB Bldg., 16-2, Yoido-dong, Yeoungdungpo-ku, Seoul 150-010 Phone: 780-3631~2 Fax: 780-3634 Email: [email protected] Korea Housing Builders Association Profile: Promoting building and construction markets in Korea Korea Housing Center 15-23 Youido-dong,Youngdeungpo-ku, Seoul,Korea Phone: (82)-(2) 785-0911 Fax: (82)-(2) 785-3915 Email: [email protected]: http://www.khba.or.kr/english/welcome.html# Korean International Trade Association Profile: Korea’s # 1 Business Directory Website: www.kita.org RESEARCH/EDUCATION None Listed INDUSTRY The Federation of Korea Industrial Profile: Industrial Competitiveness, Growth, and Development Phone: 82-2-3771-0114 Fax: 82-2-3771-0110 Email: [email protected] Website: http://www.fki.or.kr/en/about/chron.asp
134