Koolyanobbing Range C In-Pit Tailings Storage Facility...Report Reference: ENV -TS-RP-0178...
237
Report Reference: ENV-TS-RP-0178 Koolyanobbing Range C In-Pit Tailings Storage Facility AMENDMENT TO LICENCE L5850/1993/11 SUPPORTING DOCUMENT – REVISION 1 Proponent: Yilgarn Iron Pty Ltd Address: 1 Sleat Road, Applecross, WA 6153 Postal Address: Locked Bag 3, Canning Bridge LPO, Applecross, WA 6153 Corporate contact: Les Purves Phone: +61 8 9329 3407 Email: [email protected] 31 March 2020
Transcript of Koolyanobbing Range C In-Pit Tailings Storage Facility...Report Reference: ENV -TS-RP-0178...

Report Reference: ENV-TS-RP-0178
Koolyanobbing Range C In-Pit Tailings Storage Facility
AMENDMENT TO LICENCE L5850/1993/11
SUPPORTING DOCUMENT – REVISION 1 Proponent: Yilgarn Iron Pty Ltd
Address: 1 Sleat Road, Applecross, WA 6153
Postal Address: Locked Bag 3, Canning Bridge LPO, Applecross, WA 6153
Corporate contact: Les Purves Phone: +61 8 9329 3407 Email: [email protected]
31 March 2020

Koolyanobbing Range C In-pit TSF Licence Amendment
ENV–TS–RP–0178_Rev 1 ii
Koolyanobbing Range C In-pit TSF Licence Amendment
Issue Date: 31/03/2020 ENV-TS-RP-0178 Page | iii
Revision History
Revision Number
Issue Date Prepared By Reviewed By Approved By Purpose
0 03/12/19 C Thomson & E Chedid
A Parker T Berryman Supporting Document for LAA submission
1 31/03/2020 K Bagnall A Parker T Berryman Revision to address RFI and comments from DMIRS & DWER on supporting documentation
Koolyanobbing Range C In-pit TSF Licence Amendment
Issue Date: 31/03/2020 ENV-TS-RP-0178 Page | iv
TABLE OF CONTENTS
1. INTRODUCTION .......................................................................................................................................... 7
1.1 Background ...................................................................................................................................... 7
1.2 Purpose and Scope .......................................................................................................................... 7
1.3 Prescribed Premise Categories ........................................................................................................ 9
2. PREMISES MAPS (ATTACHMENT 2) ......................................................................................................... 10
3. EXISTING ENVIRONMENT ........................................................................................................................ 12
3.1 Climate ........................................................................................................................................... 12
3.2 Geology, Landform and Soils ......................................................................................................... 13
3.2.1 Regional Setting ................................................................................................................ 13
3.2.2 Local Conditions ................................................................................................................ 13
3.2.3 C-Pit................................................................................................................................... 13
3.3 Waste Rock Characterisation ........................................................................................................ 14
3.3.1 C Pit Mining ....................................................................................................................... 14
3.3.2 C Pit Backfilling.................................................................................................................. 16
3.4 Surface Hydrology ......................................................................................................................... 16
3.5 Hydrogeology ................................................................................................................................ 16
3.5.1 Groundwater Flow ............................................................................................................ 16
3.5.2 Groundwater Quality ........................................................................................................ 17
3.6 Flora and Fauna ............................................................................................................................. 19
3.6.1 Flora .................................................................................................................................. 19
3.6.2 Fauna ................................................................................................................................ 20
3.7 Heritage ......................................................................................................................................... 20
3.8 Land use and Community .............................................................................................................. 20
4. PROPOSED ACTIVITIES (ATTACHMENT 3A) .............................................................................................. 21
4.1 In-Pit Tailings Storage Facility ........................................................................................................ 21
4.1.1 Tailings Back-Fill Design Detail .......................................................................................... 21
4.1.2 Tailings Properties ............................................................................................................ 22
5. LOCATION AND RECEPTORS .................................................................................................................... 26
6. EMISSIONS AND DISCHARGES (ATTACHMENT 6A) .................................................................................. 27
6.1 OVERVIEW ........................................................................................................................................ 27
6.2 LAND CLEARING AND TOPSOIL ............................................................................................................. 27
6.3 SURFACE WATER ............................................................................................................................... 27
6.4 GROUNDWATER ................................................................................................................................ 27
6.5 FLORA AND FAUNA ............................................................................................................................ 28

Koolyanobbing Range C In-pit TSF Licence Amendment
Issue Date: 31/03/2020 ENV-TS-RP-0178 Page | v
6.6 Heritage ......................................................................................................................................... 28
6.7 WASTE PRODUCTS ............................................................................................................................. 28
6.8 DANGEROUS GOODS, HYDROCARBONS AND HAZARDOUS SUBSTANCES ..................................................... 28
6.9 ATMOSPHERIC POLLUTION AND NOISE ................................................................................................. 28
6.9.1 Dust ................................................................................................................................... 28
6.9.2 Air emissions ..................................................................................................................... 29
6.9.3 Noise emissions ................................................................................................................ 29
6.9.4 Light emissions.................................................................................................................. 30
6.10 Waste Products ............................................................................................................................. 30
6.11 Dangerous Goods, Hydrocarbons and Hazardous Substances ...................................................... 30
7. APPLICATION FEE (ATTACHMENT 9) ........................................................................................................ 31
8. REFERENCES ............................................................................................................................................. 32

Koolyanobbing Range C In-pit TSF Licence Amendment
Issue Date: 31/03/2020 ENV-TS-RP-0178 Page | vi
FIGURES
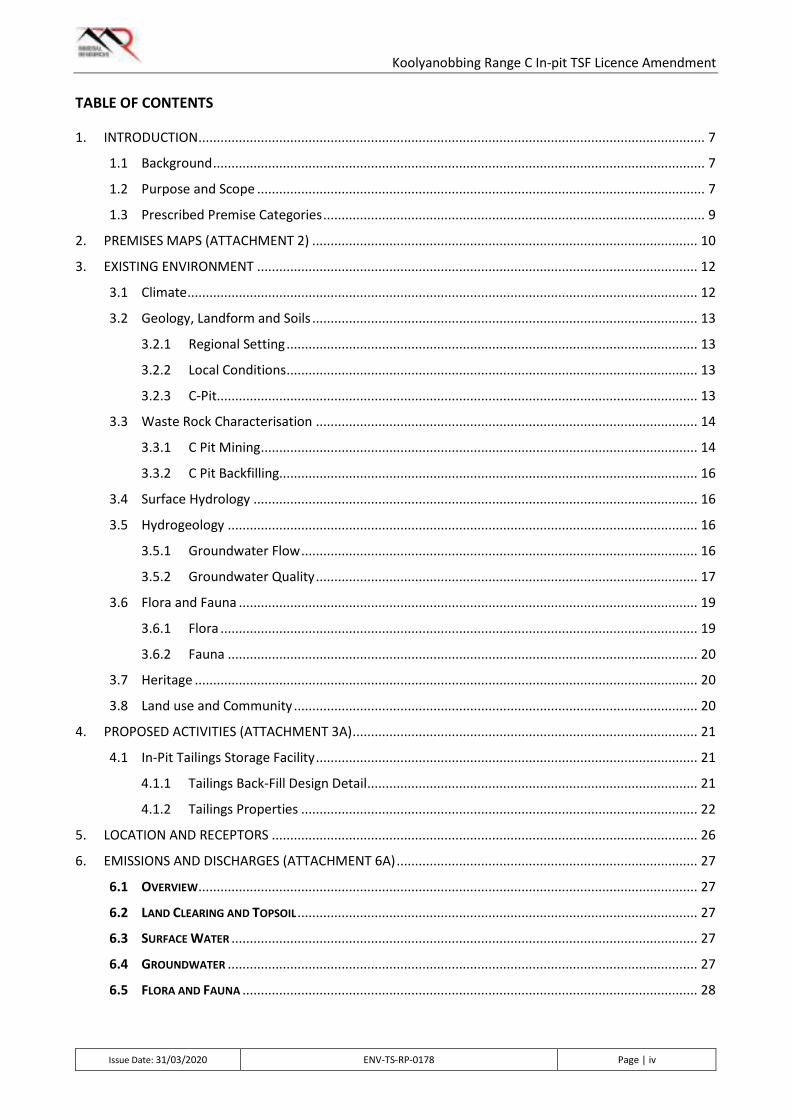
FIGURE 1: PROJECT LOCATION MAP ............................................................................................................... 10
FIGURE 2: SITE LAYOUT MAP ........................................................................................................................... 11
FIGURE 3: LONG TERM MONTHLY MEAN RAINFALL & EVAPORATION ........................................................... 12
FIGURE 4: PLAN VIEW AND PROFILE OF C PIT BEFORE PROPOSED TAILINGS DEPOSITION ............................ 14
FIGURE 5: KOOLYANOBBING C PIT BORE LOG (CPWB1) ................................................................................. 15
FIGURE 6: LOCATION OF ROCKWATER MODEL BOUNDARY IN RELATION TO PITS AND KEY GEOGRAPHICAL FEATURES ........................................................................................................................................................ 17
FIGURE 7: KOOLYANOBBING A, B & C PIT BORE LOCATIONS .......................................................................... 19
FIGURE 8: COMPLETED TAILINGS DEPOSITION IN C PIT WITH SURFACE CONTOURS ..................................... 22
FIGURE 9: CROSS SECTION OF C PIT SHOWING DESIGN AND COMPLETED TAILINGS DEPOSITION ............... 22
FIGURE 10: PHOTO OF TAILINGS FROM XINYU PLANT IN GURON, CHINA ...................................................... 23
FIGURE 11: LITHIUM HYDROXIDE TAILINGS DRYING RATE ............................................................................. 29
TABLES
TABLE 1: LOCATION OF INFORMATION RELEVANT TO THE APPLICATION ........................................................ 8
TABLE 2: PRESCRIBED PREMISE CATEGORY DESCRIPTION ................................................................................ 9
TABLE 3: LONG TERM CLIMATE DATA ............................................................................................................. 13
TABLE 4: MEASURED TOTAL DISSOLVED SOLIDS PRODUCTION BORE GROUNDWATER ................................ 18
TABLE 5: EXPECTED PRODUCTION SCHEDULE FOR TAILINGS DEPOSITION .................................................... 21
TABLE 6: TAILINGS PHYSICAL PROPERTIES ...................................................................................................... 23
TABLE 7: CONCENTRATION OF ELEMENTS IN TAILINGS SOLIDS AND LIQUORS .............................................. 24
TABLE 8: RESIDENTIAL AND SENSITIVE PREMISES ........................................................................................... 26
TABLE 9: LICENCE AMENDMENT FEE ............................................................................................................... 31
APPENDICES
APPENDIX 1: TAILINGS DESIGN REPORT
APPENDIX 2: IN-PIT TSF RISK ASSESSMENT

Koolyanobbing Range C In-Pit TSF Licence Amendment
Issue Date: 31/03/2020 ENV-TS-RP-0178 Page 7 of 34
1. INTRODUCTION
1.1 BACKGROUND
Yilgarn Iron Pty Ltd (YIPL), a wholly owned subsidiary of Mineral Resources Limited (MRL), operates the Yilgarn Operations, which includes the mining of iron ore deposits at Deception, the Windarling Range, the Mt Jackson Range and the Koolyanobbing Range, processing of ore at Koolyanobbing, and road and rail transport between these operations and the Esperance Port where the processed ore is exported to international customers.
The Koolyanobbing Range C deposit is situated on M77/607-I and is about 50 kilometres north of Southern Cross in the Yilgarn area (see Figure 1 and Figure 2). Mining of the Koolyanobbing Range C deposit via the C Pit was completed in 2017, and then the pit was partially backfilled with waste rock under Mine Plan MP 56363, after Sterilisation Drilling had confirmed exhaustion of the mineral deposit.
In October 2019 Department of Water and Environmental Regulation (DWER) granted YIPL an amendment to Licence L5850/1993/11 to include C Pit as a Category 64 landfill site for disposal of putrescible waste and mine vehicle tyres, however, no putrescible waste or mine vehicle tyres have ever been placed or disposed of in the pit.
The C Pit has current capacity of 4.3 million cubic metres to 5 metres below the pit crest. YIPL intends to utilise the C Pit for dry stacking of tailings from Albemarle Corporation’s Lithium Hydroxide facility which is currently under construction in Kemerton, Western Australia (the “Kemerton facility” or the “Plant”).
The Kemerton facility is expected to start producing Lithium Hydroxide tailings in first quarter of 2021. The Plant will process spodumene ore transported from the Talison Lithium Pty Ltd Greenbushes Mine, to produce Lithium Hydroxide product and a sodium sulfate by-product.
Lithium tailings are the residue produced from secondary processing of spodumene concentrate (approximately 6% Li2O), through pyrometallurgical and hydrometallurgical processes, to produce Lithium Hydroxide monohydrate. Lithium Hydroxide monohydrate is used in the manufacture of rechargeable lithium ion batteries, industrial lubricants and dyes. Lithium processing tailings are an inert, non-toxic material comprised of alumina-silicates, approximately 15% gypsum, residual salts, trace elements and oxides from spodumene ore, and approximately 24% water.
Albemarle received approval for the Kemerton facility on 26 October 2018 with conditions stipulated in Ministerial Statement (MS) 1085. Construction of the Plant commenced in late 2018 with commissioning due in 2021 and first production of 150,000 tonnes per annum (tpa) of Lithium Hydroxide planned in 2021 ramping up to 560,000 tpa in 2024, with a further 25 years project life at full production. To support the start-up of the Plant’s operations, an interim solution is required for tailings management and storage. This will allow the operator of the Plant to explore all reasonable and practicable measures to minimise the generation of waste and provide an alternative solution within three years, as outlined in MS 1085.
The project location and regional setting are shown in Figure 1.
1.2 PURPOSE AND SCOPE
This document supports an application for an amendment to the Licence L5850/1993/11, pursuant to Part V of the Environmental Protection Act 1986 (EP Act), for licensing an In-Pit Tailings Storage Facility (In Pit TSF) for the short term storage of tailings from the Kemerton facility currently under construction.
This document is structured in alignment with the DWER Application Form: Works Approval / Licence / Renewal / Amendment / Registration (February 2020, v 12) (Application Form).
This supporting document together with the completed Application Form constitutes the Licence Amendment Application (LAA) for the In-Pit TSF.

Koolyanobbing Range C In-Pit TSF Licence Amendment
Issue Date: 31/03/2020 ENV-TS-RP-0178 Page 8 of 34
Table 1 provides an overview of the Application Form sections and the relevant parts of this supporting document that addresses the information required.
TABLE 1: LOCATION OF INFORMATION RELEVANT TO THE APPLICATION
Section in Application Form Section in this document
Part 1. Application type Refer to Application Form
Part 2. Applicant details Refer to Application Form
Part 3. Premises details Section 2
Part 4. Proposed activities Section 3
Part 5. Index of Biodiversity Surveys for Assessments (IBSA) Refer to Application Form
Part 6. Other DWER approvals Refer to Application Form
Part 7. Other approvals and consultation Refer to Application Form
Part 8. Applicant history Refer to Application Form
Part 9. Emissions, discharges, and waste Section 5
Part 10. Siting and location Refer to Application Form
Part 11. Submission of any other relevant information Refer to Application Form
Part 12. Proposed fee calculation Section 7
Part 13. Commercially sensitive or confidential information Refer to Application Form
Part 14. Submission of application Refer to Application Form
Part 15. Declaration and signature Refer to Application Form
Attachment 1A: Proof of Occupier Status Not required
Attachment 1B: ASIC company extract Not required
Attachment 1C: Authorisation to act as representative Not required
Attachment 2: Premises maps Section 2
Attachment 3A: Environmental commissioning plan Not required
Attachment 3B: Proposed activities Section 3
Attachment 3C: Map of area proposed to be cleared Not required
Attachment 3D: Additional information for clearing assessment Not required
Attachment 4: Biodiversity surveys Not required
Attachment 5: Other approvals and consultation documentation Not required
Attachment 6A: Emissions and discharges Section 5
Attachment 6B: Waste acceptance Not required
Attachment 7: Siting and location Not required
Attachment 8: Additional information submitted Not required
Attachment 9: Proposed fee calculation Section7
Attachment 10: Request for exemption from publication Not required

Koolyanobbing Range C In-Pit TSF Licence Amendment
Issue Date: 31/03/2020 ENV-TS-RP-0178 Page 9 of 34
1.3 PRESCRIBED PREMISE CATEGORIES
The proposed activity will trigger Prescribed Premise Category 5C under Schedule 1 of the Environmental Protection Regulations 1987 as detailed in Table 2 below. The activity will take place in M77/607-I, which is within the Licence prescribed premise boundary (see Figure 2).
TABLE 2: PRESCRIBED PREMISE CATEGORY DESCRIPTION
Category Number
Activity/Category Production or Design Capacity
Actual Production/Storage
5 Processing or beneficiation of metallic or non-metallic ore: premises on which – (c) tailings or residue from metallic or non-metallic ore are discharged into a containment cell or dam
50,000 tonnes or more per year
Up to 600,000 tonnes per year
Koolyanobbing Range C In-Pit TSF Licence Amendment
Issue Date: 31/03/2020 ENV-TS-RP-0178 Page 10 of 34
2. PREMISES MAPS (ATTACHMENT 2)
FIGURE 1: PROJECT LOCATION MAP

Koolyanobbing Range C In-Pit TSF Licence Amendment
Issue Date: 31/03/2020 ENV-TS-RP-0178 Page 11 of 34
FIGURE 2: SITE LAYOUT MAP
Koolyanobbing Range C In-Pit TSF Licence Amendment
Issue Date: 31/03/2020 ENV-TS-RP-0178 Page 12 of 34
3. EXISTING ENVIRONMENT
The following information is drawn from the Koolyanobbing C Pit Expansion Project Mining Proposal (REG ID 21823) (Cliffs 2009) unless otherwise noted.
3.1 CLIMATE
The closest long term climate records to Koolyanobbing are from the Bureau of Meteorology (BoM) Southern Cross Station (Station Number 012074) and Turkeys Nest North (Station Number 012079). Selected statistics are summarised in Table 3.
The region has an arid to semi-arid climate with four distinct seasons: a hot summer from December to February, a mild autumn from March to May followed by a cool winter from June to August and a mild spring from September to November. January is the hottest month and July is the coldest.
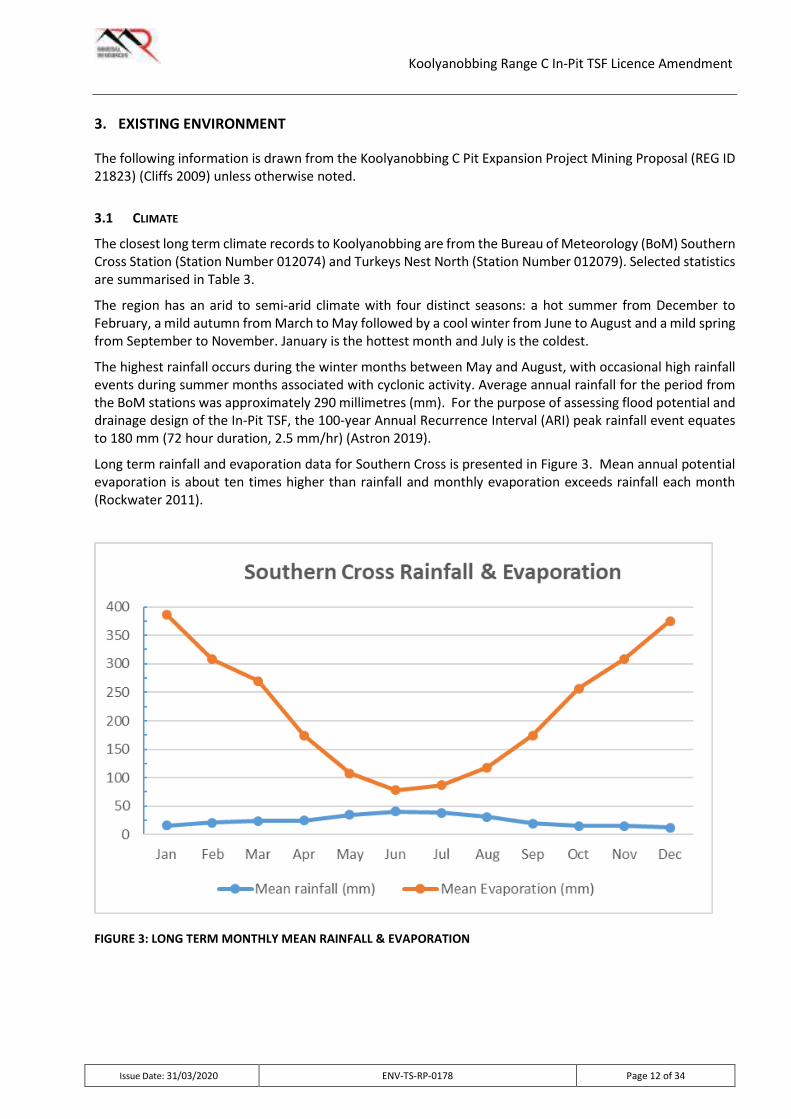
The highest rainfall occurs during the winter months between May and August, with occasional high rainfall events during summer months associated with cyclonic activity. Average annual rainfall for the period from the BoM stations was approximately 290 millimetres (mm). For the purpose of assessing flood potential and drainage design of the In-Pit TSF, the 100-year Annual Recurrence Interval (ARI) peak rainfall event equates to 180 mm (72 hour duration, 2.5 mm/hr) (Astron 2019).
Long term rainfall and evaporation data for Southern Cross is presented in Figure 3. Mean annual potential evaporation is about ten times higher than rainfall and monthly evaporation exceeds rainfall each month (Rockwater 2011).
FIGURE 3: LONG TERM MONTHLY MEAN RAINFALL & EVAPORATION

Koolyanobbing Range C In-Pit TSF Licence Amendment
Issue Date: 31/03/2020 ENV-TS-RP-0178 Page 13 of 34
TABLE 3: LONG TERM CLIMATE DATA
Statistic Jan Feb Mar Apr May Jun Jul Aug Sep Oct Nov Dec Annual
Turkeys Nest North BoM Rain Station 012079, elevation 380 m (1929-2020)
Mean rainfall (mm)
17.2 20.8 23.8 25.7 30.5 42.1 39.1 32.2 18.3 15.3 17.5 14.1 289.2
Median rainfall (mm) 7.2 8.8 8.6 15.3 25.2 39.0 36.2 29.0 13.7 9.1 11.0 7.5 281.2
Southern Cross BoM Station 012074, elevation 355 m (1889-2007)
Mean rainfall (mm) 16.3 20.9 24.2 24.5 34.9 40.7 38.6 31.2 19.4 15.6 15.5 12.6 294.5
Mean Evaporation (mm) 387 308 270 174 108 78 87 118 174 257 309 375 2,645
Max Max Temp (°C) 34.5 33.6 30.6 25.7 20.6 17.1 16.3 18.0 21.8 25.5 29.7 33.0 25.5
Mean Min Temp (°C) 17.2 17.2 15.2 11.6 7.7 5.7 4.4 4.8 6.5 9.3 12.9 15.5 10.7
3.2 GEOLOGY, LANDFORM AND SOILS
3.2.1 Regional Setting
The Koolyanobbing Range is the major landform of the area. It extends northwest-southeast for about 30 km at elevations of between approximately 440m AHD to 510m AHD. Surrounding the Koolyanobbing Range are extensive plains varying in elevation between approximately 340 and 400 m AHD, with the salt lakes Lake Deborah and Lake Seabrook occurring at the lowest points.
The Koolyanobbing Range is situated in a typical “greenstone” belt of Archaean age. The greenstone consists of volcanic material with banded ironstone formation (BIF) being precipitated in adjacent shallow basins. The BIFs host iron ore deposits that are typically haematite and goethite and are very resistant to erosion. Away from the Koolyanobbing Mine site, complex bodies of banded gneiss and intrusive granitoids are found between the greenstone belts.
3.2.2 Local Conditions
The Koolyanobbing Project area occurs within three landform and soil types, with elevations between approximately 370 and 510 m AHD comprising elevated ridges, slopes and undulating plains. The Project area geology comprises detrital iron overlying hematite-goethite and goethite mineralisation, surrounded by unmineralised iron formation.
The Koolyanobbing Mine site is located on areas classified as the Boorabbin Plateau and Bungalbin Ridges (Beard 1981, cited in Cliffs 2009). The Boorabbin Plateau is gently undulating with a repetitive succession of salt flats, broad valleys and broad interfluves. Soils are red/brown, silty clay loams and sandy clay loams.
3.2.3 C-Pit
Mining of the Koolyanobbing Range C deposit via the C Pit was completed in 2017. The C Pit walls are banded ironstone which have not shown signs of deterioration or slumping since completion of mining in 2017.
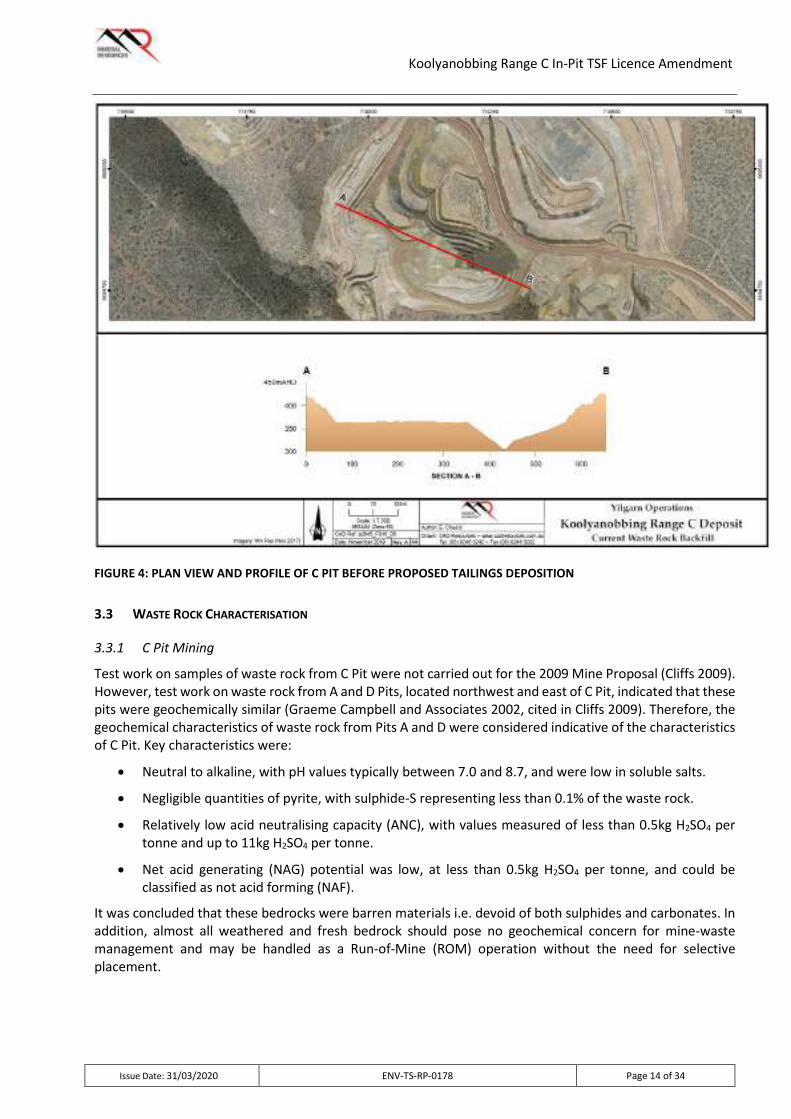
The pit was mined to 305 m AHD (see Figure 4) and has a capacity of approximately 4.3 million cubic metres to 5 metres below surface. The pit has been partially backfilled with waste rock and the base will be raised to 338 m AHD and track rolled to create a stable platform prior to tailings deposition.
A dewatering bore (CPWB1) was constructed in C Pit in 2014 and the bore log is included as Figure 5. Drilling commenced at 371 m AHD and stopped at 91.5 m (i.e. depth from surface).
Koolyanobbing Range C In-Pit TSF Licence Amendment
Issue Date: 31/03/2020 ENV-TS-RP-0178 Page 14 of 34
FIGURE 4: PLAN VIEW AND PROFILE OF C PIT BEFORE PROPOSED TAILINGS DEPOSITION
3.3 WASTE ROCK CHARACTERISATION
3.3.1 C Pit Mining
Test work on samples of waste rock from C Pit were not carried out for the 2009 Mine Proposal (Cliffs 2009). However, test work on waste rock from A and D Pits, located northwest and east of C Pit, indicated that these pits were geochemically similar (Graeme Campbell and Associates 2002, cited in Cliffs 2009). Therefore, the geochemical characteristics of waste rock from Pits A and D were considered indicative of the characteristics of C Pit. Key characteristics were:
• Neutral to alkaline, with pH values typically between 7.0 and 8.7, and were low in soluble salts.
• Negligible quantities of pyrite, with sulphide-S representing less than 0.1% of the waste rock.
• Relatively low acid neutralising capacity (ANC), with values measured of less than 0.5kg H2SO4 per tonne and up to 11kg H2SO4 per tonne.
• Net acid generating (NAG) potential was low, at less than 0.5kg H2SO4 per tonne, and could be classified as not acid forming (NAF).
It was concluded that these bedrocks were barren materials i.e. devoid of both sulphides and carbonates. In addition, almost all weathered and fresh bedrock should pose no geochemical concern for mine-waste management and may be handled as a Run-of-Mine (ROM) operation without the need for selective placement.

Koolyanobbing Range C In-Pit TSF Licence Amendment
Issue Date: 31/03/2020 ENV-TS-RP-0178 Page 15 of 34
FIGURE 5: KOOLYANOBBING C PIT BORE LOG (CPWB1)

Koolyanobbing Range C In-Pit TSF Licence Amendment
Issue Date: 31/03/2020 ENV-TS-RP-0178 Page 16 of 34
In a subsequent Mining Proposal addendum (Cliffs 2013), analysis was undertaken to characterise waste rock of C Pit. The majority of waste material below the water table (assumed to be 337 m AHD) was found to be neutral, with pH values typically between 6 and 8, with some isolated zones of highly alkaline material. A limited volume of PAF waste rock was found. Unoxidised sulphides were considered likely to be present below the proposed pit floor (318 m AHD).
Waste rock excavated from C Pit was assessed and approved for disposal to the B/C Waste Rock Landform.
3.3.2 C Pit Backfilling
After sterilisation drilling had confirmed exhaustion of the mineral deposit, C Pit was partially backfilled with waste rock from the nearby Koolyanobbing Range E Deposit under MP 56363 and MP 61467 (MRL 2020). Approximately 2.49 million cubic metres of waste rock from E Pit has been back filled into the C Pit.
Waste rock from the E Pit has been described in the Koolyanobbing Range E Mining Proposal (REG ID 59431) and the Range E Deposit Extension MP (REG ID 61467) as largely non-acid forming (NAF). Geochemical characterisation has identified a limited mass (1%) of potentially acid forming (PAF, S = ≥0.3%) waste rock material, with a low capacity to generate acidity, metalliferous or saline drainage.
Previous investigations of the geochemistry of the iron ore deposits of the southern Koolyanobbing Range have similarly identified the presence of a limited volume of PAF waste rock. Comingling of the low volumes of PAF waste with NAF waste has been an accepted management practice within these operations, and no adverse monitoring results have been seen to date. To date, the approved Koolyanobbing Range mine operations have not presented any visual signs of acid or metalliferous drainage, confirming the assessment of waste rock in the mining area.
3.4 SURFACE HYDROLOGY
The Koolyanobbing Range coincides with part of the Internal Drainage Division of Western Australia, with salt lakes characteristic of the Yilgarn region. The Koolyanobbing Mine Site is located between Lake Deborah East, Lake Deborah West and Lake Seabrook, which form part of a chain of large, ephemeral salt lakes to the northwest, west and southwest. These lakes follow the course of a paleo-drainage channel. Peripheral dunes around the Lake Deborah system are well developed and comprise Aeolian sands (Cliffs 2009).
Lake Seabrook is located approximately 11.5 km south-east of C Pit and Lake Deborah is located approximately 10 km north-west of C Pit.
There are no significant defined catchment boundaries or surface drainage channels and the majority of runoff from the project area would occur as sheet flow (Cliffs 2009). Occasional small, ill-defined creek lines exist in runoff areas from the Koolyanobbing Range. These terminate in broad outwash zones upon reaching flat ground and would flow only rarely, following heavy rainfall. Flooding potential at the mine is low because the pits are situated high in the landscape and the direction of sheet flow would be away from the pits.
3.5 HYDROGEOLOGY
3.5.1 Groundwater Flow
Cliffs (2013) identified that groundwater in the region generally occurs in sand aquifers within the Tertiary palaeodrainage lines and was found in less substantial quantities in fractured rock aquifers away from these areas. Groundwater in the region moves from elevated areas to low lying drainages and lakes where evaporative losses occur (Cliffs 2013). Inferred connectivity between Lake Seabrook and Lake Deborah was considered by Rockwater (2011) to be poor because drawn down of the K Pit to the northwest of A, B and C Pits was not causing drawdowns in the Koolyanobbing Range pits (see Figure 6).

Koolyanobbing Range C In-Pit TSF Licence Amendment
Issue Date: 31/03/2020 ENV-TS-RP-0178 Page 17 of 34
FIGURE 6: LOCATION OF ROCKWATER MODEL BOUNDARY IN RELATION TO PITS AND KEY GEOGRAPHICAL FEATURES
The pre-mining standing water level (SWL) in the Koolyanobbing Range deposits ranged from 330 to 337 m AHD (Rockwater 2011). The orebodies mined in the Koolyanobbing Rage were found to be moderately permeable, and most flow into the pits were anticipated to derive from the adjacent weathered basaltic rocks and faults intersecting the pit margins. The level to which groundwater in the Koolyanobbing Range pits will recover following the cessation of dewatering was considered to be dependent on the balance between groundwater inflow, rainfall and evaporation. Following the completion of mining and dewatering of the C Pit, the groundwater was expected to recover to an elevation of approximately 330 m AHD within 10 years. However, it was noted at the time that the simple water balance did not take into account likely flow between the pits, and the stabilised water level in C Pit would be slightly lower than 330 m AHD as groundwater would flow from C Pit and B Pit into A Pit.
Given the pit lake in C Pit was predicted to stabilise at lower elevations than the SWL (337 m AHD), Rockwater (2011) noted that it would function as a groundwater sink after dewatering ceased. Groundwater flow towards the pit was not expected to impact the regional groundwater system.
The base of C Pit will be filled to 338m AHD with waste rock, removing existing ponded water. This will change the current hydrological conditions associated with the C Pit void. It will no longer be a groundwater sink, but will reinstate pre mining hydrological flows. In relation to this proposal MRL have assumed groundwater level will rebound to pre-mining level of 337 m AHD. Given the hydraulic connectivity with Pit A and Pit B, the final groundwater levels would be lower.
3.5.2 Groundwater Quality
Groundwater in the Yilgarn region is known to be saline, with Total Dissolved Solids (TDS) over 3,000 mg/L (BoM 2012). Groundwater sampling from A Pit, B Pit and C Pit dewatering bores 1 is shown in Table 4. The measured groundwater salinity levels were regularly in the highly saline to brine classification. A pre-mining baseline Total Dissolved Solids (TDS) for C Pit was 63,400 mg/L, and this measurement was taken at construction of the production bore. Sample points are shown in Figure 7.

Koolyanobbing Range C In-Pit TSF Licence Amendment
Issue Date: 31/03/2020 ENV-TS-RP-0178 Page 18 of 34
TABLE 4: MEASURED TOTAL DISSOLVED SOLIDS PRODUCTION BORE GROUNDWATER
Koolyanobbing Production Bores TDS (mg/L)
Salinity Status*
Brackish Saline Highly Saline Brine 1000-2000 2000-10000 10000-35000 >35000
DATE APBW2 APWB3 BPWB1 CPWB1
Oct-12 94290 Nov-12 87250 Dec-12 79030 Jan-13 93110 Jul-13 28250 56060
Nov-13 15120 62010 Jan-14 36240 Apr-14 27140 104100 32420 Jun-14 63400 Jul-14 92840 65150 15310
Aug-14 8628 Sep-14 10890 Oct-14 101800 58370 74250 8515 Jan-15 100200 79730 Apr-15 87770 71470 68480 10310 Jul-15 88390 61800 75780 77800 Oct-15 87180 59410 73820 24090 Jan-16 38400 Apr-16 32350 Jul-16 49910 Oct-16 55680
* Source: Classifications from Mayer, XM, Ruprecht, JK & Bari, MA 2005, Stream salinity status and trends in south-west Western Australia, Department of Environment, Salinity and land use impacts series, Report No. SLUI 38 (https://www.water.wa.gov.au/water-topics/water-quality/managing-water-quality/understanding-salinity)

Koolyanobbing Range C In-Pit TSF Licence Amendment
Issue Date: 31/03/2020 ENV-TS-RP-0178 Page 19 of 34
FIGURE 7: KOOLYANOBBING A, B & C PIT BORE LOCATIONS
3.6 FLORA AND FAUNA
3.6.1 Flora
The Koolyanobbing Range area is located within the Coolgardie Botanical District of the South-western Interzone (Beard 1990 in Cliffs 2009). Several vegetation and flora surveys have been completed for the central Koolyanobbing Range (Cliffs 2009). Five vegetation units were identified in the vicinity C Pit, which are dominated by Acacia sp. Mt Jackson (B. Ryan 176) assemblages reflecting the pit position on the mid- to upper-slopes on the range.
There are no Threatened Ecological Communities (TECs) overlying the project area for the In-Pit TSF and no Declared Rare Flora (DRF) have been detected in the vicinity of the C Pit (Cliffs 2009). Populations of priority flora were identified close to, and south east, of C Pit:
• Beyeria rostellata Halford & R.J.F.Hend. (formerly Beyeria sp. Jackson Range (R. Cranfield & P. Spencer 7751)) – Priority 1;
• Hibbertia lepidocalyx subsp. tuberculata – now Priority 3;
• Lepidosperma ferricola – now Priority 3;
• Spartothamnella sp. Helena and Aurora Range (P.G. Armstrong 155-109) – no longer current; and
• Stenanthemum newbeyi – Priority 3.
There is no known groundwater dependent native vegetation in the vicinity of the C Pit (groundwater levels 30 m below adjacent surface level).

Koolyanobbing Range C In-Pit TSF Licence Amendment
Issue Date: 31/03/2020 ENV-TS-RP-0178 Page 20 of 34
3.6.2 Fauna
The plains, slopes and ridges of the Koolyanobbing Range provide habitat for a variety of vertebrate and invertebrate fauna taxa, including species of conservation significance (Cliffs 2009). Vertebrate species were noted as having a wide distribution area, not confined to the Koolyanobbing mining project area.
The Tree-stem Trapdoor Spider (Aganippe castellun), a Priority 4 species, has been identified in the vicinity of the C Pit. This species is known to have a wide distribution area and occurs across the southern Koolyanobbing Range, preferring the mid and lower slope habitats on the range across a range of soil types (Bamford 2009, cited in Cliffs 2009). Surveys have found that A. castellum is able to live in close proximity to operational areas, with burrows recorded within 25 m of A Pit and adjacent to the D Pit haul road.
3.7 HERITAGE
A search of the Western Australian Aboriginal Heritage Inquiry System (AHIS) found Registered Aboriginal Site 16721, Gnamma Hole, located on mining tenement M77/607, north of C Pit.
Prior to the Project area being developed and mined, YIPL/Cliffs commissioned ethnographic and archaeological surveys over the Project area. No sites of ethnographic or archaeological significance were recorded. While the original survey documents could not be located, a search of the AHIS confirmed that aboriginal heritage surveys had been conducted over the Project area.
3.8 LAND USE AND COMMUNITY
The current land use of the Proposal area and surrounds is mining operations and mineral exploration and is not located in the vicinity of any community areas. The nearest non-mining community is Southern Cross, about 50 km to the south.

Koolyanobbing Range C In-Pit TSF Licence Amendment
Issue Date: 31/03/2020 ENV-TS-RP-0178 Page 21 of 34
4. PROPOSED ACTIVITIES (ATTACHMENT 3A)
4.1 IN-PIT TAILINGS STORAGE FACILITY
The objective of the proposal is to provide Albemarle Corporation with an interim solution for disposal of approximately 1 million cubic metres of dry Lithium Hydroxide tailings from its Kemerton facility over the next four years. This proposal is for an In-Pit TSF and involves the backfilling of the C Pit using tailings transported from Albemarle’s proposed Lithium Hydroxide plant in Kemerton in line with estimated production rates detailed in Table 5. This will allow Albemarle to progress further opportunities for alternative tailings solution.
The proposal does not involve any activity beyond previously disturbed areas and no mining is associated with the proposal. Seepage from tailings will not be an issue as tailings will be “dry stacked” within C Pit where the predominant climatic influence is evaporation throughout the year (refer Figure 3). In addition, groundwater in the region is highly saline and there are no known groundwater dependant ecological receptors.
Kemerton tailings will be hauled by road trains to the C Pit.
TABLE 5: EXPECTED PRODUCTION SCHEDULE FOR TAILINGS DEPOSITION
Year 2021 2022 2023 2024
Approximate Tonnage (kt) 150 400 500 560
Approximate Volume (m3) 100,000 250,000 300,000 350,000
4.1.1 Tailings Back-Fill Design Detail
All tailings will be deposited in the C Pit beginning at a base level of 338 m AHD, above the pre-mining groundwater level of 337 m AHD (see Figure 4). The final elevation of the tailings in C Pit are expected to be approximately 383 m AHD.
Tailings proposed deposition in C Pit is illustrated in Figure 8 and Figure 9. The tailings will be received at the TSF in dry form and “dry stacked” using earth working equipment. The deposition procedure is described in the TSF Design Report (Appendix 1) which can be summarised as follows:
• The tails will be side cast tipped near the edge of the basin.
• Tails will then be pushed by dozer into the pit void until a level of 364 m AHD is achieved.
• A foundation of waste rock 2 m thick will be constructed.
• Tailings will then be deposited in 500 mm lifts and compacted using conventional mining equipment.
• Tailings placement will be such as to shed water to a constructed infiltration basin.
• Slope angles of less than 18 degrees will be created on batter slopes.
• The surface of the final deposition layer will be graded at a slope angle of less than 5 degrees to allow drainage.
• All tails will be capped with 1 m of competent waste rock at closure.
This methodology which was prepared by MRL Design Engineers with reference to the Department of Mines and Petroleum (DMP) Code of Practice for Tailings Storage Facilities (DMP 2013) and independently reviewed by Geotechnical Consultants Okane (Appendix 2). The TSF design will meet objectives of being safe, stable, non-polluting, erosion-resistant and self-sustaining, during construction, operation, rehabilitation and after closure. The proposed TSF is classified as a Category 3 facility, based on the level of hazard associated with the project, including:
• Location (in-pit).

Koolyanobbing Range C In-Pit TSF Licence Amendment
Issue Date: 31/03/2020 ENV-TS-RP-0178 Page 22 of 34
• Physical properties of the tails (dry stacked).
• Limited impact on local environmental values.
• Tailings characteristics.
FIGURE 8: COMPLETED TAILINGS DEPOSITION IN C PIT WITH SURFACE CONTOURS
FIGURE 9: CROSS SECTION OF C PIT SHOWING DESIGN AND COMPLETED TAILINGS DEPOSITION
4.1.2 Tailings Properties
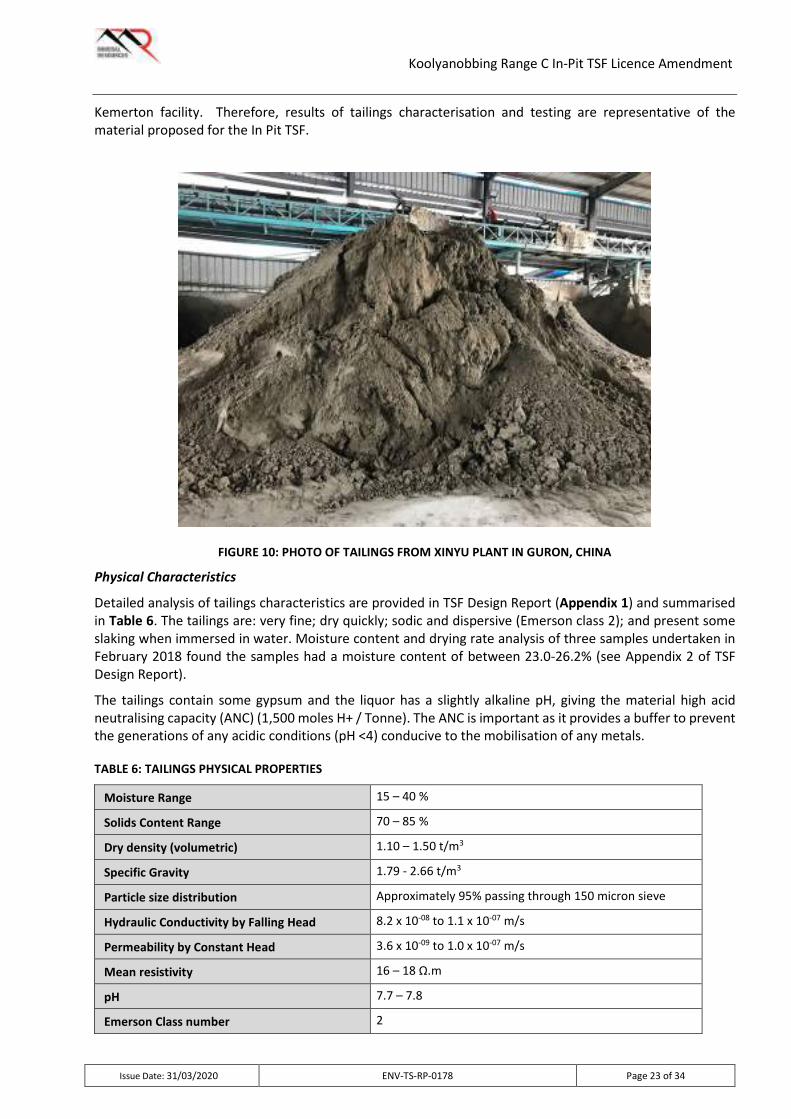
The tailings material are an inert by-product of Lithium Hydroxide processing. Tailings material sampled for material testing was obtained from Xinyu plant in Guron, China (see Figure 10). The Xinyu plant is identical to the Kemerton Lithium Hydroxide Plant, currently under construction. Albemarle advised MRL that the tailings obtained were from treatment of Talison Greenbushes Spodumene, the feedstock used for the
Koolyanobbing Range C In-Pit TSF Licence Amendment
Issue Date: 31/03/2020 ENV-TS-RP-0178 Page 23 of 34
Kemerton facility. Therefore, results of tailings characterisation and testing are representative of the material proposed for the In Pit TSF.
FIGURE 10: PHOTO OF TAILINGS FROM XINYU PLANT IN GURON, CHINA
Physical Characteristics
Detailed analysis of tailings characteristics are provided in TSF Design Report (Appendix 1) and summarised in Table 6. The tailings are: very fine; dry quickly; sodic and dispersive (Emerson class 2); and present some slaking when immersed in water. Moisture content and drying rate analysis of three samples undertaken in February 2018 found the samples had a moisture content of between 23.0-26.2% (see Appendix 2 of TSF Design Report).
The tailings contain some gypsum and the liquor has a slightly alkaline pH, giving the material high acid neutralising capacity (ANC) (1,500 moles H+ / Tonne). The ANC is important as it provides a buffer to prevent the generations of any acidic conditions (pH <4) conducive to the mobilisation of any metals.
TABLE 6: TAILINGS PHYSICAL PROPERTIES
Moisture Range 15 – 40 %
Solids Content Range 70 – 85 %
Dry density (volumetric) 1.10 – 1.50 t/m3
Specific Gravity 1.79 - 2.66 t/m3
Particle size distribution Approximately 95% passing through 150 micron sieve
Hydraulic Conductivity by Falling Head 8.2 x 10-08 to 1.1 x 10-07 m/s
Permeability by Constant Head 3.6 x 10-09 to 1.0 x 10-07 m/s
Mean resistivity 16 – 18 Ω.m
pH 7.7 – 7.8
Emerson Class number 2

Koolyanobbing Range C In-Pit TSF Licence Amendment
Issue Date: 31/03/2020 ENV-TS-RP-0178 Page 24 of 34
Geochemical Characteristics
Analysis of the major geochemical properties of the tailings was included in the TSF Design Report (Appendix 1). Concentrations of elements in tailings is presented in Table 7. Analysis of both solids and liquor from the tailings show the tailings are inert and non-toxic, comprised of alumina-silicates, gypsum, residual salts, trace elements and oxides from spodumene ore.
The median results of elements in the tails were compared to crustal abundance data (Bowen, 1979) to determine elements of interest for leach testing using the Leaching Environmental Assessment Framework (LEAF). Other elements of concern were also included following discussion with DWER for chemical constituents that were in exceedance of the waste classification and waste definitions guidelines (Rambol, 2018).
TABLE 7: CONCENTRATION OF ELEMENTS IN TAILINGS SOLIDS AND LIQUORS
Element Tailings #1 (ppm)
Tailings #2 (ppm)
Tailings #3 (ppm)
Liquor #1 (mg/L)
Liquor #2 (mg/L)
Liquor #3 (mg/L)
Ag - < 0.2 < 0.2 -
Al 79,780 85,190 93,142 0.172 0.162 0.096
As 27.3 27.4 27.3 < 0.2 < 0.2 < 0.01
B 9 9.1 9.1 13.1 13.1 19.9
Ba - 5 5 < 0.2 < 0.2 < 0.01
Be - 129 124 < 0.2 < 0.2 < 0.01
Bi - 3.7 3.6 - - < 0.01
Ca 70,690 74,696 79,825 675 709 432
Cd - 4 3.9 < 0.2 < 0.2 < 0.01
Ce - 1.7 1.6 < 0.2 < 0.2 < 0.01
Co - 2.3 2.4 < 0.2 < 0.2 < 0.01
Cr - 20 18.8 < 0.2 < 0.2 < 0.01
Cs - 201 196 - - < 0.01
Cu - 5.8 6.5 < 0.2 < 0.2 0.071
Fe 6594 6397 7362 < 0.2 < 0.2 < 0.05
K 3102 3188 3472 0.41 -
La < 0.01 < 0.01 < 0.01 - - < 0.01
Li 2364 2515 2674 1.76 1.77 1.64
Mg 1766 1832 1950 327 346 -
Mn - 451 426 0.019 0.019 0.021
Mo - < 1.0 3.8 < 0.2 < 0.2 0.01
Na 1714 1791 1931 1.28 -
Nb - 33.9 28.4 - - < 0.01
Ni - 9.4 9.1 < 0.2 < 0.2 0.036
P 1052 1114 1119 0.106 0.096 -

Koolyanobbing Range C In-Pit TSF Licence Amendment
Issue Date: 31/03/2020 ENV-TS-RP-0178 Page 25 of 34
Element Tailings #1 (ppm)
Tailings #2 (ppm)
Tailings #3 (ppm)
Liquor #1 (mg/L)
Liquor #2 (mg/L)
Liquor #3 (mg/L)
Pb - 2.6 2.6 < 0.2 < 0.2 < 0.01
S 36,331 37,194 36,982 892 1022 -
Sb - 27.7 26.8 - - 0.025
Sc - < 1.00 < 1.00 < 0.2 < 0.2 < 0.04
Se - < 1.00 2.1 < 0.2 < 0.2 < 0.01
Si 228,083 231,052 - 7.05 7.16 -
Sn - 80.7 79.8 < 0.2 < 0.2 < 0.01
Sr 89.7 100 110 4.04 4.09 3.24
Ta - 49.9 40.5 - - < 0.01
Th - 1.9 1.6 - - < 0.01
Ti - 425 428 - - 0.464
Tl - 5.5 5.7 - - < 0.01
U - 29 25 - - 0.012
V 9.22 9.25 18.5 < 0.2 < 0.2 < 0.01
W - 24 24 < 0.2 < 0.2 < 0.01
Zn 108 54.3 63.3 < 0.2 < 0.2 < 0.01
Note: Certificate of Analysis (EGS/2019/155) is appended to the TSF Design Report
Leach testing demonstrated that tailings are slightly alkaline, due to high proportion of gypsum. The tailings also have high acid neutralising capacity of 1,500 moles H+ / Tonne.
LEAF tests of the tailings, undertaken by Ramboll for Albemarle in 2018 and the summary report is appended to the TSF Design Report (Appendix 1). The tests were completed in accordance with US EPA methodologies 1313, 1314, 1315 and 1316.
Results provided by Albermarle in 2019 indicated:
• No leaching of Ag, Bi, Hg, Se, Cr(VI).
• There was increased leaching below pH 4 for Al, As, B, Ba, Be, Cs, Li, Pb, Sb, U, V, Ta, Th.
In summary, both site conditions and the tailings characteristics will not produce conditions conducive to leach metals from the tails. This is reflected in risk assessment undertaken identified this as a low risk (Appendix 2).

Koolyanobbing Range C In-Pit TSF Licence Amendment
Issue Date: 31/03/2020 ENV-TS-RP-0178 Page 26 of 34
5. LOCATION AND RECEPTORS
Table 8 lists the relevant sensitive land uses in the vicinity of the Prescribed Premises which may be relevant to this licence amendment.
TABLE 8: RESIDENTIAL AND SENSITIVE PREMISES
Residential and sensitive premises Distance from Prescribed Premises
Southern Cross About 50 km south
Koolyanobbing Site Accommodation About 3.8 km north west from pit
The Koolyanobbing accommodation village is approximately 4 km to the north west of the C Pit, however it is not regarded as a sensitive receptor for the purpose of a Part V Risk assessment as it can be regulated under different legislation.
Utilising the Assessment of Contaminated sites NEPM 1999 Guideline for Site Characterisation (Schedule B2 amended 2013), a Conceptual Site Model (CSM) was developed to show the source and pathways of exposure related to C Pit tailings deposition impact on the surrounding environment (see Appendix 2).
The main receptors identified that have plausible pathways are mine personnel working in the vicinity of tailings deposition within the C Pit, and terrestrial biota close to the pit. Implementation of YIPL Dust Management Plan and standard mining practices will address the safety issues associated with exposure to the tailings and drainage / leachate from tailings.
Metal contaminated leachate from tailings to groundwater will not occur from rainwater, unless the tailings are in contact with waste rock containing potential acid forming (PAF) material. Waste rock from E Pit will form base of the In-Pit TSF and this has been characterised as largely NAF, with a limited mass of PAF material with a low capacity to generate acidity, metalliferous or saline drainage. The accepted practice of comingling low volumes of PAF waste rock with NAF waste rock will continue. Testing of the waste rock prior to use will avoid generation of acid leachates forming and release of metal contamination into the groundwater. It is important to note that the tails material has a high acid neutralising capacity, and as such if any PAF material is encountered, it will not result in AMD issues.
If groundwater were to rebound above current predictions and interact with the tailings, the tails will remain benign and no emissions are likely to occur.
There are no beneficial uses of groundwater.

Koolyanobbing Range C In-Pit TSF Licence Amendment
Issue Date: 31/03/2020 ENV-TS-RP-0178 Page 27 of 34
6. EMISSIONS AND DISCHARGES (ATTACHMENT 6A)
6.1 OVERVIEW
A Risk Assessment of the TSF project was undertaken (see Appendix 2). This took into consideration the following key characteristics of the receiving environment and tailings properties:
• The receiving environment is within a pit with competent NAF rock walls and base.
• The C Pit groundwater is hypersaline with no known other beneficial uses and no connection to ecological receptors.
• Both the tailings and interstitial liquor are benign with the tailings displaying high acid neutralising capacity (1,500 moles H+ / Tonne).
• Leach testing at varying pH shows leaching of metals under acidic conditions (pH <4). These conditions are not encountered within the pit environment.
• Rainfall and any tailings liquor drainage will be diverted to a sump for infiltration, or evaporation away from encapsulated tailings. This is for operability only, with no concerns based on the low environmental impact described above.
Of all the potential hazards considered only two risks were identified with the TSF as follows:
• Potential for localised dust emissions within the pit during deposition.
• Tailings saturation impacting trafficability.
Neither of these risks were deemed to impact the environment and will be controlled with standard mine operating practices.
The following sub-sections describe impacts and any proposed mitigation against each of the environmental factors. The discussion only relates to those relevant to the proposed TSF.
6.2 LAND CLEARING AND TOPSOIL
No clearing will be undertaken for the TSF Project and topsoil management measures will not be required.
6.3 SURFACE WATER
The TSF Project will not change surface water flows at C Pit and current management practices will remain in place.
6.4 GROUNDWATER
The tailings will be deposited from 338 m AHD, above the C Pit ground water recovery level, which is assumed to be 337 m AHD and C Pit will no longer function as a groundwater sink. Any potential interaction with the groundwater will be from tailings liquor drainage (slightly alkaline) or from rain water percolation through the stored tailings and through the backfilled pit floor.
Leach testing (LEAF methodology) of representative tailings were undertaken by Albemarle / Ramboll which found increased leaching of metals below pH 4.0. The geochemical properties of the tails have a high acid neutralising capacity. Together with the tailings deposition method and water management controls associated with the TSF, no conditions conducive to the generation of metalliferous leachates will be created.
A Risk Assessment (see Appendix 2) of the potential impact on groundwater from tailings leachate shows that the TSF Project is unlikely to have significant impact on groundwater quality beneath the tailings due to the following:

Koolyanobbing Range C In-Pit TSF Licence Amendment
Issue Date: 31/03/2020 ENV-TS-RP-0178 Page 28 of 34
• The C Pit groundwater is hypersaline with no known other beneficial uses, and with no connection to ecological receptors.
• The tailings will be dry, with relatively low moisture.
• The tailings and liquor are benign and have a high acid neutralising capacity.
• Leach testing with does not release metal contaminants above pH4.
• Evaporation rates far exceed rainfall in the region.
• Rainfall and any tailings liquor drainage will be diverted to a sump for evaporation, or infiltration away from encapsulated tailings.
Should groundwater rebound higher than modelled and interact with the base of the tailings facility, there would be no change to emissions to the environment. Based on previous assessments:
• There is poor hydraulic connectivity between Lake Seabrook and Lake Deborah.
• There is hydraulic connectivity between A Pit, B Pit and C Pit, with groundwater flowing from C Pit and B Pit into A Pit.
• Groundwater flow from C Pit towards the closest lake (about 4.7 km northwest) is unlikely as water must travel through or underneath A Pit and B Pit.
• The benign nature of the tailings in local conditions will not generate any emissions when in contact with ground water.
6.5 FLORA AND FAUNA
The TSF Project will not change previously assessed impacts to flora and fauna in the Project area. Current flora and fauna management practices will remain in place.
6.6 HERITAGE
The In-pit TSF Project will not affect the registered Aboriginal Site Gnamma Hole. Current heritage management practices will remain in place.
6.7 WASTE PRODUCTS
The TSF Project does not include the storage or use of domestic or industrial waste products.
The previous approval for a Category 64, putrescible landfill, under the Environmental Protection Regulations 1987 was never actioned and the outcome of this proposal will revoke that approval.
6.8 DANGEROUS GOODS, HYDROCARBONS AND HAZARDOUS SUBSTANCES
The TSF Project does not include the storage or handling of dangerous goods or hazardous substances.
Existing management plans are in place in the event of hydrocarbon spill from mobile plant and equipment. These will be minor and not result in any significant impact on the environment.
6.9 ATMOSPHERIC POLLUTION AND NOISE
6.9.1 Dust
The Lithium Hydroxide tailings are known to dry quickly and be dispersive when dry. Figure 11 shows the drying rate of Lithium Hydroxide tailings at laboratory temperatures. As noted in the TSF Design Report (Appendix 1), given that the C Pit is an arid area with very high summer temperatures, it is reasonable to expect that the Lithium Hydroxide tailings will dry quickly and may generate local dust.

Koolyanobbing Range C In-Pit TSF Licence Amendment
Issue Date: 31/03/2020 ENV-TS-RP-0178 Page 29 of 34
Site preparation, construction of the infiltration basin embankments and deposition of the tailings has the potential to generate dust emissions from sources such as:
• Mobile equipment movement.
• Placing and compacting tails.
• Wind erosion from the exposed and disturbed tail surfaces.
Source: Albemarle; 2019 (referencing work undertaken by Stephen Belmont, Kings Mountain)
FIGURE 11: LITHIUM HYDROXIDE TAILINGS DRYING RATE
Extreme weather events such as high wind speed during dry conditions can result in more significant dust emissions. The impact from these events is expect to be contained within the pit void.
Particulate emissions will be minimised during depositions of tailings through:
• Use of water trucks and/or water sprays to control emissions when visible dust is being generated and/or visible dust is reported by site personnel.
• Reducing activities which cause visible dust emissions during periods of high winds if dust cannot be controlled through water sprays.
• Use of defined haul routes for mobile equipment travelling on unsealed surfaces or unformed roads.
Through implementation of these control measures, dust emissions are expected to be temporary, localised and have minimal impact. Any complaints relating to dust emissions will be recorded and investigated. It is unlikely that dust emissions from the site preparation and embankment construction would impact outside of C Pit boundary.
Similarly, dust emissions resulting from deposition of tailings are considered unlikely to impact the vegetation within the surrounding area due to the relatively small scale of the works, the dust suppression which will be implemented, and the distance between the works and the conservation area.
6.9.2 Air emissions
Gaseous emissions during the construction of the Project will be limited to combustion emissions from mobile equipment. Due to the small fleet required for the Project construction, combustion emissions from mobile equipment are expected to have negligible impact on the local air quality and will not impact sensitive receptors. Gaseous emissions will be minimised by ensuring mobile equipment are operated and maintained in accordance with manufacturer’s specifications.
6.9.3 Noise emissions
Mobile equipment undertaking construction of the Project will be the primary source of noise during the construction period. C Pit is part of an ongoing mining operation, additional noise from mobile equipment
0%
5%
10%
15%
20%
25%
0 16 36 60
Moi
stur
e Co
nten
t
Time (hours)
Moisture Loss at 20oC - No Wind

Koolyanobbing Range C In-Pit TSF Licence Amendment
Issue Date: 31/03/2020 ENV-TS-RP-0178 Page 30 of 34
associated with the tailings deposition would be minimal. The town of Southern Cross is the closest residential sensitive receptor about 50 km from pit wall, which defines the extent of the TSF deposition.
Standard noise minimisation practices will be employed during the construction period:
• Operation and maintenance of mobile equipment in line with the manufacturer’s specifications.
• Regular inspections of vehicles to ensure they are in good working order.
• All complaints relating to noise will be recorded and investigated.
• Majority of the work will be carried out at depth in the pit void, reducing surface noise levels.
Only a small fleet of equipment is required for the deposition of tailings with no noticeable increase in noise emissions expected from the TSF. Any increase is not expected to impact on the amenity of any receptors due to the separation distance and buffering by vegetation and pit walls.
The transport of tailings, peaking at approximately 500,000 t/yr from the Kemerton facility may result in additional noise and vehicle emissions along the nominated routes.
6.9.4 Light emissions
The TSF project is in-pit and therefore light spillage outside the pit is not significant. Minimal lighting will be provided at night for safety and security purposes but this is not likely to be detected by any receptors.
6.10 WASTE PRODUCTS
Given the nature of this proposal and restricted personnel access it is not envisaged any waste products will be produced within the In-Pit TSF. However waste bins and spill kits will be available near the work area and any wastes generated will be taken to one of the approved Part V Landfill facilities within the Prescribed Premise area.
6.11 DANGEROUS GOODS, HYDROCARBONS AND HAZARDOUS SUBSTANCES
The In-pit TSF Project does not include the storage or handling of dangerous goods or hazardous substances. Spill kits will be located at the In-pit TSF to ensure that any hydrocarbon or chemical spills are promptly cleaned up and contaminated material removed.

Koolyanobbing Range C In-Pit TSF Licence Amendment
Issue Date: 31/03/2020 ENV-TS-RP-0178 Page 31 of 34
7. APPLICATION FEE (ATTACHMENT 9)
The licence amendment fee is detailed in Table 9 and is estimated to be $2,050.
TABLE 9: LICENCE AMENDMENT FEE
Category Production or design capacity Fee Units Fee
Category 5 (c) Tailings Storage Facility
More than 500,000 tonnes per year but not more than 5,000,000 tonnes per year
300 300 x 6.80 = $2040
Fee Multiplier is $6.80, Amendment fee is determined by the category with the largest fee units.
Koolyanobbing Range C In-Pit TSF Licence Amendment
Issue Date: 31/03/2020 ENV-TS-RP-0178 Page 32 of 34
8. REFERENCES
Astron (2019). Yilgarn Mine Closure Plan prepared for Polaris Metals Pty Ltd. May 2019.
Bowen. H. (1979) Environmental Chemistry of the Elements, Academic Press, London
Bureau of Meteorology (BoM) (2012) Australian Water Resources Assessment 2012. Australian Government.
Cliffs Asia Pacific Iron Ore Pty Ltd (2009) Koolyanobbing C Pit Expansion Project – Addendum to Mining Proposal 2805 (Tenement M77/607). DMP Reg ID 21823. Report prepared by Nielsen J of Sustainability Pty Ltd for Cliffs Asia Pacific Iron Ore Pty Ltd. Revision 0. May 2009.
Cliffs Asia Pacific Iron Ore Pty Ltd (2015) Yilgarn Operations Koolyanobbing Range C Deposit Backfilling Mining Proposal, Addendum to Mining Proposals 21823 and 32064, Tenement M77/607-I. DMP REG ID 56363. Report prepared by Hawkins S of Globe Environments Australia Pty Ltd for Cliffs Asia Pacific Iron Ore Pty Ltd. Revision B. September 2015.
Department of Mines and Petroleum (DMP) (2013). Tailings Storage Facilities in Western Australia – Code of Practice: Resources Safety and Environment Divisions, Department of Mines and Petroleum, Western Australia
Ramboll (2018). Albemarle Australia Lithium Tailings Leaf Testing summary report. April 2018
Ramboll (2019). Albemarle Lithium Processing Project Tailings Storage Facility MCA. August 2019
Rockwater (2011) Koolyanobbing A, B, C Pits: Assessment of Dewatering Rates and Final Void Water Levels. Report prepared by de Broekert P of Rockwater Pty Ltd for Cliffs Asia Pacific Iron Ore Pty Ltd. Report No. 246.4/11/02. June 2011.
Xstract (2018). Lithium Tailings characterisation, Dry Stacked Tailings – Laboratory Test Results. April 2018

Koolyanobbing Range C In-Pit TSF Licence Amendment
Issue Date: 31/03/2020 ENV-TS-RP-0178 Page 33 of 34
APPENDIX 1: TAILINGS DESIGN REPORT
1 | P a g e
TSF Design Report
February 2020

Koolyanobbing Range TSF Design Report
2 | P a g e
TABLE OF CONTENTS
1 TSF PROPOSAL SUMMARY ................................................................................................................... 5
2. TSF DESIGN CONSIDERATIONS ............................................................................................................ 9
2.1 Introduction ............................................................................................................................. 9
2.2 TSF Storage capacity ................................................................................................................ 9
2.3 Tenure and site conditions ...................................................................................................... 9
2.3.1 Climate ............................................................................................................................ 9
2.3.2 Geology and Waste Rock Geochemistry ...................................................................... 10
2.3.3 Landforms and Soils ...................................................................................................... 10
2.3.4 Surface Hydrology ........................................................................................................ 11
2.3.5 Hydrogeology................................................................................................................ 12
2.4 Retaining structure properties .............................................................................................. 13
2.5 Tailings properties ................................................................................................................. 13
2.5.1 Physical Characteristics ................................................................................................ 13
2.5.2 Geochemical Characteristics ........................................................................................ 14
2.5.3 Process and Return Liquor ............................................................................................ 16
2.5.4 Rheology ....................................................................................................................... 16
3. TSF DESIGN ........................................................................................................................................ 18
3.1 Introduction ........................................................................................................................... 18
3.2 Modelling and design studies ................................................................................................ 19
3.2.1 Stability Assessment ..................................................................................................... 19
3.2.2 Design acceptance criteria ........................................................................................... 20
3.2.3 Erosion control ............................................................................................................. 20
3.2.4 Seepage ........................................................................................................................ 21
3.2.5 Surface water flow and storage .................................................................................... 21
3.2.6 Water balance .............................................................................................................. 21
3.2.7 Settlement .................................................................................................................... 21
3.3 Design and construction details ............................................................................................ 22
3.3.1 Stage 1 Design .............................................................................................................. 22
3.3.2 Stage 2 Design .............................................................................................................. 23
3.3.3 Construction and Emissions ......................................................................................... 26
3.4 Tailings discharge and water management ........................................................................... 28
3.5 Covers and liners .................................................................................................................... 28
3.6 Quality Assurance .................................................................................................................. 28
3.7 Spillways ................................................................................................................................ 28
4. OPERATIONAL REQUIREMENTS ........................................................................................................ 29

Koolyanobbing Range TSF Design Report
3 | P a g e
4.1 Management of tailings deposition and water ..................................................................... 29
4.2 Seepage management ........................................................................................................... 29
4.3 Erosion control ....................................................................................................................... 29
4.4 Performance monitoring and instrumentation ..................................................................... 29
5. CLOSURE CONSIDERATIONS .............................................................................................................. 31
5.1 Overview ................................................................................................................................ 31
5.2 Decommissioning ................................................................................................................... 31
5.3 Rehabilitation ......................................................................................................................... 31
5.4 Performance monitoring against closure criteria .................................................................. 31
6. CERTIFICATION OF COMPLIANCE ...................................................................................................... 34
7. REFERENCES ...................................................................................................................................... 35
FIGURES
FIGURE 1: C PIT LOCATION ...................................................................................................................... 7
FIGURE 2: DWER WATER SALINITY CATEGORIES .................................................................................. 13
FIGURE 3: LITHIUM HYDROXIDE TAILINGS DRYING RATE ..................................................................... 14
FIGURE 4: PREPARATION OF C PIT TO 338M AHD PRIOR TO TAILINGS DEPOSITION ........................... 22
FIGURE 5: STAGE 1 TAILINGS DEPOSITION TO 364M AHD ................................................................... 23
FIGURE 6: TAILINGS DEPOSITION TO 370M AHD .................................................................................. 24
FIGURE 7: TAILINGS DEPOSITION TO 376M AHD .................................................................................. 25
FIGURE 8: TAILINGS DEPOSITION TO 382M AHD .................................................................................. 25
FIGURE 9: C PIT WITH CAPPED TAILINGS .............................................................................................. 25
FIGURE 10: CROSS SECTION OF C PIT AFTER CAPPING ......................................................................... 26
FIGURE 11: INFILTRATION BASIN FOR RAINWATER RUNOFF & TAILINGS LIQUOR DRAINAGE ............ 28
TABLES
TABLE 1: TSF STORAGE DATA SHEET ....................................................................................................... 8
TABLE 2: APPROXIMATE TAILINGS DEPOSITION RATES .......................................................................... 9
TABLE 3: C PIT GROUNDWATER QUALITY ............................................................................................. 12
TABLE 4: TAILINGS PHYSICAL PROPERTIES ............................................................................................ 14
TABLE 5: CONCENTRATION OF ELEMENTS IN TAILINGS SOLIDS AND LIQUORS (PPM) ........................ 15
TABLE 6: LITHIUM HYDROXIDE TAILINGS TOTAL AND LEACHABLE METALS ........................................ 17
TABLE 7: CATEGORY 3 FACILITY REPORTING ........................................................................................ 18
TABLE 8: RECOMMENDED FACTORS OF SAFETY (ANCOLD, 2012) ........................................................ 19
TABLE 9: TAILINGS MATERIAL PROPERTIES .......................................................................................... 19
TABLE 10: SUMMARY OF SEISMIC DESIGN PARAMETERS .................................................................... 20

Koolyanobbing Range TSF Design Report
4 | P a g e
TABLE 11: SUMMARY OF ANALYSIS TABLE ........................................................................................... 20
TABLE 12: SUMMARY OF TSF PERFORMANCE MONITORING ............................................................... 30
TABLE 13: C PIT CLOSURE OBJECTIVES, COMPLETION CRITERIA AND MONITORING PROGRAM ........ 32
APPENDICES APPENDIX 1 –TSF Project Risk Assessment
APPENDIX 2 – Lithium Tailings Leaf Testing Summary Report
APPENDIX 3 – XSTP Lithium Hydroxide Tailings Characteristics
APPENDIX 4 – EGS Certificate of Analysis
APPENDIX 5 – Tailings Chemical Analysis Data

Koolyanobbing Range TSF Design Report
5 | P a g e
1 TSF Proposal Summary MRL proposes to construct and operate a new in-pit tailings storage facility (TSF) with a capacity of 1 million BCM at the Koolyanobbing C Pit for storage of lithium tailings from Albemarle’s proposed “Lithium hydroxide monohydrate” production plant in Kemerton, WA. The Koolyanobbing C Pit is situated on M77/607-I and is about 50 kilometres north of Southern Cross in the Yilgarn area, refer to Figure 1. The Albemarle Lithium Hydroxide Plant is currently under construction in Kemerton and is expected to start producing Lithium Hydroxide tailings in first quarter of 2021. The Plant will process spodumene ore (containing 6% lithium oxide), transported from the Talison Mine at Greenbushes, to produce lithium hydroxide product and a sodium sulphate by-product. Commissioning is due in 2021 and first Lithium Hydroxide production of 20,000 tonnes per annum (tpa) planned in 2021 ramping up to 100,000 tpa in 2024, with a further 25 years project life at full production. The Koolyanobbing TSF (C Pit) is being proposed as an interim storage solution while investigation continues to minimise the generation of waste and its discharge to the environment for the Lithium Hydroxide plant. The C Pit TSF design report was prepared as per the DMP “Guide to the preparation of a design report for tailings storage facilities (TSFs), August 2015”. The design will meet objectives of being safe, stable, non-polluting, erosion-resistant and self-sustaining; during construction, operation, rehabilitation and after closure. The basis of design relies on the outcome of test work undertaken by Albemarle to characterise the physical and geo-chemical properties of the tailings and the specific environmental setting. Commitments to reduce potential environmental impacts and ensure adequate closure measures include:
• The design of the In-pit tailings handling and storage process, which will address road train access, stacking of the tailings and drainage within the pit.
• Tailings deposition within C Pit will be placed at a minimum 338m AHD, which is 1m above the pre-mining regional groundwater level (337m AHD).
• Tailings will be track rolled to ensure compaction during deposition. • The Yilgarn Iron Ore Pty Ltd (YIPL) Dust Management Plan will be implemented to minimise
tailings dust impact on personnel and the surrounding environment. • Water will be diverted to an infiltration basin, outside of the tailings footprint, during
deposition and post closure. • On completion of tailings deposition, the C Pit TSF will be capped with 1m of waste rock. • The final slope angles on the surface of the capped tails will be less than 5 degrees and batter
slopes no greater than 18 degrees ensuring limited opportunity for erosion. • All waste rock that may come in contact with tailings will be tested for acid metalliferous
drainage to ensure that only non-acid forming (NAF) material is used. • Should early, unplanned or permanent closure occur prior to completion of tailings
deposition, the landform will be made safe, access will be restricted and warning signs will be erected. Existing abandonment bunds will be re-established and or repaired. A Care and Maintenance plan will be developed that includes annual inspections for 3 years to confirm

Koolyanobbing Range TSF Design Report
6 | P a g e
TSF structural stability, access restriction and signage. Closure will remain unchanged with tailings material still being capped with NAF waste rock.

7 | P a g e
Figure 1: C Pit Location

8 | P a g e
Table 1: TSF storage data sheet
Project operator: Yilgarn Iron Ore Pty Ltd
Project name: TSF Date: 24 January 2020
TSF name: TSF Commodity: Lithium
Name of data provider: Enrico Chedid Phone: +61 8 6310 6771
TSF centre co-ordinates (GDA 94) 6584996 m North
744017 m East
Mining Tenement and Holder(s) details
TSF data
TSF status: Proposed
Type of TSF: In-pit Number of cells: 1
Hazard rating: Low TSF category: 3
Catchment area: Internal & external Nearest water course: 1km south of pit
Date deposition started (mm/yy): Tailings deposition has not commenced
Date deposition completed (mm/yy): N/A
Tailings discharge method: paddock dumping Water recovery method: No water recovery
Bottom of facility sealed or lined? N Type of seal or liner: No Liner
Depth to original groundwater level
Current groundwater level
337m AHD
324m AHD
Original groundwater TDS/pH: 55680 mg/l / pH 6.4
Ore process: Pyromet Tailings Deposition rate: 150kt initially
Impoundment volume (present) 4M m3 Expected maximum 1M m3
Mass of solids stored (present) Nil Expected maximum tonnes 1,500 kt
Above ground facilities
Foundation soils: N/A Foundation rocks: N/A
Starter bund construction materials: N/A Wall lifting by: N/A
Wall construction method/materials: N/A
Wall lifting material: N/A
Present maximum wall height agl: N/A Expected maximum m N/A
Crest length (present) N/A Expected maximum m N/A
Impoundment area (present) N/A Expected maximum ha N/A
Below ground (in-pit) facilities
Initial pit depth (maximum) 306m AHD (126m deep from North Central wall)
Area of pit base 0.67 ha
Thickness of tailings (present) Nil Expected maximum 26 m
Current surface area of tailings N/A (no tails)
Final surface area of tailings 6.5 ha
Properties of tailings and return water – no Tailings return is proposed
TDS mg/l pH 7.7 – 7.8 Solids content >70% Deposited density t/m3
Potentially hazardous substances: Nil WAD CN Nil
Any other NPI listed substances in the TSF? N

Koolyanobbing Range TSF Design Report
9 | P a g e
2. TSF Design Considerations 2.1 Introduction MRL proposes to construct and operate a new in-pit tailings storage facility at the Yilgarn Operations Koolyanobbing C Pit on mining tenement M77/607. The C Pit has been mined out and then partially backfilled with waste rock from nearby E pit. The C Pit has a further storage capacity of 4.3 million m3
and this proposal is for storage of approximately 1 million m3 of lithium tailings. The C Pit will be utilised for storage of lithium tailings which will be received from Kemerton Lithium hydroxide monohydrate production plant. The source of the ore to the processing plant, is spodumene from the Talison Greenbushes mine. The tailings are an inert, non-toxic material comprised of alumina-silicates, gypsum, residual salts, trace elements and oxides from spodumene ore. 2.2 TSF Storage capacity The C Pit has current capacity of 4.3M cubic metres to 5m below crest. Approximately 1M m3 (1.5Mt) of tailings deposition is expected to commence in 2021 and conclude in 2024 as per the rates in Table 2. Table 2: Approximate Tailings Deposition Rates
Year 2021 2022 2023 2024 Approximate Tonnage (kt) 150 400 500 560
Approximate Volume (m3) 100,000 250,000 300,000 350,000 Kemerton Lithium Hydroxide tailings, will be hauled by road trains to the proposed In-pit TSF where they will be side cast tipped, then dry stacked using conventional mining equipment e.g. Front End Loader / Dozer.
2.3 Tenure and site conditions
The Range C Deposit mine pit (C Pit) is located on the Koolyanobbing Range, on Mining Lease (M) 77/607-I. Refer to the mining proposal for details of Regional Setting.
Mining of the C Pit deposit was completed in 2017 and then the pit was partially backfilled with waste rock under MP 56363, after Sterilisation Drilling had confirmed exhaustion of the mineral deposit.
The following information is extracted from the Koolyanobbing C Pit Expansion Project Mining Proposal (REG ID 21823).
2.3.1 Climate
The region has an arid to semi-arid climate with four distinct seasons January is the hottest month (maximum averaging 35°C; minimum averaging 19°C) and July is the coldest (maximum averaging 18oC; minimum averaging 4°C). Temperature extremes of -5°C and 47.2°C have been recorded at Southern Cross.
The average rainfall varies from 300mm in the south-western corner of the Jackson area (around Koolyanobbing), to 265mm in the north-east. Winter (June to August) is the wettest time of year. Winter rains consist mainly of small falls associated with the passage of cold fronts. Summer rains occur from thunderstorms or tropical cyclones that have degenerated into rain-bearing depressions. Individual falls are sporadic, unreliable and sometimes exceed 100mm in a single rainfall event.
Koolyanobbing Range TSF Design Report
10 | P a g e
For the purpose of assessing flood potential and drainage design, the 100-year Annual Recurrence Interval (ARI) peak rainfall event (72 hour duration) equates to 2.5 mm/hr (180mm), Astron 2019. The annual evaporation averages around 2800mm, which is substantially in excess of rainfall.
During spring, summer and autumn, the winds are from the north-east to south-east and average approximately 6km/hr – 20km/hr. During winter, the winds are predominantly westerly to north-westerly, averaging around 5km/hr – 20km/hr. The area occasionally experiences strong winds, with speeds in excess of 100km/hr (recorded at Southern Cross) Astron, 2019.
2.3.2 Geology and Waste Rock Geochemistry
The Koolyanobbing Range is situated in a typical “greenstone” belt of Archaean age. The greenstone consists of volcanic material with BIF being precipitated in adjacent shallow basins. The BIFs host iron ore deposits that are typically haematite and goethite and are very resistant to erosion. Away from the Koolyanobbing mine site, complex bodies of banded gneiss and intrusive granitoids are found between the greenstone belts.
Test work on samples of waste rock from C Pit has not been carried out. However test work on waste rock from A and D Pits, located northwest and east of C Pit, indicated that these pits were geologically and geochemically similar (Graeme Campbell and Associates 2002). Therefore, it is reasonable to conclude that the geochemical characteristics of waste rock from Pits A and D are indicative of the characteristics of C Pit.
Samples of waste rock from Pits A and D were found to be neutral to alkaline, with pH values typically between 7.0 and 8.7 and were low in soluble salts (Graeme Campbell and Associates 2002). Furthermore, there were negligible quantities of pyrite, with sulphide-S representing less than 0.1% of the waste rock.
The waste rock had relatively low acid neutralising capacity (ANC), with values measured of less than 0.5kg H2SO4 per tonne and up to 11kg H2SO4 per tonne. Similarly, net acid generating (NAG) potential was low, at less than 0.5kg H2SO4 per tonne. The test results indicated that the waste rock could be classified as not acid forming (NAF).
Graeme Campbell and Associates (2002) concluded that these bedrocks were barren materials i.e. devoid of both sulphides and carbonates. Furthermore, almost all weathered and fresh bedrock should pose no geochemical concern for mine-waste management and may be handled as a Run-of-Mine (ROM) operation without the need for selective placement.
E Pit Waste Rock Geochemistry
The C Pit has been partially backfilled with waste rock from the nearby Range E Deposit Pit. Waste rock from the E Deposit Mine Pit has been described in the Koolyanobbing Range E Mining Proposal (REG ID 59431) and the Range E Deposit Extension MP (REG ID 61467) as largely Non Acid Forming (NAF).
Geochemical characterisation has identified a limited mass (1%) of potentially acid forming (PAF, S = ≥0.3%) waste rock material, with a low capacity to generate acidity. The waste rock presents a low-risk of acid or metalliferous drainage.
To date, the approved Koolyanobbing Range mine operations have not presented any visual signs of acid or metalliferous drainage; confirming the assessment of waste rock in the mining area.
2.3.3 Landforms and Soils
The predominant landscape of the Koolyanobbing area is of gently undulating lateritic duricrust and elevated sandplains, averaging approximately 400m AHD. The landscape is dissected by broad paleo-

Koolyanobbing Range TSF Design Report
11 | P a g e
drainage channels, which contain chains of salt lakes such as Lakes Deborah and Seabrook. The major landform of the area is the hills of the Koolyanobbing Range, which extends northwest-southeast at elevations of up to 513m AHD.
Within the project area, three distinct landform and soil types can be recognised – Hills, Outwash zone and Plains.
Hills
The ridge top comprises a BIF rising to 513m AHD i.e. up to 125m above the surrounding plains. Soils are residual or colluvial skeletal remains amongst rocks. They are predominantly very well drained red brown sandy clay loams to clay loams, which set hard and promote runoff. Rock pavement or scree covers up to 70% of the surface. The soil profile thickness ranges from zero to approximately 1m deep and is uniform. Hills exhibit minimal gully erosion. The soils are not saline and are expected to be acidic in pH.
Outwash Zone
The outwash zone slopes from the steep hill margin to the plains and are generally 500m wide with a vertical elevation of 20m – 50m. Soils comprise colluvial and alluvial materials washed down from the hills, together with patches of skeletal residues. They are predominantly red brown clay loams, silty clay loams and skeletal grits. Soils are well drained, hard setting and the majority of rainfall would run off in sheets.
Scree covers >90% of the soil surface but makes up 60% – 70% of the total soil mass. The soil profile thickness ranges from zero to several metres deep. The profile appears uniform, although there is some evidence of a calcrete hardpan in several locations. There is minimal evidence of erosion gullying. The soils are semi-saline to saline and are expected to be acidic, neutral or alkaline depending on their juxtaposition to calcrete deposits.
Plains
The plains undulate gently with an altitudinal variation of 5m – 15m. Soils are alluvial with only a small proportion of rock, although there is surface evidence of ironstone pebbles, quartz fragments, calcrete and laterite fragments.
The soils are red brown silty clay loams and sandy clay loams. They are poorly drained, set hard and are prone to sheet runoff and water-logging. The soil profile thickness is mostly greater than 1m, although there is evidence of calcrete horizons, laterite indurated bands and a duplex clay horizon at depth in some areas. There is minimal evidence of gully erosion. The soils are saline to highly saline in places and expected to be mostly alkaline in pH.
2.3.4 Surface Hydrology
There are no rivers in the region and all drainage is inland to strings of salt lakes. The Koolyanobbing Mine Site is located between Lake Deborah East, Lake Deborah West and Lake Seabrook, which form part of a chain of large, ephemeral salt lakes to the northwest, west and southwest. These lakes follow the course of a paleo-drainage channel. Peripheral dunes around the Lake Deborah system are well developed and comprise Aeolian sands.
There are no significant defined catchment boundaries or surface drainage channels and the majority of runoff from the project area would occur as sheet flow. Occasional small, ill-defined creek lines exist in runoff areas from the Koolyanobbing Range. These terminate in broad outwash zones upon reaching flat ground and would flow only rarely, following heavy rainfall. Flooding potential at the mine is low because the pits are situated high in the landscape and the direction of sheet flow would be away from the pits.

Koolyanobbing Range TSF Design Report
12 | P a g e
2.3.5 Hydrogeology
Groundwater studies initiated by Cliffs to determine dewatering requirements, indicated that groundwater in the region is typically saline and moves from elevated areas to low lying drainages and lakes where evaporative losses occur.
Groundwater in the region generally occurs in sand aquifers within the Tertiary paleo-drainage lines. Away from these areas, less substantial quantities of groundwater are found in fractured rock aquifers.
Drilling to determine depth to groundwater has shown that groundwater is unevenly distributed across the ridge. Preliminary water quality sampling has shown that the C Pit groundwater is hypersaline with a baseline total dissolved solids (TDS) measured at 63,400ppm (26D From 2014) The high TDS has been confirmed by groundwater sampling from C Pit water bore 1 (CPWB1) dewatering bore was undertaken periodically prior to cessation of mining in C Pit in early 2017.
Groundwater analysis from the dewatering bore in 2016 is presented in Table 3 and shows the C Pit groundwater quality is consistently saline to highly saline and close to neutral pH.
Table 3: C Pit groundwater Quality
Date pH CPWB1
TDS (mg/L)
Depth (m
AHD)
Jun-14 63400 Jul-14 7.05 15310
Aug-14 6.22 8628 342.4 Sep-14 6.48 10890 Oct-14 5.41 8515 342.6 Apr-15 7.07 10310 338.1 Jul-15 5.99 77800 336.5 Oct-15 6.38 24090 339.7 Jan-16 6.36 38400 333.2 Apr-16 6.42 32350 324.3 Jul-16 6.32 49910 311.5 Oct-16 6.41 55680
Figure 2 is extracted from DWER website on “Understanding Salinity” and defines the water quality as Brine.

Koolyanobbing Range TSF Design Report
13 | P a g e
Figure 2: DWER Water Salinity categories
The base of C Pit will be filled to 338m AHD with waste rock, removing the existing pit lake. This will change the current hydrological conditions associated with the C Pit void. It will no longer be a groundwater sink, but will reinstate pre mining hydrological flows. Groundwater levels are expected to rebound to a maximum level of337m AHD.
2.4 Retaining structure properties
C Pit is an in-pit storage facility for dry stacked tailings and as such, no retaining structures are proposed. Tailings will be deposited at the base of the existing pit void. The Koolyanobbing Range is a ridge of banded ironstone rising to 513m AHD. The C Pit walls comprise of banded ironstone which have not shown signs of deterioration or slumping since completion of mining in 2017.
The pit base will be raised to 338m AHD and track rolled to create a stable platform prior to tailings deposition.
2.5 Tailings properties
The tailings material is a by-product (waste) from Lithium Hydroxide processing. The tailings are inert and non-toxic, composed of alumina-silicates, gypsum, residual salts, trace elements and oxides from spodumene ore.
Tailings material was obtained from Xinyu plant in Guron, China for materials testing. The Xinyu plant is identical to the Kemerton plant, currently under construction and the tailings obtained were from treatment of Talison Greenbushes Spodumene concentrate, the same source of ore to be processed at the Kemerton plant.
Therefore the results of tailings characterisation and testing can be considered to be representative of the tailings material proposed for the TSF.
2.5.1 Physical Characteristics
Physical & geotechnical characteristics of the tailings are provided in Table 4 and detailed in Appendices 2, 3, 4 & 5. Test work indicated that a maximum dry density of 1.50 t/m3 could be achieved following compaction.

Koolyanobbing Range TSF Design Report
14 | P a g e
In summary the tailings:
• Are very fine • Dry quickly, • Are sodic and dispersive (Emerson class 2) • Present some slaking when immersed in water.
Figure 3 shows a graph of the drying rate of lithium tailings at laboratory temperatures.
Given that the Koolyanobbing C Pit is an arid area with very high summer temperatures, it is reasonable to expect that the lithium hydroxide tailings will dry quickly increasing the potential for generation of dust.
Figure 3: Lithium Hydroxide tailings drying rate
Table 4: Tailings physical properties
Moisture Range 15 – 40 % Solids Content Range 70 – 85 % Dry density (volumetric) 1.10 – 1.50 t/m3 Specific Gravity 1.79 - 2.66 t/m3
Particle size distribution Approximately 95% passing through 150 micron sieve
Hydraulic Conductivity by Falling Head
8.2 x 10-08 to 1.1 x 10-07 m/s
Permeability by Constant Head 3.6 x 10-09 to 1.0 x 10-07 m/s Mean resistivity 16 – 18 Ω.m pH 7.7 – 7.8 Emerson Class number 2
2.5.2 Geochemical Characteristics
The tailings material proposed for this project is a by-product (waste) from a Lithium Hydroxide processing plant, currently under construction in Kemerton. The tailings are an inert, non-toxic material comprised of alumina-silicates, gypsum, residual salts, trace elements and oxides from spodumene ore.
Samples of tailings from Xinyu plant in Guron, China, were collected for materials testing. The Xinyu plant processes Talison Greenbushes Spodumene concentrate and as such is identical to the proposed Kemerton plant. The results of tailings characterisation and testing are comparable to this proposal and considered representative of the material proposed for TSF.
0%5%
10%15%20%25%
0 16 36 60
Moi
stur
e Co
nten
t
Time (hours)
Moisture Loss at 20oC - No Wind

Koolyanobbing Range TSF Design Report
15 | P a g e
A summary of the major geochemical properties has been assessed from test work undertaken by Ramboll Environment Australia in 2018 (Appendix 2) and by Albemarle in 2019. This work found leaching of metals did not occur in pH ranges >4 and <9. The tailings are alkaline with a high acid neutralising capacity (ANC). In addition, analysis of both solids and liquor from the tailings show the tailings are inert and non-toxic, comprised of alumina-silicates, gypsum, residual salts, trace elements and oxides from spodumene ore.
These results are presented in Table 5 and attached (Appendix 4). Table 5: Concentration of elements in tailings solids and liquors (ppm)
Tailings
#1 Tailings
#2 Tailings
#3 Liquor #1 Liquor #2 Liquor #3
Ag - < 0.2 < 0.2 - Al 79,780 85,190 93,142 0.172 0.162 0.096 As 27.3 27.4 27.3 < 0.2 < 0.2 < 0.01 B 9 9.1 9.1 13.1 13.1 19.9
Ba - 5 5 < 0.2 < 0.2 < 0.01 Be - 129 124 < 0.2 < 0.2 < 0.01 Bi - 3.7 3.6 - - < 0.01 Ca 70,690 74,696 79,825 675 709 432 Cd - 4 3.9 < 0.2 < 0.2 < 0.01 Ce - 1.7 1.6 < 0.2 < 0.2 < 0.01 Co - 2.3 2.4 < 0.2 < 0.2 < 0.01 Cr - 20 18.8 < 0.2 < 0.2 < 0.01 Cs - 201 196 - - < 0.01 Cu - 5.8 6.5 < 0.2 < 0.2 0.071 Fe 6594 6397 7362 < 0.2 < 0.2 < 0.05 K 3102 3188 3472 0.41 - La < 0.01 < 0.01 < 0.01 - - < 0.01 Li 2364 2515 2674 1.76 1.77 1.64
Mg 1766 1832 1950 327 346 - Mn - 451 426 0.019 0.019 0.021 Mo - < 1.0 3.8 < 0.2 < 0.2 0.01 Na 1714 1791 1931 1.28 - Nb - 33.9 28.4 - - < 0.01 Ni - 9.4 9.1 < 0.2 < 0.2 0.036 P 1052 1114 1119 0.106 0.096 -
Pb - 2.6 2.6 < 0.2 < 0.2 < 0.01 S 36,331 37,194 36,982 892 1022 -
Sb - 27.7 26.8 - - 0.025 Sc - < 1.00 < 1.00 < 0.2 < 0.2 < 0.04 Se - < 1.00 2.1 < 0.2 < 0.2 < 0.01 Si 228,083 231,052 - 7.05 7.16 - Sn - 80.7 79.8 < 0.2 < 0.2 < 0.01 Sr 89.7 100 110 4.04 4.09 3.24 Ta - 49.9 40.5 - - < 0.01 Th - 1.9 1.6 - - < 0.01 Ti - 425 428 - - 0.464 Tl - 5.5 5.7 - - < 0.01 U - 29 25 - - 0.012 V 9.22 9.25 18.5 < 0.2 < 0.2 < 0.01 W - 24 24 < 0.2 < 0.2 < 0.01 Zn 108 54.3 63.3 < 0.2 < 0.2 < 0.01
Koolyanobbing Range TSF Design Report
16 | P a g e
Leach testing (Table 6) demonstrated that tailings are slightly alkaline, due to high proportion of gypsum. The tailings also have high acid neutralising capacity of 1,500 moles H+ / Tonne (Appendix 5).
In summary, both site conditions and the tailings characteristics will not produce conditions conducive to leach metals from the tails. The risk assessment undertaken identified this as a low risk (Appendix 1).
2.5.3 Process and Return Liquor
The tailings will be received at the TSF in dry form and “dry stacked” using earth working equipment. As such, no process or return water is in the design.
2.5.4 Rheology
This proposal is for dry stacking of moist solids, rheology of the material is not applicable.

17 | P a g e
Table 6: Lithium Hydroxide tailings total and leachable metals
TOTAL & LEACHABLE CONCENTRATIONS (ASLP - NEUTRAL pH) LT101 LT102 LT103 LT104 LT105 LT106 LT107 LT108 LT109 LT110 LT111 LT112 LT113 LT114 LT115 LT116 LT117 LT118 LT119 LT120
10/10/17 10/10/17 10/10/17 10/10/17 10/10/17 10/10/17 10/10/17 10/10/17 10/10/17 10/10/17 10/10/17 10/10/17 10/10/17 10/10/17 10/10/17 10/10/17 10/10/17 10/10/17 10/10/17 10/10/17pH Final Leachate pH Units 0.01 7.3 7.7 7.6 7.4 7.4 7.4 7.6 7.6 7.7 7.8 7.7 7.8 7.8 7.5 8 7.5 7.9 8 7.8 7.9
Metals Units PQLDrinking
WaterFresh Water
Marine Water
No of Samples
Min Conc. Max ConcMean conc.
Std Dev Mean + SDNo. Above
GILmg/L 0.05 NA NA NA <0.01 <0.01 <0.01 <0.01 <0.01 <0.01 <0.01 <0.01 <0.01 <0.01 <0.01 <0.01 <0.01 <0.01 <0.01 <0.01 <0.01 <0.01 <0.01 <0.01 20 <0.01 <0.01 - - - NAmg/kg 1 52 50 46 52 49 50 52 54 53 45 46 42 50 58 51 52 48 53 49 51 20 42 58 50.15 3.48 53.63mg/L 0.05 0.002 0.0002 0.0055 <0.005 <0.005 <0.005 <0.005 <0.005 <0.005 <0.005 <0.005 <0.005 <0.005 <0.005 <0.005 <0.005 <0.005 <0.005 <0.005 <0.005 <0.005 <0.005 <0.005 20 <0.005 <0.005 - - - NDmg/kg 0.1 0.5 0.4 0.4 0.4 0.4 0.4 0.4 0.5 0.5 0.5 0.5 0.4 0.4 0.4 0.4 0.4 0.4 0.4 0.4 0.4 20 0.4 0.5 0.43 0.04 0.47mg/L 0.1 0.01 0.034 0.044 <0.01 <0.01 <0.01 <0.01 <0.01 <0.01 <0.01 <0.01 <0.01 <0.01 <0.01 <0.01 <0.01 <0.01 <0.01 <0.01 <0.01 <0.01 <0.01 <0.01 20 <0.01 <0.01 - - - NDmg/kg 0.1 1.4 1.4 1.5 1.6 1.5 1.5 1.5 1.5 1.5 1.5 1.5 1.6 1.6 1.5 1.8 2 2.1 2.2 2.5 2.8 20 1.4 2.8 1.73 0.38 2.11mg/L 0.001 NA NA NA 0.41 0.338 0.434 0.416 0.509 0.424 0.359 0.379 0.375 0.347 0.367 0.234 0.335 0.375 0.271 0.39 0.372 0.262 0.315 0.398 20 0.234 0.509 0.37 0.06 0.43 NAmg/kg 0.1 460 400 430 392 445 465 421 450 459 386 371 391 361 403 453 496 611 642 555 581 20 361 642 458.6 78.45 537.05mg/L 0.001 0.001 0.0006 0.0004 <0.001 <0.001 <0.001 <0.001 <0.001 <0.001 <0.001 <0.001 <0.001 <0.001 <0.001 <0.001 <0.001 <0.001 <0.001 <0.001 <0.001 <0.001 <0.001 <0.001 20 <0.001 <0.001 - - - NDmg/kg 0.1 <0.1 <0.1 <0.1 <0.1 <0.1 <0.1 <0.1 <0.1 <0.1 <0.1 <0.1 <0.1 0.2 0.3 1.4 0.2 4.4 1.9 3.4 2.6 20 <0.1 4.4 1.8 1.48 3.28mg/L 0.01 0.02 0.011 0.07 <0.01 <0.01 <0.01 <0.01 <0.01 <0.01 <0.01 <0.01 <0.01 <0.01 <0.01 <0.01 <0.01 <0.01 <0.01 <0.01 <0.01 <0.01 <0.01 <0.01 20 <0.01 <0.01 - - - NDmg/kg 2 6 6 6 6 5 6 6 6 7 9 11 11 8 7 7 9 8 9 12 9 20 5 12 7.7 1.95 9.65
TOTAL & LEACHABLE CONCENTRATIONS (ASLP pH 4.9) LT101 LT102 LT103 LT104 LT105 LT106 LT107 LT108 LT109 LT110 LT111 LT112 LT113 LT114 LT115 LT116 LT117 LT118 LT119 LT12010/10/17 10/10/17 10/10/17 10/10/17 10/10/17 10/10/17 10/10/17 10/10/17 10/10/17 10/10/17 10/10/17 10/10/17 10/10/17 10/10/17 10/10/17 10/10/17 10/10/17 10/10/17 10/10/17 10/10/17
pH extraction fluid pH Units 0.1 4.9 4.9 4.9 4.9 4.9 4.9 4.9 4.9 4.9 4.9 4.9 4.9 4.9 4.9 4.9 4.9 4.9 4.9 4.9 4.9pH Final Leachate pH Units 0.1 6.2 6.3 6.3 6.3 6.3 6.4 6.3 6.4 6.4 6.4 6.3 6.4 6.3 6.3 6.4 6.3 6.4 5.8 6.2 5.9
Metals Units PQLDrinking
WaterFresh Water
Marine Water
No of Samples
Min Conc. Max ConcMean conc.
Std Dev Mean+ SDNo. Above
GILmg/L 0.05 NA NA NA <0.05 <0.05 <0.05 <0.05 <0.05 <0.05 <0.05 <0.05 <0.05 <0.05 <0.05 <0.05 <0.05 <0.05 <0.05 <0.05 <0.05 <0.05 <0.05 <0.05 20 <0.05 <0.05 - - - NAmg/kg 1 52 50 46 52 49 50 52 54 53 45 46 42 50 58 51 52 48 53 49 51 20 42 58 50.15 3.48 53.63mg/L 0.05 0.002 0.0002 0.0055 <0.05 <0.05 <0.05 <0.05 <0.05 <0.05 <0.05 <0.05 <0.05 <0.05 <0.05 <0.05 <0.05 <0.05 <0.05 <0.05 <0.05 <0.05 <0.05 <0.05 20 <0.05 <0.05 - - - NDmg/kg 0.1 0.5 0.4 0.4 0.4 0.4 0.4 0.4 0.5 0.5 0.5 0.5 0.4 0.4 0.4 0.4 0.4 0.4 0.4 0.4 0.4 20 0.4 0.5 0.43 0.04 0.47mg/L 0.1 0.01 0.034 0.044 <0.1 <0.1 <0.1 <0.1 <0.1 <0.1 <0.1 <0.1 <0.1 <0.1 <0.1 <0.1 <0.1 <0.1 <0.1 <0.1 <0.1 <0.1 <0.1 <0.1 20 <0.1 <0.1 - - - NDmg/kg 0.1 1.4 1.4 1.5 1.6 1.5 1.5 1.5 1.5 1.5 1.5 1.5 1.6 1.6 1.5 1.8 2 2.1 2.2 2.5 2.8 20 1.4 2.8 1.73 0.38 2.11mg/L 0.001 NA NA NA 2.03 1.76 1.93 1.9 2.83 2.94 2.72 2.33 3.08 2.58 2.24 1.83 3.23 2.4 2.92 2.82 3.84 4.21 3.38 4.12 20 1.76 4.21 2.75 0.72 3.47 NAmg/kg 0.1 460 400 430 392 445 465 421 450 459 386 371 391 361 403 453 496 611 642 555 581 20 361 642 458.6 78.45 537.05mg/L 0.001 0.001 0.0006 0.0004 <0.001 <0.001 <0.001 <0.001 <0.001 <0.001 <0.001 <0.001 <0.001 <0.001 <0.001 <0.001 <0.001 <0.001 <0.001 <0.001 <0.001 <0.001 <0.001 <0.001 20 <0.001 <0.001 - - - NDmg/kg 0.1 <0.1 <0.1 <0.1 <0.1 <0.1 <0.1 <0.1 <0.1 <0.1 <0.1 <0.1 <0.1 0.2 0.3 1.4 0.2 4.4 1.9 3.4 2.6 20 <0.1 4.4 1.8 1.48 3.28mg/L 0.1 0.02 0.011 0.07 <0.1 <0.1 <0.1 <0.1 <0.1 <0.1 <0.1 <0.1 <0.1 <0.1 <0.1 <0.1 <0.1 <0.1 <0.1 <0.1 <0.1 <0.1 <0.1 <0.1 20 <0.1 <0.1 - - - NDmg/kg 2 6 6 6 6 5 6 6 6 7 9 11 11 8 7 7 9 8 9 12 9 20 5 12 7.7 1.95 9.65
Groundwater Investigation Levels (GILs)
Groundwater Investigation Levels (GILs)
Nickel
Berylium
Cadmium
Lead
Lithium
Mercury
Nickel
Berylium
Cadmium
Lead
Lithium
Mercury

18 | P a g e
3. TSF Design 3.1 Introduction The Code of Practice for Tailings storage facilities in Western Australia (Sept, 2013) was referenced in progressing the TSF design. The proposed In-pit TSF is classified as a Category 3 facility, based on the level of hazard associated with the project, including:
• Location (In Pit) • Physical properties of the tails (Dry Stacked) • Limited impact on local environmental values and • Tailings characteristics.
The C Pit design complies with Category 3 Facility reporting requirements: Table 7: Category 3 Facility Reporting
Category 3 Requirement MRL Compliance / Proposed Reporting
Design (including site investigation)
Report prepared by competent person TSF Design completed by MRL Principal Geotechnical Engineer, refer to Section 6 Certificate of Compliance
Construction Constructed by a competent person. As built drawings provided
• C Pit preparation and access ramp modifications will be completed utilising site based mining personnel supervised by a MRL / YIPL Mining Engineer.
• Geochemical testing of rock for PAF will be undertaken
Operations Inspection and audit every 3 years by competent person. A risk assessment must be undertaken to determine frequency of audits.
A competent Geotechnical Engineer will inspect the TSF annually and report will be submitted to DMIRS during operations
Pre-closure Inspection report by competent person confirming current status and intended decommissioning, rehabilitation and monitoring strategies with as-built drawings
A competent MRL Geotechnical Engineer will complete a Pre-closure inspection report with rehabilitation & monitoring strategies and as-built drawings
Relinquishment Final report by competent person confirming closure objectives have been achieved
A competent MRL Geotechnical Engineer will complete a final report to confirm achievement of closure objectives

Koolyanobbing Range TSF Design Report
19 | P a g e
3.2 Modelling and design studies
The Following sections relied on geotechnical testing results of tailings obtained from Xinyu plant in Guron, China in October 2017, Appendix 3. The Xinyu plant is identical to the Kemerton Lithium Hydroxide Plant and the tailings obtained were from treatment of Talison Greenbushes Spodumene, the same source ore.
3.2.1 Stability Assessment
General The stability analysis of the C Pit design was undertaken for static and post seismic loading conditions using the limit equilibrium theorem. Slope stability analyses were conducted using Geostudio Slope/W software. Limit equilibrium computer models were developed adopting the Morgenstern-Price method of slices for all analyses. Criteria The stability analysis results were compared to minimum factors of safety described in the ANCOLD Guidelines on Tailings Dams (2012), which are to be considered conservative as in this case the TSF is fully contained and hence there is no embankment. Table 8: Recommended factors of safety (ANCOLD, 2012)
Loading condition (Note 1) Recommended minimum for tailings dams
Shear strength to be used for evaluation
Long term drained 1.5 Effective strength
Short term undrained (potential loss of containment)
1.5 Undrained strength
Short term undrained (no potential loss of containment)
1.3 Undrained strength
Post-seismic 1.0-1.2 (Note 1) Post seismic shear strength (Note 2)
Note 1. To be related to the confidence in selection of residual shear strength. 1.0 may be adequate for use with lower bound results. Note 2. Cyclically reduced undrained/drained shear strength and/or liquefaction residual shear strength for potentially liquefiable materials.
Phreatic surface No phreatic surface was modelled for the stability analysis as tailings are above water table. However increased pore pressure within materials was modelled through pore pressure coefficient Ru in the stackings. Material Parameters Material properties adopted for the stability analysis are shown in Table 9. The material parameters are based on the available geotechnical data for the capping, tailings and foundation.
Table 9: Tailings Material Properties
Material Unit weight (kN/m3) Angle of friction, ∅ (°) Foundation 21 32 Tailings 15 26 Capping 21 32

Koolyanobbing Range TSF Design Report
20 | P a g e
These material parameters were reduced by 20% due to strain softening for post seismic stability analysis (USCE, 1984). The Operating Basis Earthquake (OBE) and Maximum Design Earthquake (MDE) (now called the Safety Evaluation Earthquake (SEE)) loading was determined using ANCOLD Guidelines (2012) for a significant consequence category facility.
A summary of the design seismic parameters is shown in Table 10.
Stability analysis conducted on the open face for the considered configuration of the stackings (18 degrees compacted every 500mm) showed that the factors of safety (with/without capping and including seismic condition) were above 1.57 and as such considered very stable (Table 11).
Table 10: Summary of seismic design parameters
Return Period PGA(g) Magnitude for design event
1000 year (OBE) 0.07 5.3
Table 11: Summary of Factors of Safety Analysis table
Load case Calculated Factor of Safety
Minimum required Factor of Safety
Acceptable?
Construction without cap 1.90 1.3 Yes
Construction without cap global
2.89 1.3 Yes
Construction without cap local
1.80 1.3 Yes
Final with cap global 2.71 1.5 Yes
Final with cap local 1.57 1.5 Yes
Final with cap seismic 1.32 1.0-1.2 Yes
The remaining tailings will be fully enclosed within the pit walls, as such the repository is inherently stable and eventual mobilisation of the tailings is impossible. In this context stability analysis for the tailings profile does not apply.
3.2.2 Design acceptance criteria
The proposal is for an in-pit TSF, so the worst case failure scenario is wall failure / slumping causing personnel injury and / or contact of PAF with tailings. YIPL / MRL has operating procedures in place for mining personnel working in pits and near walls, which mitigate the risk. The TSF Project Risk Assessment (Appendix 1) identifies this risk and has actions to address this even though the risk is Low and acceptable.
3.2.3 Erosion control
Erosion by wind, causing dust issues has been identified as a risk based on the physical properties of the materials. The main receptor will be personnel working in the pit with less of an issue on the local environment due to the location of the tailings (in-pit). YIPL will implement its Dust Management Plan, along with capping of the potential erosion surfaces to minimise erosion and dust generation.

Koolyanobbing Range TSF Design Report
21 | P a g e
3.2.4 Seepage
Seepage is not a significant issue for the TSF design as the tails will be dry stacked and once compacted are expected to be low permeability restricting the movement of moisture through the tails.
In Stage 1 of the TSF design, approximately 460,000m3 of tailings will be deposited into C Pit until 364m AHD. Deposition will be such that any liquor or surface water will be diverted away from the tails deposition to the pit walls for infiltration to occur.
Above 364m AHD tailings will be dry stacked on a stable surface and each lift will be shaped to direct any tailings liquor or rainfall (via sheet flows) away from the tailings profile to an infiltration basin at 364m AHD. The infiltration basin has a design capacity of 3.6ML - refer to infiltration basin design in section 3.4 and Figure 9.
A risk assessment on this method of control determined no impacts on groundwater quality or on sensitive receptors. Appendix 1.
Table 4 describes the chemical composition of the liquor, which is better quality than the local groundwater.
Groundwater quality beneath the C Pit is hypersaline. The volume of seepage will be limited due to the tailings water content (approximately 24%) and arid conditions in the receiving environment leading to high rates of evaporation.
3.2.5 Surface water flow and storage
For the purpose of assessing flood potential and drainage design, the 100-year Annual Recurrence Interval (ARI) peak rainfall event (72 hour duration) equates to 2.5 mm/hr (180mm, Astron 2019).
The C Pit will have a maximum rainfall catchment area of 250,000 m2 (25ha) which at 100 year ARI peak rainfall event will collect approximately 45ML (45,000m3) of water. This represents about 1.4% of the C Pit capacity available after tailings deposition (3,300,000 m3).
The volume of the infiltration basin has not been designed for a 1:100 year event given the location of the TSF is in-pit. The pit void volume is sufficient to act as an overflow basin under these conditions. No water from an extreme rainfall event will discharge to surrounding surface water catchments.
As identified in the Risk Assessment, such a large amount of water will only impact the tails stacking operations and will be subsequently repaired as required.
The TSF design conceptually meets the ARI for rainfall.
3.2.6 Water balance
A water balance is not required because the In-pit TSF design is for dry stacking of moist tailings and not for slurry with water return. The tailings surface will be slightly graded (or shaped) so any surface water will be directed, via sheet flow, to an infiltration basin for discharge to groundwater or evaporate.
3.2.7 Settlement
The placement of tails will be compacted between each 500mm lift. Geotechnical data indicates a compaction rate of 1.5 tonnes/m3 can be achieved, which will provide a stable mass with low permeability within the tails (10-7 to 10-9 m/s) prior to capping and closure.
The Risk Assessment on the TSF has considered differential consolidation of tailings as a potential post closure risk. This may causing ponding on the capping surface and water saturation of the tailings. The likelihood of this occurring will be reduced through compaction of tails in 500mm lifts and the shaping of the final surface of the tails to encourage water flow away from the tailings which will be capped with a 1m capping layer of NAF waste rock.

Koolyanobbing Range TSF Design Report
22 | P a g e
Any settlement will not have an impact on the structure as it is contained within a pit with no infrastructure associated with the TSF.
3.3 Design and construction details
The basis of design relies on the outcome of test work undertaken by Albemarle to characterise the physical and geo-chemical properties of the tailings (Appendices 2 to 6), plus the specific environmental setting.
3.3.1 Stage 1 Design
Final standing ground water levels are assumed to return to those measured pre mining, at 337m AHD. As such, the 338RL has been selected as the tailings deposition level as it is 1m above predicted GWL. C Pit existing backfill is to be pushed by dozers to an angle of 18 degrees to fill the lowest pit section to 338m AHD.
The new pit floor at 338m AHD level will have been track rolled during the construction process, to provide a stable platform for tailings deposition.
Figure 4: Preparation of C Pit to 338m AHD prior to Tailings Deposition
Tailings will then be deposited along the edge of the pit by side tipping trucks. Dozers will push the tailings material down to the pit base at 338m AHD and continue to fill the pit until 364m AHD level is reached. An estimated total of 460kBCM of tailings is required to fill the C Pit to 364m AHD.
338m AHD

Koolyanobbing Range TSF Design Report
23 | P a g e
Figure 5: Stage 1 Tailings Deposition to 364m AHD
3.3.2 Stage 2 Design A 2m foundation layer of inert waste material, tested to be NAF (from existing C Pit backfill or waste dumps) will then be placed to form a stable base for further tailings deposition.
Tailings material will be pushed by dozers and stacked in 500mm layers to allow for compaction by dozer track rolling. The tailings will be stacked with an outer slope of 18 degrees, which is much flatter than the natural angle of repose of the waste rock (26 degrees) to allow for later capping.
There will be three separate benches in stage 2 – at 370m, 376m and 382m AHD. The outer slopes of the tailings (batters) will be capped when 370m and 376m AHD levels are reached. At 382m AHD the tailings deposition will be complete and the entire tailings surface will be capped with 1m of NAF waste rock to prevent erosion and dusting.
If needed, to allow for trafficability during wet weather, the tipping floor may be sheeted with coarse competent waste material to ensure a stable floor is maintained for equipment movements.
364m AHD

Koolyanobbing Range TSF Design Report
24 | P a g e
Figure 6: Tailings Deposition to 370m AHD
370m AHD
376m AHD
364mRL
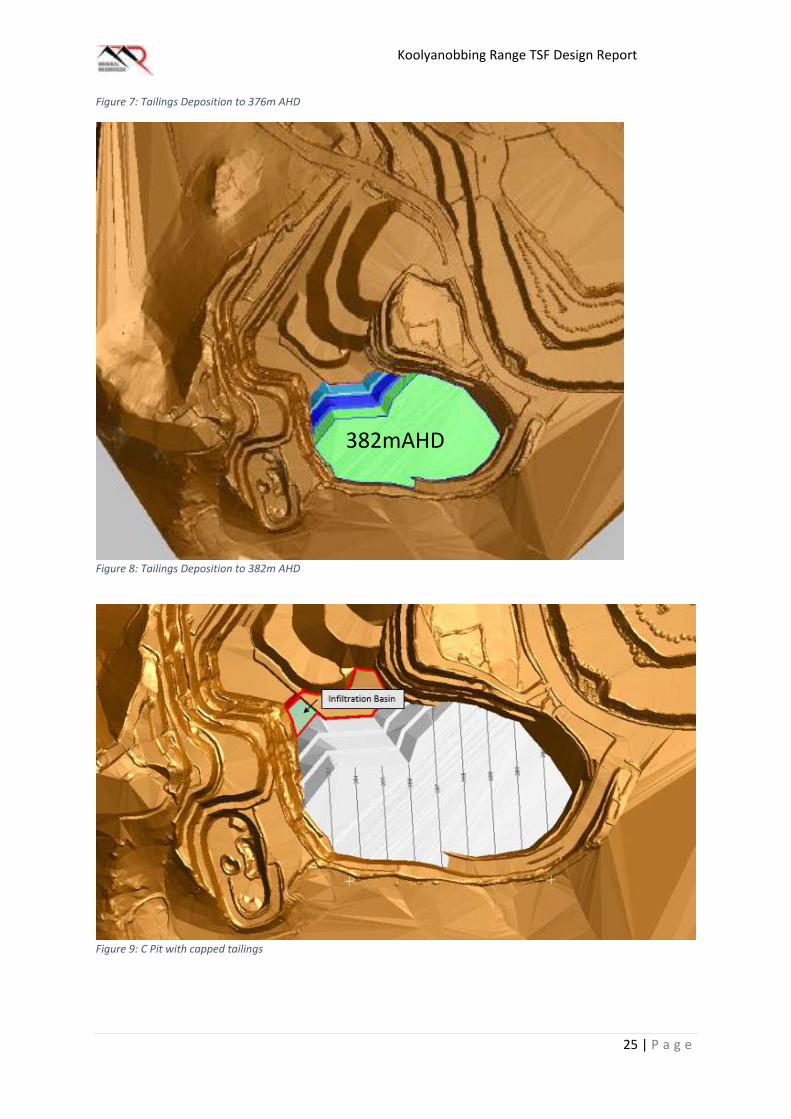
Koolyanobbing Range TSF Design Report
25 | P a g e
Figure 7: Tailings Deposition to 376m AHD
Figure 8: Tailings Deposition to 382m AHD
Figure 9: C Pit with capped tailings
382mAHD

Koolyanobbing Range TSF Design Report
26 | P a g e
Figure 10: Cross section of C Pit after capping
Summary of TSF preparation and tailings deposition methodology:
• Waste rock will be pushed into the pit from 364m AHD (current backfill surface) until 338m AHD is achieved in the base of the pit;
• Approximately 460k BCM of tailings will be side tipped near the edge of the basin and pushed in by dozer to 364m AHD;
• Then a 2m thick layer of capping will be placed and compacted, forming a foundation layer for further deposition above 366m AHD;
• An infiltration basin infiltration basin will be constructed at 364m AHD by placing a windrow (3.5m high, base width 9.0m wide) of waste rock at the base of the new surface;
• Tailings will be deposited in 500mm layers and compacted (track rolled) until tailings deposition is completed at 382m AHD;
• 1m thick capping of outer edges of the tailings will be undertaken upon completion of the final lift for each 6m bench;
• At 382m AHD the entire tailings mound will be capped with 1m layer of waste rock;
• The top surface of the tails will be graded to a slope of less than 5 degrees; all outer batter slopes will be less than 18 degrees to prevent erosion.
• The final capping will be compacted and will be at approximately 383m AHD.
3.3.3 Construction and Emissions
TSF construction activities include pit base preparation and modification of access ramps. YIPL intend to use its fleet of mining equipment and personnel to complete these activities. Dust
Site preparation and construction of the tailings cell and infiltration basin embankments has the potential to generate dust emissions from the following sources:
• Mobile equipment movement;
• Excavating, placing and compacting tails; and

Koolyanobbing Range TSF Design Report
27 | P a g e
Extreme weather events such as high wind speed during dry conditions can result in more significant dust emissions. Although we expect these will be contained to within the pit void.
Particulate emissions will be minimised during construction through:
• Use of water trucks and/or water sprays to control emissions when visible dust is being generated and/or visible dust is reported by site personnel;
• Reducing activities which cause visible dust emissions during periods of high winds if dust cannot be controlled through water sprays; and
• Use of defined haul routes for mobile equipment travelling on unsealed surfaces or unformed roads.
Through implementation of these control measures, dust emissions are expected to be temporary, localised and have minimal impact. Any complaints relating to dust emissions will be recorded and investigated. It is unlikely that dust emissions from the site preparation and infiltration pond embankment construction would impact outside of C-Pit boundary.
Similarly dust emissions resulting from construction works are considered unlikely to impact the vegetation within the surrounding area due to the relatively small scale of the works, the dust suppression which will be implemented and the distance between the works and the conservation area.
Air emissions
Gaseous emissions during the construction of the Project will be limited to combustion emissions from mobile equipment. Due to the small fleet required for the Project construction, combustion emissions from mobile equipment are expected to have negligible impact on the local air quality and will not impact sensitive receptors. Mobile equipment will be operated and maintained in accordance with manufacturer’s specifications to ensure gaseous emissions are minimised.
Noise emissions
Mobile equipment undertaking construction of the Project will be the primary source of noise during the construction period. C-Pit is part of an ongoing mining operation, additional noise from mobile equipment associated with the tailings deposition would be minimal. There are no nearby sensitive receptors for noise.
Standard noise minimisation practices will be employed during the construction period:
• Operation and maintenance of mobile equipment in line with the manufacturer’s specifications;
• Regular inspections of vehicles to ensure they are in good working order;
• All complaints relating to noise will be recorded and investigated; and
• Majority of the work will be carried out at depth in the pit void, reducing surface noise levels.
Only a small fleet of equipment is required for the construction with no noticeable increase in noise emissions expected from the In-pit TSF.
The transport of tailings, peaking at approximately 500,000 t/yr from Kemerton may result in additional noise and vehicle emissions along the truck routes, however the In-pit TSF Project will not change noise impact in the Project area.
Light emissions
The TSF project is in-pit and therefore light spillage outside the pit is not significant. Minimal lighting will be provided at night for safety and security purposes but this is not likely to be detected by nearby receptors.

Koolyanobbing Range TSF Design Report
28 | P a g e
Emissions to land
There are no emissions to land from this project. There is no surface land disturbance associated with activities at C Pit.
Emissions to water
Emissions to surface water are not expected to occur as a result of construction of the TSF Project. The nearest watercourse is approximately 1 km south of the C Pit and as the tailings are fully enclosed within the pit, rainfall run-off will also stay within the pit and not enter the watercourse.
3.4 Tailings discharge and water management
Tailings deposition is by dry stacking and water management is not required. Below 364m AHD, any liquor will seep through the base of C Pit into groundwater. Above 364AHD, all water (liquor and rainwater) will be diverted to an infiltration basin at the base of the storage.
The infiltration basin will have 3.5m high walls and will be capable of containing 3600m3 (3.6ML) of rainfall and tailings liquor, refer to Figure 11 below. The infiltration basin will not be lined.
The infiltration basin is located within the pit adjacent the tailings deposition, which ensures that all water infiltration into ground will bypass the underlying tailings, Figure 11.
Figure 11: Infiltration basin for rainwater runoff & tailings liquor drainage
3.5 Covers and liners The In-pit TSF proposal does not include any lining of the pit base. On completion of tailings deposition, a 1m cap of NAF waste rock cover is proposed. The C Pit infiltration basin will not be lined.
3.6 Quality Assurance
To ensure that C Pit is constructed as designed and approved, Survey measurements will be undertaken to ensure design elevations are correct. As there are no civil construction requirements, no further quality assurance measures are required.
3.7 Spillways
This is an in-pit, dry stacked, TSF proposal. A spillway is not required.

Koolyanobbing Range TSF Design Report
29 | P a g e
4. Operational Requirements 4.1 Management of tailings deposition and water
Tailings deposition is by dry stacking and does not include tailings slurry discharge with water return. Below 364m AHD, any liquor, which may be released from the tailings deposition and compaction, or rainwater, will be diverted to higher permeable zones of pit walls and pit floor.
Above 364m AHD, any liquor or rainwater will be diverted to an infiltration basin at the base of the storage to allow for evaporation, or seepage. Refer to Figure 10 for infiltration basin details.
If there is any excess water in the infiltration basin it may be used for dust suppression within the C Pit only.
The available capacity of the C Pit is 4.3M m3 and this proposal is for 1M m3 of tailings. As such, freeboard capacity is not of concern.
4.2 Seepage management
This proposal is for a Dry Stacked TSF hence seepage management is not applicable as would be for traditional paddock style TSF containing process slurries.
4.3 Erosion control
The lithium hydroxide tailings are very fine and tend to dry out quickly. They also have loose cohesion, are erodible and tend to disperse during rainfall. To limit the area of exposed tailings, capping will be applied to the outer profile of the stacked tailings at the 370m and 376m AHD benches and during prolonged periods without tailings deposition. This should protect faces from wind erosion or diffuse run-off erosion. Compaction of the tails during deposition will also assist in reducing potential for erosion.
4.4 Performance monitoring and instrumentation
A summary of C Pit performance monitoring is presented in Table 12.

30 | P a g e
Table 12: Summary of TSF Performance Monitoring
Stage Performance Monitoring Performance Targets Monitoring Frequency Construction C Pit Survey measurement of pit base elevation
and 364m AHD floor thickness Level at or above 338m AHD, 364m AHD floor thickness of 2m
Once off after pit floor preparation works
Geochemical testing of C Pit floor surface 100% NAF Once off prior to tailings deposition Geochemical testing of competent waste rock to be used for wet weather sheeting & capping of outer surfaces of tailings pile
100% NAF As required
Visual assessment of pit wall stability, Stable pit walls
Daily observations and by exception reporting.
Dust is not visable outside the pit Minimal dust generation from tailings handling
Daily observations and by exception reporting.
Audit of TSF performance Safe & stable TSF Annually Closure Pre-closure inspection report Tailings deposition completed
and ready for capping. Slope angles constructed to design and graded to infiltration basin
Once off, on completion of tailings deposition
Geochemical testing of competent waste rock to be used for capping of tailings
100% NAF As required
Survey measurement of capped tailings surface No surface depressions, slope less than 5o
On completion of capping and Annually thereafter
Relinquishment Final closure report Closure objectives met Once off

31 | P a g e
5. Closure Considerations 5.1 Overview
The C Pit is located on unallocated crown land, with no foreseeable other land uses post mining.
TSF closure objectives are to create a safe, stable, non-polluting landform.
On completion of tailings deposition, the tailings will be capped with 1m of non-acid generating waste rock. The tailings cap surface will be compacted to minimise erosion. The C Pit will be retained as an open void.
A risk assessment was undertaken for the TSF project and shows there are limited environmental risks associated with closure. The key findings are summarised below:
• The main Receptors identified that have plausible pathways are mine personnel working in the vicinity of tailings deposition within the C Pit and terrestrial biota close to the pit. Implementation of YIPL Dust Management Plan and standard mining practices will address the safety issues associated with exposure to the tailing dust.
• Tailings are benign and have a low potential to generate metal contaminated leachates following rainfall events. The permeability of the tails are low following deposition. The underlying groundwater is of poor quality, being highly saline, and there are no down gradient environmental receptors.
• The final structure is consistent with the current mine closure plan, which considers the partial backfilling of C Pit with waste rock. The only change will be the final elevation of the pit floor.
5.2 Decommissioning
This proposal is for dry stacking of moist tailings and does not require decommissioning and removal of any infrastructure. The drainage infiltration basin will be left in place.
5.3 Rehabilitation
The rehabilitation of C Pit will be consistent with the current Mine Closure Objectives and Design Criteria for the pits, as per Table 13 below. After capping, the C Pit will be left as an open void, i.e. no topsoil spreading will be undertaken within the pit.
Abandonment bunds will be constructed around the pit to prevent access. This is consistent with standard closure requirements around mining voids.
5.4 Performance monitoring against closure criteria
Table 13 shows performance monitoring against closure criteria, as presented in the mining proposal section 8.

32 | P a g e
Table 13: C Pit Closure Objectives, Completion Criteria and Monitoring Program
Aspect Objective Completion criteria Monitoring procedure Monitoring frequency Performance Measurement / Outcome
Infrastructure Removal
All infrastructure that is not subject to relinquishment agreements is removed and appropriately disposed of
No additional or fixed infrastructure is associated with the C Pit TSF Project. Access tracks and Hauls ramps will be removed as per the existing MCP
Post-closure site inspection for housekeeping within C Pit
Once-off upon completion of tailings deposition
Inspection report with photographic evidence showing no remaining infrastructure within the pit
Mine Waste Management
Waste materials with potential for environmental impact are appropriately managed
Lithium Hydroxide tailings are: • Placed above 338m AHD • Completed tails are capped with 1m of
competent waste rock as per design
• Survey of C Pit base elevation prior to tailings deposition, after tailings deposition, and after capping
Prior to deposition of tails and at Closure • Survey measurements confirming pit base 338m AHD, Foundation level at 364m AHD, final tailings surface elevation; cap layer elevation, and cap layer slope
Landform / Geotechnical stability
Verify that final landforms have been constructed to approved designs.
• Pit base at 338m AHD; • Pit base is stable and free draining; • Tailings compacted during deposition; • Infiltration basin installed at 364m AHD • The surface of the stacked tails will be
graded to allow water to be shed via sheet flow to a infiltration basin
• Tailings capped with a 1m thick NAF waste rock to reduce erosion of the stored tails.
• Survey of C Pit base elevation prior to tailings deposition, after tailings deposition, and after capping
• Geochemical testing of pit base surface for presence of PAF
• Photographic evidence of dozer track rolling of tailings
• Audit report with evidence of infiltration basin installation
• Prior to deposition and Post Closure • Prior to operation • During operation • Annual audit during operation
• Survey measurements confirming pit base 338m AHD, Foundation level at 364m AHD, final tailings surface elevation; cap layer elevation, and cap layer slope
• Test reports for waste rock used in the TSF showing it is NAF
• Inspection / Audit reports detailing evidence of installed sump and of track rolling of tailings
Rehabilitation - erosion
Verify that surface and outer slopes of landform conform to approved designs.
• Cap layer is compacted with a slope angle of 18 degrees, which will be within typical geometry for erosion protections of waste rock landforms.
• Survey of C Pit surface after capping. Once-off upon completion of tailings deposition and capping
As constructed Survey of cap layer and batter slopes
Verify that erosion gullies do not form and expose the underlying tails.
Erosion does not threaten the integrity of the capping layer
• Settlement survey at allocated locations across the TSF
• Visual inspection of the cap, batter walls and infiltration sump
• Settlement Surveys annually for three years post closure
• After any significant rainfall (>30mm in 24hrs) within three years post closure
• Survey data demonstrating differential settlement is not occurring
• Inspection logs
Surface water Verify that natural drainage lines have been re-instated and impoundment of surface water does not occur.
The C TSF Project is within a pit and will not affect surface water flows. However monitoring is required of the cap surface to ensure that there is no subsidence creating ponding of surface water.
Site inspection to assess if there is subsidence in the pit
Annually for three years and at relinquishment
C Pit inspection reports post TSF closure with photographic evidence showing that C Pit cap layer has no visible subsidence.
Groundwater Verify that pit groundwater not adversely affecting surrounding groundwater quality.
The C Pit groundwater is hypersaline (brine) and the Project Risk Assessment shows that the tailings will not have any adverse impact
Not required Not applicable Not applicable
Site access Verify that: • site access is removed except
where agreed otherwise • retained roads are handed
over in agreed condition.
• Site access to be agreed with post-mining land owners (DBCA) and documented in Post-Mining Site Access Plan.
• At relinquishment, access roads identified for retention are handed over to post-mining land owners in agreed condition
• Access roads are rehabilitated unless agreed otherwise and responsibility transferred to a third-party
Site inspection and review of Post-Mining Site Access Plan and signed agreements to assess whether:
• all site access removed as required • retained roads are in agreed condition
Findings from site inspection will be documented in a report to be submitted to the relevant regulatory authorities.
Once-off prior to relinquishment. MCP has a summary of end land use agreements with relevant stakeholders and includes stakeholder statements of acceptance of access road conditions. Rehabilitation inspection report with photographic evidence
Verify that access to open pits is restricted.
• Access to C Pit is restricted by an abandonment bunds built to regulatory standards ie 2m high and 5m wide at base
• Abandonment bund not located within pit zone of instability
Survey of location, size and construction material of abandonment bunds overlain with zone of open pit instability. Findings from survey will be documented in a report to be submitted to the relevant regulatory authorities.
Once off at completion of abandonment bunds.
C Pit abandonment bund is in place, outside zone of instability and built to regulatory standards (5m wide and 2m high).

Koolyanobbing Range TSF Design Report
33 | P a g e

34 | P a g e
6. Certification of Compliance
Tailings storage facility design report
For and on behalf of Yilgarn Iron Pty Ltd, I ..........................................................................................
being a duly authorised officer of the above company and a qualified geotechnical engineer holding professional registration by a professional body, do hereby certify and confirm that the C In-pit tailings storage facility at the Koolyanobbing mine site has been designed in accordance with the current edition of the Tailings storage facilities in Western Australia – code of practice issued by the Department of Mines and Petroleum, Western Australia and the design is referenced as Koolyanobbing Range TSF Design Report
Dated .............................................................................................................................
Signature of above person: .....................................................................................................
Signature of witness: ...............................................................................................................
Name of witness: .....................................................................................................................
Date: ..........................................................................................................................................

Koolyanobbing Range TSF Design Report
35 | P a g e
7. References
Astron, 2019. Yilgarn Mine Closure Plan prepared for Polaris Metals Pty Ltd. May 2019.
Australian National Committee on Large Dams. Guidelines on Tailings Dams. Planning, Design, Construction, Operation and Closure. 2012.
Cliffs Asia Pacific Iron Ore Pty Ltd. 2009b. Koolyanobbing C Pit Expansion Project - Addendum to Mining Proposal 2805 Tenement M77/607. Report prepared by Cliffs Asia Pty Ltd, Perth, Western Australia.
Cliffs Asia Pacific Iron Ore Pty Ltd. 2015b. Yilgarn Operations Koolyanobbing Range C Deposit Backfilling Mining Proposal, Addendum to Mining Proposals 21823 and 32064, Tenement M77/607-I. Report prepared by Hawkins S of globe environments Australia Pty Ltd for Cliffs Asia Pacific Iron Ore Pty Ltd. Revision B. September 2015.
Department of Mines and Petroleum. Code of Practice. Tailings storage facilities in Western Australia
Department of Mines and Petroleum 2006. Guidelines for Mining Proposals in Western Australia. February 2006.
Department of Mines and Petroleum 2015. Guide to the preparation of a design report for tailings storage facilities (TSFs). August 2015.
Ramboll, 2018. Albemarle Australia Lithium Tailings Leaf Testing summary report. April 2018
Ramboll, 2019. Albemarle Lithium Processing Project Tailings Storage Facility MCA. August 2019
Xstract, 2018. Lithium Tailings characterisation, Dry Stacked Tailings – Laboratory Test Results. April 2018

Koolyanobbing Range C In-pit TSF Design Report
APPENDIX 1 – C In-pit TSF Project Risk Assessment
Koolyanobbing Range C In-pit TSF Risk Assessment Report
Page | 1
Yilgarn Operations C In-pit TSF Project Risk Assessment Report
Introduction
MRL propose a short-term (2020-2024) Tailings Storage Facility (TSF) to dispose of tailings from Kemerton in the Yilgarn Iron Pty Ltd (YIPL) Koolyanobbing Range C deposit (C Pit), “the Project”. This facility will be utilised while a longer term tailings disposal solution is developed.
Albemarle Lithium Pty Ltd are the proponents for the Kemerton Lithium Hydroxide Plant (the Plant) is located 137km south of Perth and is currently under construction with an expected commissioning in the first quarter, 2021. Once in operation, the Kemerton Plant will process spodumene concentrate delivered from Talison Lithium Pty Ltd’s Greenbushes Mine (Greenbushes). The Plant will produce a Lithium Hydroxide and generate about 100,000 tonnes of residue (or tails) per annum.
A local disposal facility for the Plant tailings has not been finalised.
Lithium tailings are the residue produced from secondary processing of spodumene concentrate (approximately 6% Li2O), through pyro metallurgical and hydrometallurgical processes, to produce lithium hydroxide monohydrate. Lithium hydroxide monohydrate is used in the manufacture of rechargeable lithium ion batteries, industrial lubricants and dyes. Lithium processing tailings are an inert, non-toxic material comprised of alumina-silicates, approximately 15% gypsum, residual salts, trace elements and oxides from spodumene ore, and approximately 24% water.
C Pit has been sterilised and partially backfilled with waste rock from nearby Koolyanobbing Range E Deposit (E pit). The C Pit has capacity of approximately 4 million cubic metres to 30m below crest. Tailings will be deposited on top of “NAF” waste rock materials above 338m AHD. The base of the facility will be 1m higher than pre-mining groundwater levels.
On completion of the tailings deposition into C Pit, the material will be capped as soon as practicable. The capping layer will be designed to facilitate water shedding, preventing surface ponding and percolation through the tails and reducing erosion. This is important to prevent any oversaturation of the tails and possible slumping or dissolution of minerals and achieving a long-term stable landform.
This Risk Assessment addresses the risks identified for the Project and will assess the following considerations:
• The C Pit receiving environment • The tailing material’s chemical and physical characteristics • Handling and storage • Exposure pathways and environmental receptors • Mitigation and Residual Risk
The risk analysis can be found in Table 6 of this document.
TSF Design & Deposition Methodology
Side Tipping Road Trains will be used to transport tailings material from the Kemerton Lithium Hydroxide Plant to the C Pit. The trucks will tip the tailings within the pit and dozers will then push the tailings into place.
Following is a summary of the TSF preparation and tailings deposition methodology:
• Waste rock will be pushed into the pit from existing bench at 364m AHD until a base level of 338m AHD is achieved
• The base will track rolled; • Approximately 460k BCM of tailings will be side tipped on the bench at 364m AHD and pushed in by
dozer to complete the filling of the void to 364m AHD. • A 2m thick layer of waste rock will be placed and track rolled, creating a new base for tails deposition

Koolyanobbing Range C In-pit TSF Risk Assessment Report
Page | 2
• An infiltration basin will be constructed at 364m AHD by placing a windrow (3.5m high, base width 9.0m wide) of waste rock at the base of the new surface.
• Tailings will then be deposited in 500mm layers and compacted (track rolled) until tailings deposition is completed at 382m AHD
• Batter slopes of the deposited tails will not exceed 18 degrees. • At 382m AHD the entire tailings mound will be capped with 1m layer of waste rock and slightly sloped
to be water shedding • The new capped surface will be compacted, and will be at approximately 383m AHD.
FIGURE 1: CURRENT PLAN VIEW AND PROFILE OF C PIT BEFORE TAILINGS DEPOSITION

Koolyanobbing Range C In-pit TSF Risk Assessment Report
Page | 3
FIGURE 2: CROSS SECTION OF C PIT ON COMPLETION OF TAILINGS DEPOSITION
Risk Assessment Criteria
The Risks of the C In-pit TSF Project were assessed using the MRL / YIPL Likelihood & Consequence Criteria and Scales in Table 1 and Table 2 below. Risks that high or critical are reassessed after appropriate mitigations are proposed reduce the risk consequence as low as reasonably practicable (ALARP).
TABLE 1: LIKELIHOOD CRITERIA FOR CLASSIFYING THE PROBABILITY OF AN INCIDENT OCCURRING AND RESULTING IN DEFINED CONSEQUENCE, AND RESULTING RISK RANKING

Koolyanobbing Range C In-pit TSF Risk Assessment Report
Page | 4
Table 2: Consequence criteria
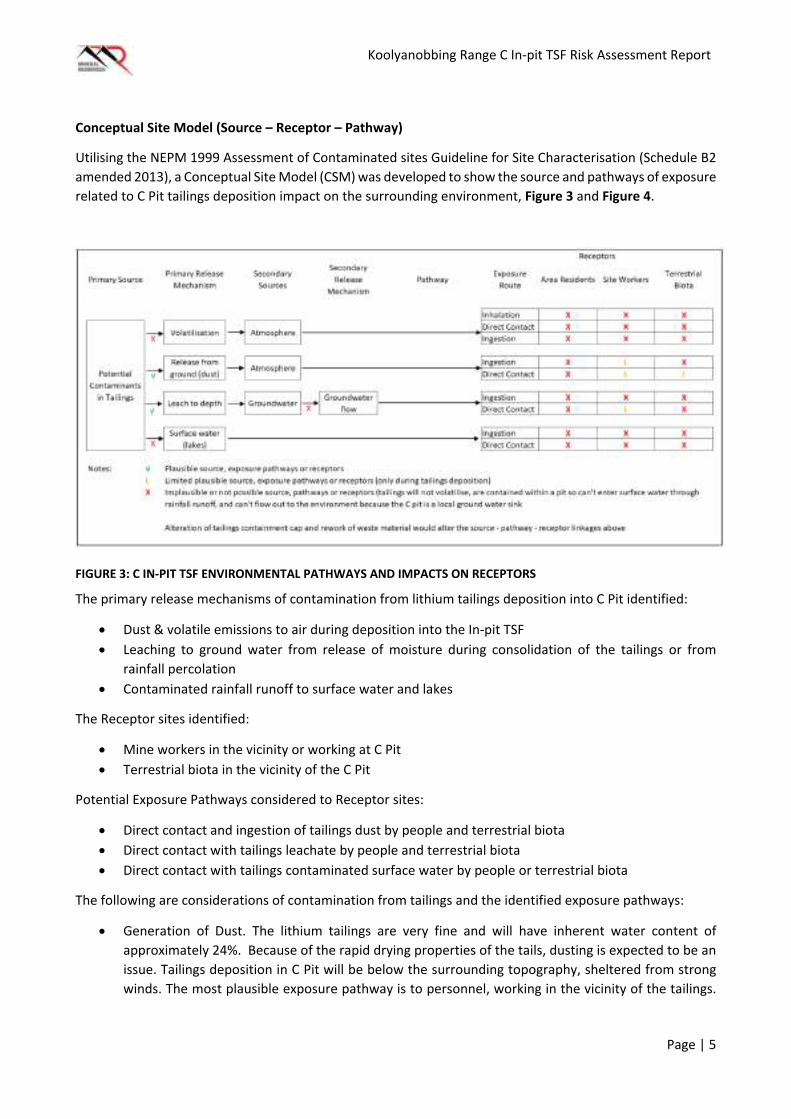
Koolyanobbing Range C In-pit TSF Risk Assessment Report
Page | 5
Conceptual Site Model (Source – Receptor – Pathway)
Utilising the NEPM 1999 Assessment of Contaminated sites Guideline for Site Characterisation (Schedule B2 amended 2013), a Conceptual Site Model (CSM) was developed to show the source and pathways of exposure related to C Pit tailings deposition impact on the surrounding environment, Figure 3 and Figure 4.
FIGURE 3: C IN-PIT TSF ENVIRONMENTAL PATHWAYS AND IMPACTS ON RECEPTORS
The primary release mechanisms of contamination from lithium tailings deposition into C Pit identified:
• Dust & volatile emissions to air during deposition into the In-pit TSF • Leaching to ground water from release of moisture during consolidation of the tailings or from
rainfall percolation • Contaminated rainfall runoff to surface water and lakes
The Receptor sites identified:
• Mine workers in the vicinity or working at C Pit • Terrestrial biota in the vicinity of the C Pit
Potential Exposure Pathways considered to Receptor sites:
• Direct contact and ingestion of tailings dust by people and terrestrial biota • Direct contact with tailings leachate by people and terrestrial biota • Direct contact with tailings contaminated surface water by people or terrestrial biota
The following are considerations of contamination from tailings and the identified exposure pathways:
• Generation of Dust. The lithium tailings are very fine and will have inherent water content of approximately 24%. Because of the rapid drying properties of the tails, dusting is expected to be an issue. Tailings deposition in C Pit will be below the surrounding topography, sheltered from strong winds. The most plausible exposure pathway is to personnel, working in the vicinity of the tailings.

Koolyanobbing Range C In-pit TSF Risk Assessment Report
Page | 6
Management measures such as, sealed cabs in vehicles, personal protective equipment and/or water cart spraying will be required during tailings deposition into C Pit.
• Leaching to groundwater. The tailings are “dry stacked” and will be deposited above existing and projected ground water levels so will not be in direct contact with the ground water. The only mechanism of leachate is from rainwater percolation through the tails and discharge to the groundwater. The risks of generating a leachate containing metals only occurs below pH4 (Ramboll 2018). No plausible opportunity will exist for generation of acidic leachant and the groundwater is hypersaline with no foreseeable beneficial use, so there is no plausible pathway to receptors.
• Contamination of surface water by rainfall runoff after contact with tailings. The TSF is contained within the C Pit so no interaction with surface water flows is possible.
Summary of Conceptual Site Model
The main Receptor identified with a plausible pathway, are mine personnel working in the C Pit during tailings deposition. Any potential for dust from the TSF to deposit on terrestrial biota close to the pit is very low. Implementation of YIPL Dust Management Plan and standard mining practices will address the safety issues associated with exposure to any tailings dust.
Tailings deposition is “dry stacked” and will be compacted in 500mm lifts. Water management controls will divert any water from percolating into tailings therefore minimising any opportunity of leachate formation. Any excess water (liquor or incidental rainwater) will be diverted to a collection sump for infiltration and evaporation.

Koolyanobbing Range C In-pit TSF Risk Assessment Report
Page | 7
FIGURE 4: C IN-PIT TSF ENVIRONMENTAL RECEPTORS

Koolyanobbing Range C In-pit TSF Risk Assessment Report
Page | 8
Summary of Risk Assessment
The risk assessment shows that the risks are associated with dust during tailings deposition and handling. The risk of environmental impacts from the Project, given the receiving environment, is LOW.
TSF Design and the YIPL Environmental Management System procedures will be sufficient to address any worker exposure by controlling dust.
Management Commitments arising from the Risk Assessment:
• The design of the In-pit tailings handling and storage process will address safety issues associated with road train access into the pit, stacking of the tailings and drainage within the pit;
• Tailings deposition within the C Pit will be at 338m AHD, ie above the pre-mining groundwater level • The tailings will be capped as soon as practicable on completion of deposition, with 1m thick layer of
NAF waste rock; • The YIPL Dust Management Plan will be implemented to minimise tailings dust impact on personnel
and the surrounding environment; and • Visual monitoring of tailings dust impact on surrounding vegetation will be undertaken, and dust
control measures increased or modified as required.
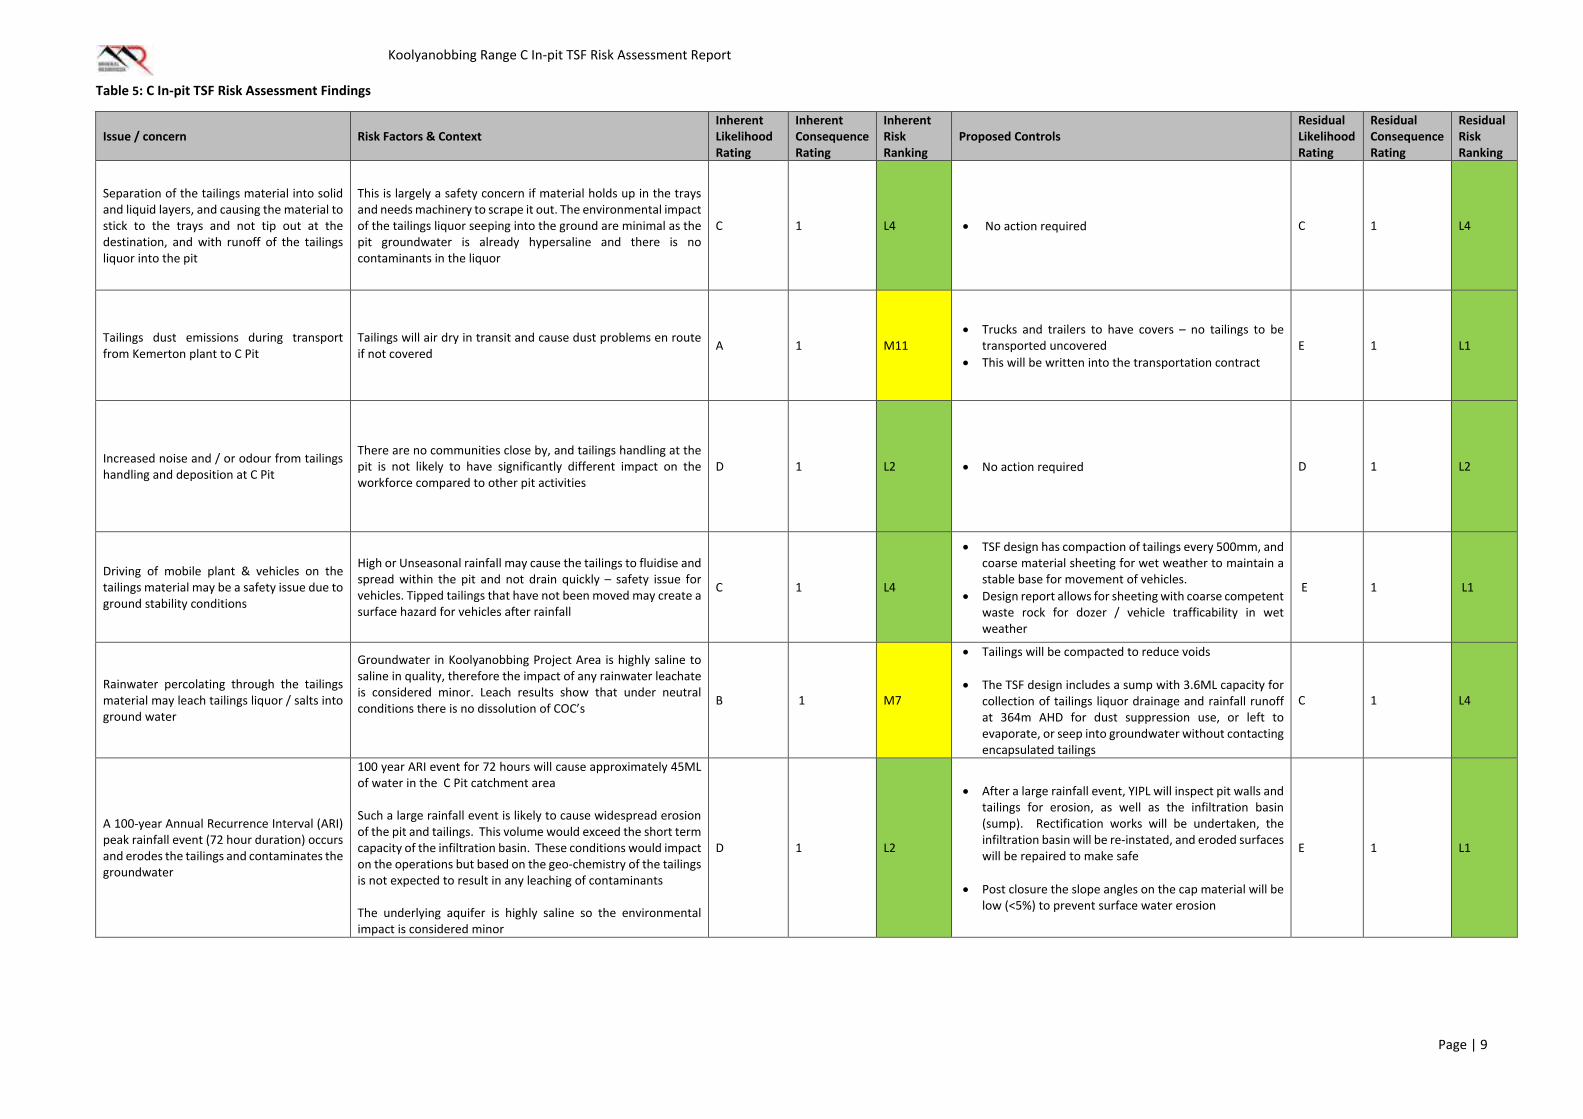
Koolyanobbing Range C In-pit TSF Risk Assessment Report
Page | 9
Table 5: C In-pit TSF Risk Assessment Findings
Issue / concern Risk Factors & Context Inherent Likelihood Rating
Inherent Consequence Rating
Inherent Risk Ranking
Proposed Controls Residual Likelihood Rating
Residual Consequence Rating
Residual Risk Ranking
Separation of the tailings material into solid and liquid layers, and causing the material to stick to the trays and not tip out at the destination, and with runoff of the tailings liquor into the pit
This is largely a safety concern if material holds up in the trays and needs machinery to scrape it out. The environmental impact of the tailings liquor seeping into the ground are minimal as the pit groundwater is already hypersaline and there is no contaminants in the liquor
C 1 L4 • No action required C 1 L4
Tailings dust emissions during transport from Kemerton plant to C Pit
Tailings will air dry in transit and cause dust problems en route if not covered A 1 M11
• Trucks and trailers to have covers – no tailings to be transported uncovered
• This will be written into the transportation contract E 1 L1
Increased noise and / or odour from tailings handling and deposition at C Pit
There are no communities close by, and tailings handling at the pit is not likely to have significantly different impact on the workforce compared to other pit activities
D 1 L2 • No action required D 1 L2
Driving of mobile plant & vehicles on the tailings material may be a safety issue due to ground stability conditions
High or Unseasonal rainfall may cause the tailings to fluidise and spread within the pit and not drain quickly – safety issue for vehicles. Tipped tailings that have not been moved may create a surface hazard for vehicles after rainfall
C 1 L4
• TSF design has compaction of tailings every 500mm, and coarse material sheeting for wet weather to maintain a stable base for movement of vehicles.
• Design report allows for sheeting with coarse competent waste rock for dozer / vehicle trafficability in wet weather
E 1 L1
Rainwater percolating through the tailings material may leach tailings liquor / salts into ground water
Groundwater in Koolyanobbing Project Area is highly saline to saline in quality, therefore the impact of any rainwater leachate is considered minor. Leach results show that under neutral conditions there is no dissolution of COC’s
B 1 M7
• Tailings will be compacted to reduce voids • The TSF design includes a sump with 3.6ML capacity for
collection of tailings liquor drainage and rainfall runoff at 364m AHD for dust suppression use, or left to evaporate, or seep into groundwater without contacting encapsulated tailings
C 1 L4
A 100-year Annual Recurrence Interval (ARI) peak rainfall event (72 hour duration) occurs and erodes the tailings and contaminates the groundwater
100 year ARI event for 72 hours will cause approximately 45ML of water in the C Pit catchment area Such a large rainfall event is likely to cause widespread erosion of the pit and tailings. This volume would exceed the short term capacity of the infiltration basin. These conditions would impact on the operations but based on the geo-chemistry of the tailings is not expected to result in any leaching of contaminants The underlying aquifer is highly saline so the environmental impact is considered minor
D 1 L2
• After a large rainfall event, YIPL will inspect pit walls and tailings for erosion, as well as the infiltration basin (sump). Rectification works will be undertaken, the infiltration basin will be re-instated, and eroded surfaces will be repaired to make safe
• Post closure the slope angles on the cap material will be
low (<5%) to prevent surface water erosion
E 1 L1

Koolyanobbing Range C In-pit TSF Risk Assessment Report
Page | 10
Issue / concern Risk Factors & Context Inherent Likelihood Rating
Inherent Consequence Rating
Inherent Risk Ranking
Proposed Controls Residual Likelihood Rating
Residual Consequence Rating
Residual Risk Ranking
Groundwater may rise higher than the projected recovery level and cause the tailings to be in contact with the hypersaline water and then leach metals
Groundwater recovery level may rise above projected rebound level due to extreme rainfall event. Tailings may come into contact with groundwater or tailings leachate will enter the groundwater and impact on future land use / groundwater requirement Geochemical test work indicates the tailing material is unlikely to leach any COC’s The regional groundwater quality is hypersaline, and there are no environmental receptors close by
D 1 L2 • Base of C Pit will be filled in to 338m AHD, which is 1m
higher than pre-mining regional groundwater level
D 1 L2
Uncapped stored tailings may create a dust problem
The tailings could dry out prior to capping, and may cause excessive dust emissions within the confines of the pit B 1 M7
• If dust generation becomes excessive from uncapped tailings, then capping to commence on unconsolidated material to reduce dust emissions. YIPL will also investigate suitability of dust suppression polymers
• YIPL will implement its Dust Management Plan during
tailings deposition into C Pit
E 1 L1
C Pit wall failure may cause PAF contact with tailings, which may generate acid water seepage into tailings and releasing contaminants into the groundwater C Pit wall failure may cause injury to personnel in the vicinity
C Pit wall rock is slightly alkaline and has less than 0.1% sulphidic material C Pit walls are stable, there has not been any wall failure since C Pit closure in 2017 The tailings material are alkaline with a high acid neutralising capacity (1,500 Moles H+/Tonne) Groundwater is hypersaline.
C 1 L4
• No action required to manage the environmental risk - ALARP
• YIPL has operating procedures in place for mining
personnel working in pits and near high walls
D 1 L2
Waste rock for sheeting and capping may contain potential acid forming material, which may acidify rainwater and leach metals out of the tailings
According to Geochemical characterisation of the pit rock, there is 1% PAF with a low risk of acidic, metalliferous or saline drainage The tailings material are alkaline with a high acid neutralising capacity (1,500 Moles H+/Tonne) Leach test work shown no leaching of COC’s
D 1 L2 • ALARP
D 1 L2
Insufficient NAF material within C Pit for sheeting and capping of the tailings at closure
Testing of backfilled rock from E pit finds PAF content greater than 1% The tailings material are alkaline with a high acid neutralising capacity (1,500 Moles H+/Tonne) Leach test work shows no leaching of COC’s
C 1 L4
• Undertake testwork to confirm NAF material in surrounding waste dumps
• Any areas identified as PAF to be avoided for capping
D 1 L2
C In-pit TSF may not achieve Closure Criteria (safe, stable and non-polluting landform)
Capping over the tailings may erode if the surface slope is too high, resulting in release of tailings dust into the environment B 1 M7
• The tailings cap surface will be compacted with slope of not exceeding 5 degrees
• Survey control to be used to ensure final compliance to design
D 1 L2
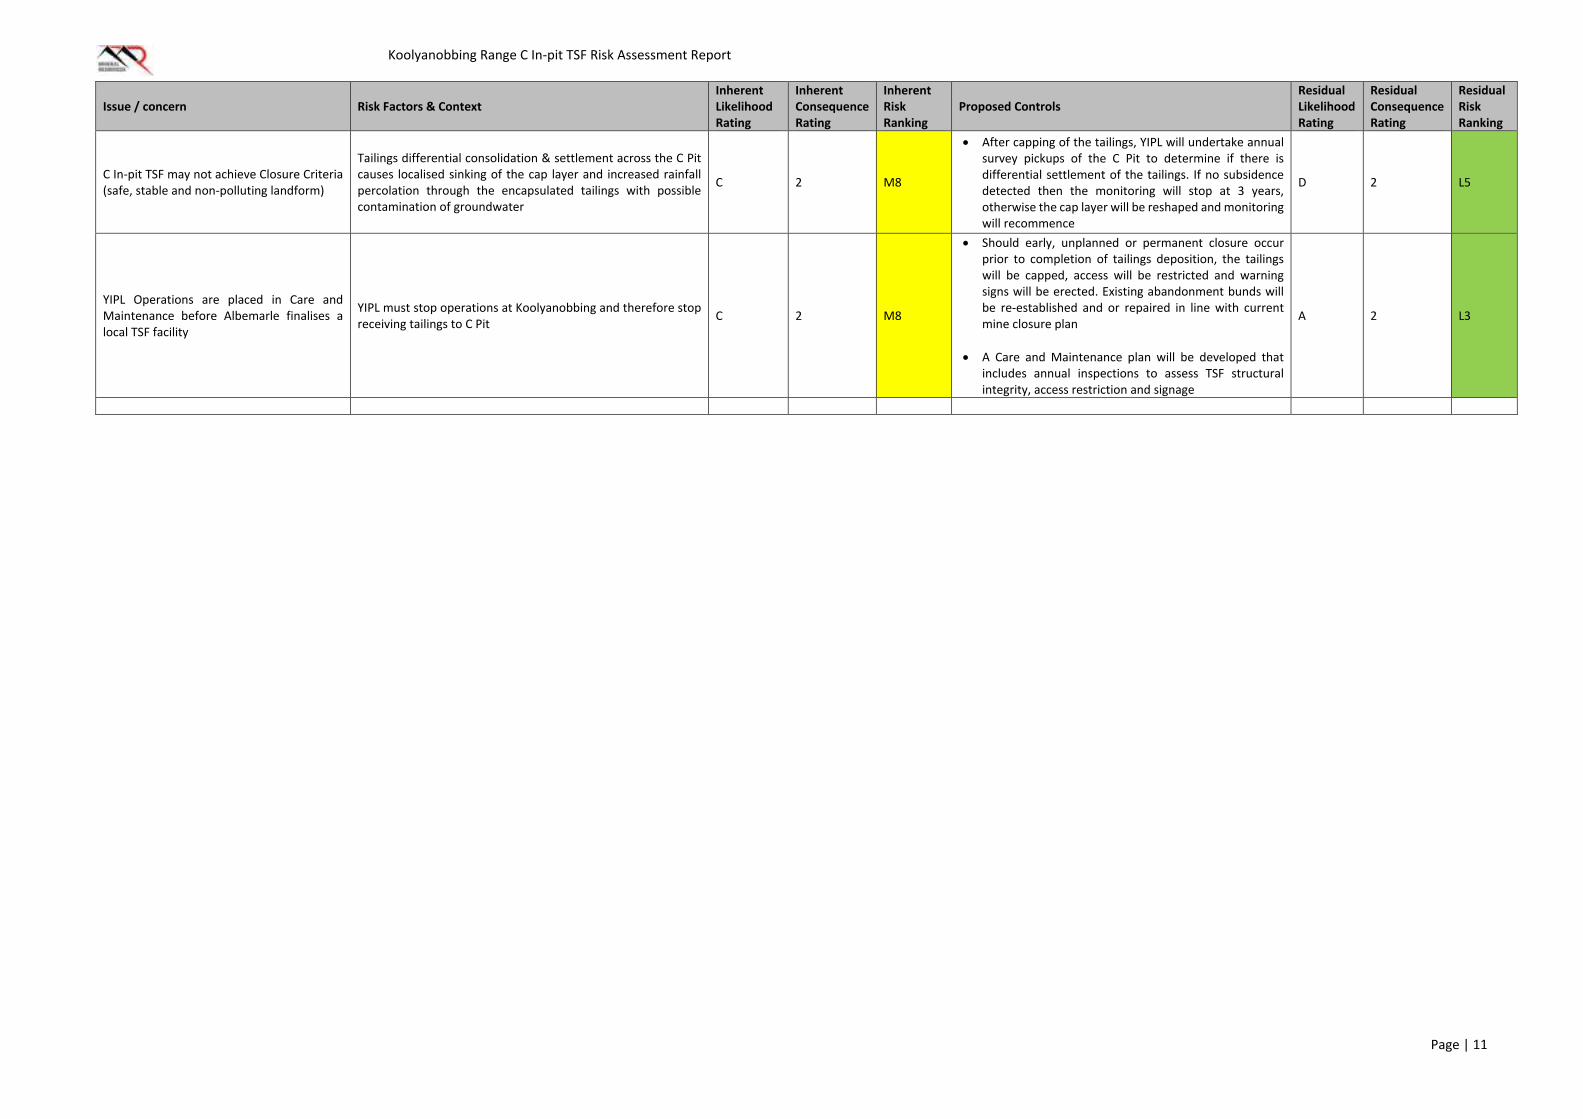
Koolyanobbing Range C In-pit TSF Risk Assessment Report
Page | 11
Issue / concern Risk Factors & Context Inherent Likelihood Rating
Inherent Consequence Rating
Inherent Risk Ranking
Proposed Controls Residual Likelihood Rating
Residual Consequence Rating
Residual Risk Ranking
C In-pit TSF may not achieve Closure Criteria (safe, stable and non-polluting landform)
Tailings differential consolidation & settlement across the C Pit causes localised sinking of the cap layer and increased rainfall percolation through the encapsulated tailings with possible contamination of groundwater
C 2 M8
• After capping of the tailings, YIPL will undertake annual survey pickups of the C Pit to determine if there is differential settlement of the tailings. If no subsidence detected then the monitoring will stop at 3 years, otherwise the cap layer will be reshaped and monitoring will recommence
D 2 L5
YIPL Operations are placed in Care and Maintenance before Albemarle finalises a local TSF facility
YIPL must stop operations at Koolyanobbing and therefore stop receiving tailings to C Pit C 2 M8
• Should early, unplanned or permanent closure occur prior to completion of tailings deposition, the tailings will be capped, access will be restricted and warning signs will be erected. Existing abandonment bunds will be re-established and or repaired in line with current mine closure plan
• A Care and Maintenance plan will be developed that
includes annual inspections to assess TSF structural integrity, access restriction and signage
A 2 L3

Koolyanobbing Range C In-pit TSF Design Report
APPENDIX 2 – Lithium Tailings Leaf Testing Report

ALBEMARLE AUSTRALIA
LITHIUM TAILINGS
LEAF TESTING SUMMARY REPORT
Intended for
Albemarle Australia Pty Ltd
Document type
Report
Date
April, 2018
navarke
EXT-ALB-RPT-0004_0

ALBEMARLE AUSTRALIA
LITHIUM TAILINGS LEAF TESTING SUMMARY REPORT
Ramboll
Suite 3, Level 2
200 Adelaide Terrace
East Perth
WA 6004
Australia
T +61 8 9225 5199
+61 8 9225 5155
www.ramboll.com
Revision
Date
Made by
Checked by
Approved by
Description
Final April 2018
R Seebach
C Goodbody
F Robinson
This document comprises a LEAF Testing Summary
Report for the lithium tailings material from a
proposed lithium processing facility at Kemerton,
Western Australia.
Ref 318000381
Lithium Tailings LEAF Testing Summary Report
CONTENTS
EXECUTIVE SUMMARY 1 1. INTRODUCTION 2 1.1 Background 2 1.2 Summary of Waste Classification 2 1.3 Objective and Scope of Work 2 2. METHODOLOGY 2 2.1 Sampling and Analysis of Lithium Tailings 2 2.2 Summary of LEAF Testing Methodologies 3 3. ASSESSMENT CRITERIA 3 4. QUALITY CONTROL 4 5. RESULTS AND DISCUSSION 4 6. CONCLUSIONS 1 7. REFERENCES 1 8. LIMITATIONS 1
LIST OF TABLES
Table 1 Leachable Concentration Values for Waste Classification 3 Table 2 Results for LEAF Test Method 1313 5 Table 3 Results for LEAF Test Method 1314 5 Table 4 Results for LEAF Test Method 1315 5 Table 5 Results for LEAF Test Method 1316 6
APPENDICES
Appendix 1 Analytical Results
Appendix 2 Laboratory Reports

Lithium Tailings LEAF Testing Summary Report 1 of 9
EXECUTIVE SUMMARY
Ramboll Australia Pty Ltd (Ramboll) undertook Leaching Environmental Assessment Framework
(LEAF) tests of lithium tailings from the proposed Albemarle Kemerton Plant in Western Australia
(WA). The objective of the LEAF tests were to gain analytical certainty of the leachability of lithium
tailings material under a range of chemical conditions in order to support the findings of the
Albemarle Kemerton Plant Waste Management Strategy (Tailings) Report (Ramboll, 2017).
The proposed Albemarle Kemerton Plant in Western Australia will extract lithium from spodumene
concentrate by heat treatment, followed by leaching of lithium and final product recovery.
Spodumene concentrate is produced at the Talison Greenbushes Lithium Operations in WA from
spodumene ore.
Waste classification for the tailings material was undertaken based on tailings samples recovered
from an Albemarle processing facility in Guorun, Sichuan, P.R. China. The Guorun facility processes
the same feedstock using the same process as the proposed Kemerton facility and therefore is
considered to provide a comparative tailings composition to the proposed plant.
Waste classification sampling and analysis was undertaken by Ramboll as part of a Waste
Management Strategy (WMS) and according to the WA Department of Water and Environment
(DWER, formerly WA DEC) (2009) guideline for Landfill Waste Classification and Waste Definitions
1996 (As amended December 2009) (WA DEC (2009)). Waste classification follows a five step
program where Step 1 and 2 define if an assessment is required and Step 3 is an evaluation of
total concentrations against criteria presented in Table 3 of WA DEC 2009. Where concentrations
are in excess of these guidelines, leachability assessment (Step 4) can be completed and compared
against total and leachable concentrations in Table 4 of WA DEC (2009) (Step 5).
Step 3 was previously completed of the waste (Ramboll 2017) and found elevated concentrations
of Beryllium, Cadmium, Lead, Lithium, Mercury and Nickel. Step 4 and 5 were then undertaken
and found that the process waste is classified as suitable for disposal in a Class I landfill.
WA DEC (2009) does not include criteria for total and leachable lithium and an interim guideline of
20 mg/L for leachable lithium was adopted from the NZ MfE (2004). This approach was discussed
with DWER.
Following their review of the process waste classification (Ramboll 2017), DWER requested that
LEAF testing be conducted as part of Step 4, to provide robustness around leachability under varied
site conditions. This report presents the findings of the LEAF analysis.
Testing followed the LEAF procedure as described in WA DEC (2009). LEAF testing was carried out
on a representative bulk sample of tailings material. The samples were analysed under the LEAF
methodology for chemical constituents that were in exceedance of the WA DEC (2009) Table 3
guidelines. Ramboll 2017 presents data for total concentrations and shows that all concentrations
were below Table 4 concentration limits for Class 1 landfill, therefore no further analysis of total
concentrations was undertaken.
LEAF testing included US EPA methodologies 1313, 1314, 1315 and 1316. Results were compared
with leachable concentrations presented in Table 4 WA DEC 2009. The following exceedances were
noted during LEAF Test 1313:
Beryllium exceeded leachable concentration for Class III at pH2.0 (2.4mg/L).
Nickel exceeded leachable concentration for Class II at pH4.0 (0.3mg/L) and pH2.0
(0.6mg/L).
These exceedances are not considered to alter the original waste classification (Ramboll, 2017)
since the lithium tailings will not be disposed in an environment at below pH4 and metals
concentrations at the expected pH levels were below the guidelines. No further exceedances were
recorded during any of the other LEAF tests.
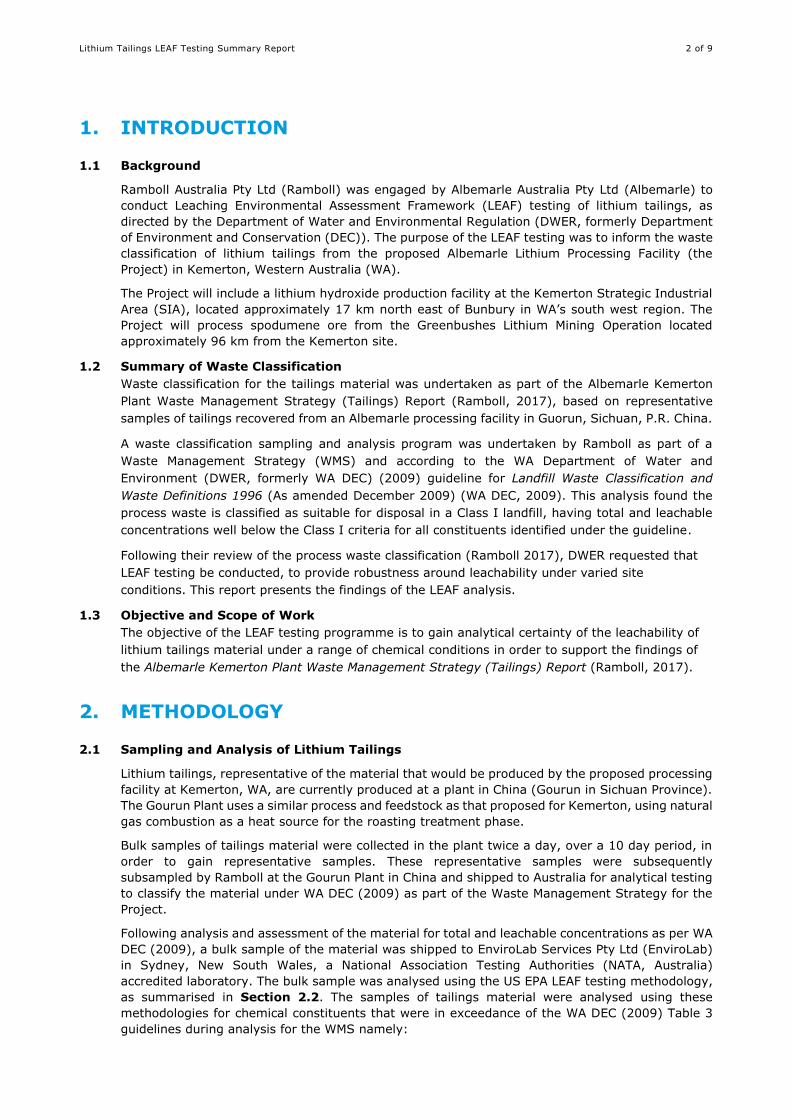
Lithium Tailings LEAF Testing Summary Report
2 of 9
1. INTRODUCTION
1.1 Background
Ramboll Australia Pty Ltd (Ramboll) was engaged by Albemarle Australia Pty Ltd (Albemarle) to
conduct Leaching Environmental Assessment Framework (LEAF) testing of lithium tailings, as
directed by the Department of Water and Environmental Regulation (DWER, formerly Department
of Environment and Conservation (DEC)). The purpose of the LEAF testing was to inform the waste
classification of lithium tailings from the proposed Albemarle Lithium Processing Facility (the
Project) in Kemerton, Western Australia (WA).
The Project will include a lithium hydroxide production facility at the Kemerton Strategic Industrial
Area (SIA), located approximately 17 km north east of Bunbury in WA’s south west region. The
Project will process spodumene ore from the Greenbushes Lithium Mining Operation located
approximately 96 km from the Kemerton site.
1.2 Summary of Waste Classification
Waste classification for the tailings material was undertaken as part of the Albemarle Kemerton
Plant Waste Management Strategy (Tailings) Report (Ramboll, 2017), based on representative
samples of tailings recovered from an Albemarle processing facility in Guorun, Sichuan, P.R. China.
A waste classification sampling and analysis program was undertaken by Ramboll as part of a
Waste Management Strategy (WMS) and according to the WA Department of Water and
Environment (DWER, formerly WA DEC) (2009) guideline for Landfill Waste Classification and
Waste Definitions 1996 (As amended December 2009) (WA DEC, 2009). This analysis found the
process waste is classified as suitable for disposal in a Class I landfill, having total and leachable
concentrations well below the Class I criteria for all constituents identified under the guideline.
Following their review of the process waste classification (Ramboll 2017), DWER requested that
LEAF testing be conducted, to provide robustness around leachability under varied site
conditions. This report presents the findings of the LEAF analysis.
1.3 Objective and Scope of Work
The objective of the LEAF testing programme is to gain analytical certainty of the leachability of
lithium tailings material under a range of chemical conditions in order to support the findings of
the Albemarle Kemerton Plant Waste Management Strategy (Tailings) Report (Ramboll, 2017).
2. METHODOLOGY
2.1 Sampling and Analysis of Lithium Tailings
Lithium tailings, representative of the material that would be produced by the proposed processing
facility at Kemerton, WA, are currently produced at a plant in China (Gourun in Sichuan Province).
The Gourun Plant uses a similar process and feedstock as that proposed for Kemerton, using natural
gas combustion as a heat source for the roasting treatment phase.
Bulk samples of tailings material were collected in the plant twice a day, over a 10 day period, in
order to gain representative samples. These representative samples were subsequently
subsampled by Ramboll at the Gourun Plant in China and shipped to Australia for analytical testing
to classify the material under WA DEC (2009) as part of the Waste Management Strategy for the
Project.
Following analysis and assessment of the material for total and leachable concentrations as per WA
DEC (2009), a bulk sample of the material was shipped to EnviroLab Services Pty Ltd (EnviroLab)
in Sydney, New South Wales, a National Association Testing Authorities (NATA, Australia)
accredited laboratory. The bulk sample was analysed using the US EPA LEAF testing methodology,
as summarised in Section 2.2. The samples of tailings material were analysed using these
methodologies for chemical constituents that were in exceedance of the WA DEC (2009) Table 3
guidelines during analysis for the WMS namely:

Lithium Tailings LEAF Testing Summary Report
3 of 9
Beryllium
Cadmium
Lead
Lithium
Mercury
Nickel
2.2 Summary of LEAF Testing Methodologies
The methodologies used for the LEAF testing were the US EPA methodologies 1313, 1314, 1315
and 1316. These tests were developed to determine how leaching of chemical constituents varied
with pH and the liquid to solid ratio. The LEAF testing methodologies have been described as
follows (WA DER, 2015):
Test Method 1313, which determines how liquid-solid partitioning varies with the pH of the
leaching solution using a parallel batch extraction procedure
Test Method 1314, which determines how liquid-solid portioning varies with varying liquid to
solid ratios using an up-flow percolation column procedure
Test Method 1315, which determines mass transfer rates of chemical constituents in leachate
from monolithic and compacted granular materials (e.g. construction materials) using a semi-
dynamic tank leaching procedure, and
Test Method 1316, which determines how liquid-solid partitioning varies with the liquid to
solid ratio using a parallel batch extraction procedure.
3. ASSESSMENT CRITERIA
The results of LEAF testing were compared to the guidelines for leachable limits provided in Table
4 of WA DEC (2009) in order to ascertain if there were any exceedances under a range of
chemical conditions simulated through the LEAF test procedure.
WA DEC (2009) does not provide a waste classification guideline criteria for lithium, and therefore,
consistent with Ramboll 2017, an interim guideline of 20 mg/L for lithium in leachate has been
adopted, pending the calculation of a site specific value based on environmental conditions at the
site of waste storage / management. This is consistent with the value adopted by NZ MfE (2004)
for a Class A landfill in New Zealand which is comparable to a Class III landfill in Western Australia.
Table 1 presents the assessment criteria adopted to assess the leachable concentrations of
constituents from the results of the LEAF testing suite.
Table 1 Leachable Concentration Values for Waste Classification
Constituent Unit
Leachable Concentration (ASLP) values for waste classification*
Leachable
Concentration ASLP1
Leachable
Concentration ASLP2
Leachable
Concentration ASLP3
Leachable
Concentration ASLP4
(mg/L) (mg/L) (mg/L) (mg/L)
Class I Class II Class III Class IV
Beryllium mg/L 0.1 0.1 1 10
Cadmium mg/L 0.1 0.1 1 10
Lead mg/L 0.1 0.1 1 10
Lithium mg/L - - 20^ -
Mercury mg/L 0.01 0.01 0.1 1
Nickel mg/L 0.2 0.2 2 20
‘-‘ indicates no criteria

Lithium Tailings LEAF Testing Summary Report
4 of 9
* Table 4, WA DECC (2009) – Western Australia Department of Environment and Conservation, Landfill Classification and
Waste Definitions 1996 (as amended 2009). Comparision against total concentrations was undertaken in Ramboll 2017.
^NZ MfE (2004). Module 2: Hazardous Waste Guidelines, Landfill Waste Acceptance Criteria and Landfill Classification, New
Zealand Ministry for the Environment, May 2004
4. QUALITY CONTROL
Quality control measures that were undertaken as part of the tailings sampling event at the lithium
processing facility at Guorun, Sichuan, P.R. China were discussed in Ramboll (2017). The following
quality control measures were undertaken by the primary laboratory during the LEAF testing
programme as part of the analysis of the tailings material:
EnviroLab was used as the primary laboratory. EnviroLab is NATA accredited for the analyses
undertaken
All critical samples analysed and all analytes analysed according to Standard Operating
Procedures (SOPs)
Practical Quantitation Limits (PQLs) were appropriate and below guideline values
Laboratory blind duplicate samples were analysed at an appropriate rate and found to be
acceptable
Method blanks results recorded no detections
On the basis of the quality assurance and quality control conducted it was considered that the data
obtained is of suitable quality for use in this project.
5. RESULTS AND DISCUSSION
A summary of results are provided in Table 2 to Table 5. The full tables of results are provided in
Appendix 1. Laboratory certificates are provided in Appendix 2.
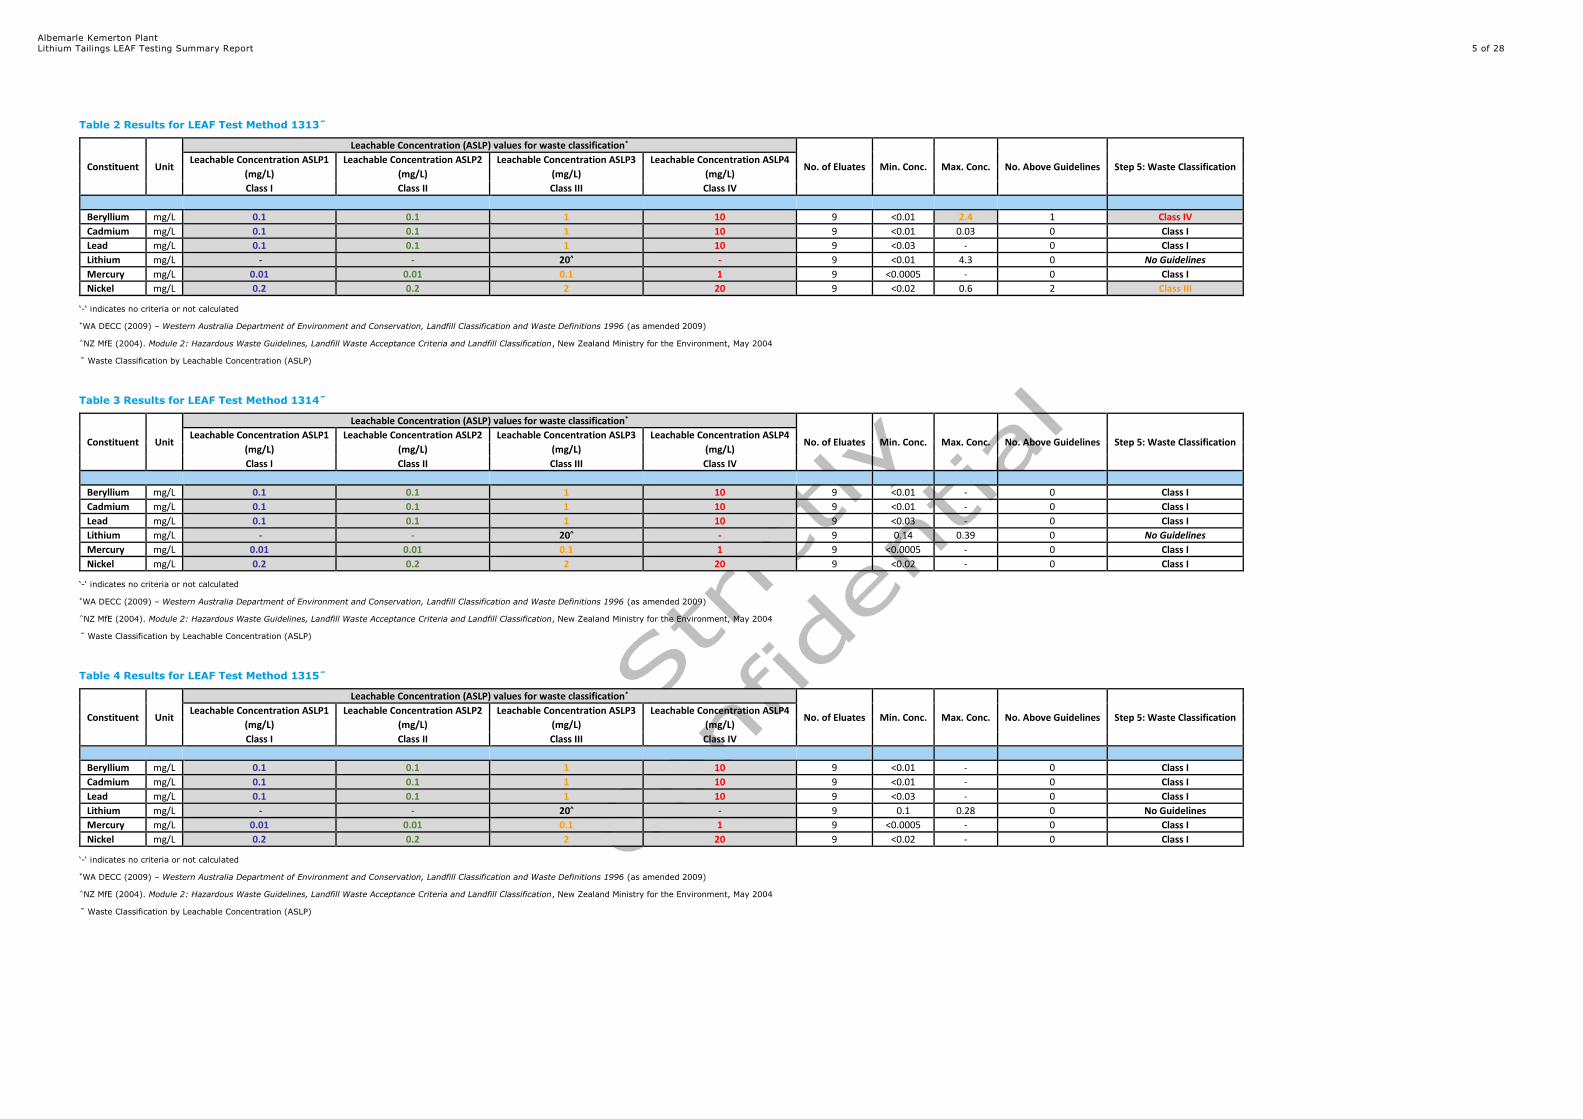
Albemarle Kemerton Plant
Lithium Tailings LEAF Testing Summary Report
5 of 28
Table 2 Results for LEAF Test Method 1313
Constituent Unit
Leachable Concentration (ASLP) values for waste classification*
No. of Eluates Min. Conc. Max. Conc. No. Above Guidelines Step 5: Waste Classification Leachable Concentration ASLP1 Leachable Concentration ASLP2 Leachable Concentration ASLP3 Leachable Concentration ASLP4
(mg/L) (mg/L) (mg/L) (mg/L)
Class I Class II Class III Class IV
Beryllium mg/L 0.1 0.1 1 10 9 <0.01 2.4 1 Class IV
Cadmium mg/L 0.1 0.1 1 10 9 <0.01 0.03 0 Class I
Lead mg/L 0.1 0.1 1 10 9 <0.03 - 0 Class I
Lithium mg/L - - 20^ - 9 <0.01 4.3 0 No Guidelines
Mercury mg/L 0.01 0.01 0.1 1 9 <0.0005 - 0 Class I
Nickel mg/L 0.2 0.2 2 20 9 <0.02 0.6 2 Class III
‘-‘ indicates no criteria or not calculated
*WA DECC (2009) – Western Australia Department of Environment and Conservation, Landfill Classification and Waste Definitions 1996 (as amended 2009)
^NZ MfE (2004). Module 2: Hazardous Waste Guidelines, Landfill Waste Acceptance Criteria and Landfill Classification, New Zealand Ministry for the Environment, May 2004
Waste Classification by Leachable Concentration (ASLP)
Table 3 Results for LEAF Test Method 1314
Constituent Unit
Leachable Concentration (ASLP) values for waste classification*
No. of Eluates Min. Conc. Max. Conc. No. Above Guidelines Step 5: Waste Classification Leachable Concentration ASLP1 Leachable Concentration ASLP2 Leachable Concentration ASLP3 Leachable Concentration ASLP4
(mg/L) (mg/L) (mg/L) (mg/L)
Class I Class II Class III Class IV
Beryllium mg/L 0.1 0.1 1 10 9 <0.01 - 0 Class I
Cadmium mg/L 0.1 0.1 1 10 9 <0.01 - 0 Class I
Lead mg/L 0.1 0.1 1 10 9 <0.03 - 0 Class I
Lithium mg/L - - 20^ - 9 0.14 0.39 0 No Guidelines
Mercury mg/L 0.01 0.01 0.1 1 9 <0.0005 - 0 Class I
Nickel mg/L 0.2 0.2 2 20 9 <0.02 - 0 Class I
‘-‘ indicates no criteria or not calculated
*WA DECC (2009) – Western Australia Department of Environment and Conservation, Landfill Classification and Waste Definitions 1996 (as amended 2009)
^NZ MfE (2004). Module 2: Hazardous Waste Guidelines, Landfill Waste Acceptance Criteria and Landfill Classification, New Zealand Ministry for the Environment, May 2004
Waste Classification by Leachable Concentration (ASLP)
Table 4 Results for LEAF Test Method 1315
Constituent Unit
Leachable Concentration (ASLP) values for waste classification*
No. of Eluates Min. Conc. Max. Conc. No. Above Guidelines Step 5: Waste Classification Leachable Concentration ASLP1 Leachable Concentration ASLP2 Leachable Concentration ASLP3 Leachable Concentration ASLP4
(mg/L) (mg/L) (mg/L) (mg/L)
Class I Class II Class III Class IV
Beryllium mg/L 0.1 0.1 1 10 9 <0.01 - 0 Class I
Cadmium mg/L 0.1 0.1 1 10 9 <0.01 - 0 Class I
Lead mg/L 0.1 0.1 1 10 9 <0.03 - 0 Class I
Lithium mg/L - - 20^ - 9 0.1 0.28 0 No Guidelines
Mercury mg/L 0.01 0.01 0.1 1 9 <0.0005 - 0 Class I
Nickel mg/L 0.2 0.2 2 20 9 <0.02 - 0 Class I
‘-‘ indicates no criteria or not calculated
*WA DECC (2009) – Western Australia Department of Environment and Conservation, Landfill Classification and Waste Definitions 1996 (as amended 2009)
^NZ MfE (2004). Module 2: Hazardous Waste Guidelines, Landfill Waste Acceptance Criteria and Landfill Classification, New Zealand Ministry for the Environment, May 2004
Waste Classification by Leachable Concentration (ASLP)

Albemarle Kemerton Plant
Lithium Tailings LEAF Testing Summary Report
6 of 28
Table 5 Results for LEAF Test Method 1316
Constituent Unit
Leachable Concentration (ASLP) values for waste classification*
No. of Eluates Min. Conc. Max. Conc. No. Above Guidelines Step 5: Waste Classification Leachable Concentration ASLP1 Leachable Concentration ASLP2 Leachable Concentration ASLP3 Leachable Concentration ASLP4
(mg/L) (mg/L) (mg/L) (mg/L)
Class I Class II Class III Class IV
Beryllium mg/L 0.1 0.1 1 10 5 <0.01 - 0 Class I
Cadmium mg/L 0.1 0.1 1 10 5 <0.01 - 0 Class I
Lead mg/L 0.1 0.1 1 10 5 <0.03 - 0 Class I
Lithium mg/L - - 20^ - 5 0.07 0.13 0 No Guidelines
Mercury mg/L 0.01 0.01 0.1 1 5 <0.0005 - 0 Class I
Nickel mg/L 0.2 0.2 2 20 5 <0.02 - 0 Class I
‘-‘ indicates no criteria or not calculated
*WA DECC (2009) – Western Australia Department of Environment and Conservation, Landfill Classification and Waste Definitions 1996 (as amended 2009)
^NZ MfE (2004). Module 2: Hazardous Waste Guidelines, Landfill Waste Acceptance Criteria and Landfill Classification, New Zealand Ministry for the Environment, May 2004
Waste Classification by Leachable Concentration (ASLP)
Lithium Tailings LEAF Testing Summary Report 1 of 9
The following exceedances were noted during LEAF Test 1313:
Beryllium exceeded leachable concentration for Class III at pH2.0 (2.4mg/L).
Nickel exceeded leachable concentration for Class II at pH4.0 (0.3mg/L) and pH2.0
(0.6mg/L).
These exceedances are not considered to alter the original waste classification (Ramboll, 2017)
since the lithium tailings will not be disposed in an environment at below pH4. It was noted in the
WMS (Ramboll, 2017) that the average pH of the material measured in the laboratory during
assessment for waste classification was found to be pH 7.65, indicating that the material is neutral
to slightly alkaline and would be disposed as such. It is further understood that the Lithium Tailings
will be disposed in a dedicated storage that will avoid the risk of cross contamination with other
materials or wastes that could lead to low pH conditions and promote mobilisation of constituents,
rendering leachate unfit for reuse in the processing facility.
6. CONCLUSIONS
LEAF testing was carried out for total concentrations of constituents that were in exceedance of the
WA DEC (2009) Table 3 guidelines for Class I classification during an initial waste classification
(Ramboll, 2017), namely:
Beryllium;
Cadmium;
Lead;
Lithium;
Mercury; and
Nickel.
LEAF testing comprised US EPA methodologies 1313, 1314, 1315 and 1316. The results of the LEAF
testing were compared to the leachable concentration values provided in Table 4 of WA DEC (2009)
and the adopted interim guideline for leachable lithium from NZ MfE (2004). The following
exceedances were noted during LEAF Test 1313:
Beryllium exceeded leachable concentration for Class III at pH2.0 (2.4mg/L).
Nickel exceeded leachable concentration for Class II at pH4.0 (0.3mg/L) and pH2.0
(0.6mg/L).
These exceedances are not considered relevant to the original waste classification (Ramboll,
2017) since the lithium tailings will not be disposed at a pH of below 4.0. No further exceedances
were recorded during analysis of other LEAF tests. On the basis of the analysis undertaken, the
tailings material is classified as Class I.

Albemarle Kemerton Plant
Lithium Tailings LEAF Testing Summary Report 1 of 28
7. REFERENCES
NZ MfE (2004). Module 2: Hazardous Waste Guidelines, Landfill Waste Acceptance Criteria and
Landfill Classification, New Zealand Ministry for the Environment, May 2004
Ramboll (2017). Albemarle Kemerton Plant Waste Management Strategy (Tailings), December
2017.
US EPA (2017). Leachate Environmental Assessment Framework – How-to guide, United States
Environmental Protection Agency, 2017.
WA DEC (2009). Landfill Waste Classification and Waste Definitions 1996 (As amended December
2009), Western Australia Department of Environment and Conservation.
WA DER (2015). Background paper on the use of leaching tests for assessing the disposal and re-
use of waste-derived materials, Western Australia Department of Environment Regulation, July
2015.
8. LIMITATIONS
The Lithium Tailings LEAF Testing Summary Report has been prepared exclusively for use by
Albemarle in commercial confidence. The conclusions presented in this Lithium Tailings LEAF
Testing Summary Report represent Ramboll’s best professional judgment based upon the
information available and conditions existing as of the date of the preparation.
In performing its assignment, Ramboll must rely upon publicly available information, information
provided by the client and information provided by third parties. Accordingly, the conclusions in
this report are valid only to the extent that the information provided to Ramboll was accurate and
complete. This review is not intended as legal advice, nor is it an exhaustive review of site
conditions or facility compliance. Ramboll makes no representations or warranties, express or
implied, about the conditions of the Site.
Conditions described within this document can change in a limited time. There are always some
variations in material conditions, which cannot be fully defined by sampling. Further, because
regulatory criteria are constantly changing, concentrations of contaminants and assessed levels of
risk considered acceptable at the time of the assessment may, in future, become subject to
different regulatory standards.

Lithium Tailings LEAF Testing Summary Report 0-1
APPENDIX 1
ANALYTICAL RESULTS

mg/L mg/L mg/L mg/L mg/L mg/L0.01 0.01 0.03 0.01 0.0005 0.02
Metals-020 ICP-AES Metals-020 ICP-AES Metals-020 ICP-AES Metals-020 ICP-AES Metals-021 CV-AAS Metals-020 ICP-AESRB01 1313 T01 target pH 13 1 0 23/01/2018 23/01/2018 <0.01 <0.01 <0.03 <0.01 <0.0005 <0.02RB01 1313 T01 target pH 13 1 1 23/01/2018 23/01/2018 <0.01 <0.01 <0.03 <0.01 <0.0005 <0.02RB01 1313 T02 target pH 12 2 0 23/01/2018 23/01/2018 <0.01 <0.01 <0.03 <0.01 <0.0005 <0.02RB01 1313 T03 target pH 10.5 3 0 23/01/2018 23/01/2018 <0.01 <0.01 <0.03 0.02 <0.0005 <0.02RB01 1313 T04 target pH 9.0 4 0 23/01/2018 23/01/2018 <0.01 <0.01 <0.03 0.05 <0.0005 <0.02RB01 1313 T05 target pH 8.0 5 0 23/01/2018 23/01/2018 <0.01 <0.01 <0.03 0.08 <0.0005 <0.02RB01 1313 T06 target pH natural 6 0 23/01/2018 23/01/2018 <0.01 <0.01 <0.03 0.08 <0.0005 <0.02RB01 1313 T07 target pH 5.5 7 0 23/01/2018 23/01/2018 <0.01 <0.01 <0.03 0.19 <0.0005 <0.02RB01 1313 T08 target pH 4.0 8 0 23/01/2018 23/01/2018 0.04 0.02 <0.03 1.8 <0.0005 0.3RB01 1313 T09 target pH 2.0 9 0 23/01/2018 23/01/2018 2.4 0.03 <0.03 4.3 <0.0005 0.6RB01 1314 T01 10 0 23/01/2018 23/01/2018 <0.01 <0.01 <0.03 0.36 <0.0005 <0.02RB01 1314 T02 11 0 23/01/2018 23/01/2018 <0.01 <0.01 <0.03 0.37 <0.0005 <0.02RB01 1314 T03 12 0 23/01/2018 23/01/2018 <0.01 <0.01 <0.03 0.39 <0.0005 <0.02RB01 1314 T04 13 0 30/01/2018 30/01/2018 <0.01 <0.01 <0.03 0.27 <0.0005 <0.02RB01 1314 T05 14 0 30/01/2018 30/01/2018 <0.01 <0.01 <0.03 0.27 <0.0005 <0.02RB01 1314 T06 15 0 02/02/2018 02/02/2018 <0.01 <0.01 <0.03 0.24 <0.0005 <0.02RB01 1314 T07 16 0 02/02/2018 02/02/2018 <0.01 <0.01 <0.03 0.18 <0.0005 <0.02RB01 1314 T08 17 0 07/02/2018 07/02/2018 <0.01 <0.01 <0.03 0.16 <0.0005 <0.02RB01 1314 T09 18 0 08/02/2018 08/02/2018 <0.01 <0.01 <0.03 0.14 <0.0005 <0.02RB01 1315 T01 19 0 25/01/2018 25/01/2018 <0.01 <0.01 <0.03 0.17 <0.0005 <0.02RB01 1315 T01 19 1 25/01/2018 25/01/2018 <0.01 <0.01 <0.03 0.16 <0.0005 <0.02RB01 1315 T02 20 0 25/01/2018 25/01/2018 <0.01 <0.01 <0.03 0.28 <0.0005 <0.02RB01 1315 T03 21 0 25/01/2018 25/01/2018 <0.01 <0.01 <0.03 0.24 <0.0005 <0.02RB01 1315 T04 22 0 30/01/2018 30/01/2018 <0.01 <0.01 <0.03 0.2 <0.0005 <0.02RB01 1315 T05 23 0 05/02/2018 05/02/2018 <0.01 <0.01 <0.03 0.1 <0.0005 <0.02RB01 1315 T06 24 0 19/02/2018 19/02/2018 <0.01 <0.01 <0.03 0.15 <0.0005 <0.02RB01 1315 T07 25 0 06/03/2018 06/03/2018 <0.01 <0.01 <0.03 0.2 <0.0005 <0.02RB01 1315 T08 26 0 13/03/2018 13/03/2018 <0.01 <0.01 <0.03 0.17 <0.0005 <0.02RB01 1315 T09 27 0 26/03/2018 26/03/2018 <0.01 <0.01 <0.03 0.17 <0.0005 <0.02RB01 1316 T01 target L/S 10 28 0 23/01/2018 23/01/2018 <0.01 <0.01 <0.03 0.07 <0.0005 <0.02RB01 1316 T02 target L/S 5 29 0 23/01/2018 23/01/2018 <0.01 <0.01 <0.03 0.09 <0.0005 <0.02RB01 1316 T03 target L/S 2 30 0 23/01/2018 23/01/2018 <0.01 <0.01 <0.03 0.11 <0.0005 <0.02RB01 1316 T04 target L/S 1 31 0 23/01/2018 23/01/2018 <0.01 <0.01 <0.03 0.13 <0.0005 <0.02RB01 1316 T05 target L/S 0.5 32 0 23/01/2018 23/01/2018 <0.01 <0.01 <0.03 0.11 <0.0005 <0.02LEAF 1313 Blank DI Water 33 0 23/01/2018 23/01/2018 <0.01 <0.01 <0.03 <0.01 <0.0005 <0.02LEAF 1313 Blank Acid 34 0 23/01/2018 23/01/2018 <0.01 <0.01 <0.03 <0.01 <0.0005 <0.02LEAF 1313 Blank Base 35 0 23/01/2018 23/01/2018 <0.01 <0.01 <0.03 <0.01 <0.0005 <0.02LEAF 1316 Blank DI Water 36 0 23/01/2018 23/01/2018 <0.01 <0.01 <0.03 <0.01 <0.0005 <0.02
Mercury in Eluate Nickel in Eluate
Table A1: Complete record of LEAF testing results
DescriptionSample
NoReplicate Date extracted Date analysed
Beryllium in Eluate Cadmium in Eluate Lead in Eluate Lithium in Eluate

Lithium Tailings LEAF Testing Summary Report
0-1
APPENDIX 2
LABORATORY REPORTS

Envirolab Services Pty LtdABN 37 112 535 645
12 Ashley St Chatswood NSW 2067
ph 02 9910 6200 fax 02 9910 6201
www.envirolab.com.au
CERTIFICATE OF ANALYSIS 183380
200 Adelaide Terrace, EAST PERTH, WA, 6004AddressRudi SeebachAttentionRamboll Australia Pty LtdClient
Client Details
16/01/2018Date completed instructions received16/01/2018Date samples receivedSoilNumber of SamplesAlbemarle LEAF TESTsYour Reference
Sample Details
Please refer to the last page of this report for any comments relating to the results.Results are reported on a dry weight basis for solids and on an as received basis for other matrices.
Samples were analysed as received from the client. Results relate specifically to the samples as received.
Please refer to the following pages for results, methodology summary and quality control data.
Analysis Details
Tests not covered by NATA are denoted with *Accredited for compliance with ISO/IEC 17025 - Testing.
NATA Accreditation Number 2901. This document shall not be reproduced except in full.
27/03/2018Date of Issue29/03/2018Date results requested by
Report Details
David Springer, General Manager
Authorised By
Simon Mills, Group R&D Manager
Results Approved By
Revision No: R00
183380Envirolab Reference: Page | 1 of 20

Client Reference: Albemarle LEAF TESTs
<0.02<0.02<0.02<0.02<0.02mg/LNickel in Eluate
<0.0005<0.0005<0.0005<0.0005<0.0005mg/LMercury in Eluate
0.240.270.270.390.37mg/LLithium in Eluate
<0.03<0.03<0.03<0.03<0.03mg/LLead in Eluate
<0.01<0.01<0.01<0.01<0.01mg/LCadmium in Eluate
<0.01<0.01<0.01<0.01<0.01mg/LBeryllium in Eluate
02/02/201830/01/201830/01/201823/01/201823/01/2018-Date analysed
02/02/201830/01/201830/01/201823/01/201823/01/2018-Date extracted
Soil - Talings Eluate Analysis
Soil - Talings Eluate Analysis
Soil - Talings Eluate Analysis
Soil - Talings Eluate Analysis
Soil - Talings Eluate Analysis
Type of sample
RB01 1314 T06RB01 1314 T05RB01 1314 T04RB01 1314 T03RB01 1314 T02UNITSYour Reference
183380-15183380-14183380-13183380-12183380-11Our Reference
Metals in Eluates
<0.020.60.3<0.02<0.02mg/LNickel in Eluate
<0.0005<0.0005<0.0005<0.0005<0.0005mg/LMercury in Eluate
0.364.31.80.190.08mg/LLithium in Eluate
<0.03<0.03<0.03<0.03<0.03mg/LLead in Eluate
<0.010.030.02<0.01<0.01mg/LCadmium in Eluate
<0.012.40.04<0.01<0.01mg/LBeryllium in Eluate
23/01/201823/01/201823/01/201823/01/201823/01/2018-Date analysed
23/01/201823/01/201823/01/201823/01/201823/01/2018-Date extracted
Soil - Talings Eluate Analysis
Soil - Talings Eluate Analysis
Soil - Talings Eluate Analysis
Soil - Talings Eluate Analysis
Soil - Talings Eluate Analysis
Type of sample
RB01 1314 T01RB01 1313 T09 target pH 2.0
RB01 1313 T08 target pH 4.0
RB01 1313 T07 target pH 5.5
RB01 1313 T06 target pH natural
UNITSYour Reference
183380-10183380-9183380-8183380-7183380-6Our Reference
Metals in Eluates
<0.02<0.02<0.02<0.02<0.02mg/LNickel in Eluate
<0.0005<0.0005<0.0005<0.0005<0.0005mg/LMercury in Eluate
0.080.050.02<0.01<0.01mg/LLithium in Eluate
<0.03<0.03<0.03<0.03<0.03mg/LLead in Eluate
<0.01<0.01<0.01<0.01<0.01mg/LCadmium in Eluate
<0.01<0.01<0.01<0.01<0.01mg/LBeryllium in Eluate
23/01/201823/01/201823/01/201823/01/201823/01/2018-Date analysed
23/01/201823/01/201823/01/201823/01/201823/01/2018-Date extracted
Soil - Talings Eluate Analysis
Soil - Talings Eluate Analysis
Soil - Talings Eluate Analysis
Soil - Talings Eluate Analysis
Soil - Talings Eluate Analysis
Type of sample
RB01 1313 T05 target pH 8.0
RB01 1313 T04 target pH 9.0
RB01 1313 T03 target pH 10.5
RB01 1313 T02 target pH 12
RB01 1313 T01 target pH 13
UNITSYour Reference
183380-5183380-4183380-3183380-2183380-1Our Reference
Metals in Eluates
Envirolab Reference: 183380
R00Revision No:
Page | 2 of 20

Client Reference: Albemarle LEAF TESTs
<0.02<0.02<0.02<0.02<0.02mg/LNickel in Eluate
<0.0005<0.0005<0.0005<0.0005<0.0005mg/LMercury in Eluate
0.110.090.070.170.17mg/LLithium in Eluate
<0.03<0.03<0.03<0.03<0.03mg/LLead in Eluate
<0.01<0.01<0.01<0.01<0.01mg/LCadmium in Eluate
<0.01<0.01<0.01<0.01<0.01mg/LBeryllium in Eluate
23/01/201823/01/201823/01/201826/03/201813/03/2018-Date analysed
23/01/201823/01/201823/01/201826/03/201813/03/2018-Date extracted
Soil - Talings Eluate Analysis
Soil - Talings Eluate Analysis
Soil - Talings Eluate Analysis
Soil - Talings Eluate Analysis
Soil - Talings Eluate Analysis
Type of sample
RB01 1316 T03 target L/S 2
RB01 1316 T02 target L/S 5
RB01 1316 T01 target L/S 10
RB01 1315 T09RB01 1315 T08UNITSYour Reference
183380-30183380-29183380-28183380-27183380-26Our Reference
Metals in Eluates
<0.02<0.02<0.02<0.02<0.02mg/LNickel in Eluate
<0.0005<0.0005<0.0005<0.0005<0.0005mg/LMercury in Eluate
0.200.150.100.200.24mg/LLithium in Eluate
<0.03<0.03<0.03<0.03<0.03mg/LLead in Eluate
<0.01<0.01<0.01<0.01<0.01mg/LCadmium in Eluate
<0.01<0.01<0.01<0.01<0.01mg/LBeryllium in Eluate
06/03/201819/02/201805/02/201830/01/201825/01/2018-Date analysed
06/03/201819/02/201805/02/201830/01/201825/01/2018-Date extracted
Soil - Talings Eluate Analysis
Soil - Talings Eluate Analysis
Soil - Talings Eluate Analysis
Soil - Talings Eluate Analysis
Soil - Talings Eluate Analysis
Type of sample
RB01 1315 T07RB01 1315 T06RB01 1315 T05RB01 1315 T04RB01 1315 T03UNITSYour Reference
183380-25183380-24183380-23183380-22183380-21Our Reference
Metals in Eluates
<0.02<0.02<0.02<0.02<0.02mg/LNickel in Eluate
<0.0005<0.0005<0.0005<0.0005<0.0005mg/LMercury in Eluate
0.280.170.140.160.18mg/LLithium in Eluate
<0.03<0.03<0.03<0.03<0.03mg/LLead in Eluate
<0.01<0.01<0.01<0.01<0.01mg/LCadmium in Eluate
<0.01<0.01<0.01<0.01<0.01mg/LBeryllium in Eluate
25/01/201825/01/201808/02/201807/02/201802/02/2018-Date analysed
25/01/201825/01/201808/02/201807/02/201802/02/2018-Date extracted
Soil - Talings Eluate Analysis
Soil - Talings Eluate Analysis
Soil - Talings Eluate Analysis
Soil - Talings Eluate Analysis
Soil - Talings Eluate Analysis
Type of sample
RB01 1315 T02RB01 1315 T01RB01 1314 T09RB01 1314 T08RB01 1314 T07UNITSYour Reference
183380-20183380-19183380-18183380-17183380-16Our Reference
Metals in Eluates
Envirolab Reference: 183380
R00Revision No:
Page | 3 of 20

Client Reference: Albemarle LEAF TESTs
<0.02mg/LNickel in Eluate
<0.0005mg/LMercury in Eluate
<0.01mg/LLithium in Eluate
<0.03mg/LLead in Eluate
<0.01mg/LCadmium in Eluate
<0.01mg/LBeryllium in Eluate
23/01/2018-Date analysed
23/01/2018-Date extracted
EluateType of sample
LEAF 1316 Blank DI Water
UNITSYour Reference
183380-36Our Reference
Metals in Eluates
<0.02<0.02<0.02<0.02<0.02mg/LNickel in Eluate
<0.0005<0.0005<0.0005<0.0005<0.0005mg/LMercury in Eluate
<0.01<0.01<0.010.110.13mg/LLithium in Eluate
<0.03<0.03<0.03<0.03<0.03mg/LLead in Eluate
<0.01<0.01<0.01<0.01<0.01mg/LCadmium in Eluate
<0.01<0.01<0.01<0.01<0.01mg/LBeryllium in Eluate
23/01/201823/01/201823/01/201823/01/201823/01/2018-Date analysed
23/01/201823/01/201823/01/201823/01/201823/01/2018-Date extracted
EluateEluateEluateSoil - Talings Eluate Analysis
Soil - Talings Eluate Analysis
Type of sample
LEAF 1313 Blank Base
LEAF 1313 Blank Acid
LEAF 1313 Blank DI Water
RB01 1316 T05 target L/S 0.5
RB01 1316 T04 target L/S 1
UNITSYour Reference
183380-35183380-34183380-33183380-32183380-31Our Reference
Metals in Eluates
Envirolab Reference: 183380
R00Revision No:
Page | 4 of 20
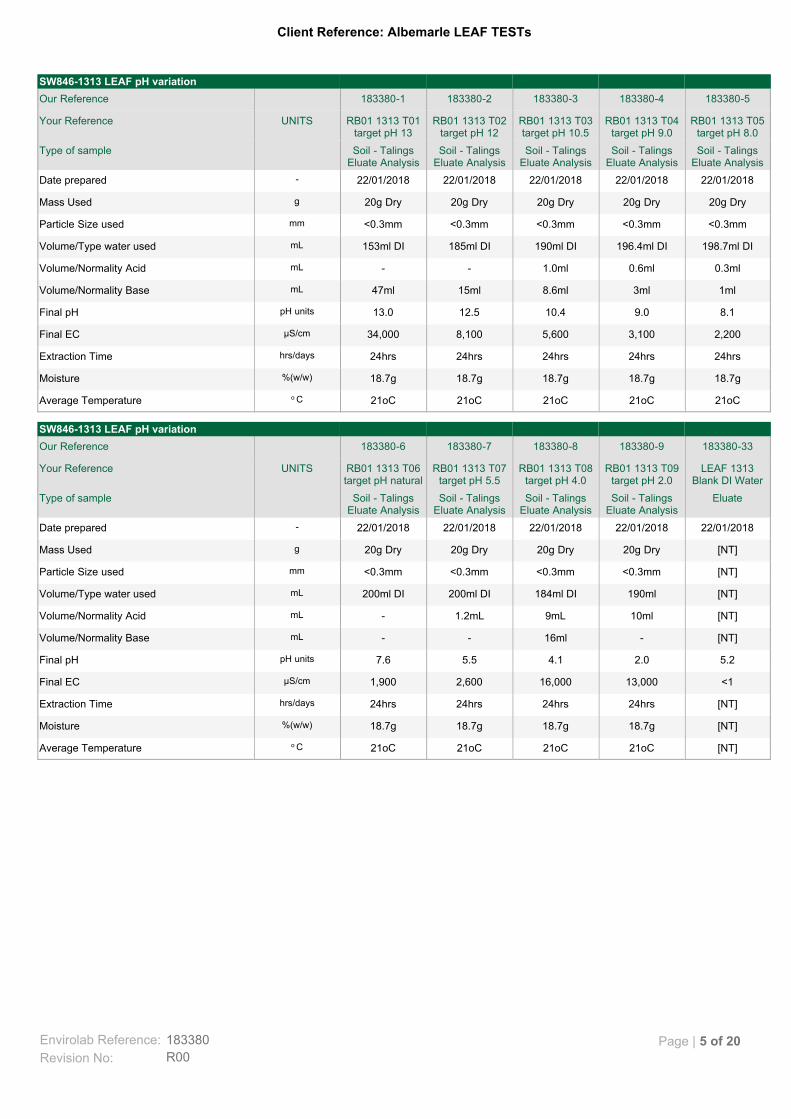
Client Reference: Albemarle LEAF TESTs
[NT]21oC21oC21oC21oCo CAverage Temperature
[NT]18.7g18.7g18.7g18.7g%(w/w)Moisture
[NT]24hrs24hrs24hrs24hrshrs/daysExtraction Time
<113,00016,0002,6001,900µS/cmFinal EC
5.22.04.15.57.6pH unitsFinal pH
[NT]-16ml--mLVolume/Normality Base
[NT]10ml9mL1.2mL-mLVolume/Normality Acid
[NT]190ml184ml DI200ml DI200ml DImLVolume/Type water used
[NT]<0.3mm<0.3mm<0.3mm<0.3mmmmParticle Size used
[NT]20g Dry20g Dry20g Dry20g DrygMass Used
22/01/201822/01/201822/01/201822/01/201822/01/2018-Date prepared
EluateSoil - Talings Eluate Analysis
Soil - Talings Eluate Analysis
Soil - Talings Eluate Analysis
Soil - Talings Eluate Analysis
Type of sample
LEAF 1313 Blank DI Water
RB01 1313 T09 target pH 2.0
RB01 1313 T08 target pH 4.0
RB01 1313 T07 target pH 5.5
RB01 1313 T06 target pH natural
UNITSYour Reference
183380-33183380-9183380-8183380-7183380-6Our Reference
SW846-1313 LEAF pH variation
21oC21oC21oC21oC21oCo CAverage Temperature
18.7g18.7g18.7g18.7g18.7g%(w/w)Moisture
24hrs24hrs24hrs24hrs24hrshrs/daysExtraction Time
2,2003,1005,6008,10034,000µS/cmFinal EC
8.19.010.412.513.0pH unitsFinal pH
1ml3ml8.6ml15ml47mlmLVolume/Normality Base
0.3ml0.6ml1.0ml--mLVolume/Normality Acid
198.7ml DI196.4ml DI190ml DI185ml DI153ml DImLVolume/Type water used
<0.3mm<0.3mm<0.3mm<0.3mm<0.3mmmmParticle Size used
20g Dry20g Dry20g Dry20g Dry20g DrygMass Used
22/01/201822/01/201822/01/201822/01/201822/01/2018-Date prepared
Soil - Talings Eluate Analysis
Soil - Talings Eluate Analysis
Soil - Talings Eluate Analysis
Soil - Talings Eluate Analysis
Soil - Talings Eluate Analysis
Type of sample
RB01 1313 T05 target pH 8.0
RB01 1313 T04 target pH 9.0
RB01 1313 T03 target pH 10.5
RB01 1313 T02 target pH 12
RB01 1313 T01 target pH 13
UNITSYour Reference
183380-5183380-4183380-3183380-2183380-1Our Reference
SW846-1313 LEAF pH variation
Envirolab Reference: 183380
R00Revision No:
Page | 5 of 20
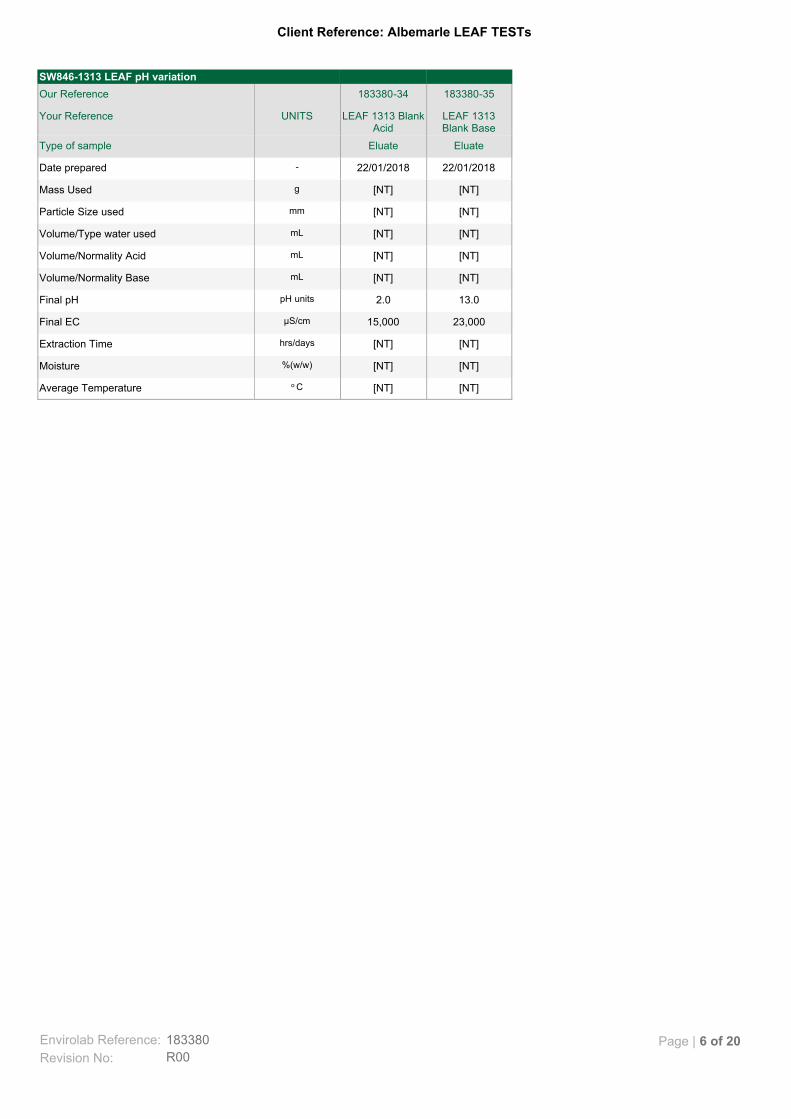
Client Reference: Albemarle LEAF TESTs
[NT][NT]o CAverage Temperature
[NT][NT]%(w/w)Moisture
[NT][NT]hrs/daysExtraction Time
23,00015,000µS/cmFinal EC
13.02.0pH unitsFinal pH
[NT][NT]mLVolume/Normality Base
[NT][NT]mLVolume/Normality Acid
[NT][NT]mLVolume/Type water used
[NT][NT]mmParticle Size used
[NT][NT]gMass Used
22/01/201822/01/2018-Date prepared
EluateEluateType of sample
LEAF 1313 Blank Base
LEAF 1313 Blank Acid
UNITSYour Reference
183380-35183380-34Our Reference
SW846-1313 LEAF pH variation
Envirolab Reference: 183380
R00Revision No:
Page | 6 of 20

Client Reference: Albemarle LEAF TESTs
21202121o CAverage Temperature
3142,8263141,570mLPercolation Volume (approx.)
13.25117.7513.2565.5hrsPercolation Time
2,1002,1002,2002,200µS/cmFraction EC
6.97.27.27.1pH unitsFractional pH
18.7%18.7%18.7%18.7%%(w/w)Moisture
772g (Wet)772g (Wet)772g (Wet)772g (Wet)gMass Used
48mm x 300mm48mm x 300mm48mm x 300mm48mm x 300mmmm D x mm H Packed Column Bed Dimensions
<2.36mm<2.36mm<2.36mm<2.36mmmmParticle Size used
07/02/201806/02/201830/01/201829/01/2018-Date prepared
Soil - Talings Eluate Analysis
Soil - Talings Eluate Analysis
Soil - Talings Eluate Analysis
Soil - Talings Eluate Analysis
Type of sample
RB01 1314 T09RB01 1314 T08RB01 1314 T07RB01 1314 T06UNITSYour Reference
183380-18183380-17183380-16183380-15Our Reference
SW846-1314 LEAF
2021222121o CAverage Temperature
314314314188126mLPercolation Volume (approx.)
13.2513.2513.257.755.25hrsPercolation Time
2,3002,2002,3002,3002,400µS/cmFraction EC
7.46.87.47.26.5pH unitsFractional pH
18.7%18.7%18.7%18.7%18.7%%(w/w)Moisture
772g (Wet)772g (Wet)772g (Wet)772g (Wet)772g (Wet)gMass Used
48mm x 300mm48mm x 300mm48mm x 300mm48mm x 300mm48mm x 300mmmm D x mm H Packed Column Bed Dimensions
<2.36mm<2.36mm<2.36mm<2.36mm<2.36mmmmParticle Size used
26/01/201825/01/201823/01/201822/01/201822/01/2018-Date prepared
Soil - Talings Eluate Analysis
Soil - Talings Eluate Analysis
Soil - Talings Eluate Analysis
Soil - Talings Eluate Analysis
Soil - Talings Eluate Analysis
Type of sample
RB01 1314 T05RB01 1314 T04RB01 1314 T03RB01 1314 T02RB01 1314 T01UNITSYour Reference
183380-14183380-13183380-12183380-11183380-10Our Reference
SW846-1314 LEAF
Envirolab Reference: 183380
R00Revision No:
Page | 7 of 20

Client Reference: Albemarle LEAF TESTs
7.37.67.77.2pH unitsElutriate Final pH
8906309501,100µS/cmElutriate Final EC
26/03/201812/03/201805/03/201819/02/2018--Elutriate Exchange Time/Day
477mls477mls477mls477mlsmLElutriate Volume Used
DI WaterDI WaterDI WaterDI Water--Elutriate Liquid Type
18.7%18.7%18.7%18.7%%(w/w)Moisture
1D 80mm x H 45mm
1D 80mm x H 45mm
1D 80mm x H 45mm
1D 80mm x H 45mm
mm D x mm H Geometry and Dimensions 3D or 1D
391g Wet391g Wet391g Wet391g WetgMass Used
Client SuppliedClient SuppliedClient SuppliedClient Supplied--Material Description
22/01/201822/01/201822/01/201822/01/2018-Date prepared
Soil - Talings Eluate Analysis
Soil - Talings Eluate Analysis
Soil - Talings Eluate Analysis
Soil - Talings Eluate Analysis
Type of sample
RB01 1315 T09RB01 1315 T08RB01 1315 T07RB01 1315 T06UNITSYour Reference
183380-27183380-26183380-25183380-24Our Reference
SW846-1315 LEAF Monolith
6.97.36.86.86.7pH unitsElutriate Final pH
1,2009401,9002,100530µS/cmElutriate Final EC
05/02/201829/01/201824/01/201823/01/201822/01/2018--Elutriate Exchange Time/Day
477mls477mls477mls477mls477mlsmLElutriate Volume Used
DI WaterDI WaterDI WaterDI WaterDI Water--Elutriate Liquid Type
18.7%18.7%18.7%18.7%18.7%%(w/w)Moisture
1D 80mm x H 45mm
1D 80mm x H 45mm
1D 80mm x H 45mm
1D 80mm x H 45mm
1D 80mm x H 45mm
mm D x mm H Geometry and Dimensions 3D or 1D
391g Wet391g Wet391g Wet391g Wet391g WetgMass Used
Client SuppliedClient SuppliedClient SuppliedClient SuppliedClient Supplied--Material Description
22/01/201822/01/201822/01/201822/01/201822/01/2018-Date prepared
Soil - Talings Eluate Analysis
Soil - Talings Eluate Analysis
Soil - Talings Eluate Analysis
Soil - Talings Eluate Analysis
Soil - Talings Eluate Analysis
Type of sample
RB01 1315 T05RB01 1315 T04RB01 1315 T03RB01 1315 T02RB01 1315 T01UNITSYour Reference
183380-23183380-22183380-21183380-20183380-19Our Reference
SW846-1315 LEAF Monolith
Envirolab Reference: 183380
R00Revision No:
Page | 8 of 20

Client Reference: Albemarle LEAF TESTs
21oCo CAverage Temperature
7.4pH unitsFinal pH
<1µS/cmFinal EC
[NT]hrs/daysExtraction Time
[NT]%(w/w)Moisture
Di Water--Elutriate Fluid
[NT]mLElutriate Volume Used
[NT]gMass Used
[NT]mL/g-dryTarget Liquid/Solid Ratio
[NT]mmParticle Size used
DI Water BLK--Solid Material Description
22/01/2018-Date prepared
EluateType of sample
LEAF 1316 Blank DI Water
UNITSYour Reference
183380-36Our Reference
SW846-1316 LEAF Liq/Solid variation
21oC21oC21oC21oC21oCo CAverage Temperature
INSUFF7.47.87.98.0pH unitsFinal pH
INSUFF2,6002,5002,4002,700µS/cmFinal EC
24Hrs24Hrs24Hrs24Hrs24Hrshrs/daysExtraction Time
18.7%18.7%18.7%18.7%18.7%%(w/w)Moisture
DI WaterDI WaterDI WaterDI WaterDI Water--Elutriate Fluid
200ml200ml200ml200ml200mlmLElutriate Volume Used
400g Dry200g Dry100g Dry40g Dry20g DrygMass Used
0.512510mL/g-dryTarget Liquid/Solid Ratio
<0.3mm<0.3mm<0.3mm<0.3mm<0.3mmmmParticle Size used
Client SuppliedClient SuppliedClient SuppliedClient SuppliedClient Supplied--Solid Material Description
22/01/201822/01/201822/01/201822/01/201822/01/2018-Date prepared
Soil - Talings Eluate Analysis
Soil - Talings Eluate Analysis
Soil - Talings Eluate Analysis
Soil - Talings Eluate Analysis
Soil - Talings Eluate Analysis
Type of sample
RB01 1316 T05 target L/S 0.5
RB01 1316 T04 target L/S 1
RB01 1316 T03 target L/S 2
RB01 1316 T02 target L/S 5
RB01 1316 T01 target L/S 10
UNITSYour Reference
183380-32183380-31183380-30183380-29183380-28Our Reference
SW846-1316 LEAF Liq/Solid variation
Envirolab Reference: 183380
R00Revision No:
Page | 9 of 20

Client Reference: Albemarle LEAF TESTs
Determination of Mercury by Cold Vapour AAS. Metals-021 CV-AAS
Determination of various metals by ICP-AES. Metals-020 ICP-AES
Leaching Environment Assessment Framework (LEAF) methods of leaching using USEPA methods SW846 1313, 1314, 1315 or 1316. All eluates are filtered through 0.45um prior to analysis unless otherwise noted. Please note the 1315 is not currently designed for Organic Analyses, however, the method is being used for SVOCs in the US at present.
INORG-125Methodology SummaryMethod ID
Envirolab Reference: 183380
R00Revision No:
Page | 10 of 20
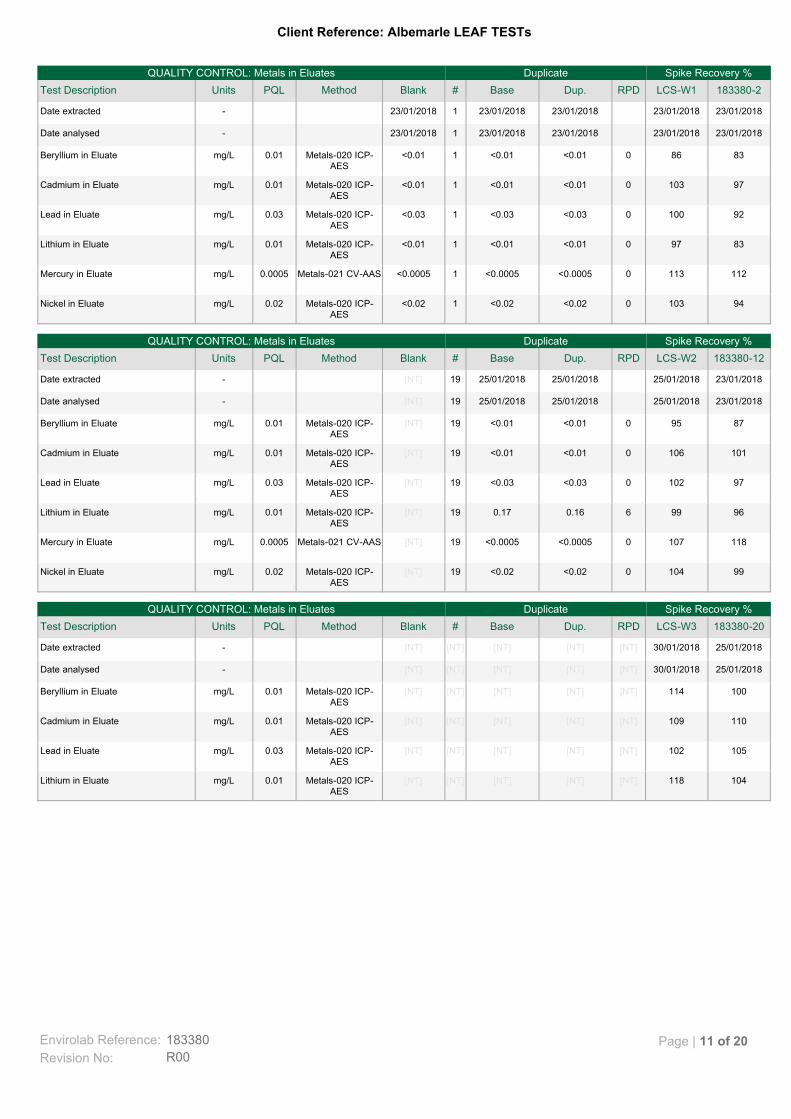
Client Reference: Albemarle LEAF TESTs
104118[NT][NT][NT][NT][NT]Metals-020 ICP-AES
0.01mg/LLithium in Eluate
105102[NT][NT][NT][NT][NT]Metals-020 ICP-AES
0.03mg/LLead in Eluate
110109[NT][NT][NT][NT][NT]Metals-020 ICP-AES
0.01mg/LCadmium in Eluate
100114[NT][NT][NT][NT][NT]Metals-020 ICP-AES
0.01mg/LBeryllium in Eluate
25/01/201830/01/2018[NT][NT][NT][NT][NT]-Date analysed
25/01/201830/01/2018[NT][NT][NT][NT][NT]-Date extracted
183380-20LCS-W3RPDDup.Base#BlankMethodPQLUnitsTest Description
Spike Recovery %DuplicateQUALITY CONTROL: Metals in Eluates
991040<0.02<0.0219[NT]Metals-020 ICP-AES
0.02mg/LNickel in Eluate
1181070<0.0005<0.000519[NT]Metals-021 CV-AAS0.0005mg/LMercury in Eluate
969960.160.1719[NT]Metals-020 ICP-AES
0.01mg/LLithium in Eluate
971020<0.03<0.0319[NT]Metals-020 ICP-AES
0.03mg/LLead in Eluate
1011060<0.01<0.0119[NT]Metals-020 ICP-AES
0.01mg/LCadmium in Eluate
87950<0.01<0.0119[NT]Metals-020 ICP-AES
0.01mg/LBeryllium in Eluate
23/01/201825/01/201825/01/201825/01/201819[NT]-Date analysed
23/01/201825/01/201825/01/201825/01/201819[NT]-Date extracted
183380-12LCS-W2RPDDup.Base#BlankMethodPQLUnitsTest Description
Spike Recovery %DuplicateQUALITY CONTROL: Metals in Eluates
941030<0.02<0.021<0.02Metals-020 ICP-AES
0.02mg/LNickel in Eluate
1121130<0.0005<0.00051<0.0005Metals-021 CV-AAS0.0005mg/LMercury in Eluate
83970<0.01<0.011<0.01Metals-020 ICP-AES
0.01mg/LLithium in Eluate
921000<0.03<0.031<0.03Metals-020 ICP-AES
0.03mg/LLead in Eluate
971030<0.01<0.011<0.01Metals-020 ICP-AES
0.01mg/LCadmium in Eluate
83860<0.01<0.011<0.01Metals-020 ICP-AES
0.01mg/LBeryllium in Eluate
23/01/201823/01/201823/01/201823/01/2018123/01/2018-Date analysed
23/01/201823/01/201823/01/201823/01/2018123/01/2018-Date extracted
183380-2LCS-W1RPDDup.Base#BlankMethodPQLUnitsTest Description
Spike Recovery %DuplicateQUALITY CONTROL: Metals in Eluates
Envirolab Reference: 183380
R00Revision No:
Page | 11 of 20

Client Reference: Albemarle LEAF TESTs
[NT]113[NT][NT][NT][NT][NT]Metals-020 ICP-AES
0.02mg/LNickel in Eluate
[NT]98[NT][NT][NT][NT][NT]Metals-021 CV-AAS0.0005mg/LMercury in Eluate
[NT]105[NT][NT][NT][NT][NT]Metals-020 ICP-AES
0.01mg/LLithium in Eluate
[NT]113[NT][NT][NT][NT][NT]Metals-020 ICP-AES
0.03mg/LLead in Eluate
[NT]103[NT][NT][NT][NT][NT]Metals-020 ICP-AES
0.01mg/LCadmium in Eluate
[NT]115[NT][NT][NT][NT][NT]Metals-020 ICP-AES
0.01mg/LBeryllium in Eluate
[NT]05/02/2018[NT][NT][NT][NT][NT]-Date analysed
[NT]05/02/2018[NT][NT][NT][NT][NT]-Date extracted
[NT]LCS-W5RPDDup.Base#BlankMethodPQLUnitsTest Description
Spike Recovery %DuplicateQUALITY CONTROL: Metals in Eluates
[NT]98[NT][NT][NT][NT][NT]Metals-020 ICP-AES
0.02mg/LNickel in Eluate
[NT]107[NT][NT][NT][NT][NT]Metals-021 CV-AAS0.0005mg/LMercury in Eluate
[NT]94[NT][NT][NT][NT][NT]Metals-020 ICP-AES
0.01mg/LLithium in Eluate
[NT]95[NT][NT][NT][NT][NT]Metals-020 ICP-AES
0.03mg/LLead in Eluate
[NT]102[NT][NT][NT][NT][NT]Metals-020 ICP-AES
0.01mg/LCadmium in Eluate
[NT]98[NT][NT][NT][NT][NT]Metals-020 ICP-AES
0.01mg/LBeryllium in Eluate
[NT]02/02/2018[NT][NT][NT][NT][NT]-Date analysed
[NT]02/02/2018[NT][NT][NT][NT][NT]-Date extracted
[NT]LCS-W4RPDDup.Base#BlankMethodPQLUnitsTest Description
Spike Recovery %DuplicateQUALITY CONTROL: Metals in Eluates
108104[NT][NT][NT][NT][NT]Metals-020 ICP-AES
0.02mg/LNickel in Eluate
105104[NT][NT][NT][NT][NT]Metals-021 CV-AAS0.0005mg/LMercury in Eluate
183380-20LCS-W3RPDDup.Base#BlankMethodPQLUnitsTest Description
Spike Recovery %DuplicateQUALITY CONTROL: Metals in Eluates
Envirolab Reference: 183380
R00Revision No:
Page | 12 of 20

Client Reference: Albemarle LEAF TESTs
[NT]105[NT][NT][NT][NT][NT]Metals-020 ICP-AES
0.01mg/LLithium in Eluate
[NT]97[NT][NT][NT][NT][NT]Metals-020 ICP-AES
0.03mg/LLead in Eluate
[NT]95[NT][NT][NT][NT][NT]Metals-020 ICP-AES
0.01mg/LCadmium in Eluate
[NT]94[NT][NT][NT][NT][NT]Metals-020 ICP-AES
0.01mg/LBeryllium in Eluate
[NT]19/02/2018[NT][NT][NT][NT][NT]-Date analysed
[NT]19/02/2018[NT][NT][NT][NT][NT]-Date extracted
[NT]LCS-W8RPDDup.Base#BlankMethodPQLUnitsTest Description
Spike Recovery %DuplicateQUALITY CONTROL: Metals in Eluates
[NT]95[NT][NT][NT][NT][NT]Metals-020 ICP-AES
0.02mg/LNickel in Eluate
[NT]94[NT][NT][NT][NT][NT]Metals-021 CV-AAS0.0005mg/LMercury in Eluate
[NT]120[NT][NT][NT][NT][NT]Metals-020 ICP-AES
0.01mg/LLithium in Eluate
[NT]92[NT][NT][NT][NT][NT]Metals-020 ICP-AES
0.03mg/LLead in Eluate
[NT]101[NT][NT][NT][NT][NT]Metals-020 ICP-AES
0.01mg/LCadmium in Eluate
[NT]90[NT][NT][NT][NT][NT]Metals-020 ICP-AES
0.01mg/LBeryllium in Eluate
[NT]08/02/2018[NT][NT][NT][NT][NT]-Date analysed
[NT]08/02/2018[NT][NT][NT][NT][NT]-Date extracted
[NT]LCS-W7RPDDup.Base#BlankMethodPQLUnitsTest Description
Spike Recovery %DuplicateQUALITY CONTROL: Metals in Eluates
[NT]103[NT][NT][NT][NT][NT]Metals-020 ICP-AES
0.02mg/LNickel in Eluate
[NT]103[NT][NT][NT][NT][NT]Metals-021 CV-AAS0.0005mg/LMercury in Eluate
[NT]95[NT][NT][NT][NT][NT]Metals-020 ICP-AES
0.01mg/LLithium in Eluate
[NT]101[NT][NT][NT][NT][NT]Metals-020 ICP-AES
0.03mg/LLead in Eluate
[NT]108[NT][NT][NT][NT][NT]Metals-020 ICP-AES
0.01mg/LCadmium in Eluate
[NT]98[NT][NT][NT][NT][NT]Metals-020 ICP-AES
0.01mg/LBeryllium in Eluate
[NT]07/02/2018[NT][NT][NT][NT][NT]-Date analysed
[NT]07/02/2018[NT][NT][NT][NT][NT]-Date extracted
[NT]LCS-W6RPDDup.Base#BlankMethodPQLUnitsTest Description
Spike Recovery %DuplicateQUALITY CONTROL: Metals in Eluates
Envirolab Reference: 183380
R00Revision No:
Page | 13 of 20

Client Reference: Albemarle LEAF TESTs
[NT]96[NT][NT][NT][NT][NT]Metals-020 ICP-AES
0.02mg/LNickel in Eluate
[NT]97[NT][NT][NT][NT][NT]Metals-021 CV-AAS0.0005mg/LMercury in Eluate
[NT]100[NT][NT][NT][NT][NT]Metals-020 ICP-AES
0.01mg/LLithium in Eluate
[NT]96[NT][NT][NT][NT][NT]Metals-020 ICP-AES
0.03mg/LLead in Eluate
[NT]93[NT][NT][NT][NT][NT]Metals-020 ICP-AES
0.01mg/LCadmium in Eluate
[NT]95[NT][NT][NT][NT][NT]Metals-020 ICP-AES
0.01mg/LBeryllium in Eluate
[NT]13/03/2018[NT][NT][NT][NT][NT]-Date analysed
[NT]13/03/2018[NT][NT][NT][NT][NT]-Date extracted
[NT]LCS-W10RPDDup.Base#BlankMethodPQLUnitsTest Description
Spike Recovery %DuplicateQUALITY CONTROL: Metals in Eluates
[NT]96[NT][NT][NT][NT][NT]Metals-020 ICP-AES
0.02mg/LNickel in Eluate
[NT]98[NT][NT][NT][NT][NT]Metals-021 CV-AAS0.0005mg/LMercury in Eluate
[NT]103[NT][NT][NT][NT][NT]Metals-020 ICP-AES
0.01mg/LLithium in Eluate
[NT]96[NT][NT][NT][NT][NT]Metals-020 ICP-AES
0.03mg/LLead in Eluate
[NT]94[NT][NT][NT][NT][NT]Metals-020 ICP-AES
0.01mg/LCadmium in Eluate
[NT]93[NT][NT][NT][NT][NT]Metals-020 ICP-AES
0.01mg/LBeryllium in Eluate
[NT]06/03/2018[NT][NT][NT][NT][NT]-Date analysed
[NT]06/03/2018[NT][NT][NT][NT][NT]-Date extracted
[NT]LCS-W9RPDDup.Base#BlankMethodPQLUnitsTest Description
Spike Recovery %DuplicateQUALITY CONTROL: Metals in Eluates
[NT]97[NT][NT][NT][NT][NT]Metals-020 ICP-AES
0.02mg/LNickel in Eluate
[NT]95[NT][NT][NT][NT][NT]Metals-021 CV-AAS0.0005mg/LMercury in Eluate
[NT]LCS-W8RPDDup.Base#BlankMethodPQLUnitsTest Description
Spike Recovery %DuplicateQUALITY CONTROL: Metals in Eluates
Envirolab Reference: 183380
R00Revision No:
Page | 14 of 20

Client Reference: Albemarle LEAF TESTs
[NT]104[NT][NT][NT][NT][NT]Metals-020 ICP-AES
0.02mg/LNickel in Eluate
[NT]97[NT][NT][NT][NT][NT]Metals-021 CV-AAS0.0005mg/LMercury in Eluate
[NT]103[NT][NT][NT][NT][NT]Metals-020 ICP-AES
0.01mg/LLithium in Eluate
[NT]102[NT][NT][NT][NT][NT]Metals-020 ICP-AES
0.03mg/LLead in Eluate
[NT]100[NT][NT][NT][NT][NT]Metals-020 ICP-AES
0.01mg/LCadmium in Eluate
[NT]97[NT][NT][NT][NT][NT]Metals-020 ICP-AES
0.01mg/LBeryllium in Eluate
[NT]26/03/2018[NT][NT][NT][NT][NT]-Date analysed
[NT]26/03/2018[NT][NT][NT][NT][NT]-Date extracted
[NT]LCS-W11RPDDup.Base#BlankMethodPQLUnitsTest Description
Spike Recovery %DuplicateQUALITY CONTROL: Metals in Eluates
Envirolab Reference: 183380
R00Revision No:
Page | 15 of 20
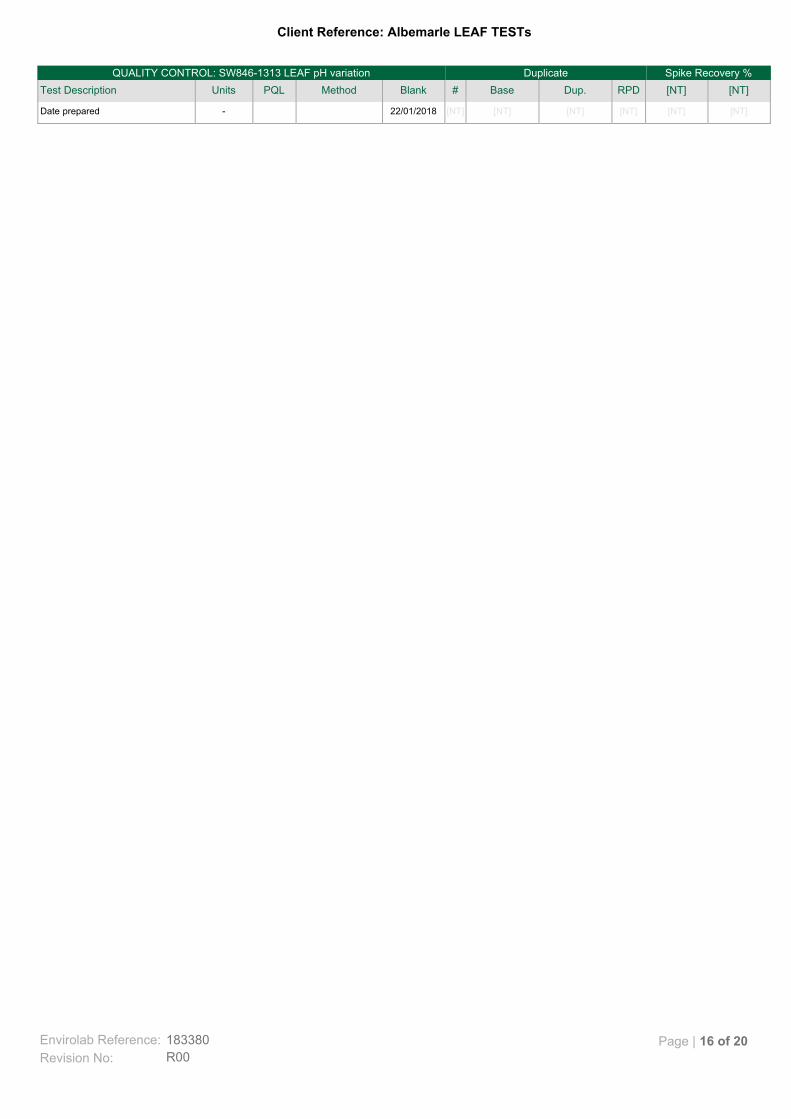
Client Reference: Albemarle LEAF TESTs
[NT][NT][NT][NT][NT][NT]22/01/2018-Date prepared
[NT][NT]RPDDup.Base#BlankMethodPQLUnitsTest Description
Spike Recovery %DuplicateQUALITY CONTROL: SW846-1313 LEAF pH variation
Envirolab Reference: 183380
R00Revision No:
Page | 16 of 20

Client Reference: Albemarle LEAF TESTs
[NT][NT][NT][NT][NT][NT]22/01/2018-Date prepared
[NT][NT]RPDDup.Base#BlankMethodPQLUnitsTest Description
Spike Recovery %DuplicateQUALITY CONTROL: SW846-1316 LEAF Liq/Solid variation
Envirolab Reference: 183380
R00Revision No:
Page | 17 of 20

Client Reference: Albemarle LEAF TESTs
Not ReportedNRNational Environmental Protection MeasureNEPMNot specifiedNSLaboratory Control SampleLCSRelative Percent DifferenceRPDGreater than>Less than<Practical Quantitation LimitPQLInsufficient sample for this testINSTest not requiredNANot testedNT
Result Definitions
Australian Drinking Water Guidelines recommend that Thermotolerant Coliform, Faecal Enterococci, & E.Coli levels are less than1cfu/100mL. The recommended maximums are taken from "Australian Drinking Water Guidelines", published by NHMRC & ARMC2011.
Surrogates are known additions to each sample, blank, matrix spike and LCS in a batch, of compounds whichare similar to the analyte of interest, however are not expected to be found in real samples.
Surrogate Spike
This comprises either a standard reference material or a control matrix (such as a blank sand or water) fortifiedwith analytes representative of the analyte class. It is simply a check sample.
LCS (LaboratoryControl Sample)
A portion of the sample is spiked with a known concentration of target analyte. The purpose of the matrix spikeis to monitor the performance of the analytical method used and to determine whether matrix interferencesexist.
Matrix Spike
This is the complete duplicate analysis of a sample from the process batch. If possible, the sample selectedshould be one where the analyte concentration is easily measurable.
Duplicate
This is the component of the analytical signal which is not derived from the sample but from reagents,glassware etc, can be determined by processing solvents and reagents in exactly the same manner as forsamples.
Blank
Quality Control Definitions
Envirolab Reference: 183380
R00Revision No:
Page | 18 of 20

Client Reference: Albemarle LEAF TESTs
Measurement Uncertainty estimates are available for most tests upon request.
Where sampling dates are not provided, Envirolab are not in a position to comment on the validity of the analysis whererecommended technical holding times may have been breached.
When samples are received where certain analytes are outside of recommended technical holding times (THTs), the analysis hasproceeded. Where analytes are on the verge of breaching THTs, every effort will be made to analyse within the THT or as soon aspracticable.
In circumstances where no duplicate and/or sample spike has been reported at 1 in 10 and/or 1 in 20 samples respectively, thesample volume submitted was insufficient in order to satisfy laboratory QA/QC protocols.
Matrix Spikes, LCS and Surrogate recoveries: Generally 70-130% for inorganics/metals; 60-140% for organics (+/-50% surrogates)and 10-140% for labile SVOCs (including labile surrogates), ultra trace organics and speciated phenols is acceptable.
Duplicates: <5xPQL - any RPD is acceptable; >5xPQL - 0-50% RPD is acceptable.
For VOCs in water samples, three vials are required for duplicate or spike analysis.
Spikes for Physical and Aggregate Tests are not applicable.
Filters, swabs, wipes, tubes and badges will not have duplicate data as the whole sample is generally extracted during sampleextraction.
Duplicate sample and matrix spike recoveries may not be reported on smaller jobs, however, were analysed at a frequency to meetor exceed NEPM requirements. All samples are tested in batches of 20. The duplicate sample RPD and matrix spike recoveries forthe batch were within the laboratory acceptance criteria.
Laboratory Acceptance Criteria
Envirolab Reference: 183380
R00Revision No:
Page | 19 of 20

Client Reference: Albemarle LEAF TESTs
INSUFF = Insufficient liquid could be seperated from the 2:1 S/L leachate for pH and EC analysis.
Report Comments
Envirolab Reference: 183380
R00Revision No:
Page | 20 of 20

Koolyanobbing Range C In-pit TSF Design Report
APPENDIX 3 – XSTP Lithium Hydroxide Tailings Characteristics

Xstract – Excellence from the outset
XstractGroup.com
Level 2, 50 St Georges Terrace, PERTH WA 6000 | PO Box Z5426, PERTH WA 6831
T +61 8 9327 9500 | F +61 8 9481 8700 | Xstract Mining Consultants Pty Ltd | ABN 62 129 791 279
16 April 2018
Ref: XSTP17047
Rudi Seebach
Senior Environmental Scientist
Environment & Health
Ramboll Environ Australia Pty Ltd
Level 2, 200 Adelaide Terrace,
East Perth WA 6004,
Australia
Dear Rudi
Re: Lithium Tailings Characterisation, Dry Stacked Tailings –
Laboratory Testing Results
Ramboll Environ Australia Pty Ltd (“Ramboll”) is undertaking environmental consultancy for
Albemarle Australia Pty Ltd (“Albermarle”) on plans to build a Lithium Processing Facility located
in Kemerton, Western Australia.
As part of the characterisation of the proposed tailings there are geotechnical testing
requirements that Ramboll requested Xstract’s assistance with; specifically in sampling
methodology, test scheduling, and management of the testing laboratory. Ramboll
commissioned Xstract via a subcontractor agreement and work order in October 2017. No
factual or interpretive reporting of the results was commissioned. This letter presents the
results of the laboratory testing undertaken.
The proposed tailings storage facility comprises a conceptual design for dry stacking of the
tailings in dedicated cells at the Cleanaway Waste Management Ltd (“Cleanaway”) Class 3
landfill site at Banksia Road, Crooked Brook, in the shire of Dardanup.
Tailings samples were collected from an existing plant in China processing the same ore by
Ramboll. Xstract, with the assistance of Ramboll, arranged the export of approximately 200 kg
of tailings samples by sea from China to Trilab Pty Ltd’s (“Trilab”) laboratory in Brisbane,
Australia, for testing. Export of the samples was originally planned by air freight but due to
complications with China’s customs authorities, samples were dispatched via sea freight. Extra
testing of the samples at the port were required to confirm; that the composition of the tailings
samples were as described, that there were no valuable minerals in the tailings and that the
tailings were not a hazardous substance.
Trilab subsampled and transported a small volume of the tailings material to the University of
Western Australia’s geotechnical laboratory to undertake monotonic and cyclic simple shear
testing, a very specialised test only undertaken at a limited number of laboratories globally.
In addition to the 200 kg of tailings samples exported by Xstract, Ramboll also exported some
smaller samples by air freight for environmental testing.
navarke
EXT-ALB-REP-0006_0

Lithium Tailings Characterisation, Dry Stacked Tailings – Laboratory Testing Results | Ramboll Environ
Australia Pty Ltd
16 April 2018 2
Geotechnical laboratory testing was undertaken on a combination of the remainder of the
environmental samples (after completion of the environmental testing by Ramboll) and the 200
kg of samples exported by Xstract. Test selection was completed after a period of consultation
to confirm the specific testing requirements with Albermarle and the proposed facility
operator/owner, Cleanaway.
A single round of testing was completed on the environmental samples and two additional
rounds of testing were completed on the 200 kg sample (excluding simple shear testing where
only a single round of testing was completed as directed by Albemarle). After completion of
this testing the remainder of the samples are being stored, at no additional charge, for 3 months
by Trilab. It is understood that Ramboll will be commissioning Trilab directly to store the
samples for a further 12 months.
The laboratory testing completed is presented in Table 1 and the laboratory test results
certificates are presented in Appendix A.

Lithium Tailings Characterisation, Dry Stacked Tailings – Laboratory Testing Results | Ramboll Environ
Australia Pty Ltd
16 April 2018 3
Table 1 – Completed Laboratory Testing
Laboratory Testing Standard (Where Applicable) Quantity
Moisture Content AS1289 2.1.1 (Loss on Drying - Water
content via mass loss at 105 C) 3
Particle Size Distribution with
Hydrometer AS1289 3.6.2 3
Atterberg Limits (4 point, including
Linear Shrinkage) AS1289 3.1.1, 3.2.1, 3.3.1, 3.4.1 3
MMDD / OMC - Compaction AS1289 5.2.1 3
Consolidation testing (7 stage full
consolidation) - Oedometer AS1289 6.6.1 3
Emerson Class - (piping potential) AS1289.3.8.1 3
Triaxial Testing - UU (unconsolidated,
undrained) - (elastic properties) -
multi stage
AS1289.6.4.1 3
Triaxial Testing - CU (consolidated,
undrained) - (elastic properties) -
multi stage
AS1289.6.4.2 3
Simple Shear (CIU, CAU monotonic
test)
Non-standard test (UWA test
procedure) 1
Simple Shear (CIU, CAU cyclic test) Non-standard test (UWA test
procedure) 1
Direct Shear (Drained and Undrained
Shear Strength) AS 1289.6.3.1 3
Hydraulic Conductivity - Falling Head AS 1289.6.7.2 (R2013) 3
Hydraulic Conductivity - Constant
Head AS 1289.6.7.3:2016 3
Specific Conductance – electrical AS 1289.4.4.1 3
Natural pH AS 1289 3.8.1, 4.3.1 3
Specific Gravity (Sg) AS1289 3.5.1 3
Aerated Bulk Density AS1141.4 Bulk Density –
Uncompacted& Compacted 3
Packed Bulk Density AS1141.4 Bulk Density –
Uncompacted& Compacted 3

Lithium Tailings Characterisation, Dry Stacked Tailings – Laboratory Testing Results | Ramboll Environ
Australia Pty Ltd
16 April 2018 4
Should you require any further assistance with the project please do not hesitate to contact the
undersigned with any queries.
Yours sincerely
Seb Norris
Principal Consultant – Geotechnical
Xstract Mining Consultants Pty Ltd
Telephone: +61 433 350 057
Fax: +61 8 9481 8700
Email: [email protected]
Attachment: Appendix A – Laboratory Test Results Certificates
Xstract – Excellence from the outset
XstractGroup.com
Level 2, 50 St Georges Terrace, PERTH WA 6000 | PO Box Z5426, PERTH WA 6831
T +61 8 9327 9500 | F +61 8 9481 8700 | Xstract Mining Consultants Pty Ltd | ABN 62 129 791 279
Attachment A:
Laboratory Test Results Certificates

Xstract – Excellence from the outset
XstractGroup.com
Level 2, 50 St Georges Terrace, PERTH WA 6000 | PO Box Z5426, PERTH WA 6831
T +61 8 9327 9500 | F +61 8 9481 8700 | Xstract Mining Consultants Pty Ltd | ABN 62 129 791 279
Moisture Content
AS1289 2.1.1 (Loss on Drying - Water content via mass loss at 105 C)

Brisbane346A Bilsen Road, GeebungQLD 4034 Ph: +61 7 3265 5656
Perth2 Kimmer Place, Queens Park WA 6107 Ph: +61 8 9258 8323Soil Rock Calibration
chrisc 1919
James
Client Report No.
Workorder No.Address Report Date
Project
Sample No. 18020002
Date Tested 5/02/2018
Client IDLithium
Tailings Dry Stack
Depth (m) Not Supplied
Moisture (%) 23.0
ClassificationCLAY / SILT -
grey
Pocket Penetrometer (kPa)
-
Sample No.
Date Tested
Client ID
Depth (m)
Moisture (%)
Classification
Pocket Penetrometer (kPa)
NOTES/REMARKS:
Sample/s supplied by the client Page 1 of 1 REP02902
Laboratory No. 9926
VISUAL CLASSIFICATION TEST REPORTTest Method: AS 1289 2.1.1, AS1726 Tables 9 & 10
Xstract Mining Consultants Pty Ltd
Level 6 545 Queen Street Brisbane QLD 4000
18020002-VC
06/02/2018
Lithium Tailings Dry Stack
0003771
Trilab Pty Ltd ABN 25 065 630 506 Reference should be made to Trilab's “Standard Terms and Conditions of Business” for further details.
The results of calibrations and tests performed apply only to the specific instrument or sample at the time of test unless otherwise clearly stated.
Accredited for compliance with ISO/IEC 17025 - Testing. The results of the tests, calibrations, and/or measurements included in
this document are traceable to Australian/National Standards.
Tested at Trilab Brisbane Laboratory.
Authorised Signatory
C. Channon
ACCURATE QUALITY RESULTS FOR TOMORROW'S ENGINEERING
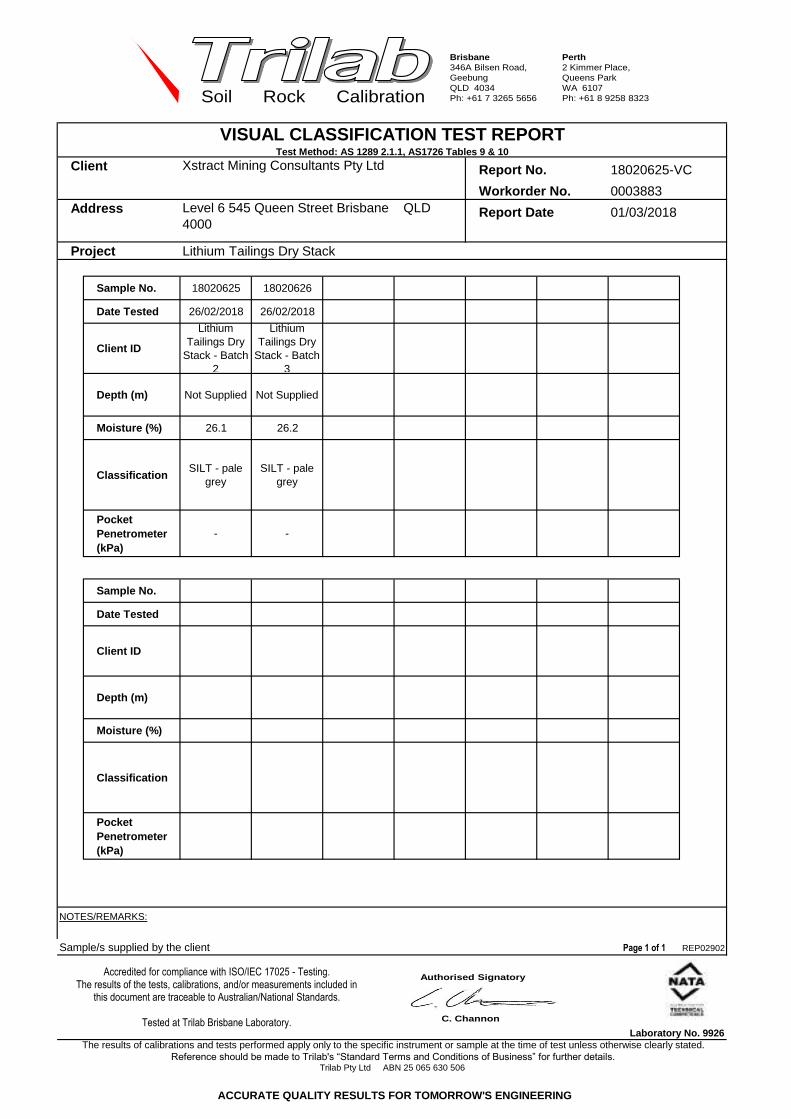
Brisbane346A Bilsen Road, GeebungQLD 4034 Ph: +61 7 3265 5656
Perth2 Kimmer Place, Queens Park WA 6107 Ph: +61 8 9258 8323Soil Rock Calibration
chrisc 1919
James
Client Report No.
Workorder No.Address Report Date
Project
Sample No. 18020625 18020626
Date Tested 26/02/2018 26/02/2018
Client ID
Lithium Tailings Dry
Stack - Batch 2
Lithium Tailings Dry
Stack - Batch 3
Depth (m) Not Supplied Not Supplied
Moisture (%) 26.1 26.2
ClassificationSILT - pale
greySILT - pale
grey
Pocket Penetrometer (kPa)
- -
Sample No.
Date Tested
Client ID
Depth (m)
Moisture (%)
Classification
Pocket Penetrometer (kPa)
NOTES/REMARKS:
Sample/s supplied by the client Page 1 of 1 REP02902
Laboratory No. 9926
VISUAL CLASSIFICATION TEST REPORTTest Method: AS 1289 2.1.1, AS1726 Tables 9 & 10
Xstract Mining Consultants Pty Ltd
Level 6 545 Queen Street Brisbane QLD 4000
18020625-VC
01/03/2018
Lithium Tailings Dry Stack
0003883
Trilab Pty Ltd ABN 25 065 630 506 Reference should be made to Trilab's “Standard Terms and Conditions of Business” for further details.
The results of calibrations and tests performed apply only to the specific instrument or sample at the time of test unless otherwise clearly stated.
Accredited for compliance with ISO/IEC 17025 - Testing. The results of the tests, calibrations, and/or measurements included in
this document are traceable to Australian/National Standards.
Tested at Trilab Brisbane Laboratory.
Authorised Signatory
C. Channon
ACCURATE QUALITY RESULTS FOR TOMORROW'S ENGINEERING

Xstract – Excellence from the outset
XstractGroup.com
Level 2, 50 St Georges Terrace, PERTH WA 6000 | PO Box Z5426, PERTH WA 6831
T +61 8 9327 9500 | F +61 8 9481 8700 | Xstract Mining Consultants Pty Ltd | ABN 62 129 791 279
Particle Size Distribution with Hydrometer
AS1289 3.6.2

Brisbane346A Bilsen Road, GeebungQLD 4034 Ph: +61 7 3265 5656
Perth2 Kimmer Place, Queens Park WA 6107 Ph: +61 8 9258 8323Soil Rock Calibration
chrisc 5758
Client Report No.
Workorder No.Address Test Date
Report Date
Project
Client ID Lithium Tailings Dry Stack Depth (m)Sieve Size Passing
(mm) %
150.0
75.0
63.0
53.0
37.5
26.5
19.0
13.2
9.5
6.7
4.75
2.36
1.18
0.600
0.425 100
0.300 99
0.150 94
0.075 92
0.057 77
0.045 67
0.034 59
0.024 49
0.018 45
0.013 40
0.0096 32
0.0069 27
0.0049 21
0.004 19
0.0035 16
0.0029 15
0.0025 13
0.0014 9
NOTES/REMARKS: -Moisture Content 23% -2.36mm Soil Particle Density(t/m3) 2.56Sample/s supplied by the client Page 1 of 1 REP03904
Laboratory No. 9926
Level 6 545 Queen Street Brisbane QLD 4000
Not Supplied
Xstract Mining Consultants Pty Ltd
Lithium Tailings Dry Stack
0003771
PARTICLE SIZE DISTRIBUTION TEST REPORTTest Method: AS 1289 3.6.3, 3.5.1 & 2.1.1
18020002-G
13/2/2018
5/2/18-13/2/18
The results of calibrations and tests performed apply only to the specific instrument or sample at the time of test unless otherwise clearly stated. Reference should be made to Trilab's “Standard Terms and Conditions of Business” for further details.
Trilab Pty Ltd ABN 25 065 630 506
Authorised Signatory
T. Lockhart
0
10
20
30
40
50
60
70
80
90
100
0.001 0.01 0.1 1
Pas
sin
g (%
)
Particle Size (mm)
Accredited for compliance with ISO/IEC 17025 - Testing. The results of the tests, calibrations, and/or measurements included in
this document are traceable to Australian/National Standards.
Tested at Trilab Brisbane Laboratory.
Authorised Signatory
C. Channon
ACCURATE QUALITY RESULTS FOR TOMORROW'S ENGINEERING

Brisbane346A Bilsen Road, GeebungQLD 4034 Ph: +61 7 3265 5656
Perth2 Kimmer Place, Queens Park WA 6107 Ph: +61 8 9258 8323Soil Rock Calibration
chrisc 5758
Client Report No.
Workorder No.Address Test Date
Report Date
Project
Client ID Lithium Tailings Dry Stack - Batch 2 Depth (m)Sieve Size Passing
(mm) %
150.0
75.0
63.0
53.0
37.5
26.5
19.0
13.2
9.5
6.7
4.75
2.36
1.18 100
0.600 99
0.425 99
0.300 98
0.150 93
0.075 76
0.065 65
0.047 59
0.033 54
0.024 46
0.018 37
0.013 33
0.0095 27
0.0069 20
0.0049 17
0.004 13
0.0035 12
0.0029 10
0.0025 9
0.0014 6
NOTES/REMARKS: -Moisture Content 26.1% -2.36mm Soil Particle Density(t/m3) 2.55Sample/s supplied by the client Page 1 of 1 REP03904
Laboratory No. 9926
Level 6 545 Queen Street Brisbane QLD 4000
Not Supplied
Xstract Mining Consultants Pty Ltd
Lithium Tailings Dry Stack
0003883
PARTICLE SIZE DISTRIBUTION TEST REPORTTest Method: AS 1289 3.6.3, 3.5.1 & 2.1.1
18020625-G
8/3/2018
26/2/18-8/3/18
The results of calibrations and tests performed apply only to the specific instrument or sample at the time of test unless otherwise clearly stated. Reference should be made to Trilab's “Standard Terms and Conditions of Business” for further details.
Trilab Pty Ltd ABN 25 065 630 506
Authorised Signatory
T. Lockhart
0
10
20
30
40
50
60
70
80
90
100
0.001 0.01 0.1 1 10
Pas
sin
g (%
)
Particle Size (mm)
Accredited for compliance with ISO/IEC 17025 - Testing. The results of the tests, calibrations, and/or measurements included in
this document are traceable to Australian/National Standards.
Tested at Trilab Brisbane Laboratory.
Authorised Signatory
C. Channon
ACCURATE QUALITY RESULTS FOR TOMORROW'S ENGINEERING

Brisbane346A Bilsen Road, GeebungQLD 4034 Ph: +61 7 3265 5656
Perth2 Kimmer Place, Queens Park WA 6107 Ph: +61 8 9258 8323Soil Rock Calibration
chrisc 5758
Client Report No.
Workorder No.Address Test Date
Report Date
Project
Client ID Lithium Tailings Dry Stack - Batch 3 Depth (m)Sieve Size Passing
(mm) %
150.0
75.0
63.0
53.0
37.5
26.5
19.0
13.2
9.5
6.7
4.75
2.36
1.18
0.600
0.425
0.300 100
0.150 94
0.075 77
0.061 69
0.044 63
0.032 55
0.023 47
0.018 39
0.013 33
0.0094 29
0.0068 21
0.0049 16
0.004 12
0.0035 10
0.0029 8
0.0025 7
0.0014 5
NOTES/REMARKS: -Moisture Content 23.5% -2.36mm Soil Particle Density(t/m3) 2.53Sample/s supplied by the client Page 1 of 1 REP03904
Laboratory No. 9926
Level 6 545 Queen Street Brisbane QLD 4000
Not Supplied
Xstract Mining Consultants Pty Ltd
Lithium Tailings Dry Stack
0003883
PARTICLE SIZE DISTRIBUTION TEST REPORTTest Method: AS 1289 3.6.3, 3.5.1 & 2.1.1
18020626-G
8/3/2018
26/2/18-8/3/18
The results of calibrations and tests performed apply only to the specific instrument or sample at the time of test unless otherwise clearly stated. Reference should be made to Trilab's “Standard Terms and Conditions of Business” for further details.
Trilab Pty Ltd ABN 25 065 630 506
Authorised Signatory
T. Lockhart
0
10
20
30
40
50
60
70
80
90
100
0.001 0.01 0.1 1
Pas
sin
g (%
)
Particle Size (mm)
Accredited for compliance with ISO/IEC 17025 - Testing. The results of the tests, calibrations, and/or measurements included in
this document are traceable to Australian/National Standards.
Tested at Trilab Brisbane Laboratory.
Authorised Signatory
C. Channon
ACCURATE QUALITY RESULTS FOR TOMORROW'S ENGINEERING

Xstract – Excellence from the outset
XstractGroup.com
Level 2, 50 St Georges Terrace, PERTH WA 6000 | PO Box Z5426, PERTH WA 6831
T +61 8 9327 9500 | F +61 8 9481 8700 | Xstract Mining Consultants Pty Ltd | ABN 62 129 791 279
Atterberg Limits (4 point, including Linear Shrinkage)
AS1289 3.1.1, 3.2.1, 3.3.1, 3.4.1

Brisbane346A Bilsen Road, GeebungQLD 4034 Ph: +61 7 3265 5656
Perth2 Kimmer Place, Queens Park WA 6107 Ph: +61 8 9258 8323Soil Rock Calibration
chrisc 1919
James
Client Report No.
Workorder No.Address Test Date
Report Date
Project
18020002
Test Date 6/02/2018
Lithium Tailings Dry
Stack
Not Supplied
35
30
Plasticity Index (%) 5
Linear Shrinkage (%) 2.0 *
Moisture Content (%) 23.0
Test Date
Plasticity Index (%)
Linear Shrinkage (%)
Moisture Content (%)
NOTES/REMARKS: The samples were tested in a natural state, wet sieved and in a 125-250mm mould.
Sample/s supplied by the client * Cracking occurred + Curling occurred Page 1 of 1 REP00102
Laboratory No. 9926
ATTERBERG LIMITS TEST REPORTTest Method: AS 1289 2.1.1, 3.9.1, 3.2.1, 3.3.1, 3.4.1
Xstract Mining Consultants Pty Ltd
Level 6 545 Queen Street Brisbane QLD 4000
18020002-AL
14/02/2018
06/02/2018
0003771
Lithium Tailings Dry Stack
Depth (m)
Trilab Pty Ltd ABN 25 065 630 506 Reference should be made to Trilab's “Standard Terms and Conditions of Business” for further details.
The results of calibrations and tests performed apply only to the specific instrument or sample at the time of test unless otherwise clearly stated.
Liquid Limit (%)
Plastic Limit (%)
Sample No.
Client ID
Depth (m)
Client ID
Sample No.
Plastic Limit (%)
Liquid Limit (%)
Authorised Signatory
T. Lockhart
Accredited for compliance with ISO/IEC 17025 - Testing. The results of the tests, calibrations, and/or measurements included in
this document are traceable to Australian/National Standards.
Tested at Trilab Brisbane Laboratory.
Authorised Signatory
C. Channon
ACCURATE QUALITY RESULTS FOR TOMORROW'S ENGINEERING

Brisbane346A Bilsen Road, GeebungQLD 4034 Ph: +61 7 3265 5656
Perth2 Kimmer Place, Queens Park WA 6107 Ph: +61 8 9258 8323Soil Rock Calibration
chrisc 1919
James
Client Report No.
Workorder No.Address Report Date
Project
18020625 18020626
Test Date 12/03/2018 12/03/2018
Lithium Tailings Dry
Stack - Batch 2
Lithium Tailings Dry
Stack - Batch 3
Not Supplied Not Supplied
36 36
29 29
Plasticity Index (%) 7 7
Linear Shrinkage (%) 1.0 1.0
Moisture Content (%) 26.1 26.2
Test Date
Plasticity Index (%)
Linear Shrinkage (%)
Moisture Content (%)
NOTES/REMARKS: The samples were tested in a natural state, wet sieved and in a 125-250mm mould.
Sample/s supplied by the client * Cracking occurred + Curling occurred Page 1 of 1 REP00102
Laboratory No. 9926
Lithium Tailings Dry Stack
Depth (m)
Trilab Pty Ltd ABN 25 065 630 506 Reference should be made to Trilab's “Standard Terms and Conditions of Business” for further details.
The results of calibrations and tests performed apply only to the specific instrument or sample at the time of test unless otherwise clearly stated.
Liquid Limit (%)
Plastic Limit (%)
Sample No.
Client ID
Depth (m)
Client ID
Sample No.
Plastic Limit (%)
Liquid Limit (%)
ATTERBERG LIMITS TEST REPORTTest Method: AS 1289 2.1.1, 3.9.1, 3.2.1, 3.3.1, 3.4.1
Xstract Mining Consultants Pty Ltd
Level 6 545 Queen Street Brisbane QLD 4000
18020625-AL
15/03/2018
0003883
Authorised Signatory
T. Lockhart
Accredited for compliance with ISO/IEC 17025 - Testing. The results of the tests, calibrations, and/or measurements included in
this document are traceable to Australian/National Standards.
Tested at Trilab Brisbane Laboratory.
Authorised Signatory
C. Channon
ACCURATE QUALITY RESULTS FOR TOMORROW'S ENGINEERING

Xstract – Excellence from the outset
XstractGroup.com
Level 2, 50 St Georges Terrace, PERTH WA 6000 | PO Box Z5426, PERTH WA 6831
T +61 8 9327 9500 | F +61 8 9481 8700 | Xstract Mining Consultants Pty Ltd | ABN 62 129 791 279
MMDD / OMC - Compaction
AS1289 5.2.1
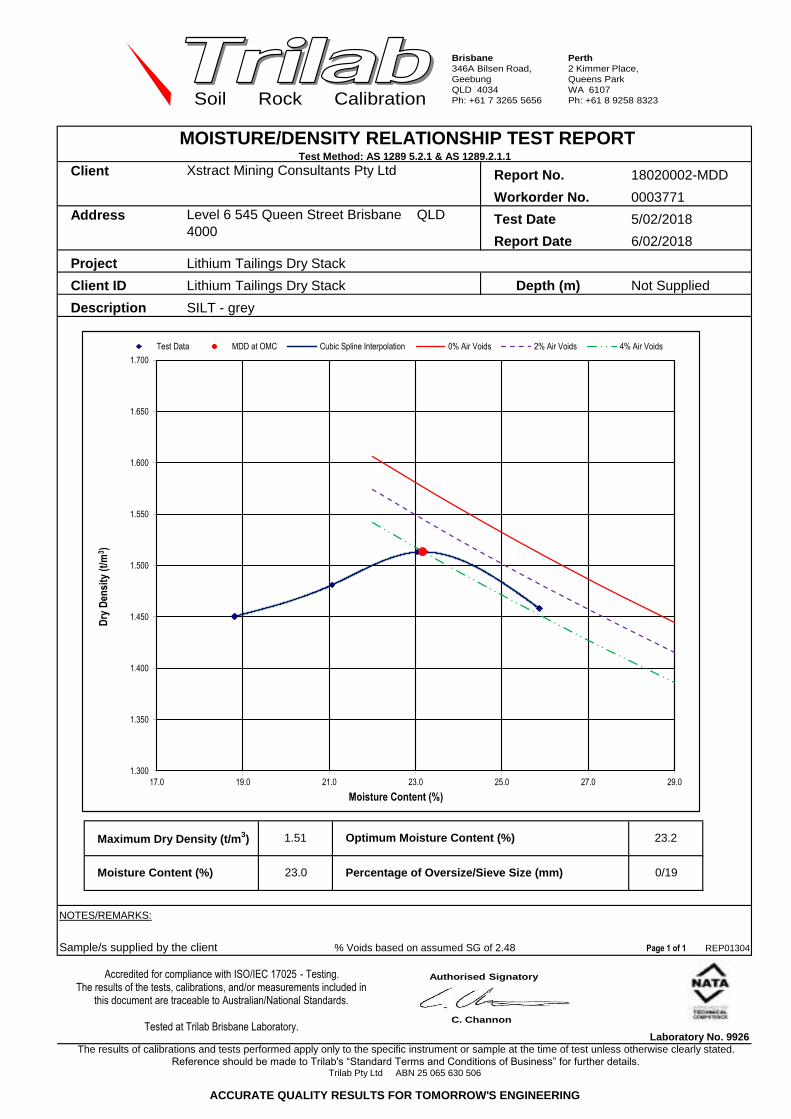
Brisbane346A Bilsen Road, GeebungQLD 4034 Ph: +61 7 3265 5656
Perth2 Kimmer Place, Queens Park WA 6107 Ph: +61 8 9258 8323Soil Rock Calibration
chrisc 1919
James
Client Report No.
Workorder No.Address Test Date
Report Date
Project
Client ID Depth (m) Not Supplied
Description SILT - grey
17.00 29.00
1.30 1.70
NOTES/REMARKS:
Sample/s supplied by the client % Voids based on assumed SG of 2.48 Page 1 of 1 REP01304
Laboratory No. 9926
Lithium Tailings Dry Stack
MOISTURE/DENSITY RELATIONSHIP TEST REPORTTest Method: AS 1289 5.2.1 & AS 1289.2.1.1
Xstract Mining Consultants Pty Ltd
Level 6 545 Queen Street Brisbane QLD 4000
18020002-MDD
6/02/2018
5/02/2018
Lithium Tailings Dry Stack
0003771
Maximum Dry Density (t/m3)
Trilab Pty Ltd ABN 25 065 630 506 Reference should be made to Trilab's “Standard Terms and Conditions of Business” for further details.
The results of calibrations and tests performed apply only to the specific instrument or sample at the time of test unless otherwise clearly stated.
0/19
23.2
Moisture Content (%) 23.0
1.51
Percentage of Oversize/Sieve Size (mm)
Optimum Moisture Content (%)
Authorised Signatory
T. Lockhart
1.300
1.350
1.400
1.450
1.500
1.550
1.600
1.650
1.700
17.0 19.0 21.0 23.0 25.0 27.0 29.0
Dry
Den
sity
(t/
m3 )
Moisture Content (%)
Test Data MDD at OMC Cubic Spline Interpolation 0% Air Voids 2% Air Voids 4% Air Voids
Accredited for compliance with ISO/IEC 17025 - Testing. The results of the tests, calibrations, and/or measurements included in
this document are traceable to Australian/National Standards.
Tested at Trilab Brisbane Laboratory.
Authorised Signatory
C. Channon
ACCURATE QUALITY RESULTS FOR TOMORROW'S ENGINEERING

Brisbane346A Bilsen Road, GeebungQLD 4034 Ph: +61 7 3265 5656
Perth2 Kimmer Place, Queens Park WA 6107 Ph: +61 8 9258 8323Soil Rock Calibration
chrisc 1919
James
Client Report No.
Workorder No.Address Test Date
Report Date
Project
Client ID Depth (m) Not Supplied
Description SILT - grey
18.00 30.00
1.30 1.60
NOTES/REMARKS:
Sample/s supplied by the client % Voids based on assumed SG of 2.47 Page 1 of 1 REP01304
Laboratory No. 9926
Maximum Dry Density (t/m3)
Trilab Pty Ltd ABN 25 065 630 506 Reference should be made to Trilab's “Standard Terms and Conditions of Business” for further details.
The results of calibrations and tests performed apply only to the specific instrument or sample at the time of test unless otherwise clearly stated.
0/19
23.6
Moisture Content (%) 26.1
1.50
Percentage of Oversize/Sieve Size (mm)
Optimum Moisture Content (%)
Lithium Tailings Dry Stack - Batch 2
MOISTURE/DENSITY RELATIONSHIP TEST REPORTTest Method: AS 1289 5.2.1 & AS 1289.2.1.1
Xstract Mining Consultants Pty Ltd
Level 6 545 Queen Street Brisbane QLD 4000
18020625-MDD
1/03/2018
28/02/2018
Lithium Tailings Dry Stack
0003883
Authorised Signatory
T. Lockhart
1.300
1.350
1.400
1.450
1.500
1.550
1.600
18.0 20.0 22.0 24.0 26.0 28.0 30.0
Dry
Den
sity
(t/
m3 )
Moisture Content (%)
Test Data MDD at OMC Cubic Spline Interpolation 0% Air Voids 2% Air Voids 4% Air Voids
Accredited for compliance with ISO/IEC 17025 - Testing. The results of the tests, calibrations, and/or measurements included in
this document are traceable to Australian/National Standards.
Tested at Trilab Brisbane Laboratory.
Authorised Signatory
C. Channon
ACCURATE QUALITY RESULTS FOR TOMORROW'S ENGINEERING

Brisbane346A Bilsen Road, GeebungQLD 4034 Ph: +61 7 3265 5656
Perth2 Kimmer Place, Queens Park WA 6107 Ph: +61 8 9258 8323Soil Rock Calibration
chrisc 1919
James
Client Report No.
Workorder No.Address Test Date
Report Date
Project
Client ID Depth (m) Not Supplied
Description SILT- grey
19.00 30.00
1.30 1.60
NOTES/REMARKS:
Sample/s supplied by the client % Voids based on assumed SG of 2.46 Page 1 of 1 REP01304
Laboratory No. 9926
Maximum Dry Density (t/m3)
Trilab Pty Ltd ABN 25 065 630 506 Reference should be made to Trilab's “Standard Terms and Conditions of Business” for further details.
The results of calibrations and tests performed apply only to the specific instrument or sample at the time of test unless otherwise clearly stated.
0/19
24.1
Moisture Content (%) 26.2
1.50
Percentage of Oversize/Sieve Size (mm)
Optimum Moisture Content (%)
Lithium Tailings Dry Stack - Batch 3
MOISTURE/DENSITY RELATIONSHIP TEST REPORTTest Method: AS 1289 5.2.1 & AS 1289.2.1.1
Xstract Mining Consultants Pty Ltd
Level 6 545 Queen Street Brisbane QLD 4000
18020626-MDD
1/03/2018
28/02/2018
Lithium Tailings Dry Stack
0003883
Authorised Signatory
T. Lockhart
1.300
1.350
1.400
1.450
1.500
1.550
1.600
19.0 21.0 23.0 25.0 27.0 29.0 31.0
Dry
Den
sity
(t/
m3 )
Moisture Content (%)
Test Data MDD at OMC Cubic Spline Interpolation 0% Air Voids 2% Air Voids 4% Air Voids
Accredited for compliance with ISO/IEC 17025 - Testing. The results of the tests, calibrations, and/or measurements included in
this document are traceable to Australian/National Standards.
Tested at Trilab Brisbane Laboratory.
Authorised Signatory
C. Channon
ACCURATE QUALITY RESULTS FOR TOMORROW'S ENGINEERING
Xstract – Excellence from the outset
XstractGroup.com
Level 2, 50 St Georges Terrace, PERTH WA 6000 | PO Box Z5426, PERTH WA 6831
T +61 8 9327 9500 | F +61 8 9481 8700 | Xstract Mining Consultants Pty Ltd | ABN 62 129 791 279
Consolidation testing (7 stage full consolidation) –
Oedometer
AS1289 6.6.1

Brisbane346A Bilsen Road, GeebungQLD 4034 Ph: +61 7 3265 5656
Perth2 Kimmer Place, Queens Park WA 6107 Ph: +61 8 9258 8323Soil Rock Calibration
chrisc 1919
Client: Report No.:
Workorder No.Address: Test Date:
Report Date:
Project:
Client Id.: Depth (m):
Description:
0.6
1
0
5
Wet Density (t/m3): 1.71 Initial Moisture (%): 23.9 Test Condition:
Particle Density (t/m3): 2.56 Initial Voids Ratio: 0.852 Initial Degree of Saturation (%): 71.9
Sample supplied by the client Remarks:Single Individual Specimen remoulded to a target density of 92% of Modified Maximum Dry
Desity at Optimum Moisture Content
Inundated on load
OEDOMETER TEST REPORTTest Method: AS1289.6.6.1, 3.5.1
18020002-OED
13/02/2018
12/03/2018
Not Supplied
SILT- grey
Xstract Mining Consultants Pty Ltd
Level 6 545 Queen Street Brisbane QLD 4000
Lithium Tailings Dry Stack
3771
Lithium Tailings Dry Stack
Trilab Pty Ltd
Page 1 of 2
ABN 25 065 630 506
REP03102
The results of calibrations and tests performed apply only to the specific instrument or sample at the time of test unless otherwise clearly stated.
Reference should be made to Trilab's “Standard Terms and Conditions of Business” for further details.
Laboratory Number 9926
0.0
0.5
1.0
1.5
2.0
2.5
3.0
3.5
4.0
4.5
0.77
0.78
0.79
0.80
0.81
0.82
0.83
0.84
0.85
0.86
1 10 100 1000
% C
on
solid
atio
n
Vo
id R
atio
Applied Pressure (kPa)
Void Ratio
% Consolidation
Accredited for compliance with ISO/IEC 17025 - Testing. The results of the tests, calibrations, and/or measurements included
in this document are traceable to Australian/National Standards.
Tested at Trilab Brisbane Laboratory.
Authorised Signatory
C. Channon
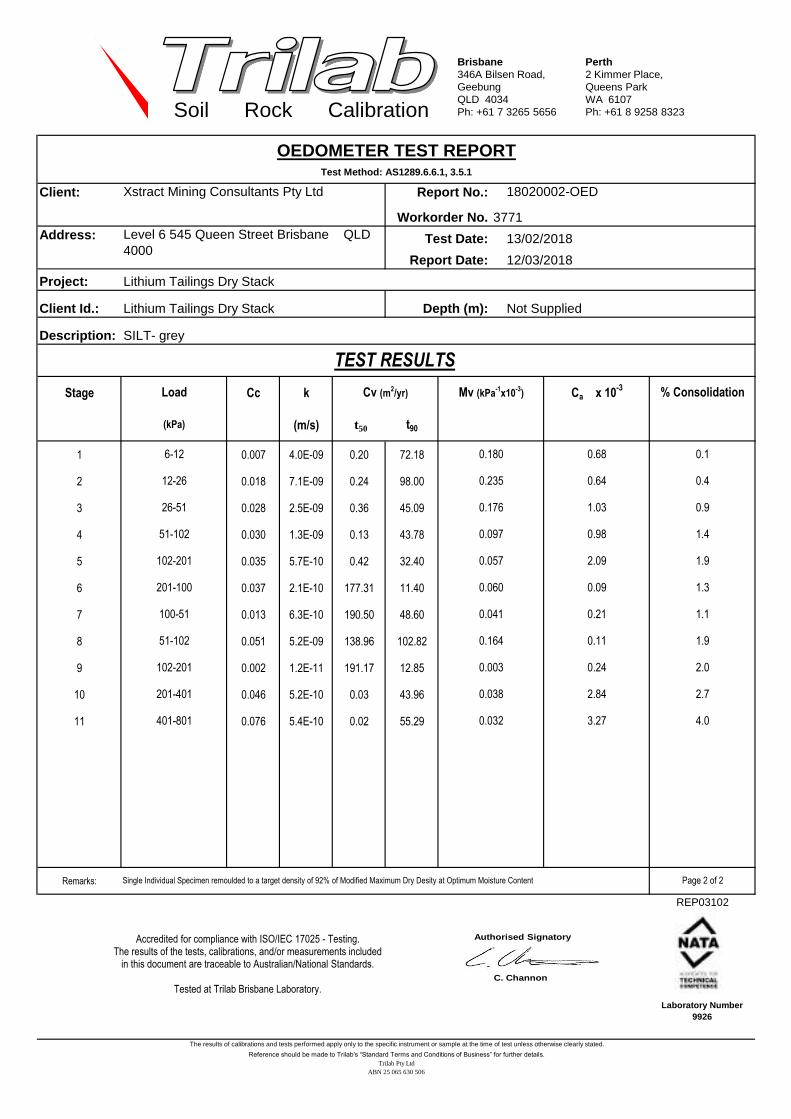
Brisbane346A Bilsen Road, GeebungQLD 4034 Ph: +61 7 3265 5656
Perth2 Kimmer Place, Queens Park WA 6107 Ph: +61 8 9258 8323Soil Rock Calibration
Client: Report No.:
Workorder No.Address: Test Date:
Report Date:
Project:
Client Id.: Depth (m):
Description:
Stage Cc k
(m/s) t50 t90
1 0.007 4.0E-09 0.20 72.18
2 0.018 7.1E-09 0.24 98.00
3 0.028 2.5E-09 0.36 45.09
4 0.030 1.3E-09 0.13 43.78
5 0.035 5.7E-10 0.42 32.40
6 0.037 2.1E-10 177.31 11.40
7 0.013 6.3E-10 190.50 48.60
8 0.051 5.2E-09 138.96 102.82
9 0.002 1.2E-11 191.17 12.85
10 0.046 5.2E-10 0.03 43.96
11 0.076 5.4E-10 0.02 55.29
Remarks: Single Individual Specimen remoulded to a target density of 92% of Modified Maximum Dry Desity at Optimum Moisture Content Page 2 of 2
(kPa)
TEST RESULTS
OEDOMETER TEST REPORTTest Method: AS1289.6.6.1, 3.5.1
Xstract Mining Consultants Pty Ltd 18020002-OED
3771Level 6 545 Queen Street Brisbane QLD 4000
13/02/2018
12/03/2018
Lithium Tailings Dry Stack
102-201
201-100
100-51
51-102
26-51
0.003
0.038
0.032
6-12
12-26
0.1
0.4
0.9
1.451-102
0.180
SILT- grey
Load Cv (m2/yr) % ConsolidationCa x 10
-3Mv (kPa
-1x10
-3)
0.235
0.176
Not Supplied
3.27
0.68
0.64
1.03
0.98
2.09
0.09
1.1
1.9
1.9
1.3
0.097
0.057
0.060
0.21
0.11
0.24
2.84
0.041
0.164
Trilab Pty Ltd
102-201
201-401
401-801
Lithium Tailings Dry Stack
ABN 25 065 630 506
REP03102
The results of calibrations and tests performed apply only to the specific instrument or sample at the time of test unless otherwise clearly stated.
Reference should be made to Trilab's “Standard Terms and Conditions of Business” for further details.
Laboratory Number 9926
4.0
2.0
2.7
Accredited for compliance with ISO/IEC 17025 - Testing. The results of the tests, calibrations, and/or measurements included
in this document are traceable to Australian/National Standards.
Tested at Trilab Brisbane Laboratory.
Authorised Signatory
C. Channon

Brisbane346A Bilsen Road, GeebungQLD 4034 Ph: +61 7 3265 5656
Perth2 Kimmer Place, Queens Park WA 6107 Ph: +61 8 9258 8323Soil Rock Calibration
chrisc 1919
Client: Report No.:
Workorder No.Address: Test Date:
Report Date:
Project:
Client Id.: Depth (m):
Description:
0.6
1
0
5
Wet Density (t/m3): 1.71 Initial Moisture (%): 23.8 Test Condition:
Particle Density (t/m3): 2.55 Initial Voids Ratio: 0.850 Initial Degree of Saturation (%): 72.8
Sample supplied by the client Remarks:Single Individual Specimen remoulded to a target density of 92% of Modified Maximum
Dry Desity at Optimum Moisture Content
ABN 25 065 630 506
REP03102
The results of calibrations and tests performed apply only to the specific instrument or sample at the time of test unless otherwise clearly stated.
Reference should be made to Trilab's “Standard Terms and Conditions of Business” for further details.
Laboratory Number 9926
Trilab Pty Ltd
Page 1 of 2
OEDOMETER TEST REPORTTest Method: AS1289.6.6.1, 3.5.1
18020625-OED
2/03/2018
10/04/2018
Not Supplied
SILT- grey
Xstract Mining Consultants Pty Ltd
Level 6 545 Queen Street Brisbane QLD 4000
Lithium Tailings Dry Stack - Batch 2
3883
Lithium Tailings Dry Stack
Inundated on load
0.0
0.5
1.0
1.5
2.0
2.5
3.0
3.5
4.0
4.5
5.0
0.75
0.77
0.79
0.81
0.83
0.85
0.87
1 10 100 1000
% C
on
solid
atio
n
Vo
id R
atio
Applied Pressure (kPa)
Void Ratio
% Consolidation
Accredited for compliance with ISO/IEC 17025 - Testing. The results of the tests, calibrations, and/or measurements included
in this document are traceable to Australian/National Standards.
Tested at Trilab Brisbane Laboratory.
Authorised Signatory
C. Channon

Brisbane346A Bilsen Road, GeebungQLD 4034 Ph: +61 7 3265 5656
Perth2 Kimmer Place, Queens Park WA 6107 Ph: +61 8 9258 8323Soil Rock Calibration
Client: Report No.:
Workorder No.Address: Test Date:
Report Date:
Project:
Client Id.: Depth (m):
Description:
Stage Cc k
(m/s) t50 t90
1 0.006 8.5E-10 0.31 17.56
2 0.004 5.0E-10 0.10 34.10
3 0.020 9.4E-10 0.25 23.52
4 0.033 2.1E-09 0.08 62.74
5 0.046 9.7E-10 0.08 40.83
6 0.046 6.0E-10 98.72 25.22
7 0.021 2.4E-09 122.11 116.31
8 0.072 3.9E-09 307.31 53.52
9 0.006 1.4E-10 187.96 41.83
10 0.054 6.5E-10 0.03 47.00
11 0.105 2.6E-09 0.03 188.91
Remarks:
Lithium Tailings Dry Stack
ABN 25 065 630 506
REP03102
The results of calibrations and tests performed apply only to the specific instrument or sample at the time of test unless otherwise clearly stated.
Reference should be made to Trilab's “Standard Terms and Conditions of Business” for further details.
Laboratory Number 9926
4.5
1.9
2.8
Trilab Pty Ltd
100-200
200-400
400-801
Not Supplied
6.55
0.28
0.54
0.87
1.43
2.04
0.09
0.7
1.8
1.8
1.0
0.109
0.076
0.077
0.16
0.07
0.25
2.88
0.068
0.235
6-12
12-25
0.1
0.2
0.5
1.051-99
0.156
SILT- grey
Load Cv (m2/yr) % ConsolidationCa x 10
-3Mv (kPa
-1x10
-3)
0.047
0.129
99-199
199-99
99-51
51-100
25-51
0.011
0.045
0.044
(kPa)
TEST RESULTS
OEDOMETER TEST REPORTTest Method: AS1289.6.6.1, 3.5.1
Xstract Mining Consultants Pty Ltd 18020625-OED
3883Level 6 545 Queen Street Brisbane QLD 4000
2/03/2018
10/04/2018
Lithium Tailings Dry Stack - Batch 2
Single Individual Specimen remoulded to a target density of 92% of Modified Maximum Dry Desity at Optimum Moisture Content Page 2 of 2
Accredited for compliance with ISO/IEC 17025 - Testing. The results of the tests, calibrations, and/or measurements included
in this document are traceable to Australian/National Standards.
Tested at Trilab Brisbane Laboratory.
Authorised Signatory
C. Channon

Brisbane346A Bilsen Road, GeebungQLD 4034 Ph: +61 7 3265 5656
Perth2 Kimmer Place, Queens Park WA 6107 Ph: +61 8 9258 8323Soil Rock Calibration
chrisc 1919
Client: Report No.:
Workorder No.Address: Test Date:
Report Date:
Project:
Client Id.: Depth (m):
Description:
0.6
1
0
5
Wet Density (t/m3): 1.71 Initial Moisture (%): 24.2 Test Condition:
Particle Density (t/m3): 2.53 Initial Voids Ratio: 0.833 Initial Degree of Saturation (%): 74.6
Undisturbed sample supplied by the client Remarks:Single Individual Specimen remoulded to a target density of 92% of Modified Maximum
Dry Desity at Optimum Moisture Content
ABN 25 065 630 506
REP03102
The results of calibrations and tests performed apply only to the specific instrument or sample at the time of test unless otherwise clearly stated.
Reference should be made to Trilab's “Standard Terms and Conditions of Business” for further details.
Laboratory Number 9926
Trilab Pty Ltd
Page 1 of 2
OEDOMETER TEST REPORTTest Method: AS1289.6.6.1, 3.5.1
18020626-OED
2/03/2018
9/04/2018
Not Supplied
SILT- grey
Xstract Mining Consultants Pty Ltd
Level 6 545 Queen Street Brisbane QLD 4000
Lithium Tailings Dry Stack - Batch 3
3883
Lithium Tailings Dry Stack
Inundated on load
0.0
0.5
1.0
1.5
2.0
2.5
3.0
3.5
4.0
0.76
0.77
0.78
0.79
0.80
0.81
0.82
0.83
0.84
0.85
1 10 100 1000
% C
on
solid
atio
n
Vo
id R
atio
Applied Pressure (kPa)
Void Ratio
% Consolidation
Accredited for compliance with ISO/IEC 17025 - Testing. The results of the tests, calibrations, and/or measurements included
in this document are traceable to Australian/National Standards.
Tested at Trilab Brisbane Laboratory.
Authorised Signatory
C. Channon

Brisbane346A Bilsen Road, GeebungQLD 4034 Ph: +61 7 3265 5656
Perth2 Kimmer Place, Queens Park WA 6107 Ph: +61 8 9258 8323Soil Rock Calibration
Client: Report No.:
Workorder No.Address: Test Date:
Report Date:
Project:
Client Id.: Depth (m):
Description:
Stage Cc k
(m/s) t50 t90
1 0.004 1.3E-09 0.21 73.32
2 0.008 1.7E-09 0.20 114.37
3 0.024 1.5E-09 4.09 59.72
4 0.037 8.8E-10 0.07 45.85
5 0.044 4.9E-10 125.05 21.64
6 0.008 4.1E-10 162.57 50.10
7 0.053 2.8E-09 191.43 52.44
8 0.007 2.0E-10 148.62 57.45
9 0.037 4.3E-10 0.03 45.66
10 0.098 5.7E-10 0.01 44.86
Remarks:
Lithium Tailings Dry Stack
ABN 25 065 630 506
REP03102
The results of calibrations and tests performed apply only to the specific instrument or sample at the time of test unless otherwise clearly stated.
Reference should be made to Trilab's “Standard Terms and Conditions of Business” for further details.
Laboratory Number 9926
1.9
3.5
Trilab Pty Ltd
200-400
400-800
Not Supplied
0.53
1.05
1.11
1.80
0.12
0.12
1.2
1.3
0.5
0.3
0.062
0.074
0.027
0.10
0.23
2.96
5.50
0.172
0.011
12.5-25
25-51
0.1
0.2
0.6
1.2100-200
0.056
SILT- grey
Load Cv (m2/yr) % ConsolidationCa x 10
-3Mv (kPa
-1x10
-3)
0.049
0.079
200-100
100-51
51-100
100-200
51-100
0.030
0.041
(kPa)
TEST RESULTS
OEDOMETER TEST REPORTTest Method: AS1289.6.6.1, 3.5.1
Xstract Mining Consultants Pty Ltd 18020626-OED
3883Level 6 545 Queen Street Brisbane QLD 4000
2/03/2018
9/04/2018
Lithium Tailings Dry Stack - Batch 3
Single Individual Specimen remoulded to a target density of 92% of Modified Maximum Dry Desity at Optimum Moisture Content Page 2 of 2
Accredited for compliance with ISO/IEC 17025 - Testing. The results of the tests, calibrations, and/or measurements included
in this document are traceable to Australian/National Standards.
Tested at Trilab Brisbane Laboratory.
Authorised Signatory
C. Channon

Xstract – Excellence from the outset
XstractGroup.com
Level 2, 50 St Georges Terrace, PERTH WA 6000 | PO Box Z5426, PERTH WA 6831
T +61 8 9327 9500 | F +61 8 9481 8700 | Xstract Mining Consultants Pty Ltd | ABN 62 129 791 279
Emerson Class - (piping potential)
AS1289.3.8.1

Brisbane346A Bilsen Road, GeebungQLD 4034 Ph: +61 7 3265 5656
Perth2 Kimmer Place, Queens Park WA 6107 Ph: +61 8 9258 8323Soil Rock Calibration
chrisc 1919
James
Client Report No.
Workorder No.Address Test Date
Report Date
Project
Sample No. 18020002 - - - - - -
Client IDLithium
Tailings Dry Stack
- - - - - -
Depth (m) Not Supplied - - - - - -
Description SILT - grey - - - - - -
Emerson Class Number
4 - - - - - -
Sample No. - - - - - - -
Client ID - - - - - - -
Depth (m) - - - - - - -
Description - - - - - - -
Emerson Class Number
- - - - - - -
Sample No. - - - - - - -
Client ID - - - - - - -
Depth (m) - - - - - - -
Description - - - - - - -
Emerson Class Number
- - - - - - -
NOTES/REMARKS:
Sample/s supplied by the client Tested with Distilled water at 22°C Page 1 of 1 REP00402
Laboratory No. 9926
Lithium Tailings Dry Stack
EMERSON CLASS NUMBER TEST REPORTTest Method: AS 1289 3.8.1
Xstract Mining Consultants Pty Ltd
Level 6 545 Queen Street Brisbane QLD 4000
18020002-EM
13/02/2018
06/02/2018
3771
Trilab Pty Ltd ABN 25 065 630 506 Reference should be made to Trilab's “Standard Terms and Conditions of Business” for further details.
The results of calibrations and tests performed apply only to the specific instrument or sample at the time of test unless otherwise clearly stated.
Authorised Signatory
T. Lockhart
Accredited for compliance with ISO/IEC 17025 - Testing. The results of the tests, calibrations, and/or measurements included in
this document are traceable to Australian/National Standards.
Tested at Trilab Brisbane Laboratory.
Authorised Signatory
C. Channon
ACCURATE QUALITY RESULTS FOR TOMORROW'S ENGINEERING

Brisbane346A Bilsen Road, GeebungQLD 4034 Ph: +61 7 3265 5656
Perth2 Kimmer Place, Queens Park WA 6107 Ph: +61 8 9258 8323Soil Rock Calibration
chrisc 1919
James
Client Report No.
Workorder No.Address Test Date
Report Date
Project
Sample No. 18020625 18020626 - - - - -
Client IDLithium
Tailings Dry Stack - Batch
Lithium Tailings Dry
Stack - Batch - - - - -
Depth (m) Not Supplied Not Supplied - - - - -
DescriptionSILTY - pale
greySILT - pale
grey- - - - -
Emerson Class Number
4 4 - - - - -
Sample No. - - - - - - -
Client ID - - - - - - -
Depth (m) - - - - - - -
Description - - - - - - -
Emerson Class Number
- - - - - - -
Sample No. - - - - - - -
Client ID - - - - - - -
Depth (m) - - - - - - -
Description - - - - - - -
Emerson Class Number
- - - - - - -
NOTES/REMARKS:
Sample/s supplied by the client Tested with Distilled water at 21.5°C Page 1 of 1 REP00402
Laboratory No. 9926
Trilab Pty Ltd ABN 25 065 630 506 Reference should be made to Trilab's “Standard Terms and Conditions of Business” for further details.
The results of calibrations and tests performed apply only to the specific instrument or sample at the time of test unless otherwise clearly stated.
Lithium Tailings Dry Stack
EMERSON CLASS NUMBER TEST REPORTTest Method: AS 1289 3.8.1
Xstract Mining Consultants Pty Ltd
Level 6 545 Queen Street Brisbane QLD 4000
18020625-EM
07/03/2018
06/03/2018
3883
Authorised Signatory
T. Lockhart
Accredited for compliance with ISO/IEC 17025 - Testing. The results of the tests, calibrations, and/or measurements included in
this document are traceable to Australian/National Standards.
Tested at Trilab Brisbane Laboratory.
Authorised Signatory
C. Channon
ACCURATE QUALITY RESULTS FOR TOMORROW'S ENGINEERING

Xstract – Excellence from the outset
XstractGroup.com
Level 2, 50 St Georges Terrace, PERTH WA 6000 | PO Box Z5426, PERTH WA 6831
T +61 8 9327 9500 | F +61 8 9481 8700 | Xstract Mining Consultants Pty Ltd | ABN 62 129 791 279
Triaxial Testing - UU (unconsolidated, undrained) - (elastic
properties) - multi stage
AS1289.6.4.1

Brisbane346A Bilsen Road, GeebungQLD 4034 Ph: +61 7 3265 5656
Perth2 Kimmer Place, Queens Park WA 6107 Ph: +61 8 9258 8323Soil Rock Calibrationchrisc 1919
Client Report No.
Address Test Date
Report Date
Project
Client ID Depth (m)Description Sample Type
Interpretation between stages
Cohesion C (kPa)
Angle of Shear Resistance Ф (0)
MOISTURE CONTENTS Initial 23.7 % Final 23.7 % Failure Criteria Maximum Deviator Stress
StrainInitial Height 99.3 mm
Initial Diameter 46.9 mm 1036 kPa 4.66 %
Wet Density 1.72 t/m3
Dry Density 1.39 t/m3
Rate of Strain 0.504 % / min
Notes/Remarks:Graph not to scale Page 1 of 3 REP2601
Laboratory No. 9926
Sample Detailss3
FAILURE DETAILSPrincipal Stresses
SAMPLE & TEST DETAILS
CLAYEY SILT- grey Single Individual Specimen remoulded to a target density of 92% of Standard Maximum Dry Density at Optimum Moisture Content
250 kPa
Deviator Stresss1
250 kPa 1286 kPa
Confining Pressure
Trilab Pty Ltd ABN 25 065 630 506
The results of calibrations and tests performed apply only to the specific instrument or sample at the time of test unless otherwise clearly stated. Reference should be made to Trilab's “Standard Terms and Conditions of Business” for further details.
TRIAXIAL TEST REPORTTest Method: AS1289.6.4.1
Not Supplied
18020002- UU
27/02/2018
14/02/2018
Xstract Mining Consultants Pty Ltd
Level 6 545 Queen Street Brisbane QLD 4000
Lithium Tailings Dry Stack
Lithium Tailings Dry Stack
0003771Workorder No.
Authorised Signatory
T. Lockhart
0
200
400
600
800
0 200 400 600 800 1000 1200 1400
Sh
ear
Str
ess
kP
a
Normal Stress kPa
Mohr Circle Diagram
Accredited for compliance with ISO/IEC 17025 - Testing. The results of the tests, calibrations, and/or measurements included in this
document are traceable to Australian/National Standards.
Tested at Trilab Brisbane Laboratory.
Authorised Signatory
C. Channon
ACCURATE QUALITY RESULTS FOR TOMORROW'S ENGINEERING
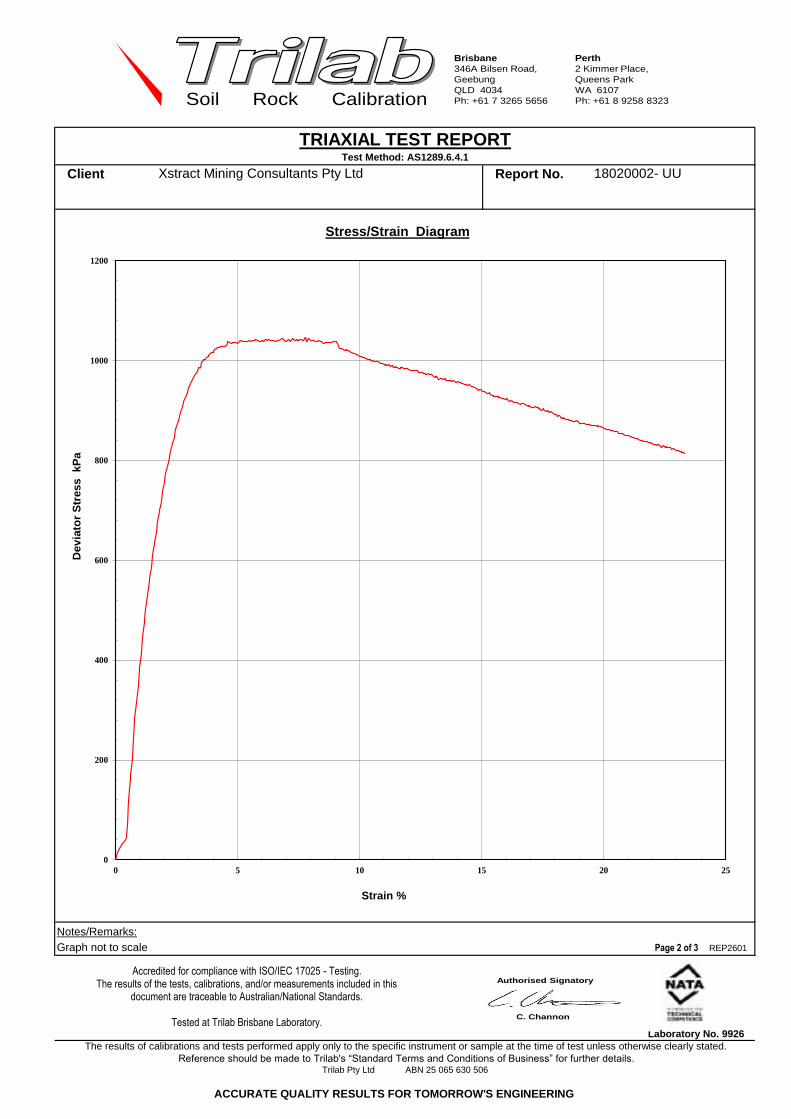
Brisbane346A Bilsen Road, GeebungQLD 4034 Ph: +61 7 3265 5656
Perth2 Kimmer Place, Queens Park WA 6107 Ph: +61 8 9258 8323Soil Rock Calibration
Client Report No.
Notes/Remarks:Graph not to scale Page 2 of 3 REP2601
Laboratory No. 9926 The results of calibrations and tests performed apply only to the specific instrument or sample at the time of test unless otherwise clearly stated.
Reference should be made to Trilab's “Standard Terms and Conditions of Business” for further details.Trilab Pty Ltd ABN 25 065 630 506
TRIAXIAL TEST REPORTTest Method: AS1289.6.4.1
18020002- UUXstract Mining Consultants Pty Ltd
Authorised Signatory
T. Lockhart
0
200
400
600
800
1000
1200
0 5 10 15 20 25
Dev
iato
r S
tres
s k
Pa
Strain %
Stress/Strain Diagram
Accredited for compliance with ISO/IEC 17025 - Testing. The results of the tests, calibrations, and/or measurements included in this
document are traceable to Australian/National Standards.
Tested at Trilab Brisbane Laboratory.
Authorised Signatory
C. Channon
ACCURATE QUALITY RESULTS FOR TOMORROW'S ENGINEERING
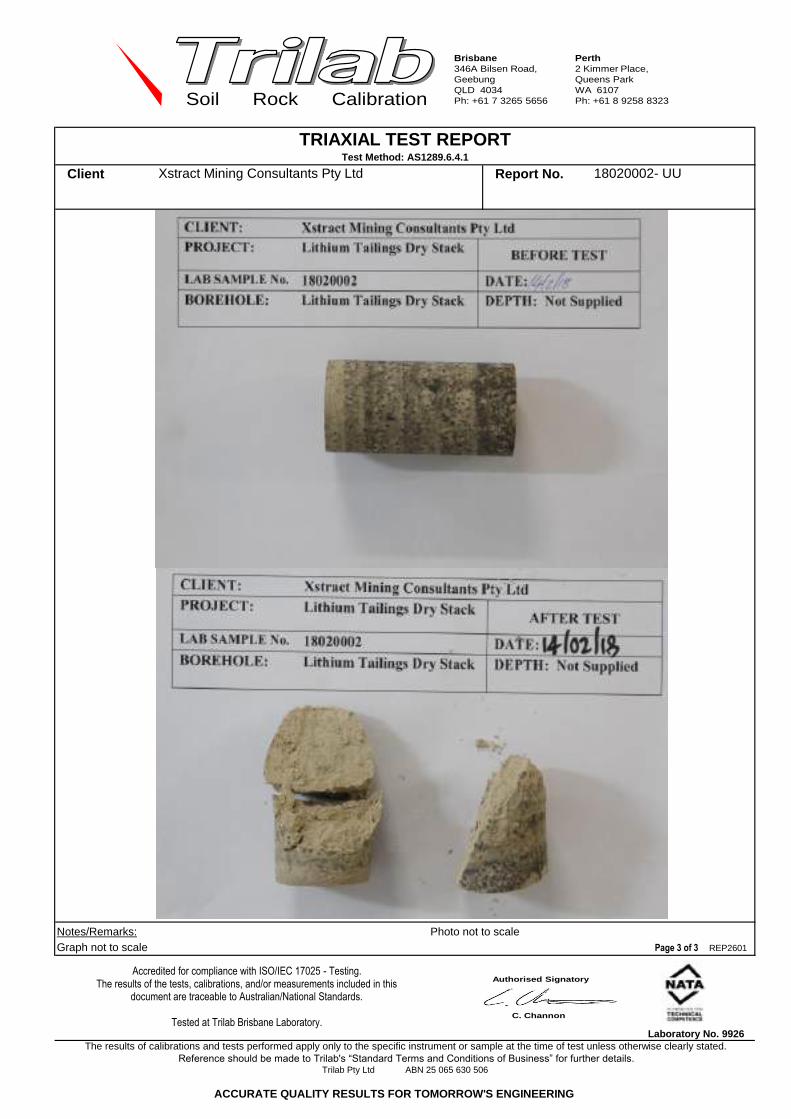
Brisbane346A Bilsen Road, GeebungQLD 4034 Ph: +61 7 3265 5656
Perth2 Kimmer Place, Queens Park WA 6107 Ph: +61 8 9258 8323Soil Rock Calibration
Client Report No.
Notes/Remarks: Photo not to scaleGraph not to scale Page 3 of 3 REP2601
Laboratory No. 9926 The results of calibrations and tests performed apply only to the specific instrument or sample at the time of test unless otherwise clearly stated.
Reference should be made to Trilab's “Standard Terms and Conditions of Business” for further details.Trilab Pty Ltd ABN 25 065 630 506
18020002- UU
TRIAXIAL TEST REPORTTest Method: AS1289.6.4.1
Xstract Mining Consultants Pty Ltd
Authorised Signatory
T. Lockhart
Accredited for compliance with ISO/IEC 17025 - Testing. The results of the tests, calibrations, and/or measurements included in this
document are traceable to Australian/National Standards.
Tested at Trilab Brisbane Laboratory.
Authorised Signatory
C. Channon
ACCURATE QUALITY RESULTS FOR TOMORROW'S ENGINEERING
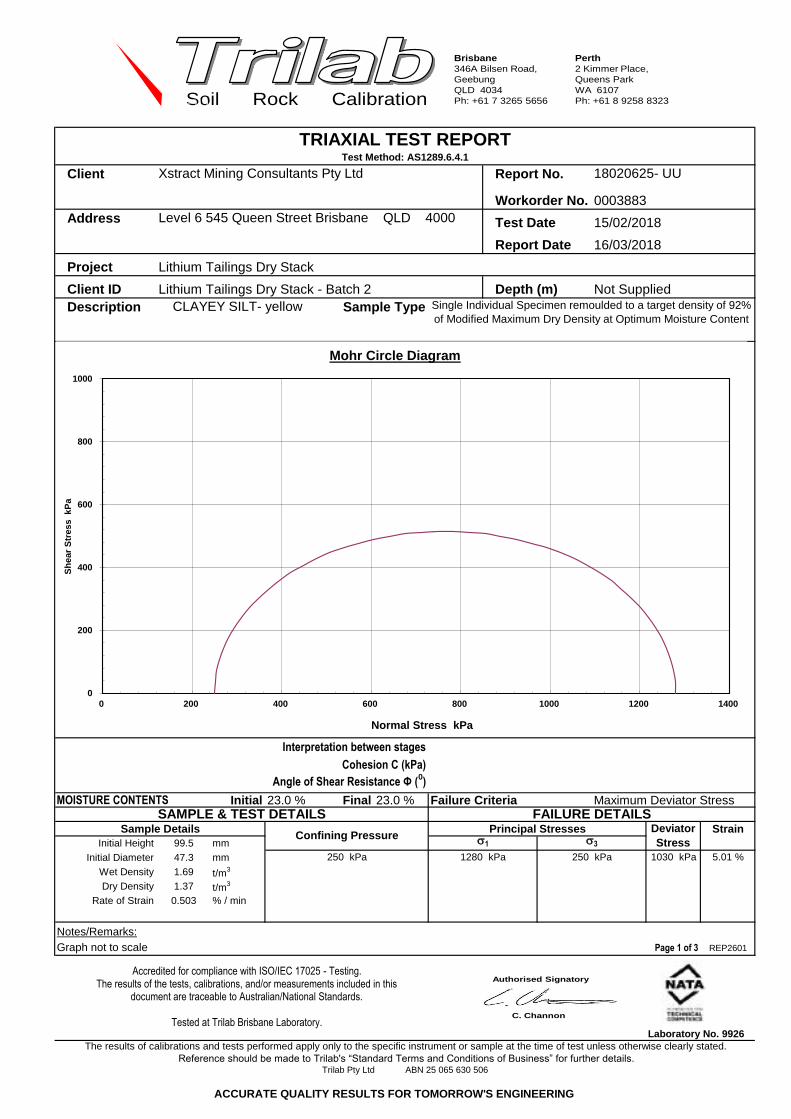
Brisbane346A Bilsen Road, GeebungQLD 4034 Ph: +61 7 3265 5656
Perth2 Kimmer Place, Queens Park WA 6107 Ph: +61 8 9258 8323Soil Rock Calibrationchrisc 1919
Client Report No.
Address Test Date
Report Date
Project
Client ID Depth (m)Description Sample Type
Interpretation between stages
Cohesion C (kPa)
Angle of Shear Resistance Ф (0)
MOISTURE CONTENTS Initial 23.0 % Final 23.0 % Failure Criteria Maximum Deviator Stress
StrainInitial Height 99.5 mm
Initial Diameter 47.3 mm 1030 kPa 5.01 %
Wet Density 1.69 t/m3
Dry Density 1.37 t/m3
Rate of Strain 0.503 % / min
Notes/Remarks:Graph not to scale Page 1 of 3 REP2601
Laboratory No. 9926
Sample Detailss3
250 kPa
Deviator Stresss1
250 kPa 1280 kPa
Confining Pressure
FAILURE DETAILSPrincipal Stresses
SAMPLE & TEST DETAILS
CLAYEY SILT- yellow Single Individual Specimen remoulded to a target density of 92% of Modified Maximum Dry Density at Optimum Moisture Content
Trilab Pty Ltd ABN 25 065 630 506
The results of calibrations and tests performed apply only to the specific instrument or sample at the time of test unless otherwise clearly stated. Reference should be made to Trilab's “Standard Terms and Conditions of Business” for further details.
TRIAXIAL TEST REPORTTest Method: AS1289.6.4.1
Not Supplied
18020625- UU
16/03/2018
15/02/2018
Xstract Mining Consultants Pty Ltd
Level 6 545 Queen Street Brisbane QLD 4000
Lithium Tailings Dry Stack - Batch 2
Lithium Tailings Dry Stack
0003883Workorder No.
Authorised Signatory
T. Lockhart
0
200
400
600
800
1000
0 200 400 600 800 1000 1200 1400
Sh
ear
Str
ess
kP
a
Normal Stress kPa
Mohr Circle Diagram
Accredited for compliance with ISO/IEC 17025 - Testing. The results of the tests, calibrations, and/or measurements included in this
document are traceable to Australian/National Standards.
Tested at Trilab Brisbane Laboratory.
Authorised Signatory
C. Channon
ACCURATE QUALITY RESULTS FOR TOMORROW'S ENGINEERING
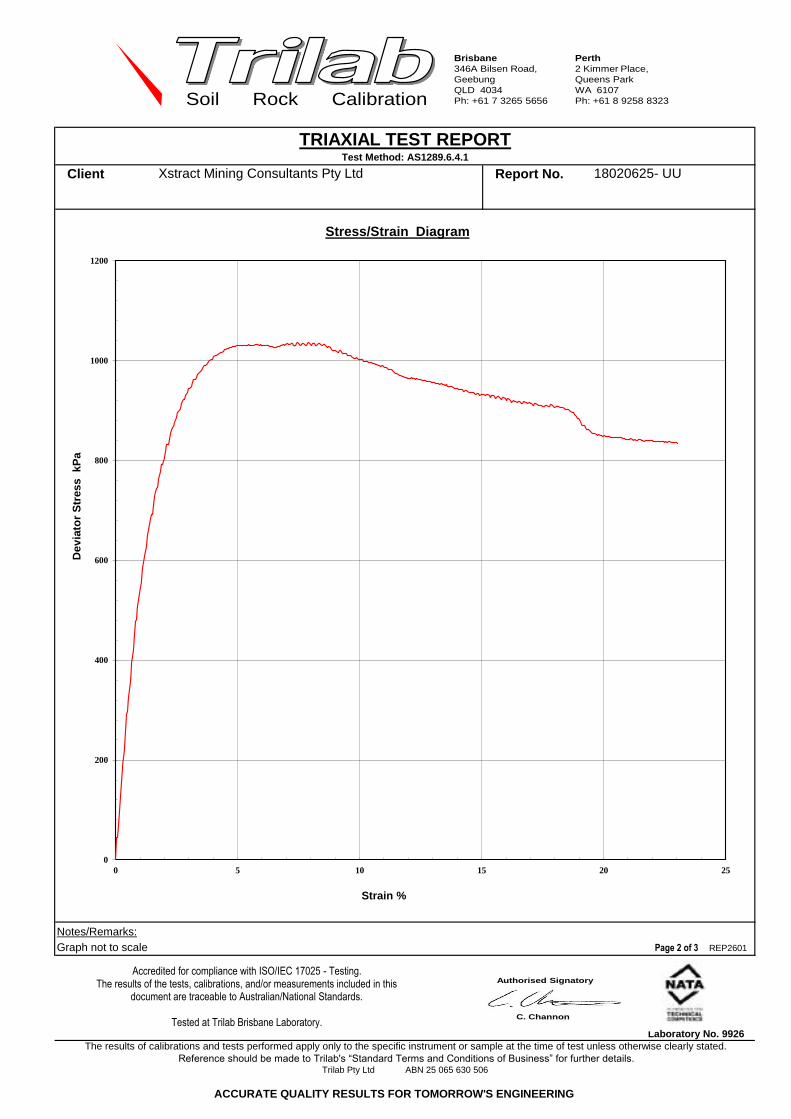
Brisbane346A Bilsen Road, GeebungQLD 4034 Ph: +61 7 3265 5656
Perth2 Kimmer Place, Queens Park WA 6107 Ph: +61 8 9258 8323Soil Rock Calibration
Client Report No.
Notes/Remarks:Graph not to scale Page 2 of 3 REP2601
Laboratory No. 9926 The results of calibrations and tests performed apply only to the specific instrument or sample at the time of test unless otherwise clearly stated.
Reference should be made to Trilab's “Standard Terms and Conditions of Business” for further details.Trilab Pty Ltd ABN 25 065 630 506
TRIAXIAL TEST REPORTTest Method: AS1289.6.4.1
18020625- UUXstract Mining Consultants Pty Ltd
Authorised Signatory
T. Lockhart
0
200
400
600
800
1000
1200
0 5 10 15 20 25
Dev
iato
r S
tres
s k
Pa
Strain %
Stress/Strain Diagram
Accredited for compliance with ISO/IEC 17025 - Testing. The results of the tests, calibrations, and/or measurements included in this
document are traceable to Australian/National Standards.
Tested at Trilab Brisbane Laboratory.
Authorised Signatory
C. Channon
ACCURATE QUALITY RESULTS FOR TOMORROW'S ENGINEERING
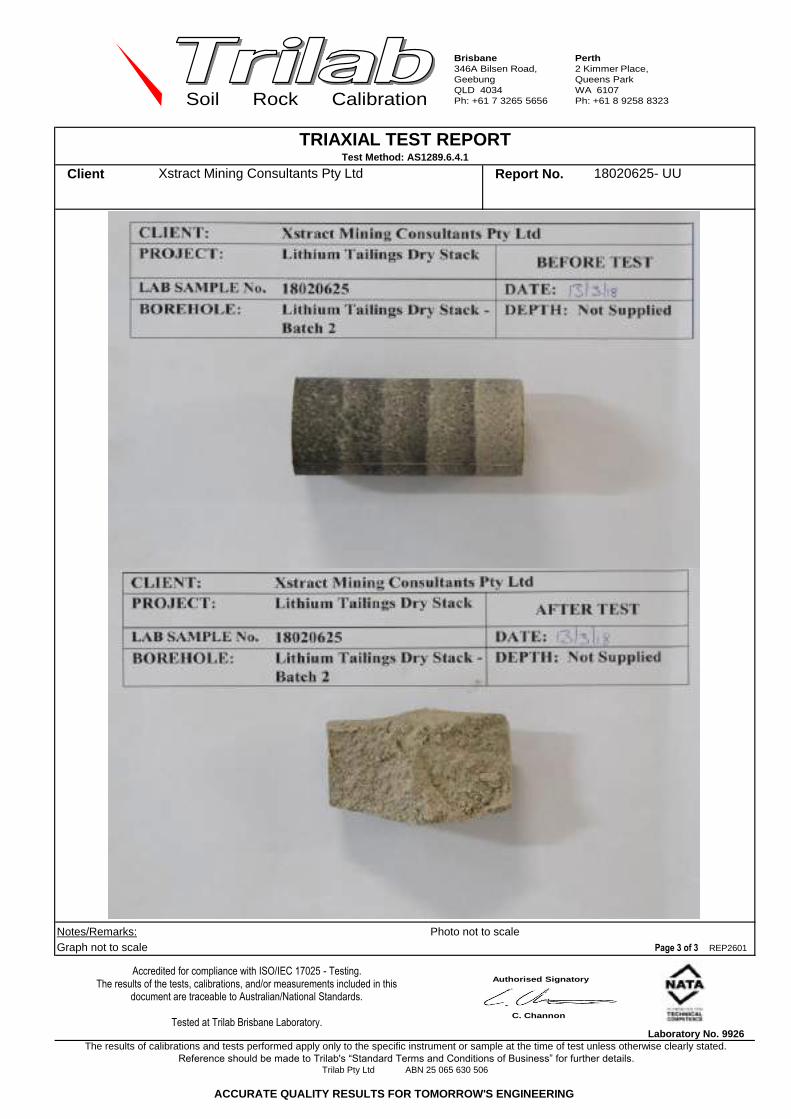
Brisbane346A Bilsen Road, GeebungQLD 4034 Ph: +61 7 3265 5656
Perth2 Kimmer Place, Queens Park WA 6107 Ph: +61 8 9258 8323Soil Rock Calibration
Client Report No.
Notes/Remarks: Photo not to scaleGraph not to scale Page 3 of 3 REP2601
Laboratory No. 9926 The results of calibrations and tests performed apply only to the specific instrument or sample at the time of test unless otherwise clearly stated.
Reference should be made to Trilab's “Standard Terms and Conditions of Business” for further details.Trilab Pty Ltd ABN 25 065 630 506
18020625- UU
TRIAXIAL TEST REPORTTest Method: AS1289.6.4.1
Xstract Mining Consultants Pty Ltd
Authorised Signatory
T. Lockhart
Accredited for compliance with ISO/IEC 17025 - Testing. The results of the tests, calibrations, and/or measurements included in this
document are traceable to Australian/National Standards.
Tested at Trilab Brisbane Laboratory.
Authorised Signatory
C. Channon
ACCURATE QUALITY RESULTS FOR TOMORROW'S ENGINEERING

Brisbane346A Bilsen Road, GeebungQLD 4034 Ph: +61 7 3265 5656
Perth2 Kimmer Place, Queens Park WA 6107 Ph: +61 8 9258 8323Soil Rock Calibrationchrisc 1919
Client Report No.
Address Test Date
Report Date
Project
Client ID Depth (m)Description Sample Type
Interpretation between stages
Cohesion C (kPa)
Angle of Shear Resistance Ф (0)
MOISTURE CONTENTS Initial 24.1 % Final 24.1 % Failure Criteria Maximum Deviator Stress
StrainInitial Height 99.6 mm
Initial Diameter 47.1 mm 1067 kPa 4.94 %
Wet Density 1.71 t/m3
Dry Density 1.37 t/m3
Rate of Strain 0.502 % / min
Notes/Remarks:Graph not to scale Page 1 of 3 REP2601
Laboratory No. 9926
Sample Detailss3
FAILURE DETAILSPrincipal Stresses
SAMPLE & TEST DETAILS
CLAYEY SILT- yellow Single Individual Specimen remoulded to a target density of 92% of Modified Maximum Dry Density at Optimum Moisture Content
250 kPa
Deviator Stresss1
250 kPa 1317 kPa
Confining Pressure
Trilab Pty Ltd ABN 25 065 630 506
The results of calibrations and tests performed apply only to the specific instrument or sample at the time of test unless otherwise clearly stated. Reference should be made to Trilab's “Standard Terms and Conditions of Business” for further details.
TRIAXIAL TEST REPORTTest Method: AS1289.6.4.1
Not Supplied
18020626- UU
16/03/2018
15/02/2018
Xstract Mining Consultants Pty Ltd
Level 6 545 Queen Street Brisbane QLD 4000
Lithium Tailings Dry Stack - Batch 3
Lithium Tailings Dry Stack
0003883Workorder No.
Authorised Signatory
T. Lockhart
0
200
400
600
800
0 200 400 600 800 1000 1200 1400
Sh
ear
Str
ess
kP
a
Normal Stress kPa
Mohr Circle Diagram
Accredited for compliance with ISO/IEC 17025 - Testing. The results of the tests, calibrations, and/or measurements included in this
document are traceable to Australian/National Standards.
Tested at Trilab Brisbane Laboratory.
Authorised Signatory
C. Channon
ACCURATE QUALITY RESULTS FOR TOMORROW'S ENGINEERING

Brisbane346A Bilsen Road, GeebungQLD 4034 Ph: +61 7 3265 5656
Perth2 Kimmer Place, Queens Park WA 6107 Ph: +61 8 9258 8323Soil Rock Calibration
Client Report No.
Notes/Remarks:Graph not to scale Page 2 of 3 REP2601
Laboratory No. 9926 The results of calibrations and tests performed apply only to the specific instrument or sample at the time of test unless otherwise clearly stated.
Reference should be made to Trilab's “Standard Terms and Conditions of Business” for further details.Trilab Pty Ltd ABN 25 065 630 506
TRIAXIAL TEST REPORTTest Method: AS1289.6.4.1
18020626- UUXstract Mining Consultants Pty Ltd
Authorised Signatory
T. Lockhart
0
200
400
600
800
1000
1200
0 5 10 15 20 25
Dev
iato
r S
tres
s k
Pa
Strain %
Stress/Strain Diagram
Accredited for compliance with ISO/IEC 17025 - Testing. The results of the tests, calibrations, and/or measurements included in this
document are traceable to Australian/National Standards.
Tested at Trilab Brisbane Laboratory.
Authorised Signatory
C. Channon
ACCURATE QUALITY RESULTS FOR TOMORROW'S ENGINEERING

Brisbane346A Bilsen Road, GeebungQLD 4034 Ph: +61 7 3265 5656
Perth2 Kimmer Place, Queens Park WA 6107 Ph: +61 8 9258 8323Soil Rock Calibration
Client Report No.
Notes/Remarks: Photo not to scaleGraph not to scale Page 3 of 3 REP2601
Laboratory No. 9926 The results of calibrations and tests performed apply only to the specific instrument or sample at the time of test unless otherwise clearly stated.
Reference should be made to Trilab's “Standard Terms and Conditions of Business” for further details.Trilab Pty Ltd ABN 25 065 630 506
18020626- UU
TRIAXIAL TEST REPORTTest Method: AS1289.6.4.1
Xstract Mining Consultants Pty Ltd
Authorised Signatory
T. Lockhart
Accredited for compliance with ISO/IEC 17025 - Testing. The results of the tests, calibrations, and/or measurements included in this
document are traceable to Australian/National Standards.
Tested at Trilab Brisbane Laboratory.
Authorised Signatory
C. Channon
ACCURATE QUALITY RESULTS FOR TOMORROW'S ENGINEERING

Xstract – Excellence from the outset
XstractGroup.com
Level 2, 50 St Georges Terrace, PERTH WA 6000 | PO Box Z5426, PERTH WA 6831
T +61 8 9327 9500 | F +61 8 9481 8700 | Xstract Mining Consultants Pty Ltd | ABN 62 129 791 279
Triaxial Testing - CU (consolidated, undrained) - (elastic
properties) - multi stage
AS1289.6.4.2

Brisbane346A Bilsen Road, GeebungQLD 4034 Ph: +61 7 3265 5656
Perth2 Kimmer Place, Queens Park WA 6107 Ph: +61 8 9258 8323Soil Rock Calibration
chrisc 1919
Client: Report No.:
Address Test Date:
Report Date:
Project:
Client Id.: Depth (m):
Description:
Initial Height: 99.5 mm Initial Moisture Content: 23.7 % Rate of Strain: 0.004 %/min
Initial Diameter: 47.7 mm Final Moisture Content: 33.4 % B Response: 98 %
L/D Ratio: 2.1 : 1 Wet Density: 1.71 t/m3
Dry Density: 1.39 t/m3
Sample Type: Single Individual Specimen remoulded to a target density of 92% of Modified Maximum Dry Density at Optimum Moisture Content
Strain
s'1 / s'3
250 kPa 750 kPa 500 kPa 496 kPa 594 kPa 5.027 2.64 %
Interpretation between stages :
Cohesion C' (kPa) :
Angle of Shear Resistance Ф' (Degrees) :
Failure Criteria: Peak Principal Stress Ratio
Remarks:
Sample/s supplied by the client
TEST RESULTS
FAILURE ENVELOPES
Trilab Pty LtdABN 25 065 630 506
Laboratory Number 9926
The results of calibrations and tests performed apply only to the specific instrument or sample at the time of test unless otherwise clearly stated.
Reference should be made to Trilab's “Standard Terms and Conditions of Business” for further details.
REP03001
Page 1 of 6
764 kPa 152 kPa
Principal Effective Stresses
s'1
Deviator Stress
s'3
612 kPa
Lithium Tailings Dry Stack
FAILURE DETAILS
SAMPLE & TEST DETAILS
Confining
Pressure
Back
Pressure Initial Pore
Failure
PoreEffective Pressure
27/02/2018
Lithium Tailings Dry Stack
Not Supplied
CLAYEY SILT- grey
TRIAXIAL TEST REPORTTest Method: AS1289.6.4.2
18020002 - CU
15/02/2018
Xstract Mining Consultants Pty Ltd
Level 6 545 Queen Street Brisbane QLD 40000003771Workorder No.
Authorised Signatory
T. Lockhart
Accredited for compliance with ISO/IEC 17025 - Testing. The results of the tests, calibrations, and/or measurements included in this
document are traceable to Australian/National Standards.
Tested at Trilab Brisbane Laboratory.
Authorised Signatory
C. Channon

Brisbane346A Bilsen Road, GeebungQLD 4034 Ph: +61 7 3265 5656
Perth2 Kimmer Place, Queens Park WA 6107 Ph: +61 8 9258 8323Soil Rock Calibration
Client: Report No.:
Interpretation between stages :
Cohesion C' (kPa) :
Angle of Shear Resistance Ф' (Degrees) :
Failure Criteria: Peak Principal Stress Ratio
Remarks:
Sample/s supplied by the client Note: Graph not to scale
The results of calibrations and tests performed apply only to the specific instrument or sample at the time of test unless otherwise clearly stated.
Reference should be made to Trilab's “Standard Terms and Conditions of Business” for further details.
Trilab Pty LtdABN 25 065 630 506
Page 2 of 6
REP03001
Laboratory Number 9926
Xstract Mining Consultants Pty Ltd 18020002 - CU
TRIAXIAL TEST REPORTTest Method: AS1289.6.4.2
Authorised Signatory
T. Lockhart
0
200
400
600
800
0 200 400 600 800
Shea
r St
ress
(kP
a)
Principal Stress (kPa)
Mohr Circle Diagram
Accredited for compliance with ISO/IEC 17025 - Testing. The results of the tests, calibrations, and/or measurements included in this
document are traceable to Australian/National Standards.
Tested at Trilab Brisbane Laboratory.
Authorised Signatory
C. Channon
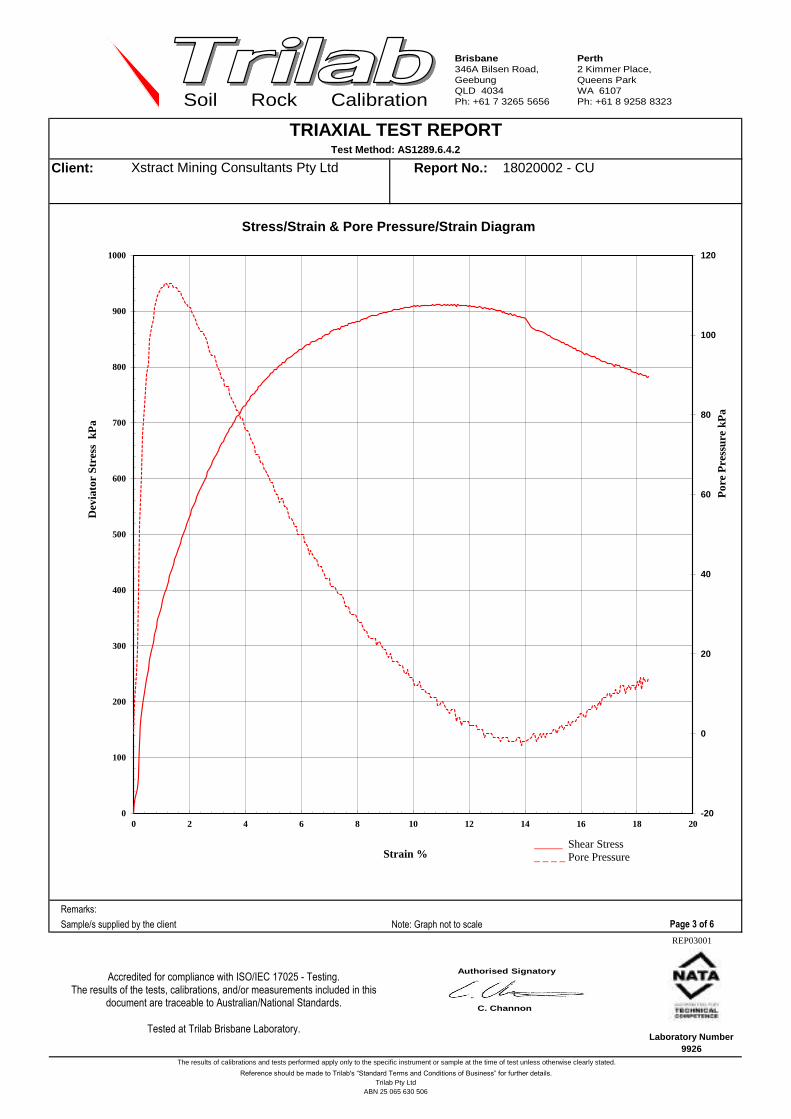
Brisbane346A Bilsen Road, GeebungQLD 4034 Ph: +61 7 3265 5656
Perth2 Kimmer Place, Queens Park WA 6107 Ph: +61 8 9258 8323Soil Rock Calibration
Client: Report No.:
Remarks:
Sample/s supplied by the client Note: Graph not to scale
Trilab Pty LtdABN 25 065 630 506
The results of calibrations and tests performed apply only to the specific instrument or sample at the time of test unless otherwise clearly stated.
Reference should be made to Trilab's “Standard Terms and Conditions of Business” for further details.
Page 3 of 6
REP03001
Laboratory Number 9926
Xstract Mining Consultants Pty Ltd 18020002 - CU
TRIAXIAL TEST REPORTTest Method: AS1289.6.4.2
Authorised Signatory
T. Lockhart
-20
0
20
40
60
80
100
120
0
100
200
300
400
500
600
700
800
900
1000
0 2 4 6 8 10 12 14 16 18 20
Por
e P
ress
ure
kPa
Dev
iato
r St
ress
kP
a
Strain %
Stress/Strain & Pore Pressure/Strain Diagram
_____ Shear Stress
_ _ _ _ Pore Pressure
Accredited for compliance with ISO/IEC 17025 - Testing. The results of the tests, calibrations, and/or measurements included in this
document are traceable to Australian/National Standards.
Tested at Trilab Brisbane Laboratory.
Authorised Signatory
C. Channon

Brisbane346A Bilsen Road, GeebungQLD 4034 Ph: +61 7 3265 5656
Perth2 Kimmer Place, Queens Park WA 6107 Ph: +61 8 9258 8323Soil Rock Calibration
Client: Report No.:
Remarks:
Sample/s supplied by the client Note: Graph not to scale
Reference should be made to Trilab's “Standard Terms and Conditions of Business” for further details.
Trilab Pty LtdABN 25 065 630 506
The results of calibrations and tests performed apply only to the specific instrument or sample at the time of test unless otherwise clearly stated.
Page 4 of 6
REP03001
Laboratory Number 9926
TRIAXIAL TEST REPORTTest Method: AS1289.6.4.2
Xstract Mining Consultants Pty Ltd 18020002 - CU
Authorised Signatory
T. Lockhart
0
200
400
600
800
1000
0 200 400 600 800 1000
t =
(s' 1
- s
' 3)/
2 k
Pa
s = (s'1 + s'3)/2 kPa
MIT Method - Effective Stress Path
Accredited for compliance with ISO/IEC 17025 - Testing. The results of the tests, calibrations, and/or measurements included in this
document are traceable to Australian/National Standards.
Tested at Trilab Brisbane Laboratory.
Authorised Signatory
C. Channon
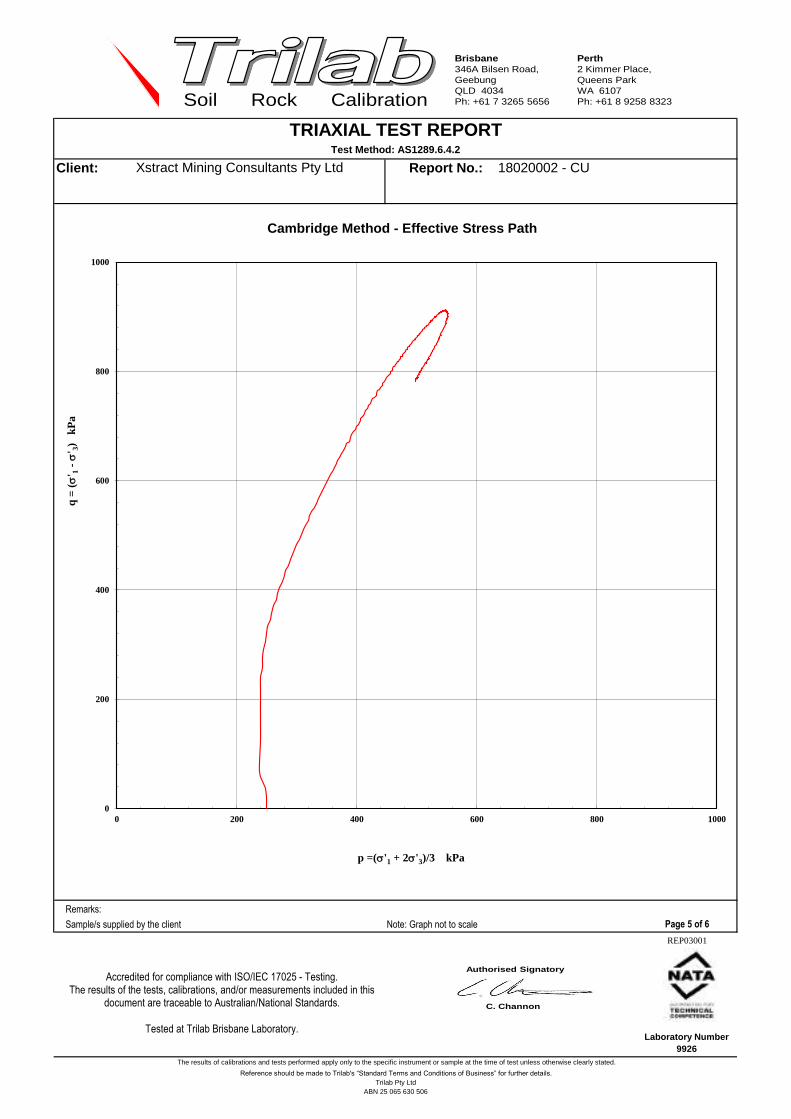
Brisbane346A Bilsen Road, GeebungQLD 4034 Ph: +61 7 3265 5656
Perth2 Kimmer Place, Queens Park WA 6107 Ph: +61 8 9258 8323Soil Rock Calibration
Client: Report No.:
Remarks:
Sample/s supplied by the client Note: Graph not to scale
TRIAXIAL TEST REPORTTest Method: AS1289.6.4.2
Xstract Mining Consultants Pty Ltd 18020002 - CU
The results of calibrations and tests performed apply only to the specific instrument or sample at the time of test unless otherwise clearly stated.
Reference should be made to Trilab's “Standard Terms and Conditions of Business” for further details.
Trilab Pty LtdABN 25 065 630 506
Laboratory Number 9926
Page 5 of 6
REP03001
Authorised Signatory
T. Lockhart
0
200
400
600
800
1000
0 200 400 600 800 1000
q =
(s' 1
- s
' 3)
kP
a
p =(s'1 + 2s'3)/3 kPa
Cambridge Method - Effective Stress Path
Accredited for compliance with ISO/IEC 17025 - Testing. The results of the tests, calibrations, and/or measurements included in this
document are traceable to Australian/National Standards.
Tested at Trilab Brisbane Laboratory.
Authorised Signatory
C. Channon

Brisbane346A Bilsen Road, GeebungQLD 4034 Ph: +61 7 3265 5656
Perth2 Kimmer Place, Queens Park WA 6107 Ph: +61 8 9258 8323Soil Rock Calibration
Client: Report No.:
Remarks:
Sample/s supplied by the client Note: Photo not to scale
Trilab Pty Ltd
TRIAXIAL TEST REPORTTest Method: AS1289.6.4.2
Xstract Mining Consultants Pty Ltd 18020002 - CU
Reference should be made to Trilab's “Standard Terms and Conditions of Business” for further details.
ABN 25 065 630 506
The results of calibrations and tests performed apply only to the specific instrument or sample at the time of test unless otherwise clearly stated.
Laboratory Number 9926
REP03001
Page 6 of 6
Authorised Signatory
T. Lockhart
Accredited for compliance with ISO/IEC 17025 - Testing. The results of the tests, calibrations, and/or measurements included in this
document are traceable to Australian/National Standards.
Tested at Trilab Brisbane Laboratory.
Authorised Signatory
C. Channon

Brisbane346A Bilsen Road, GeebungQLD 4034 Ph: +61 7 3265 5656
Perth2 Kimmer Place, Queens Park WA 6107 Ph: +61 8 9258 8323Soil Rock Calibration
chrisc 1919
Client: Report No.:
Address Test Date:
Report Date:
Project:
Client Id.: Depth (m):
Description:
Initial Height: 99.4 mm Initial Moisture Content: 23.0 % Rate of Strain: 0.006 %/min
Initial Diameter: 47.1 mm Final Moisture Content: 32.0 % B Response: 97 %
L/D Ratio: 2.1 : 1 Wet Density: 1.70 t/m3
Dry Density: 1.38 t/m3
Sample Type: Single Individual Specimen remoulded to a target density of 92% of Modified Maximum Dry Density at Optimum Moisture Content
Strain
s'1 / s'3
244 kPa 752 kPa 508 kPa 508 kPa 568 kPa 4.896 2.86 %
Interpretation between stages :
Cohesion C' (kPa) :
Angle of Shear Resistance Ф' (Degrees) :
Failure Criteria: Peak Principal Stress Ratio
Remarks:
Sample/s supplied by the client
TEST RESULTS
FAILURE ENVELOPES
Trilab Pty LtdABN 25 065 630 506
Laboratory Number 9926
The results of calibrations and tests performed apply only to the specific instrument or sample at the time of test unless otherwise clearly stated.
Reference should be made to Trilab's “Standard Terms and Conditions of Business” for further details.
REP03001
Page 1 of 6
903 kPa 184 kPa
Principal Effective Stresses
s'1
Deviator Stress
s'3
719 kPa
Lithium Tailings Dry Stack - Batch 2
FAILURE DETAILS
SAMPLE & TEST DETAILS
Confining
Pressure
Back
Pressure Initial Pore
Failure
PoreEffective Pressure
16/03/2018
Lithium Tailings Dry Stack
Not Supplied
SILT- grey
TRIAXIAL TEST REPORTTest Method: AS1289.6.4.2
18020625 - CU
5/03/2018
Xstract Mining Consultants Pty Ltd
Level 6 545 Queen Street Brisbane QLD 40000003883Workorder No.
Authorised Signatory
T. Lockhart
Accredited for compliance with ISO/IEC 17025 - Testing. The results of the tests, calibrations, and/or measurements included in this
document are traceable to Australian/National Standards.
Tested at Trilab Brisbane Laboratory.
Authorised Signatory
C. Channon

Brisbane346A Bilsen Road, GeebungQLD 4034 Ph: +61 7 3265 5656
Perth2 Kimmer Place, Queens Park WA 6107 Ph: +61 8 9258 8323Soil Rock Calibration
Client: Report No.:
Interpretation between stages :
Cohesion C' (kPa) :
Angle of Shear Resistance Ф' (Degrees) :
Failure Criteria: Peak Principal Stress Ratio
Remarks:
Sample/s supplied by the client Note: Graph not to scale
The results of calibrations and tests performed apply only to the specific instrument or sample at the time of test unless otherwise clearly stated.
Reference should be made to Trilab's “Standard Terms and Conditions of Business” for further details.
Trilab Pty LtdABN 25 065 630 506
Page 2 of 6
REP03001
Laboratory Number 9926
Xstract Mining Consultants Pty Ltd 18020625 - CU
TRIAXIAL TEST REPORTTest Method: AS1289.6.4.2
Authorised Signatory
T. Lockhart
0
200
400
600
800
1000
0 200 400 600 800 1000
Shea
r St
ress
(kP
a)
Principal Stress (kPa)
Mohr Circle Diagram
Accredited for compliance with ISO/IEC 17025 - Testing. The results of the tests, calibrations, and/or measurements included in this
document are traceable to Australian/National Standards.
Tested at Trilab Brisbane Laboratory.
Authorised Signatory
C. Channon

Brisbane346A Bilsen Road, GeebungQLD 4034 Ph: +61 7 3265 5656
Perth2 Kimmer Place, Queens Park WA 6107 Ph: +61 8 9258 8323Soil Rock Calibration
Client: Report No.:
Remarks:
Sample/s supplied by the client Note: Graph not to scale
Trilab Pty LtdABN 25 065 630 506
The results of calibrations and tests performed apply only to the specific instrument or sample at the time of test unless otherwise clearly stated.
Reference should be made to Trilab's “Standard Terms and Conditions of Business” for further details.
Page 3 of 6
REP03001
Laboratory Number 9926
Xstract Mining Consultants Pty Ltd 18020625 - CU
TRIAXIAL TEST REPORTTest Method: AS1289.6.4.2
Authorised Signatory
T. Lockhart
0
10
20
30
40
50
60
70
80
90
100
0
100
200
300
400
500
600
700
800
900
1000
0 2 4 6 8 10 12 14 16 18
Por
e P
ress
ure
kPa
Dev
iato
r St
ress
kP
a
Strain %
Stress/Strain & Pore Pressure/Strain Diagram
_____ Shear Stress
_ _ _ _ Pore Pressure
Accredited for compliance with ISO/IEC 17025 - Testing. The results of the tests, calibrations, and/or measurements included in this
document are traceable to Australian/National Standards.
Tested at Trilab Brisbane Laboratory.
Authorised Signatory
C. Channon

Brisbane346A Bilsen Road, GeebungQLD 4034 Ph: +61 7 3265 5656
Perth2 Kimmer Place, Queens Park WA 6107 Ph: +61 8 9258 8323Soil Rock Calibration
Client: Report No.:
Remarks:
Sample/s supplied by the client Note: Graph not to scale
Reference should be made to Trilab's “Standard Terms and Conditions of Business” for further details.
Trilab Pty LtdABN 25 065 630 506
The results of calibrations and tests performed apply only to the specific instrument or sample at the time of test unless otherwise clearly stated.
Page 4 of 6
REP03001
Laboratory Number 9926
TRIAXIAL TEST REPORTTest Method: AS1289.6.4.2
Xstract Mining Consultants Pty Ltd 18020625 - CU
Authorised Signatory
T. Lockhart
0
200
400
600
800
1000
0 200 400 600 800 1000
t =
(s' 1
- s
' 3)/
2 k
Pa
s = (s'1 + s'3)/2 kPa
MIT Method - Effective Stress Path
Accredited for compliance with ISO/IEC 17025 - Testing. The results of the tests, calibrations, and/or measurements included in this
document are traceable to Australian/National Standards.
Tested at Trilab Brisbane Laboratory.
Authorised Signatory
C. Channon

Brisbane346A Bilsen Road, GeebungQLD 4034 Ph: +61 7 3265 5656
Perth2 Kimmer Place, Queens Park WA 6107 Ph: +61 8 9258 8323Soil Rock Calibration
Client: Report No.:
Remarks:
Sample/s supplied by the client Note: Graph not to scale
TRIAXIAL TEST REPORTTest Method: AS1289.6.4.2
Xstract Mining Consultants Pty Ltd 18020625 - CU
The results of calibrations and tests performed apply only to the specific instrument or sample at the time of test unless otherwise clearly stated.
Reference should be made to Trilab's “Standard Terms and Conditions of Business” for further details.
Trilab Pty LtdABN 25 065 630 506
Laboratory Number 9926
Page 5 of 6
REP03001
Authorised Signatory
T. Lockhart
0
200
400
600
800
1000
0 200 400 600 800 1000
q =
(s' 1
- s
' 3)
kP
a
p =(s'1 + 2s'3)/3 kPa
Cambridge Method - Effective Stress Path
Accredited for compliance with ISO/IEC 17025 - Testing. The results of the tests, calibrations, and/or measurements included in this
document are traceable to Australian/National Standards.
Tested at Trilab Brisbane Laboratory.
Authorised Signatory
C. Channon

Brisbane346A Bilsen Road, GeebungQLD 4034 Ph: +61 7 3265 5656
Perth2 Kimmer Place, Queens Park WA 6107 Ph: +61 8 9258 8323Soil Rock Calibration
Client: Report No.:
Remarks:
Sample/s supplied by the client Note: Photo not to scale
Trilab Pty Ltd
TRIAXIAL TEST REPORTTest Method: AS1289.6.4.2
Xstract Mining Consultants Pty Ltd 18020625 - CU
Reference should be made to Trilab's “Standard Terms and Conditions of Business” for further details.
ABN 25 065 630 506
The results of calibrations and tests performed apply only to the specific instrument or sample at the time of test unless otherwise clearly stated.
Laboratory Number 9926
REP03001
Page 6 of 6
Authorised Signatory
T. Lockhart
Accredited for compliance with ISO/IEC 17025 - Testing. The results of the tests, calibrations, and/or measurements included in this
document are traceable to Australian/National Standards.
Tested at Trilab Brisbane Laboratory.
Authorised Signatory
C. Channon

Brisbane346A Bilsen Road, GeebungQLD 4034 Ph: +61 7 3265 5656
Perth2 Kimmer Place, Queens Park WA 6107 Ph: +61 8 9258 8323Soil Rock Calibration
chrisc 1919
Client: Report No.:
Address Test Date:
Report Date:
Project:
Client Id.: Depth (m):
Description:
Initial Height: 99.6 mm Initial Moisture Content: 24.1 % Rate of Strain: 0.006 %/min
Initial Diameter: 47.3 mm Final Moisture Content: 32.5 % B Response: 100 %
L/D Ratio: 2.1 : 1 Wet Density: 1.69 t/m3
Dry Density: 1.36 t/m3
Sample Type: Single Individual Specimen remoulded to a target density of 92% of Modified Maximum Dry Density at Optimum Moisture Content
Strain
s'1 / s'3
248 kPa 749 kPa 501 kPa 501 kPa 591 kPa 4.675 2.96 %
Interpretation between stages :
Cohesion C' (kPa) :
Angle of Shear Resistance Ф' (Degrees) :
Failure Criteria: Peak Principal Stress Ratio
Remarks:
Sample/s supplied by the client
TRIAXIAL TEST REPORTTest Method: AS1289.6.4.2
18020626 - CU
8/03/2018
Xstract Mining Consultants Pty Ltd
Level 6 545 Queen Street Brisbane QLD 40000003883Workorder No.
Lithium Tailings Dry Stack - Batch 3
FAILURE DETAILS
SAMPLE & TEST DETAILS
Confining
Pressure
Back
Pressure Initial Pore
Failure
PoreEffective Pressure
16/03/2018
Lithium Tailings Dry Stack
Not Supplied
SILT- grey
Page 1 of 6
740 kPa 158 kPa
Principal Effective Stresses
s'1
Deviator Stress
s'3
582 kPa
REP03001
Trilab Pty LtdABN 25 065 630 506
Laboratory Number 9926
The results of calibrations and tests performed apply only to the specific instrument or sample at the time of test unless otherwise clearly stated.
Reference should be made to Trilab's “Standard Terms and Conditions of Business” for further details.
TEST RESULTS
FAILURE ENVELOPES
Authorised Signatory
T. Lockhart
Accredited for compliance with ISO/IEC 17025 - Testing. The results of the tests, calibrations, and/or measurements included in this
document are traceable to Australian/National Standards.
Tested at Trilab Brisbane Laboratory.
Authorised Signatory
C. Channon

Brisbane346A Bilsen Road, GeebungQLD 4034 Ph: +61 7 3265 5656
Perth2 Kimmer Place, Queens Park WA 6107 Ph: +61 8 9258 8323Soil Rock Calibration
Client: Report No.:
Interpretation between stages :
Cohesion C' (kPa) :
Angle of Shear Resistance Ф' (Degrees) :
Failure Criteria: Peak Principal Stress Ratio
Remarks:
Sample/s supplied by the client Note: Graph not to scale
TRIAXIAL TEST REPORTTest Method: AS1289.6.4.2
Xstract Mining Consultants Pty Ltd 18020626 - CU
Laboratory Number 9926
The results of calibrations and tests performed apply only to the specific instrument or sample at the time of test unless otherwise clearly stated.
Reference should be made to Trilab's “Standard Terms and Conditions of Business” for further details.
Trilab Pty LtdABN 25 065 630 506
Page 2 of 6
REP03001
Authorised Signatory
T. Lockhart
0
100
200
300
400
500
600
700
800
0 100 200 300 400 500 600 700 800
Shea
r St
ress
(kP
a)
Principal Stress (kPa)
Mohr Circle Diagram
Accredited for compliance with ISO/IEC 17025 - Testing. The results of the tests, calibrations, and/or measurements included in this
document are traceable to Australian/National Standards.
Tested at Trilab Brisbane Laboratory.
Authorised Signatory
C. Channon
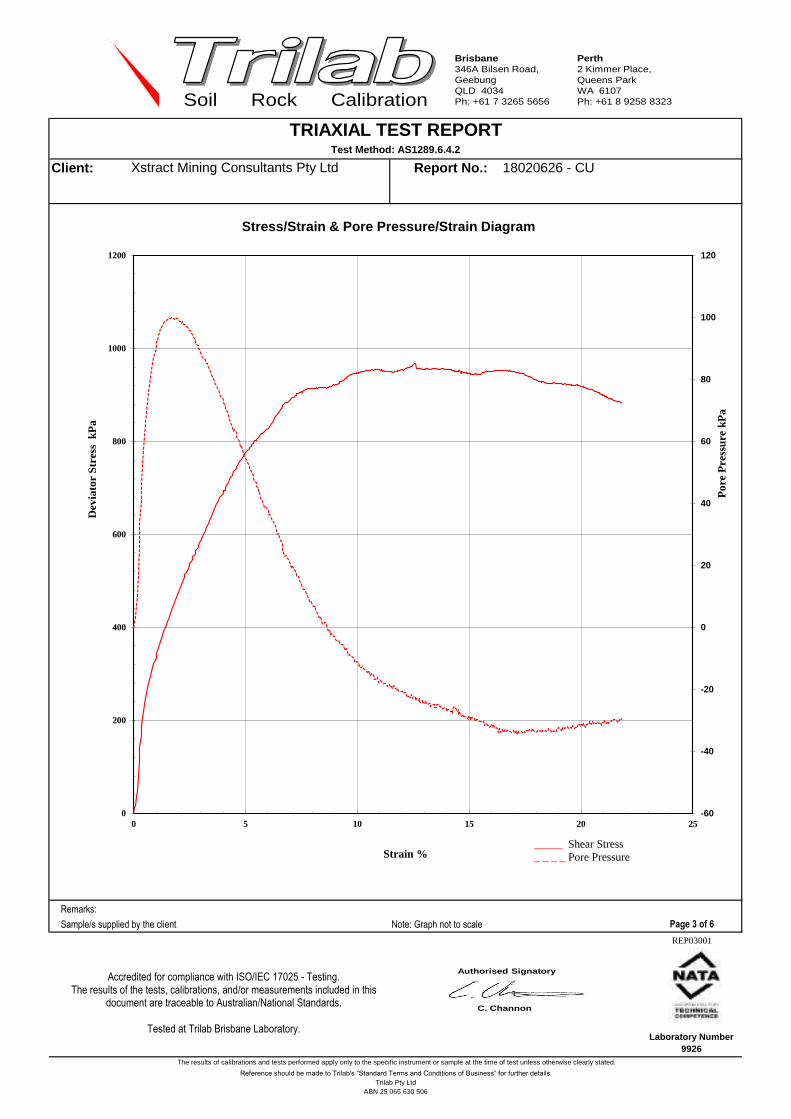
Brisbane346A Bilsen Road, GeebungQLD 4034 Ph: +61 7 3265 5656
Perth2 Kimmer Place, Queens Park WA 6107 Ph: +61 8 9258 8323Soil Rock Calibration
Client: Report No.:
Remarks:
Sample/s supplied by the client Note: Graph not to scale
TRIAXIAL TEST REPORTTest Method: AS1289.6.4.2
Xstract Mining Consultants Pty Ltd 18020626 - CU
Page 3 of 6
REP03001
Laboratory Number 9926
Trilab Pty LtdABN 25 065 630 506
The results of calibrations and tests performed apply only to the specific instrument or sample at the time of test unless otherwise clearly stated.
Reference should be made to Trilab's “Standard Terms and Conditions of Business” for further details.
Authorised Signatory
T. Lockhart
-60
-40
-20
0
20
40
60
80
100
120
0
200
400
600
800
1000
1200
0 5 10 15 20 25
Por
e P
ress
ure
kPa
Dev
iato
r St
ress
kP
a
Strain %
Stress/Strain & Pore Pressure/Strain Diagram
_____ Shear Stress
_ _ _ _ Pore Pressure
Accredited for compliance with ISO/IEC 17025 - Testing. The results of the tests, calibrations, and/or measurements included in this
document are traceable to Australian/National Standards.
Tested at Trilab Brisbane Laboratory.
Authorised Signatory
C. Channon

Brisbane346A Bilsen Road, GeebungQLD 4034 Ph: +61 7 3265 5656
Perth2 Kimmer Place, Queens Park WA 6107 Ph: +61 8 9258 8323Soil Rock Calibration
Client: Report No.:
Remarks:
Sample/s supplied by the client Note: Graph not to scale
TRIAXIAL TEST REPORTTest Method: AS1289.6.4.2
Xstract Mining Consultants Pty Ltd 18020626 - CU
The results of calibrations and tests performed apply only to the specific instrument or sample at the time of test unless otherwise clearly stated.
Page 4 of 6
REP03001
Laboratory Number 9926
Reference should be made to Trilab's “Standard Terms and Conditions of Business” for further details.
Trilab Pty LtdABN 25 065 630 506
Authorised Signatory
T. Lockhart
0
200
400
600
800
1000
1200
0 200 400 600 800 1000 1200
t =
(s' 1
- s
' 3)/
2 k
Pa
s = (s'1 + s'3)/2 kPa
MIT Method - Effective Stress Path
Accredited for compliance with ISO/IEC 17025 - Testing. The results of the tests, calibrations, and/or measurements included in this
document are traceable to Australian/National Standards.
Tested at Trilab Brisbane Laboratory.
Authorised Signatory
C. Channon

Brisbane346A Bilsen Road, GeebungQLD 4034 Ph: +61 7 3265 5656
Perth2 Kimmer Place, Queens Park WA 6107 Ph: +61 8 9258 8323Soil Rock Calibration
Client: Report No.:
Remarks:
Sample/s supplied by the client Note: Graph not to scale
Laboratory Number 9926
Page 5 of 6
REP03001
Reference should be made to Trilab's “Standard Terms and Conditions of Business” for further details.
Trilab Pty LtdABN 25 065 630 506
TRIAXIAL TEST REPORTTest Method: AS1289.6.4.2
Xstract Mining Consultants Pty Ltd 18020626 - CU
The results of calibrations and tests performed apply only to the specific instrument or sample at the time of test unless otherwise clearly stated.
Authorised Signatory
T. Lockhart
0
200
400
600
800
1000
1200
0 200 400 600 800 1000 1200
q =
(s' 1
- s
' 3)
kP
a
p =(s'1 + 2s'3)/3 kPa
Cambridge Method - Effective Stress Path
Accredited for compliance with ISO/IEC 17025 - Testing. The results of the tests, calibrations, and/or measurements included in this
document are traceable to Australian/National Standards.
Tested at Trilab Brisbane Laboratory.
Authorised Signatory
C. Channon

Brisbane346A Bilsen Road, GeebungQLD 4034 Ph: +61 7 3265 5656
Perth2 Kimmer Place, Queens Park WA 6107 Ph: +61 8 9258 8323Soil Rock Calibration
Client: Report No.:
Remarks:
Sample/s supplied by the client Note: Photo not to scale
The results of calibrations and tests performed apply only to the specific instrument or sample at the time of test unless otherwise clearly stated.
Laboratory Number 9926
REP03001
Page 6 of 6
ABN 25 065 630 506Trilab Pty Ltd
TRIAXIAL TEST REPORTTest Method: AS1289.6.4.2
Xstract Mining Consultants Pty Ltd 18020626 - CU
Reference should be made to Trilab's “Standard Terms and Conditions of Business” for further details.
Authorised Signatory
T. Lockhart
Accredited for compliance with ISO/IEC 17025 - Testing. The results of the tests, calibrations, and/or measurements included in this
document are traceable to Australian/National Standards.
Tested at Trilab Brisbane Laboratory.
Authorised Signatory
C. Channon

Xstract – Excellence from the outset
XstractGroup.com
Level 2, 50 St Georges Terrace, PERTH WA 6000 | PO Box Z5426, PERTH WA 6831
T +61 8 9327 9500 | F +61 8 9481 8700 | Xstract Mining Consultants Pty Ltd | ABN 62 129 791 279
Simple Shear (CIU, CAU monotonic test)
Non-standard test (UWA test procedure)

LITHIUM TAILINGS DRY STACK PROJECT:LABORATORY TESTING GEO: N/A
Centre for Offshore Foundation SystemsThe University of Western Australia
XSTRACT_LITHIUM TAILINGS DRY STACK PROJECT: SIMPLE SHEAR TEST XSTR-SS01
Reconstituted at around 92% of MMDD , Sandy Clayey SILTSConsolidation: s'v = 250 kPa, s'h = 125 kPa (K = 0.5), Displacement rate = 0.1 mm/min
Figure: A01
0
50
100
150
200
250
300
0 10 20 30 40
Str
ess,
(kP
a)
Shear strain, γ (%)
s'hs'v
0
50
100
150
200
250
300
0 10 20 30 40
Str
ess
(kP
a)
Shear strain, γ (%)
sv-ubp
Du
0
0.1
0.2
0.3
0.4
0.5
0.6
0.7
0.8
0 10 20 30
Str
ess
rati
o (τ
xy/σ
' v)
Shear strain, γ (%)
0
20
40
60
80
100
120
140
160
0 10 20 30 40
She
ar s
tres
s, τ x
y(k
Pa)
Shear strain, γ (%)
0
1
2
3
4
5
6
7
8
9
0 5 10 15 20
Axi
al (ε a
) &
vol
umet
ric
(εv)
stra
in
(%)
Time (h)
ea
ev
0
50
100
150
200
250
300
0 5 10 15 20
Eff
ecti
ve s
tres
s, σ
' (kP
a)
Time (h)
σ'h
σ'v

LITHIUM TAILINGS DRY STACK PROJECT:LABORATORY TESTING GEO: N/A
Centre for Offshore Foundation SystemsThe University of Western Australia
XSTRACT_LITHIUM TAILINGS DRY STACK PROJECT: SIMPLE SHEAR TEST XSTR-SS01
Reconstituted at around 92% of MMDD , Sandy Clayey SILTS
Consolidation: s'v = 250 kPa, s'h = 125 kPa (K = 0.5), Displacement rate = 0.1 mm/min
XSTR-SS01
XSTR-SS01

Xstract – Excellence from the outset
XstractGroup.com
Level 2, 50 St Georges Terrace, PERTH WA 6000 | PO Box Z5426, PERTH WA 6831
T +61 8 9327 9500 | F +61 8 9481 8700 | Xstract Mining Consultants Pty Ltd | ABN 62 129 791 279
Simple Shear (CIU, CAU cyclic test)
Non-standard test (UWA test procedure)

VINCENT PROJECT:
LABORATORY TESTING
Centre for Offshore Foundation SystemsThe University of Western Australia
XSTRACT_LITHIUM TAILINGS DRY STACK: SIMPLE SHEAR TEST XSTR-SS02 Sample No. Reconstituted at around 92% of MMDD , Depth: , Sandy Clayey SILTSConsolidation: σ'v = 250 kPa, σ'h = 125 kPa (K = 0.5), Cyclic test: τcyc = ± 30.44 kPa
Figure: A01 (a)
-40
-30
-20
-10
0
10
20
30
40
-20 -10 0 10 20
She
ar s
tres
s, τ x
y(k
Pa)
Shear strain, γ (%)
-40
-30
-20
-10
0
10
20
30
40
0 100 200 300
She
ar s
tres
s, τ x
y(k
Pa)
Cycle Number
0
50
100
150
200
250
300
0 5 10 15 20
Eff
ecti
ve s
tres
s, σ
' (kP
a)
Time (h)
σ'h
σ'v
0
1
2
3
4
5
6
7
8
0 5 10 15 20Axi
al (ε
a) &
vol
umet
ric (ε
v) s
train
(%)
Time (h)
ea
ev

VINCENT PROJECT:
LABORATORY TESTING
Centre for Offshore Foundation SystemsThe University of Western Australia
XSTRACT_LITHIUM TAILINGS DRY STACK: SIMPLE SHEAR TEST XSTR-SS02 Sample No. Reconstituted at around 92% of MMDD , Depth: , Sandy Clayey SILTSConsolidation: σ'v = 250 kPa, σ'h = 125 kPa (K = 0.5), Cyclic test: τcyc = ± 30.44 kPa
Figure: A01 (b)
0
50
100
150
200
250
300
0 100 200 300
Str
ess
(kP
a)
Cycle Number
sv-ubp
Du
0
50
100
150
200
250
300
0 50 100 150 200 250
Str
ess,
(kP
a)
Cycle Number
s'hs'v
0123456789
10
0 100 200 300
She
ar S
trai
n, γ
(%)
Cycle Number160
180
200
220
240
260
-20
0
20
40
60
80
0 10 20 30
Por
e P
ress
ure,
Δu
(kP
a)
Str
ess
(kP
a)
Shear strain, γ (%)
Post-Cyclic Monotonic Shearing
τxy
Du

VINCENT PROJECT:
LABORATORY TESTING
Centre for Offshore Foundation SystemsThe University of Western Australia
XSTR-SS02
XSTR-SS02

Xstract – Excellence from the outset
XstractGroup.com
Level 2, 50 St Georges Terrace, PERTH WA 6000 | PO Box Z5426, PERTH WA 6831
T +61 8 9327 9500 | F +61 8 9481 8700 | Xstract Mining Consultants Pty Ltd | ABN 62 129 791 279
Direct Shear (Drained and Undrained Shear Strength)
AS 1289.6.3.1
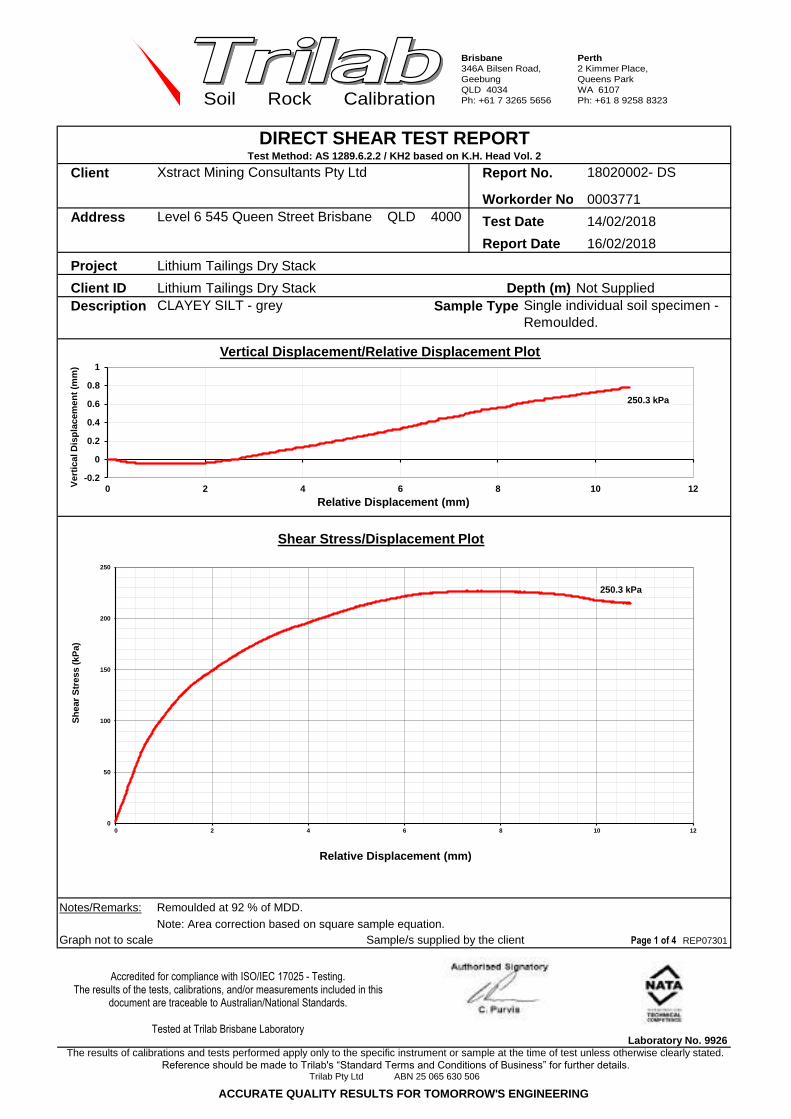
Brisbane346A Bilsen Road, GeebungQLD 4034 Ph: +61 7 3265 5656
Perth2 Kimmer Place, Queens Park WA 6107 Ph: +61 8 9258 8323Soil Rock Calibration
col 1960
Client Report No.
Workorder NoAddress Test Date
Report Date
Project
Client IDDescription Sample Type
Notes/Remarks: Remoulded at 92 % of MDD.Note: Area correction based on square sample equation.
Graph not to scale Sample/s supplied by the client Page 1 of 4 REP07301
Laboratory No. 9926 The results of calibrations and tests performed apply only to the specific instrument or sample at the time of test unless otherwise clearly stated.
DIRECT SHEAR TEST REPORTTest Method: AS 1289.6.2.2 / KH2 based on K.H. Head Vol. 2
Not SuppliedDepth (m)
Xstract Mining Consultants Pty Ltd
Level 6 545 Queen Street Brisbane QLD 4000
Lithium Tailings Dry Stack
18020002- DS
Lithium Tailings Dry Stack
Single individual soil specimen - Remoulded.
CLAYEY SILT - grey
Reference should be made to Trilab's “Standard Terms and Conditions of Business” for further details.Trilab Pty Ltd ABN 25 065 630 506
14/02/2018
16/02/2018
0003771
Authorised Signatory
C. Channon
250.3 kPa
0
50
100
150
200
250
0 2 4 6 8 10 12
Sh
ear
Str
ess
(kP
a)
Relative Displacement (mm)
Shear Stress/Displacement Plot
250.3 kPa
-0.2
0
0.2
0.4
0.6
0.8
1
0 2 4 6 8 10 12Ver
tica
l Dis
pla
cem
ent
(mm
)
Relative Displacement (mm)
Vertical Displacement/Relative Displacement Plot
Accredited for compliance with ISO/IEC 17025 - Testing. The results of the tests, calibrations, and/or measurements included in this
document are traceable to Australian/National Standards.
Tested at Trilab Brisbane Laboratory
ACCURATE QUALITY RESULTS FOR TOMORROW'S ENGINEERING
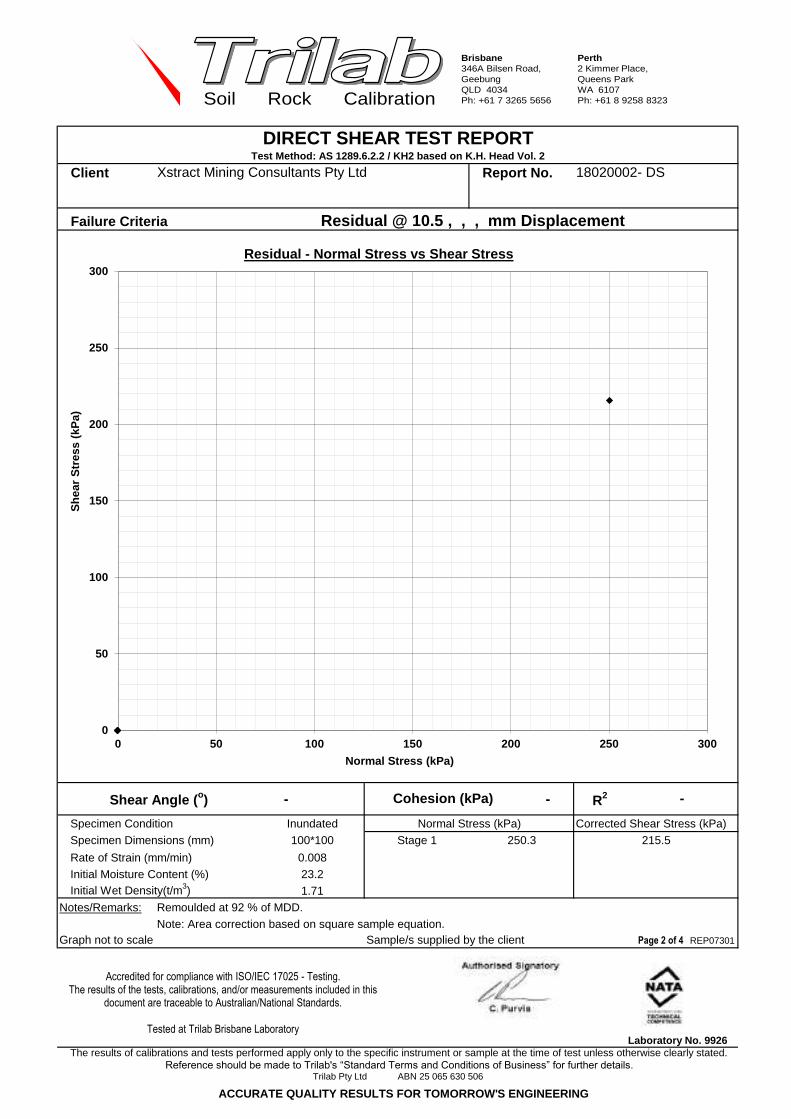
Brisbane346A Bilsen Road, GeebungQLD 4034 Ph: +61 7 3265 5656
Perth2 Kimmer Place, Queens Park WA 6107 Ph: +61 8 9258 8323Soil Rock Calibration
Client Report No.
Failure Criteria
- - R2
Specimen Condition Corrected Shear Stress (kPa)
Specimen Dimensions (mm)
Rate of Strain (mm/min)Initial Moisture Content (%)Initial Wet Density(t/m3)
Notes/Remarks: Remoulded at 92 % of MDD.Note: Area correction based on square sample equation.
Graph not to scale Sample/s supplied by the client Page 2 of 4 REP07301
Laboratory No. 9926
-
23.2
100*100
The results of calibrations and tests performed apply only to the specific instrument or sample at the time of test unless otherwise clearly stated. Reference should be made to Trilab's “Standard Terms and Conditions of Business” for further details.
Trilab Pty Ltd ABN 25 065 630 506
250.3
Shear Angle (o)
215.5
Normal Stress (kPa)
Cohesion (kPa)
Stage 1
1.71
0.008
Inundated
18020002- DS
DIRECT SHEAR TEST REPORT
Residual @ 10.5 , , , mm Displacement
Test Method: AS 1289.6.2.2 / KH2 based on K.H. Head Vol. 2
Xstract Mining Consultants Pty Ltd
Authorised Signatory
C. Channon
0
50
100
150
200
250
300
0 50 100 150 200 250 300
Sh
ear
Str
ess
(kP
a)
Normal Stress (kPa)
Residual - Normal Stress vs Shear Stress
Accredited for compliance with ISO/IEC 17025 - Testing. The results of the tests, calibrations, and/or measurements included in this
document are traceable to Australian/National Standards.
Tested at Trilab Brisbane Laboratory
ACCURATE QUALITY RESULTS FOR TOMORROW'S ENGINEERING

Brisbane346A Bilsen Road, GeebungQLD 4034 Ph: +61 7 3265 5656
Perth2 Kimmer Place, Queens Park WA 6107 Ph: +61 8 9258 8323Soil Rock Calibration
Client Report No.
Failure Criteria
- - R2
Specimen Condition
Specimen Dimensions (mm)
Rate of Strain (mm/min)Initial Moisture Content (%)Initial Wet Density(t/m3)
Notes/Remarks: Remoulded at 92 % of MDD.Note: Area correction based on square sample equation.
Graph not to scale Sample/s supplied by the client Page 3 of 4 REP07301
Laboratory No. 9926
Stage 1
Cohesion (kPa)
0.00823.2
The results of calibrations and tests performed apply only to the specific instrument or sample at the time of test unless otherwise clearly stated.
Peak
Test Method: AS 1289.6.2.2 / KH2 based on K.H. Head Vol. 2
Xstract Mining Consultants Pty Ltd
Shear Angle (o)
100*100
1.71
226.8250.3
Inundated Normal Stress (kPa) Corrected Shear Stress (kPa)
-
Reference should be made to Trilab's “Standard Terms and Conditions of Business” for further details.Trilab Pty Ltd ABN 25 065 630 506
18020002- DS
DIRECT SHEAR TEST REPORT
Authorised Signatory
C. Channon
0
50
100
150
200
250
300
0 50 100 150 200 250 300
Sh
ear
Str
ess
(kP
a)
Normal Stress (kPa)
Peak - Normal Stress vs Shear Stress
Accredited for compliance with ISO/IEC 17025 - Testing. The results of the tests, calibrations, and/or measurements included in this
document are traceable to Australian/National Standards.
Tested at Trilab Brisbane Laboratory
ACCURATE QUALITY RESULTS FOR TOMORROW'S ENGINEERING

Brisbane346A Bilsen Road, GeebungQLD 4034 Ph: +61 7 3265 5656
Perth2 Kimmer Place, Queens Park WA 6107 Ph: +61 8 9258 8323Soil Rock Calibration
Client Report No.
Notes/Remarks:
Photo not to scale Sample/s supplied by the client Page 4 of 4 REP07301
Laboratory No. 9926 The results of calibrations and tests performed apply only to the specific instrument or sample at the time of test unless otherwise clearly stated.
Reference should be made to Trilab's “Standard Terms and Conditions of Business” for further details.Trilab Pty Ltd ABN 25 065 630 506
Xstract Mining Consultants Pty Ltd
DIRECT SHEAR TEST REPORTTest Method: AS 1289.6.2.2 / KH2 based on K.H. Head Vol. 2
18020002- DS
Authorised Signatory
C. Channon
Accredited for compliance with ISO/IEC 17025 - Testing. The results of the tests, calibrations, and/or measurements included in this
document are traceable to Australian/National Standards.
Tested at Trilab Brisbane Laboratory
ACCURATE QUALITY RESULTS FOR TOMORROW'S ENGINEERING

Brisbane346A Bilsen Road, GeebungQLD 4034 Ph: +61 7 3265 5656
Perth2 Kimmer Place, Queens Park WA 6107 Ph: +61 8 9258 8323Soil Rock Calibration
col 1960
Client Report No.
Workorder NoAddress Test Date
Report Date
Project
Client IDDescription Sample Type
Notes/Remarks: Remoulded at 92% of MDD.Note: Area correction based on square sample equation.
Graph not to scale Sample/s supplied by the client Page 1 of 4 REP07301
Laboratory No. 9926
2/03/2018
6/03/2018
0003883
Single individual soil specimen - Remoulded.
SILT - pale grey/brown
Reference should be made to Trilab's “Standard Terms and Conditions of Business” for further details.Trilab Pty Ltd ABN 25 065 630 506
The results of calibrations and tests performed apply only to the specific instrument or sample at the time of test unless otherwise clearly stated.
DIRECT SHEAR TEST REPORTTest Method: AS 1289.6.2.2 / KH2 based on K.H. Head Vol. 2
Not SuppliedDepth (m)
Xstract Mining Consultants Pty Ltd
Level 6 545 Queen Street Brisbane QLD 4000
Lithium Tailings Dry Stack - Batch 2
18020625- DS
Lithium Tailings Dry Stack
Authorised Signatory
C. Channon
250.3 kPa
0
50
100
150
200
250
0 2 4 6 8 10 12
Sh
ear
Str
ess
(kP
a)
Relative Displacement (mm)
Shear Stress/Displacement Plot
250.3 kPa
-0.1
0
0.1
0.2
0.3
0.4
0.5
0.6
0.7
0 1 2 3 4 5 6 7 8 9 10Ver
tica
l Dis
pla
cem
ent
(mm
)
Relative Displacement (mm)
Vertical Displacement/Relative Displacement Plot
Accredited for compliance with ISO/IEC 17025 - Testing. The results of the tests, calibrations, and/or measurements included in this
document are traceable to Australian/National Standards.
Tested at Trilab Brisbane Laboratory
ACCURATE QUALITY RESULTS FOR TOMORROW'S ENGINEERING

Brisbane346A Bilsen Road, GeebungQLD 4034 Ph: +61 7 3265 5656
Perth2 Kimmer Place, Queens Park WA 6107 Ph: +61 8 9258 8323Soil Rock Calibration
Client Report No.
Failure Criteria
- - R2
Specimen Condition Corrected Shear Stress (kPa)Specimen Dimensions (mm)
Rate of Strain (mm/min)Initial Moisture Content (%)Initial Wet Density(t/m3)
Notes/Remarks: Remoulded at 92% of MDD.Note: Area correction based on square sample equation.
Graph not to scale Sample/s supplied by the client Page 2 of 4 REP07301
Laboratory No. 9926
18020625- DS
DIRECT SHEAR TEST REPORT
Residual @ 9 , , , mm Displacement
Test Method: AS 1289.6.2.2 / KH2 based on K.H. Head Vol. 2
Xstract Mining Consultants Pty Ltd
1.71
0.008
Inundated
193.2Normal Stress (kPa)
Cohesion (kPa)
Stage 1
Shear Angle (o) -
24.0
100*100
The results of calibrations and tests performed apply only to the specific instrument or sample at the time of test unless otherwise clearly stated. Reference should be made to Trilab's “Standard Terms and Conditions of Business” for further details.
Trilab Pty Ltd ABN 25 065 630 506
250.3
Authorised Signatory
C. Channon
0
50
100
150
200
250
300
0 50 100 150 200 250 300
Sh
ear
Str
ess
(kP
a)
Normal Stress (kPa)
Residual - Normal Stress vs Shear Stress
Accredited for compliance with ISO/IEC 17025 - Testing. The results of the tests, calibrations, and/or measurements included in this
document are traceable to Australian/National Standards.
Tested at Trilab Brisbane Laboratory
ACCURATE QUALITY RESULTS FOR TOMORROW'S ENGINEERING

Brisbane346A Bilsen Road, GeebungQLD 4034 Ph: +61 7 3265 5656
Perth2 Kimmer Place, Queens Park WA 6107 Ph: +61 8 9258 8323Soil Rock Calibration
Client Report No.
Failure Criteria
- - R2
Specimen ConditionSpecimen Dimensions (mm)
Rate of Strain (mm/min)Initial Moisture Content (%)Initial Wet Density(t/m3)
Notes/Remarks: Remoulded at 92% of MDD.Note: Area correction based on square sample equation.
Graph not to scale Sample/s supplied by the client Page 3 of 4 REP07301
Laboratory No. 9926
18020625- DS
DIRECT SHEAR TEST REPORT
Reference should be made to Trilab's “Standard Terms and Conditions of Business” for further details.Trilab Pty Ltd ABN 25 065 630 506
202.7250.3Inundated Normal Stress (kPa) Corrected Shear Stress (kPa)
-
The results of calibrations and tests performed apply only to the specific instrument or sample at the time of test unless otherwise clearly stated.
Peak
Test Method: AS 1289.6.2.2 / KH2 based on K.H. Head Vol. 2
Xstract Mining Consultants Pty Ltd
Shear Angle (o)
100*100
1.71
Stage 1
Cohesion (kPa)
0.00824.0
Authorised Signatory
C. Channon
0
50
100
150
200
250
300
0 50 100 150 200 250 300
Sh
ear
Str
ess
(kP
a)
Normal Stress (kPa)
Peak - Normal Stress vs Shear Stress
Accredited for compliance with ISO/IEC 17025 - Testing. The results of the tests, calibrations, and/or measurements included in this
document are traceable to Australian/National Standards.
Tested at Trilab Brisbane Laboratory
ACCURATE QUALITY RESULTS FOR TOMORROW'S ENGINEERING

Brisbane346A Bilsen Road, GeebungQLD 4034 Ph: +61 7 3265 5656
Perth2 Kimmer Place, Queens Park WA 6107 Ph: +61 8 9258 8323Soil Rock Calibration
Client Report No.
Notes/Remarks:
Photo not to scale Sample/s supplied by the client Page 4 of 4 REP07301
Laboratory No. 9926
18020625- DS
DIRECT SHEAR TEST REPORTTest Method: AS 1289.6.2.2 / KH2 based on K.H. Head Vol. 2
Xstract Mining Consultants Pty Ltd
The results of calibrations and tests performed apply only to the specific instrument or sample at the time of test unless otherwise clearly stated. Reference should be made to Trilab's “Standard Terms and Conditions of Business” for further details.
Trilab Pty Ltd ABN 25 065 630 506
Authorised Signatory
C. Channon
Accredited for compliance with ISO/IEC 17025 - Testing. The results of the tests, calibrations, and/or measurements included in this
document are traceable to Australian/National Standards.
Tested at Trilab Brisbane Laboratory
ACCURATE QUALITY RESULTS FOR TOMORROW'S ENGINEERING

Brisbane346A Bilsen Road, GeebungQLD 4034 Ph: +61 7 3265 5656
Perth2 Kimmer Place, Queens Park WA 6107 Ph: +61 8 9258 8323Soil Rock Calibration
col 1960
Client Report No.
Workorder NoAddress Test Date
Report Date
Project
Client IDDescription Sample Type
Notes/Remarks: Remoulded at 92% of MDD.Note: Area correction based on square sample equation.
Graph not to scale Sample/s supplied by the client Page 1 of 4 REP07301
Laboratory No. 9926 The results of calibrations and tests performed apply only to the specific instrument or sample at the time of test unless otherwise clearly stated.
DIRECT SHEAR TEST REPORTTest Method: AS 1289.6.2.2 / KH2 based on K.H. Head Vol. 2
Not SuppliedDepth (m)
Xstract Mining Consultants Pty Ltd
Level 6 545 Queen Street Brisbane QLD 4000
Lithium Tailings Dry Stack - Batch 3
18020626- DS
Lithium Tailings Dry Stack
Single individual soil specimen - Remoulded.
SILT - pale grey/brown
Reference should be made to Trilab's “Standard Terms and Conditions of Business” for further details.Trilab Pty Ltd ABN 25 065 630 506
2/03/2018
6/03/2018
0003883
Authorised Signatory
C. Channon
250 kPa
0
50
100
150
200
250
0 2 4 6 8 10 12
Sh
ear
Str
ess
(kP
a)
Relative Displacement (mm)
Shear Stress/Displacement Plot
250 kPa
-0.14
-0.12
-0.1
-0.08
-0.06
-0.04
-0.02
0
0.02
0 1 2 3 4 5 6 7 8 9 10Ver
tica
l Dis
pla
cem
ent
(mm
)
Relative Displacement (mm)
Vertical Displacement/Relative Displacement Plot
Accredited for compliance with ISO/IEC 17025 - Testing. The results of the tests, calibrations, and/or measurements included in this
document are traceable to Australian/National Standards.
Tested at Trilab Brisbane Laboratory
ACCURATE QUALITY RESULTS FOR TOMORROW'S ENGINEERING

Brisbane346A Bilsen Road, GeebungQLD 4034 Ph: +61 7 3265 5656
Perth2 Kimmer Place, Queens Park WA 6107 Ph: +61 8 9258 8323Soil Rock Calibration
Client Report No.
Failure Criteria
- - R2
Specimen Condition Corrected Shear Stress (kPa)Specimen Dimensions (mm)
Rate of Strain (mm/min)Initial Moisture Content (%)Initial Wet Density(t/m3)
Notes/Remarks: Remoulded at 92% of MDD.Note: Area correction based on square sample equation.
Graph not to scale Sample/s supplied by the client Page 2 of 4 REP07301
Laboratory No. 9926
-
24.2
100*100
The results of calibrations and tests performed apply only to the specific instrument or sample at the time of test unless otherwise clearly stated. Reference should be made to Trilab's “Standard Terms and Conditions of Business” for further details.
Trilab Pty Ltd ABN 25 065 630 506
250.0
Shear Angle (o)
183.1Normal Stress (kPa)
Cohesion (kPa)
Stage 1
1.71
0.008
Inundated
18020626- DS
DIRECT SHEAR TEST REPORT
Residual @ 9 , , , mm Displacement
Test Method: AS 1289.6.2.2 / KH2 based on K.H. Head Vol. 2
Xstract Mining Consultants Pty Ltd
Authorised Signatory
C. Channon
0
50
100
150
200
250
300
0 50 100 150 200 250 300
Sh
ear
Str
ess
(kP
a)
Normal Stress (kPa)
Residual - Normal Stress vs Shear Stress
Accredited for compliance with ISO/IEC 17025 - Testing. The results of the tests, calibrations, and/or measurements included in this
document are traceable to Australian/National Standards.
Tested at Trilab Brisbane Laboratory
ACCURATE QUALITY RESULTS FOR TOMORROW'S ENGINEERING

Brisbane346A Bilsen Road, GeebungQLD 4034 Ph: +61 7 3265 5656
Perth2 Kimmer Place, Queens Park WA 6107 Ph: +61 8 9258 8323Soil Rock Calibration
Client Report No.
Failure Criteria
- - R2
Specimen ConditionSpecimen Dimensions (mm)
Rate of Strain (mm/min)Initial Moisture Content (%)Initial Wet Density(t/m3)
Notes/Remarks: Remoulded at 92% of MDD.Note: Area correction based on square sample equation.
Graph not to scale Sample/s supplied by the client Page 3 of 4 REP07301
Laboratory No. 9926
Stage 1
Cohesion (kPa)
0.00824.2
The results of calibrations and tests performed apply only to the specific instrument or sample at the time of test unless otherwise clearly stated.
Peak
Test Method: AS 1289.6.2.2 / KH2 based on K.H. Head Vol. 2
Xstract Mining Consultants Pty Ltd
Shear Angle (o)
100*100
1.71
190.6250.0Inundated Normal Stress (kPa) Corrected Shear Stress (kPa)
-
Reference should be made to Trilab's “Standard Terms and Conditions of Business” for further details.Trilab Pty Ltd ABN 25 065 630 506
18020626- DS
DIRECT SHEAR TEST REPORT
Authorised Signatory
C. Channon
0
50
100
150
200
250
300
0 50 100 150 200 250 300
Sh
ear
Str
ess
(kP
a)
Normal Stress (kPa)
Peak - Normal Stress vs Shear Stress
Accredited for compliance with ISO/IEC 17025 - Testing. The results of the tests, calibrations, and/or measurements included in this
document are traceable to Australian/National Standards.
Tested at Trilab Brisbane Laboratory
ACCURATE QUALITY RESULTS FOR TOMORROW'S ENGINEERING

Brisbane346A Bilsen Road, GeebungQLD 4034 Ph: +61 7 3265 5656
Perth2 Kimmer Place, Queens Park WA 6107 Ph: +61 8 9258 8323Soil Rock Calibration
Client Report No.
Notes/Remarks:
Photo not to scale Sample/s supplied by the client Page 4 of 4 REP07301
Laboratory No. 9926 The results of calibrations and tests performed apply only to the specific instrument or sample at the time of test unless otherwise clearly stated.
Reference should be made to Trilab's “Standard Terms and Conditions of Business” for further details.Trilab Pty Ltd ABN 25 065 630 506
Xstract Mining Consultants Pty Ltd
DIRECT SHEAR TEST REPORTTest Method: AS 1289.6.2.2 / KH2 based on K.H. Head Vol. 2
18020626- DS
Authorised Signatory
C. Channon
Accredited for compliance with ISO/IEC 17025 - Testing. The results of the tests, calibrations, and/or measurements included in this
document are traceable to Australian/National Standards.
Tested at Trilab Brisbane Laboratory
ACCURATE QUALITY RESULTS FOR TOMORROW'S ENGINEERING

Xstract – Excellence from the outset
XstractGroup.com
Level 2, 50 St Georges Terrace, PERTH WA 6000 | PO Box Z5426, PERTH WA 6831
T +61 8 9327 9500 | F +61 8 9481 8700 | Xstract Mining Consultants Pty Ltd | ABN 62 129 791 279
Hydraulic Conductivity - Falling Head
AS 1289.6.7.2 (R2013)

Brisbane346A Bilsen Road, GeebungQLD 4034 Ph: +61 7 3265 5656
Perth2 Kimmer Place, Queens Park WA 6107 Ph: +61 8 9258 8323Soil Rock Calibration
chrisc 1919
Client Report No.
Workorder No.Address Test Date
Report Date
Project
Client IDDescription Sample Type
Compaction Method AS1289.5.1.1 - Standard Compaction
Maximum Dry Density (t/m3) Hydraulic Gradient
Optimum Moisture Content (%) Surcharge (kPa)
Placement Moisture Content (%) Head Pressure Applied (kPa)
Moisture Ratio (%) Water Type
Placement Wet Density (t/m3) Percentage Material Retained/Sieve Size (mm)
Density Ratio (%)
Remarks: The above specimen was remoulded to a target of 92% of Modified Maximum Dry Density and at Optimum Moisture Content.
Sample/s supplied by client REP06301
18020002-FHPT
14/02/2018
Not SuppliedLithium Tailings Dry Stack Depth (m)
0003771
SILT - grey
99.3
PERMEABILITY BY FALLING HEAD TEST REPORTTest Method AS 1289 6.7.2, 5.1.1 , KH2 (Based on K H Head (1988) Manual of Laboratory Testing,10.7)
9.4
3.0
10.79
RESULTS OF TESTING
1.51
23.2
23.0
Xstract Mining Consultants Pty Ltd
Level 6 545 Queen Street Brisbane QLD 4000
Remoulded Soil Specimen
Lithium Tailings Dry Stack
23/02/2018
0 % /9.5 mm
De-Ionized
1.71
Reference should be made to Trilab's “Standard Terms and Conditions of Business” for further details.Trilab Pty Ltd ABN 25 065 630 506
Laboratory No. 9926
PERMEABILITY k(20) =
Page: 1 of 1
1.1 x 10
92.1
The results of calibrations and tests performed apply only to the specific instrument or sample at the time of test unless otherwise clearly stated.
(m/sec)-07
Authorised Signatory
T. Lockhart
5.000E-08
1.000E-07
1.500E-07
2.000E-07
2.500E-07
3.000E-07
3.500E-07
4.000E-07
4.500E-07
5.000E-07
0 1000 2000 3000 4000 5000 6000 7000 8000 9000 10000
k20
(m
/sec
)
Elapsed Time of Test (mins)
Permeability
Accredited for compliance with ISO/IEC 17025 - Testing. The results of the tests, calibrations, and/or measurements included in this
document are traceable to Australian/National Standards.
Tested at Trilab Brisbane Laboratory.
Authorised Signatory
C. Channon
ACCURATE QUALITY RESULTS FOR TOMORROW'S ENGINEERING

Brisbane346A Bilsen Road, GeebungQLD 4034 Ph: +61 7 3265 5656
Perth2 Kimmer Place, Queens Park WA 6107 Ph: +61 8 9258 8323Soil Rock Calibration
chrisc 1919
Client Report No.
Workorder No.Address Test Date
Report Date
Project
Client IDDescription Sample Type
Compaction Method AS1289.5.2.1 - Modified Compaction
Maximum Dry Density (t/m3) Hydraulic Gradient
Optimum Moisture Content (%) Surcharge (kPa)
Placement Moisture Content (%) Head Pressure Applied (kPa)
Moisture Ratio (%) Water Type
Placement Wet Density (t/m3) Percentage Material Retained/Sieve Size (mm)
Density Ratio (%)
Remarks: The above specimen was remoulded to a target of 92% of Modified Maximum Dry Density and at Optimum Moisture Content.
Sample/s supplied by client REP06301
0 % /9.5 mm
De-Ionized
1.71
Reference should be made to Trilab's “Standard Terms and Conditions of Business” for further details.Trilab Pty Ltd ABN 25 065 630 506
Laboratory No. 9926
PERMEABILITY k(20) =
Page: 1 of 1
8.2 x 10
91.7
The results of calibrations and tests performed apply only to the specific instrument or sample at the time of test unless otherwise clearly stated.
(m/sec)-08
SILT - pale grey
101.8
PERMEABILITY BY FALLING HEAD TEST REPORTTest Method AS 1289 6.7.2, 5.2.1 , KH2 (Based on K H Head (1988) Manual of Laboratory Testing,10.7)
9.5
2.9
10.79
RESULTS OF TESTING
1.50
23.6
24.0
Xstract Mining Consultants Pty Ltd
Level 6 545 Queen Street Brisbane QLD 4000
Remoulded Soil Specimen
Lithium Tailings Dry Stack
19/03/2018
18020625-FHPT
5/03/2018
Not SuppliedLithium Tailings Dry Stack - Batch 2 Depth (m)
0003883
Authorised Signatory
T. Lockhart
2.000E-08
7.000E-08
1.200E-07
1.700E-07
2.200E-07
2.700E-07
3.200E-07
3.700E-07
4.200E-07
4.700E-07
0 500 1000 1500 2000 2500 3000 3500 4000 4500 5000
k20
(m
/sec
)
Elapsed Time of Test (mins)
Permeability
Accredited for compliance with ISO/IEC 17025 - Testing. The results of the tests, calibrations, and/or measurements included in this
document are traceable to Australian/National Standards.
Tested at Trilab Brisbane Laboratory.
Authorised Signatory
C. Channon
ACCURATE QUALITY RESULTS FOR TOMORROW'S ENGINEERING

Brisbane346A Bilsen Road, GeebungQLD 4034 Ph: +61 7 3265 5656
Perth2 Kimmer Place, Queens Park WA 6107 Ph: +61 8 9258 8323Soil Rock Calibration
chrisc 1919
Client Report No.
Workorder No.Address Test Date
Report Date
Project
Client IDDescription Sample Type
Compaction Method AS1289.5.2.1 - Modified Compaction
Maximum Dry Density (t/m3) Hydraulic Gradient
Optimum Moisture Content (%) Surcharge (kPa)
Placement Moisture Content (%) Head Pressure Applied (kPa)
Moisture Ratio (%) Water Type
Placement Wet Density (t/m3) Percentage Material Retained/Sieve Size (mm)
Density Ratio (%)
Remarks: The above specimen was remoulded to a target of 92% of Modified Maximum Dry Density and at Optimum Moisture Content.
Sample/s supplied by client REP06301
0 % /9.5 mm
De-Ionized
1.71
Reference should be made to Trilab's “Standard Terms and Conditions of Business” for further details.Trilab Pty Ltd ABN 25 065 630 506
Laboratory No. 9926
PERMEABILITY k(20) =
Page: 1 of 1
1.7 x 10
91.6
The results of calibrations and tests performed apply only to the specific instrument or sample at the time of test unless otherwise clearly stated.
(m/sec)-07
SILT - pale grey
102.2
PERMEABILITY BY FALLING HEAD TEST REPORTTest Method AS 1289 6.7.2, 5.2.1 , KH2 (Based on K H Head (1988) Manual of Laboratory Testing,10.7)
9.4
3.0
10.79
RESULTS OF TESTING
1.50
24.1
24.6
Xstract Mining Consultants Pty Ltd
Level 6 545 Queen Street Brisbane QLD 4000
Remoulded Soil Specimen
Lithium Tailings Dry Stack
16/03/2018
18020626-FHPT
5/03/2018
Not SuppliedLithium Tailings Dry Stack - Batch 3 Depth (m)
0003883
Authorised Signatory
T. Lockhart
5.000E-08
1.000E-07
1.500E-07
2.000E-07
2.500E-07
3.000E-07
3.500E-07
4.000E-07
0 500 1000 1500 2000 2500 3000 3500 4000 4500 5000
k20
(m
/sec
)
Elapsed Time of Test (mins)
Permeability
Accredited for compliance with ISO/IEC 17025 - Testing. The results of the tests, calibrations, and/or measurements included in this
document are traceable to Australian/National Standards.
Tested at Trilab Brisbane Laboratory.
Authorised Signatory
C. Channon
ACCURATE QUALITY RESULTS FOR TOMORROW'S ENGINEERING

Xstract – Excellence from the outset
XstractGroup.com
Level 2, 50 St Georges Terrace, PERTH WA 6000 | PO Box Z5426, PERTH WA 6831
T +61 8 9327 9500 | F +61 8 9481 8700 | Xstract Mining Consultants Pty Ltd | ABN 62 129 791 279
Hydraulic Conductivity - Constant Head
AS 1289.6.7.3:2016

Brisbane346A Bilsen Road, GeebungQLD 4034 Ph: +61 7 3265 5656
Perth2 Kimmer Place, Queens Park WA 6107 Ph: +61 8 9258 8323Soil Rock Calibration
chrisc 1919
Client Report No.
Workorder No.Address Test Date
Report Date
Project
Client IDDescription Sample Type
Compaction Method AS1289.5.1.1 - Standard Compaction
Maximum Dry Density (t/m3) Confining Pressure
Optimum Moisture Content (%) Back Pressure
Placement Moisture Content (%) Effective Stress Applied (kPa)
Moisture Ratio (%) Water Type
Placement Wet Density (t/m3) Percentage Material Retained/Sieve Size (mm)
Density Ratio (%) Sample Height and Diameter (mm)
Remarks: The above specimen was remoulded to a target of 92% of Modified Maximum Dry Density and at Optimum Moisture Content.
Sample/s supplied by client REP06501
0 % / 4.75 mm
91.8
The results of calibrations and tests performed apply only to the specific instrument or sample at the time of test unless otherwise clearly stated. Reference should be made to Trilab's “Standard Terms and Conditions of Business” for further details.
Trilab Pty Ltd ABN 25 065 630 506
Laboratory No. 9926
59.3 / 47.5 mm
PERMEABILITY k(20) =
Page: 1 of 1
3.6 x 10 (m/sec)-09
1.71
PERMEABILITY BY CONSTANT HEAD TEST REPORTTest Method AS 1289 6.7.3, 5.1.1 , KH2 (Based on K H Head (1988) Manual of Laboratory Testing,10.7)
150
50
100
RESULTS OF TESTING
1.51
23.2
23.0
Xstract Mining Consultants Pty Ltd
Level 6 545 Queen Street Brisbane QLD 4000
Remoulded Soil Specimen
Lithium Tailings Dry Stack
18/02/2018
0003771
27/02/2018
18020002-CHP
Lithium Tailings Dry Stack
De-Ionized
Depth (m) Not SuppliedSILT - grey
99.3
1.000E-09
2.000E-09
3.000E-09
4.000E-09
5.000E-09
6.000E-09
7.000E-09
8.000E-09
9.000E-09
0 500 1000 1500 2000 2500 3000 3500 4000 4500 5000
k20
(m
/sec
)
Elapsed Time of Test (mins)
Permeability
Accredited for compliance with ISO/IEC 17025 - Testing. The results of the tests, calibrations, and/or measurements included in this
document are traceable to Australian/National Standards.
Tested at Trilab Brisbane Laboratory.
Authorised Signatory
C. Channon
ACCURATE QUALITY RESULTS FOR TOMORROW'S ENGINEERING

Brisbane346A Bilsen Road, GeebungQLD 4034 Ph: +61 7 3265 5656
Perth2 Kimmer Place, Queens Park WA 6107 Ph: +61 8 9258 8323Soil Rock Calibration
chrisc 1919
Client Report No.
Workorder No.Address Test Date
Report Date
Project
Client IDDescription Sample Type
Compaction Method AS1289.5.2.1 - Modified Compaction
Maximum Dry Density (t/m3) Confining Pressure
Optimum Moisture Content (%) Back Pressure
Placement Moisture Content (%) Effective Stress Applied (kPa)
Moisture Ratio (%) Water Type
Placement Wet Density (t/m3) Percentage Material Retained/Sieve Size (mm)
Density Ratio (%) Sample Height and Diameter (mm)
Remarks: The above specimen was remoulded to a target of 92% of Modified Maximum Dry Density and at Optimum Moisture Content.
Sample/s supplied by client REP06501
18020625-CHP
Lithium Tailings Dry Stack - Batch 2
De-Ionized
Depth (m) Not SuppliedSILT - grey
102.1
PERMEABILITY BY CONSTANT HEAD TEST REPORTTest Method AS 1289 6.7.3, 5.2.1 , KH2 (Based on K H Head (1988) Manual of Laboratory Testing,10.7)
150
50
100
RESULTS OF TESTING
1.50
23.6
24.1
Xstract Mining Consultants Pty Ltd
Level 6 545 Queen Street Brisbane QLD 4000
Remoulded Soil Specimen
Lithium Tailings Dry Stack
2/03/2018
0003883
16/03/2018
0 % / 4.75 mm
91.6
The results of calibrations and tests performed apply only to the specific instrument or sample at the time of test unless otherwise clearly stated. Reference should be made to Trilab's “Standard Terms and Conditions of Business” for further details.
Trilab Pty Ltd ABN 25 065 630 506
Laboratory No. 9926
59.6 / 48 mm
PERMEABILITY k(20) =
Page: 1 of 1
1.4 x 10 (m/sec)-07
1.71
Authorised Signatory
T. Lockhart
Authorised Signatory
T. Lockhart
5.000E-08
1.000E-07
1.500E-07
2.000E-07
2.500E-07
3.000E-07
3.500E-07
4.000E-07
0 2000 4000 6000 8000 10000 12000
k20
(m
/sec
)
Elapsed Time of Test (mins)
Permeability
Accredited for compliance with ISO/IEC 17025 - Testing. The results of the tests, calibrations, and/or measurements included in this
document are traceable to Australian/National Standards.
Tested at Trilab Brisbane Laboratory.
Authorised Signatory
C. Channon
ACCURATE QUALITY RESULTS FOR TOMORROW'S ENGINEERING

Brisbane346A Bilsen Road, GeebungQLD 4034 Ph: +61 7 3265 5656
Perth2 Kimmer Place, Queens Park WA 6107 Ph: +61 8 9258 8323Soil Rock Calibration
chrisc 1919
Client Report No.
Workorder No.Address Test Date
Report Date
Project
Client IDDescription Sample Type
Compaction Method AS1289.5.2.1 - Modified Compaction
Maximum Dry Density (t/m3) Confining Pressure
Optimum Moisture Content (%) Back Pressure
Placement Moisture Content (%) Effective Stress Applied (kPa)
Moisture Ratio (%) Water Type
Placement Wet Density (t/m3) Percentage Material Retained/Sieve Size (mm)
Density Ratio (%) Sample Height and Diameter (mm)
Remarks: The above specimen was remoulded to a target of 92% of Modified Maximum Dry Density and at Optimum Moisture Content.
Sample/s supplied by client REP06501
0 % / 4.75 mm
91.5
The results of calibrations and tests performed apply only to the specific instrument or sample at the time of test unless otherwise clearly stated. Reference should be made to Trilab's “Standard Terms and Conditions of Business” for further details.
Trilab Pty Ltd ABN 25 065 630 506
Laboratory No. 9926
59.6 / 48.1 mm
PERMEABILITY k(20) =
Page: 1 of 1
1.0 x 10 (m/sec)-07
1.71
PERMEABILITY BY CONSTANT HEAD TEST REPORTTest Method AS 1289 6.7.3, 5.2.1 , KH2 (Based on K H Head (1988) Manual of Laboratory Testing,10.7)
150
50
100
RESULTS OF TESTING
1.50
24.1
24.2
Xstract Mining Consultants Pty Ltd
Level 6 545 Queen Street Brisbane QLD 4000
Remoulded Soil Specimen
Lithium Tailings Dry Stack
6/03/2018
0003883
19/03/2018
18020626-CHP
Lithium Tailings Dry Stack - Batch 3
De-Ionized
Depth (m) Not SuppliedSILT- grey
100.4
Authorised Signatory
T. Lockhart
Authorised Signatory
T. Lockhart
5.000E-08
1.000E-07
1.500E-07
2.000E-07
2.500E-07
3.000E-07
0 500 1000 1500 2000 2500 3000 3500 4000 4500 5000
k20
(m
/sec
)
Elapsed Time of Test (mins)
Permeability
Accredited for compliance with ISO/IEC 17025 - Testing. The results of the tests, calibrations, and/or measurements included in this
document are traceable to Australian/National Standards.
Tested at Trilab Brisbane Laboratory.
Authorised Signatory
C. Channon
ACCURATE QUALITY RESULTS FOR TOMORROW'S ENGINEERING

Xstract – Excellence from the outset
XstractGroup.com
Level 2, 50 St Georges Terrace, PERTH WA 6000 | PO Box Z5426, PERTH WA 6831
T +61 8 9327 9500 | F +61 8 9481 8700 | Xstract Mining Consultants Pty Ltd | ABN 62 129 791 279
Specific Conductance – electrical
AS 1289.4.4.1

Client: Source:
Project: Report No:
Job No: Lab No:
Test Procedure: AS1289 4.2.1
AS1289 4.3.1
AS 1289 4.4.1
AS 1012.20
RMS T123 pH value of a soil (electrometric method)
RMS T185 Resistivity of sands and granular road construction materials
RMS T200 Chloride content of roadbase
RMS T1010 Quantitative determination of chlorides in soil
RMS T1011 Quantitative determination of sulphates in soil
BS1377(1990 pt.3) Water soluble sulphate content
APHA 4500 H+B pH
APHA 4500 SO4 2-B Sulphate
APHA 4500 CI-B Chloride
APHA 2510 & 2520-B Electrical Conductivity
TAI B117 Sulphides Present (This service Not Covered by NATA Accreditation)
Sampling:
Authorised Signatory:
NATA Accredited Laboratory Number: 14874
Trilab Pty Ltd 18020002/ Lithium Tailings Dry Stack Batch 1
SOIL CHEMICAL PROPERTIES REPORT
Preparation:
Silty CLAY346A Bilsen Road, Geebung Qls 4034Address:
B46913-SCP
B46913
UnknownDate Sampled:
B18189
Soil Chemical Tests - Determination of a sulfate content of a natural soil and the sulfate content of the groundwater - Normal Method
Sampled by Client
Material Assessment
Sample Description:
3 Watt DriveBathurst NSW 2795
Sulphur Peroxide (%) -
-
Chloride ion content (ppm)
Brad Morris
pH -
Sulphate content (%)
-
(Resisitivity) Density ratio (RD) 90
Macquarie Geotechnical
Soil Chemical Tests - Determination of the pH value of a soil - Electrometric method
Soil Chemical Tests - Determination of the electrical resistivity of a soil - Method for sands and granular material
Sulphate content (ppm)
Prepared in accordance with the test method
-
Sulphides Present -
Chloride and sulphate
Date:
13/04/2018
(Resisitivity) Density index (ID) -
Chloride ion content (%) -
Electrical Conductivity (uS/cm) -
Mean Resistivity Ω.m 18
The results of the tests, calibrations and/or measurements included in this document are traceable to Australian/national standards. Accredited for compliance with ISO/IEC 17025. This document shall not be reproduced, except in full.
Report Form:SCP Issue 2 - Revision G - Issue Date 01/08/17 Page1of1

Client: Source:
Project: Report No:
Job No: Lab No:
Test Procedure: AS1289 4.2.1
AS1289 4.3.1
AS 1289 4.4.1
AS 1012.20
RMS T123 pH value of a soil (electrometric method)
RMS T185 Resistivity of sands and granular road construction materials
RMS T200 Chloride content of roadbase
RMS T1010 Quantitative determination of chlorides in soil
RMS T1011 Quantitative determination of sulphates in soil
BS1377(1990 pt.3) Water soluble sulphate content
APHA 4500 H+B pH
APHA 4500 SO4 2-B Sulphate
APHA 4500 CI-B Chloride
APHA 2510 & 2520-B Electrical Conductivity
TAI B117 Sulphides Present (This service Not Covered by NATA Accreditation)
Sampling:
Authorised Signatory:
NATA Accredited Laboratory Number: 14874
Trilab Pty Ltd 18020625 / Lithium Tailings Dry Stack Batch 2
SOIL CHEMICAL PROPERTIES REPORT
Preparation:
Silty CLAY346A Bilsen Road, Geebung Qls 4034Address:
B46914-SCP
B46914
UnknownDate Sampled:
B18189
Soil Chemical Tests - Determination of a sulfate content of a natural soil and the sulfate content of the groundwater - Normal Method
Sampled by Client
Material Assessment
Sample Description:
3 Watt DriveBathurst NSW 2795
Sulphur Peroxide (%) -
-
Chloride ion content (ppm)
Brad Morris
pH -
Sulphate content (%)
-
(Resisitivity) Density ratio (RD) 90
Macquarie Geotechnical
Soil Chemical Tests - Determination of the pH value of a soil - Electrometric method
Soil Chemical Tests - Determination of the electrical resistivity of a soil - Method for sands and granular material
Sulphate content (ppm)
Prepared in accordance with the test method
-
Sulphides Present -
Chloride and sulphate
Date:
13/04/2018
(Resisitivity) Density index (ID) -
Chloride ion content (%) -
Electrical Conductivity (uS/cm) -
Mean Resistivity Ω.m 16
The results of the tests, calibrations and/or measurements included in this document are traceable to Australian/national standards. Accredited for compliance with ISO/IEC 17025. This document shall not be reproduced, except in full.
Report Form:SCP Issue 2 - Revision G - Issue Date 01/08/17 Page1of1

Client: Source:
Project: Report No:
Job No: Lab No:
Test Procedure: AS1289 4.2.1
AS1289 4.3.1
AS 1289 4.4.1
AS 1012.20
RMS T123 pH value of a soil (electrometric method)
RMS T185 Resistivity of sands and granular road construction materials
RMS T200 Chloride content of roadbase
RMS T1010 Quantitative determination of chlorides in soil
RMS T1011 Quantitative determination of sulphates in soil
BS1377(1990 pt.3) Water soluble sulphate content
APHA 4500 H+B pH
APHA 4500 SO4 2-B Sulphate
APHA 4500 CI-B Chloride
APHA 2510 & 2520-B Electrical Conductivity
TAI B117 Sulphides Present (This service Not Covered by NATA Accreditation)
Sampling:
Authorised Signatory:
NATA Accredited Laboratory Number: 14874
Trilab Pty Ltd 18020626 / Lithium Tailings Dry Stack Batch 3
SOIL CHEMICAL PROPERTIES REPORT
Preparation:
Silty CLAY346A Bilsen Road, Geebung Qls 4034Address:
B46915-SCP
B46915
UnknownDate Sampled:
B18189
Soil Chemical Tests - Determination of a sulfate content of a natural soil and the sulfate content of the groundwater - Normal Method
Sampled by Client
Material Assessment
Sample Description:
3 Watt DriveBathurst NSW 2795
Sulphur Peroxide (%) -
-
Chloride ion content (ppm)
Brad Morris
pH -
Sulphate content (%)
-
(Resisitivity) Density ratio (RD) 90
Macquarie Geotechnical
Soil Chemical Tests - Determination of the pH value of a soil - Electrometric method
Soil Chemical Tests - Determination of the electrical resistivity of a soil - Method for sands and granular material
Sulphate content (ppm)
Prepared in accordance with the test method
-
Sulphides Present -
Chloride and sulphate
Date:
13/04/2018
(Resisitivity) Density index (ID) -
Chloride ion content (%) -
Electrical Conductivity (uS/cm) -
Mean Resistivity Ω.m 16
The results of the tests, calibrations and/or measurements included in this document are traceable to Australian/national standards. Accredited for compliance with ISO/IEC 17025. This document shall not be reproduced, except in full.
Report Form:SCP Issue 2 - Revision G - Issue Date 01/08/17 Page1of1

Xstract – Excellence from the outset
XstractGroup.com
Level 2, 50 St Georges Terrace, PERTH WA 6000 | PO Box Z5426, PERTH WA 6831
T +61 8 9327 9500 | F +61 8 9481 8700 | Xstract Mining Consultants Pty Ltd | ABN 62 129 791 279
Natural pH
AS 1289 3.8.1, 4.3.1

Brisbane346A Bilsen Road, GeebungQLD 4034 Ph: +61 7 3265 5656
Perth2 Kimmer Place, Queens Park WA 6107 Ph: +61 8 9258 8323Soil Rock Calibration
chrisc 1919
James
Client Report No.
Workorder No.Address Test Date
Report Date
Project
Sample No. 18020002
Client IDLithium
Tailings Dry Stack
- - - - - -
Depth (m) Not Supplied - - - - - -
Description SILT- grey - - - - - -
Emerson Class Number
- - - - - - -
pH 7.7 - - - - - -
Conductivity (mS/cm) *
- - - - - - -
Salinity (ppK) * - - - - - - -
Sample No.
Client ID - - - - - - -
Depth (m) - - - - - - -
Description - - - - - - -
Emerson Class Number
- - - - - -
pH - - - - - -
Conductivity (mS/cm) *
- - - - - -
Salinity (ppK) * - - - - - -
NOTES/REMARKS:
Sample/s supplied by the client Tested with Distilled water at 21.5°C At 5:1 Water/Soil Ratio REP00502
Laboratory No. 9926
EMERSON CLASS NUMBER AND pH TEST REPORTTest Method: AS 1289 3.8.1, 4.3.1
Xstract Mining Consultants Pty Ltd
Level 6 545 Queen Street Brisbane QLD 4000
18020002-EMPH
15/02/2018
14/02/2018
0003771
Lithium Tailings Dry Stack
Trilab Pty Ltd ABN 25 065 630 506 Reference should be made to Trilab's “Standard Terms and Conditions of Business” for further details.
The results of calibrations and tests performed apply only to the specific instrument or sample at the time of test unless otherwise clearly stated.
Page 1 of 1
Authorised Signatory
T. Lockhart
Accredited for compliance with ISO/IEC 17025 - Testing. The results of the tests, calibrations, and/or measurements included in
this document are traceable to Australian/National Standards.
Tested at Trilab Brisbane Laboratory.
Authorised Signatory
C. Channon
ACCURATE QUALITY RESULTS FOR TOMORROW'S ENGINEERING

Brisbane346A Bilsen Road, GeebungQLD 4034 Ph: +61 7 3265 5656
Perth2 Kimmer Place, Queens Park WA 6107 Ph: +61 8 9258 8323Soil Rock Calibration
chrisc 1919
James
Client Report No.
Workorder No.Address Test Date
Report Date
Project
Sample No. 18020625 18020626
Client ID
Lithium Tailings Dry
Stack - Batch 2
Lithium Tailings Dry
Stack - Batch 3
- - - - -
Depth (m) Not Supplied Not Supplied - - - - -
Description -- -- - - - - -
Emerson Class Number
- - - - - - -
pH 7.8 7.7 - - - - -
Conductivity (mS/cm) *
- - - - - - -
Salinity (ppK) * - - - - - - -
Sample No.
Client ID - - - - - - -
Depth (m) - - - - - - -
Description - - - - - - -
Emerson Class Number
- - - - - -
pH - - - - - -
Conductivity (mS/cm) *
- - - - - -
Salinity (ppK) * - - - - - -
NOTES/REMARKS:
Sample/s supplied by the client Tested with Distilled water at 22.5°C At 5:1 Water/Soil Ratio Page 1 of 1 REP00502
Laboratory No. 9926
EMERSON CLASS NUMBER AND pH TEST REPORTTest Method: AS 1289 3.8.1, 4.3.1
Xstract Mining Consultants Pty Ltd
Level 6 545 Queen Street Brisbane QLD 4000
18020625-EMPH
15/03/2018
13/03/2018
0003883
Lithium Tailings Dry Stack
Trilab Pty Ltd ABN 25 065 630 506 Reference should be made to Trilab's “Standard Terms and Conditions of Business” for further details.
The results of calibrations and tests performed apply only to the specific instrument or sample at the time of test unless otherwise clearly stated.
Authorised Signatory
T. Lockhart
Accredited for compliance with ISO/IEC 17025 - Testing. The results of the tests, calibrations, and/or measurements included in
this document are traceable to Australian/National Standards.
Tested at Trilab Brisbane Laboratory.
Authorised Signatory
C. Channon
ACCURATE QUALITY RESULTS FOR TOMORROW'S ENGINEERING

Xstract – Excellence from the outset
XstractGroup.com
Level 2, 50 St Georges Terrace, PERTH WA 6000 | PO Box Z5426, PERTH WA 6831
T +61 8 9327 9500 | F +61 8 9481 8700 | Xstract Mining Consultants Pty Ltd | ABN 62 129 791 279
Specific Gravity (Sg)
AS1289 3.5.1

Brisbane346A Bilsen Road, GeebungQLD 4034 Ph: +61 7 3265 5656
Perth2 Kimmer Place, Queens Park WA 6107 Ph: +61 8 9258 8323Soil Rock Calibration
chrisc 1919
James
Client Report No.
Workorder No.Address Report Date
Project
Sample No. 18020002
Test Date 5/02/2018
Client IDLithium
Tailings Dry Stack
- - - - - -
Depth (m) Not Supplied - - - - - -
Soil Particle Density (t/m³) (-2.36mm)
2.56
Soil Particle Density (t/m³) (+2.36mm)
-
Total Soil Particle Density (t/m³)
-
Sample No.
Test Date
Client ID - - - - - - -
Depth (m) - - - - - - -
Soil Particle Density (t/m³) (-2.36mm)
Soil Particle Density (t/m³) (+2.36mm)
Total Soil Particle Density (t/m³)
NOTES/REMARKS:
Sample/s supplied by the client Page 1 of 1 REP04603
Laboratory No. 9926
Lithium Tailings Dry Stack
SOIL PARTICLE DENSITY TEST REPORTTest Method: AS 1289 3.5.1
Xstract Mining Consultants Pty Ltd
Level 6 545 Queen Street Brisbane QLD 4000
18020002-SG
09/02/2018
0003771
Trilab Pty Ltd ABN 25 065 630 506 Reference should be made to Trilab's “Standard Terms and Conditions of Business” for further details.
The results of calibrations and tests performed apply only to the specific instrument or sample at the time of test unless otherwise clearly stated.
Authorised Signatory
T. Lockhart
Accredited for compliance with ISO/IEC 17025 - Testing. The results of the tests, calibrations, and/or measurements included in this
document are traceable to Australian/National Standards.
Tested at Trilab Brisbane Laboratory.
Authorised Signatory
C. Channon
ACCURATE QUALITY RESULTS FOR TOMORROW'S ENGINEERING

Brisbane346A Bilsen Road, GeebungQLD 4034 Ph: +61 7 3265 5656
Perth2 Kimmer Place, Queens Park WA 6107 Ph: +61 8 9258 8323Soil Rock Calibration
chrisc 1919
James
Client Report No.
Workorder No.Address Report Date
Project
Sample No. 18020625 18020626
Test Date 26/02/2018 26/02/2018
Client ID
Lithium Tailings Dry
Stack - Batch 2
Lithium Tailings Dry
Stack - Batch 3
- - - - -
Depth (m) Not Supplied Not Supplied - - - - -
Soil Particle Density (t/m³) (-2.36mm)
2.55 2.53
Soil Particle Density (t/m³) (+2.36mm)
- -
Total Soil Particle Density (t/m³)
- -
Sample No.
Test Date
Client ID - - - - - - -
Depth (m) - - - - - - -
Soil Particle Density (t/m³) (-2.36mm)
Soil Particle Density (t/m³) (+2.36mm)
Total Soil Particle Density (t/m³)
NOTES/REMARKS: Sample/s supplied by the client Page 1 of 1 REP04603
Laboratory No. 9926
Lithium Tailings Dry Stack
SOIL PARTICLE DENSITY TEST REPORTTest Method: AS 1289 3.5.1
Xstract Mining Consultants Pty Ltd
Level 6 545 Queen Street Brisbane QLD 4000
18020625-SG
08/03/2018
0003883
Trilab Pty Ltd ABN 25 065 630 506 Reference should be made to Trilab's “Standard Terms and Conditions of Business” for further details.
The results of calibrations and tests performed apply only to the specific instrument or sample at the time of test unless otherwise clearly stated.
Authorised Signatory
T. Lockhart
Accredited for compliance with ISO/IEC 17025 - Testing. The results of the tests, calibrations, and/or measurements included in this
document are traceable to Australian/National Standards.
Tested at Trilab Brisbane Laboratory.
Authorised Signatory
C. Channon
ACCURATE QUALITY RESULTS FOR TOMORROW'S ENGINEERING

Xstract – Excellence from the outset
XstractGroup.com
Level 2, 50 St Georges Terrace, PERTH WA 6000 | PO Box Z5426, PERTH WA 6831
T +61 8 9327 9500 | F +61 8 9481 8700 | Xstract Mining Consultants Pty Ltd | ABN 62 129 791 279
Aerated Bulk Density and Packed Bulk Density
AS1141.4 Bulk Density – Uncompacted & Compacted

Brisbane346A Bilsen Road, GeebungQLD 4034 Ph: +61 7 3265 5656
Perth2 Kimmer Place, Queens Park WA 6107 Ph: +61 8 9258 8323Soil Rock Calibration
Client Report No.
WorkOrder No.Address Test Date
Report Date
Project
Client ID
AS 1141.4 Bulk Density of Aggregates Uncompacted Bulk Density t/m3
x Compacted Bulk Density t/m3
x Moisture Condition
x Nominal Size mm
Remarks
Sample/s supplied by client REP07601
3771
Lithium Tailings Dry Stack
Level 6 545 Queen Street Brisbane QLD 4000
AGGREGATE TEST REPORT
Xstract Mining Consultants Pty Ltd
5/02/2018
12/03/2018
18020002-AGG
Lithium Tailings Dry Stack Depth (m) Not Supplied
TEST RESULTS
Laboratory No. 9926
1.09
1.21
0
0.075
The results of calibrations and tests performed apply only to the specific instrument or sample at the time of test unless otherwise clearly stated. Reference should be made to Trilab's “Standard Terms and Conditions of Business” for further details.
Trilab Pty Ltd ABN 25 065 630 506
Page1 of 1
Accredited for compliance with ISO/IEC 17025 - Testing. The results of the tests, calibrations, and/or measurements included in
this document are traceable to Australian/National Standards.
Tested at Trilab Brisbane Laboratory.
Authorised Signatory
C. Channon
ACCURATE QUALITY RESULTS FOR TOMORROW'S ENGINEERING
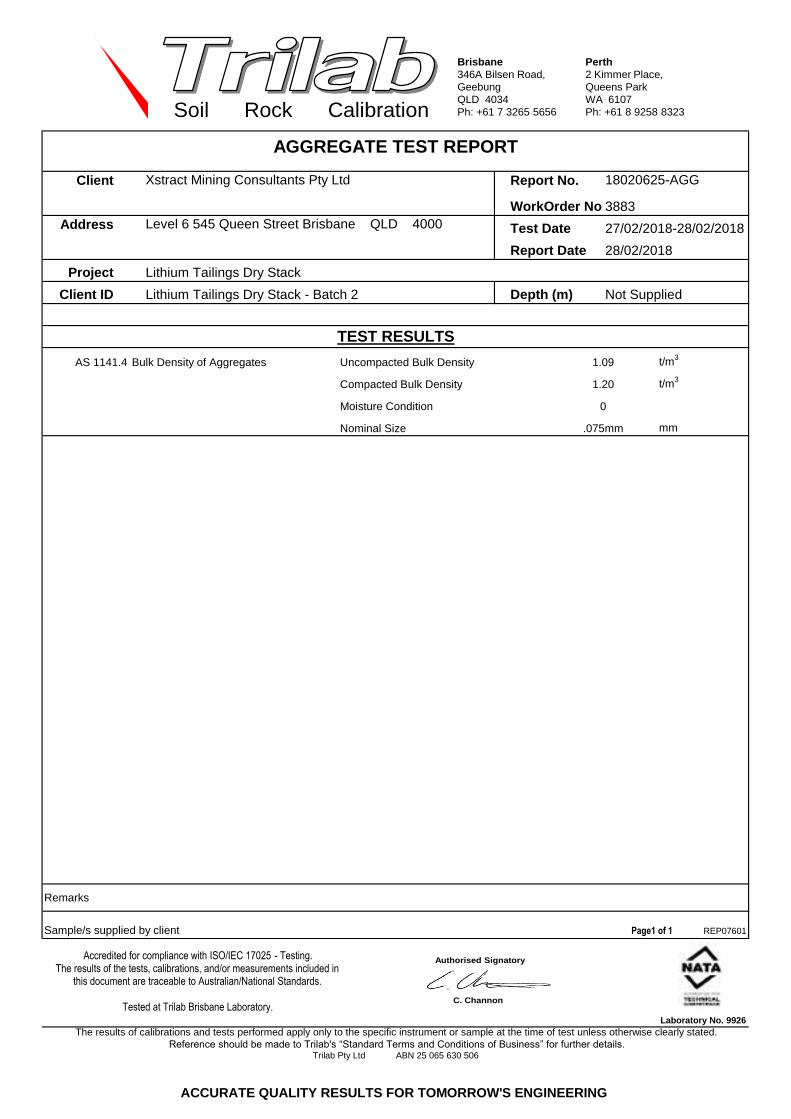
Brisbane346A Bilsen Road, GeebungQLD 4034 Ph: +61 7 3265 5656
Perth2 Kimmer Place, Queens Park WA 6107 Ph: +61 8 9258 8323Soil Rock Calibration
Client Report No.
WorkOrder No.Address Test Date
Report Date
Project
Client ID
AS 1141.4 Bulk Density of Aggregates Uncompacted Bulk Density t/m3
x Compacted Bulk Density t/m3
x Moisture Condition
x Nominal Size mm
Remarks
Sample/s supplied by client REP07601
AGGREGATE TEST REPORT
Xstract Mining Consultants Pty Ltd
28/02/2018
18020625-AGG
Lithium Tailings Dry Stack
Level 6 545 Queen Street Brisbane QLD 40003883
1.09
Trilab Pty Ltd ABN 25 065 630 506
Page1 of 1
Lithium Tailings Dry Stack - Batch 2 Depth (m) Not Supplied
TEST RESULTS
Laboratory No. 9926
1.20
0
.075mm
27/02/2018-28/02/2018
The results of calibrations and tests performed apply only to the specific instrument or sample at the time of test unless otherwise clearly stated. Reference should be made to Trilab's “Standard Terms and Conditions of Business” for further details.
Accredited for compliance with ISO/IEC 17025 - Testing. The results of the tests, calibrations, and/or measurements included in
this document are traceable to Australian/National Standards.
Tested at Trilab Brisbane Laboratory.
Authorised Signatory
C. Channon
ACCURATE QUALITY RESULTS FOR TOMORROW'S ENGINEERING

Brisbane346A Bilsen Road, GeebungQLD 4034 Ph: +61 7 3265 5656
Perth2 Kimmer Place, Queens Park WA 6107 Ph: +61 8 9258 8323Soil Rock Calibration
Client Report No.
WorkOrder No.Address Test Date
Report Date
Project
Client ID
AS 1141.4 Bulk Density of Aggregates Uncompacted Bulk Density t/m3
x Compacted Bulk Density t/m3
x Moisture Condition
x Nominal Size mm
Remarks
Sample/s supplied by client REP07601
AGGREGATE TEST REPORT
Xstract Mining Consultants Pty Ltd
28/02/2018
18020626-AGG
Lithium Tailings Dry Stack
Level 6 545 Queen Street Brisbane QLD 40003883
1.09
Trilab Pty Ltd ABN 25 065 630 506
Page1 of 1
Lithium Tailings Dry Stack - Batch 3 Depth (m) Not Supplied
TEST RESULTS
Laboratory No. 9926
1.20
0
.075mm
27/02/2018-28/02/2018
The results of calibrations and tests performed apply only to the specific instrument or sample at the time of test unless otherwise clearly stated. Reference should be made to Trilab's “Standard Terms and Conditions of Business” for further details.
Accredited for compliance with ISO/IEC 17025 - Testing. The results of the tests, calibrations, and/or measurements included in
this document are traceable to Australian/National Standards.
Tested at Trilab Brisbane Laboratory.
Authorised Signatory
C. Channon
ACCURATE QUALITY RESULTS FOR TOMORROW'S ENGINEERING

Koolyanobbing Range C In-pit TSF Design Report
APPENDIX 4 – EGS Certificate of Analysis

CLIENT DETAILS
Comments
Unit 4/5 Renewable Chase Bibra Lake 6163 Western Australia
Telephone: 61 8 9434 9862 Email: [email protected]
Certificate of Analysis
Date 29 November 2019 EGS Reference EGS/2019/155
Contact Marie Belanger
Client Albemarle Lithium Pty Ltd
Address PO Box 7423 Cloister Square PO Perth WA 6850
Telephone +61 0488 785 067
Email [email protected]
Order Ref.
Samples Li-tailings and process liquor
Date received 28 October 2019
Date reported 29 November 2019
The tailings were dried in a fan oven at 60oC to constant weight. Reported element concentrations are as in the dry tailings. The tailings were not further processed (e.g. homogenization, grinding) but were sampled as 3 discrete aliquots in order to elucidate the inherent variation in composition. The process liquor was received as a partially filled 25L HDPE carboy. It was cloudy in appearance and there was a small amount of fine precipitate on the floor of the carboy. The liquor was filtered through a 0.45m filter membrane prior to analysis. All concentrations were obtained by ICP-OES and ICP-MS using an Agilent® 5110 and an Agilent® 7800 spectrometer, respectively. Calibration was performed using NIST-traceable single element (ICP-OES) and multi-element (ICP-MS) standard solutions (Choice Analytical).
Environmental Geochemistry Services

A company owned by ABN: 14 607 875 776 EIGG International Pty Ltd Page : 2 of 5
Order Ref : MB-1
Client : Albemarle Lithium
Results
Concentration of major and trace elements in tailings. Values in ppm.
Tailings 1 #1 Tailings 1 #2 Tailings 1 #3
Ag - Al * 79,780 85,190 93,142 As 27.3 27.4 27.3 B 9.00 9.10 9.10
Ba - 5.00 5.00 Be - 129 124 Bi - 3.70 3.60 Ca 70,690 74,696 79,825 Cd - 4.00 3.90 Ce - 1.70 1.60 Co - 2.30 2.40 Cr - 20.0 18.8 Cs - 201 196 Cu - 5.80 6.50 Fe 6594 6397 7362 K 3102 3188 3472 La < 0.01 < 0.01 < 0.01 Li 2364 2515 2674
Mg 1766 1832 1950 Mn - 451 426 Mo - < 1.0 3.80 Na 1714 1791 1931 Nb - 33.9 28.4 Ni - 9.40 9.10 P 1052 1114 1119
Pb - 2.60 2.60 S 36,331 37,194 36,982
Sb - 27.7 26.8 Sc - < 1.00 < 1.00 Se - < 1.00 2.10 Si 228,083 231,052 - Sn - 80.7 79.8 Sr 89.7 100 110 Ta - 49.9 40.5 Th - 1.90 1.60 Ti - 425 428 Tl - 5.50 5.70 U - 29.0 25.0 V 9.22 9.25 18.5 W - 24.0 24.0 Zn 108 54.3 63.3

A company owned by ABN: 14 607 875 776 EIGG International Pty Ltd Page : 3 of 5
Order Ref : MB-1
Client : Albemarle Lithium
Results [cont.] * Aluminium concentration determined by LiBO4 fusion and ICP-OES. Values in ppm.
A company owned by ABN: 14 607 875 776 EIGG International Pty Ltd
Page : 4 of 5
Order Ref : MB-1
Client : Albemarle Lithium
Tailings 1 #4 Tailings 1 #5
Al * 92, 526 93, 765

Results [cont.] Concentrations of major and trace elements in the process liquor. Values in mg/L.
A company owned by ABN: 14 607 875 776 EIGG International Pty Ltd
Page : 5 of 5
Order Ref : MB-1
Client : Albemarle Lithium
Process Liquor ICP-OES ICP-MS
Liquor #1 Liquor #2 Liquor #3 Ag < 0.2 < 0.2 - Al 0.172 0.162 0.096 As < 0.2 < 0.2 < 0.01 B 13.1 13.1 19.9
Ba < 0.2 < 0.2 < 0.01 Be < 0.2 < 0.2 < 0.01 Bi - - < 0.01 Ca 675 709 432 Cd < 0.2 < 0.2 < 0.01 Ce < 0.2 < 0.2 < 0.01 Co < 0.2 < 0.2 < 0.01 Cr < 0.2 < 0.2 < 0.01 Cs - - < 0.01 Cu < 0.2 < 0.2 0.071 Fe < 0.2 < 0.2 < 0.05 K 0.41 - La - - < 0.01 Li 1.76 1.77 1.64
Mg 327 346 - Mn 0.019 0.019 0.021 Mo < 0.2 < 0.2 0.010 Na 1.28 - Nb - - < 0.01 Ni < 0.2 < 0.2 0.036 P 0.106 0.096 -
Pb < 0.2 < 0.2 < 0.01 S 892 1022 -
Sb - - 0.025 Sc < 0.2 < 0.2 < 0.04 Se < 0.2 < 0.2 < 0.01 Si 7.05 7.16 - Sn < 0.2 < 0.2 < 0.01 Sr 4.04 4.09 3.24 Ta - - < 0.01 Th - - < 0.01 Ti - - 0.464 Tl - - < 0.01 U - - 0.012 V < 0.2 < 0.2 < 0.01 W < 0.2 < 0.2 < 0.01 Zn < 0.2 < 0.2 < 0.01
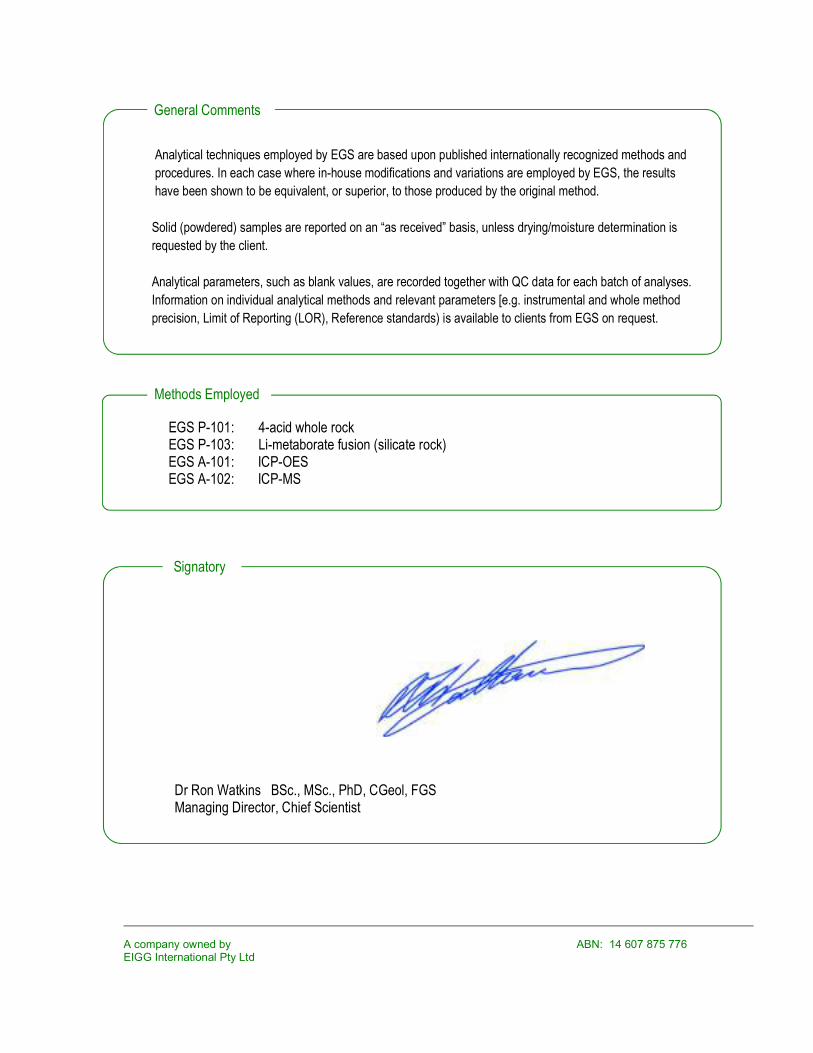
EGS P-103 pLi-metaborate fusion (silicate rock
Methods Employed
Analytical techniques employed by EGS are based upon published internationally recognized methods and procedures. In each case where in-house modifications and variations are employed by EGS, the results have been shown to be equivalent, or superior, to those produced by the original method. Solid (powdered) samples are reported on an “as received” basis, unless drying/moisture determination is requested by the client. Analytical parameters, such as blank values, are recorded together with QC data for each batch of analyses. Information on individual analytical methods and relevant parameters [e.g. instrumental and whole method precision, Limit of Reporting (LOR), Reference standards) is available to clients from EGS on request.
EGS P-101: 4-acid whole rock EGS P-103: Li-metaborate fusion (silicate rock)
EGS A-101: ICP-OES EGS A-102: ICP-MS
Dr Ron Watkins BSc., MSc., PhD, CGeol, FGS Managing Director, Chief Scientist
A company owned by ABN: 14 607 875 776 EIGG International Pty Ltd
Signatory
General Comments

Koolyanobbing Range C In-pit TSF Design Report
APPENDIX 5 – Albemarle Tailings Chemical Analysis Data

Albemarle Corporation Confidential
Table 1. Chemical analysis data
Analysis description Laboratory Comments Procedure ID Results Reference
pH using a 1:5 soil water extraction
ALS Environmental average 3 samples EA002: pH 1:5 pH 7.7 -
(EA002) (soils)
EC using a 1:5 soil water extraction
ALS Environmental average 3 samples EA010: EC 1:5 EC 2263 uS/cm -
(EA010) (soils)
Total Sulfur ALS Environmental average 3 samples
Total sulphur by LECO 3.58% In house
(ED042T)
Total Carbon ALS Environmental average 3 samples Total Carbon 0.89% In house
(EP003TC)
Sulfate sulfur (HCl digestible SO4)
ALS Environmental average 3 samples sulphate as SO42- 114,300 ppm Chemical analysis in-house
procedure based on Day (1991) and Lawrence (1995) (ED040)
Actual acidity
ALS Environmental average 2 samples pH KCl (23A) pH 7.9
In-house procedure based on Sobek et al (1978) and subject to
modifications (e.g. Lawrence and Wang, 1997; AMIRA, 2002)
(EA033-A) Titrable actual acidity (23F)
<2 mole H+ /t
sulfidic - titrable actual acidity (s-23F)
<0.02 % pyrite S
Potential acidity ALS Environmental average 2 samples Chromium reducible sulfur (22B) 0.020% S
(EA033-B) (1 sample below detection limits -
i.e. <0.005 %S / <10 mole H+ /t) acidity - Chromium
reducible sulfur (a-22B) 12 mole H+ /t
Acid neutralization capacity (ANC)
ALS Environmental average 3 samples acid neutralising capacity (19A2)
7.52% CaCO3
(EA033-C) acidity - acid neutralising capacity (a-19A2) 1500 mole H+ /t
sulfidic - acid neutralising capacity (s-19A2) 2.41% pyrite S
Acid Base Accounting
average 3 samples ANC fineness factor 1.5
average 3 samples Net acidity (sulfur units) <0.02% S
ALS Environmental average 3 samples Net acidity (acidity units) <10 mole H+ /t
(EA033-E) average 3 samples Liming Rate <1 kg CaCO3 / t
average 2 samples Net acidity excluding ANC (sulfur units)
0.02% S
(1 sample below detection limits - i.e. <0.02 %S / <10 mole H+ /t and
<1 kg CaCO3/t
Net acidity excluding ANC (acidity units) 12 mole H+ /t
Liming Rate excluding
ANC 1 kg CaCO3/t
Net acid generation (NAG) pH and titrations to pH 4.5 and pH7
ALS Environmental average 3 samples Miller 1998 pH (OX) 10.1
In-house procedure based on Miller et al (1997) and AMIRA (2002) (EA011) NAG (pH4.5) < 0.1
NAG (pH7.0) < 0.1

Koolyanobbing Range C In-Pit TSF Licence Amendment
Issue Date: 31/03/2020 ENV-TS-RP-0178 Page 34 of 34
APPENDIX 2: IN-PIT TSF RISK ASSESSMENT

Koolyanobbing Range C In-pit TSF Risk Assessment Report
Page | 1
Yilgarn Operations C In-pit TSF Project Risk Assessment Report
Introduction
MRL propose a short-term (2020-2024) Tailings Storage Facility (TSF) to dispose of tailings from Kemerton in the Yilgarn Iron Pty Ltd (YIPL) Koolyanobbing Range C deposit (C Pit), “the Project”. This facility will be utilised while a longer term tailings disposal solution is developed.
Albemarle Lithium Pty Ltd are the proponents for the Kemerton Lithium Hydroxide Plant (the Plant) is located 137km south of Perth and is currently under construction with an expected commissioning in the first quarter, 2021. Once in operation, the Kemerton Plant will process spodumene concentrate delivered from Talison Lithium Pty Ltd’s Greenbushes Mine (Greenbushes). The Plant will produce a Lithium Hydroxide and generate about 100,000 tonnes of residue (or tails) per annum.
A local disposal facility for the Plant tailings has not been finalised.
Lithium tailings are the residue produced from secondary processing of spodumene concentrate (approximately 6% Li2O), through pyro metallurgical and hydrometallurgical processes, to produce lithium hydroxide monohydrate. Lithium hydroxide monohydrate is used in the manufacture of rechargeable lithium ion batteries, industrial lubricants and dyes. Lithium processing tailings are an inert, non-toxic material comprised of alumina-silicates, approximately 15% gypsum, residual salts, trace elements and oxides from spodumene ore, and approximately 24% water.
C Pit has been sterilised and partially backfilled with waste rock from nearby Koolyanobbing Range E Deposit (E pit). The C Pit has capacity of approximately 4 million cubic metres to 30m below crest. Tailings will be deposited on top of “NAF” waste rock materials above 338m AHD. The base of the facility will be 1m higher than pre-mining groundwater levels.
On completion of the tailings deposition into C Pit, the material will be capped as soon as practicable. The capping layer will be designed to facilitate water shedding, preventing surface ponding and percolation through the tails and reducing erosion. This is important to prevent any oversaturation of the tails and possible slumping or dissolution of minerals and achieving a long-term stable landform.
This Risk Assessment addresses the risks identified for the Project and will assess the following considerations:
• The C Pit receiving environment • The tailing material’s chemical and physical characteristics • Handling and storage • Exposure pathways and environmental receptors • Mitigation and Residual Risk
The risk analysis can be found in Table 6 of this document.
TSF Design & Deposition Methodology
Side Tipping Road Trains will be used to transport tailings material from the Kemerton Lithium Hydroxide Plant to the C Pit. The trucks will tip the tailings within the pit and dozers will then push the tailings into place.
Following is a summary of the TSF preparation and tailings deposition methodology:
• Waste rock will be pushed into the pit from existing bench at 364m AHD until a base level of 338m AHD is achieved
• The base will track rolled; • Approximately 460k BCM of tailings will be side tipped on the bench at 364m AHD and pushed in by
dozer to complete the filling of the void to 364m AHD. • A 2m thick layer of waste rock will be placed and track rolled, creating a new base for tails deposition

Koolyanobbing Range C In-pit TSF Risk Assessment Report
Page | 2
• An infiltration basin will be constructed at 364m AHD by placing a windrow (3.5m high, base width 9.0m wide) of waste rock at the base of the new surface.
• Tailings will then be deposited in 500mm layers and compacted (track rolled) until tailings deposition is completed at 382m AHD
• Batter slopes of the deposited tails will not exceed 18 degrees. • At 382m AHD the entire tailings mound will be capped with 1m layer of waste rock and slightly sloped
to be water shedding • The new capped surface will be compacted, and will be at approximately 383m AHD.
FIGURE 1: CURRENT PLAN VIEW AND PROFILE OF C PIT BEFORE TAILINGS DEPOSITION

Koolyanobbing Range C In-pit TSF Risk Assessment Report
Page | 3
FIGURE 2: CROSS SECTION OF C PIT ON COMPLETION OF TAILINGS DEPOSITION
Risk Assessment Criteria
The Risks of the C In-pit TSF Project were assessed using the MRL / YIPL Likelihood & Consequence Criteria and Scales in Table 1 and Table 2 below. Risks that high or critical are reassessed after appropriate mitigations are proposed reduce the risk consequence as low as reasonably practicable (ALARP).
TABLE 1: LIKELIHOOD CRITERIA FOR CLASSIFYING THE PROBABILITY OF AN INCIDENT OCCURRING AND RESULTING IN DEFINED CONSEQUENCE, AND RESULTING RISK RANKING
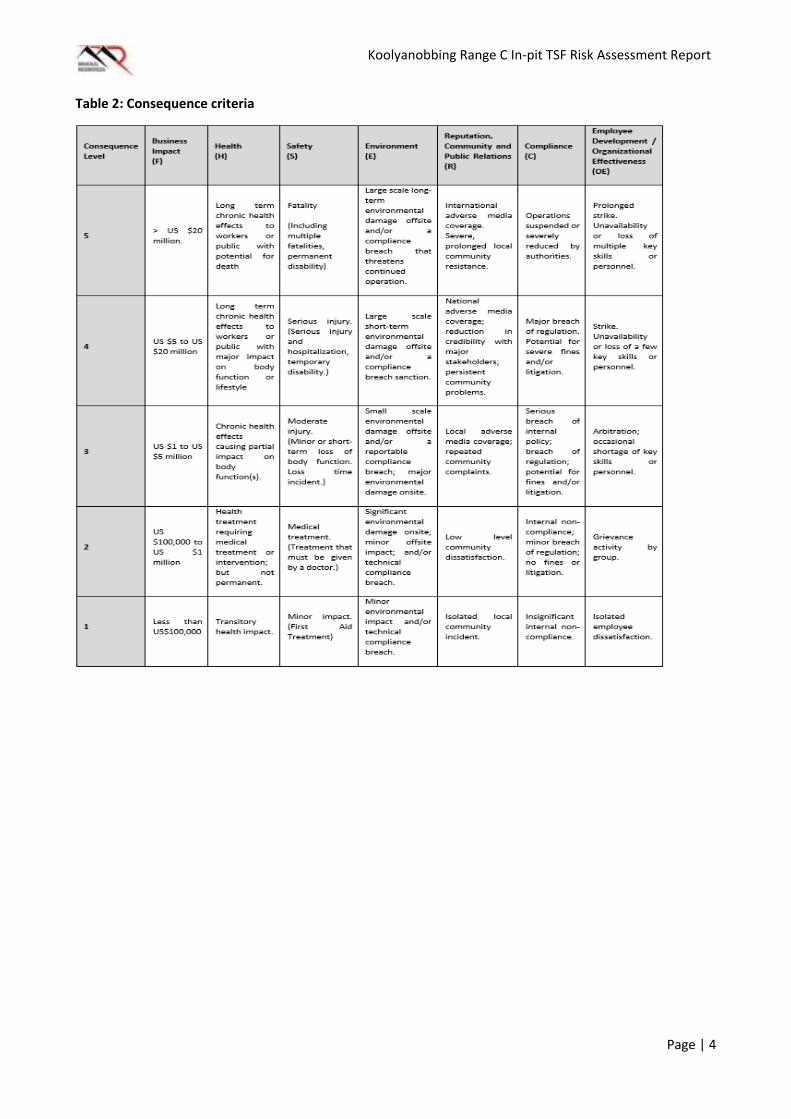
Koolyanobbing Range C In-pit TSF Risk Assessment Report
Page | 4
Table 2: Consequence criteria

Koolyanobbing Range C In-pit TSF Risk Assessment Report
Page | 5
Conceptual Site Model (Source – Receptor – Pathway)
Utilising the NEPM 1999 Assessment of Contaminated sites Guideline for Site Characterisation (Schedule B2 amended 2013), a Conceptual Site Model (CSM) was developed to show the source and pathways of exposure related to C Pit tailings deposition impact on the surrounding environment, Figure 3 and Figure 4.
FIGURE 3: C IN-PIT TSF ENVIRONMENTAL PATHWAYS AND IMPACTS ON RECEPTORS
The primary release mechanisms of contamination from lithium tailings deposition into C Pit identified:
• Dust & volatile emissions to air during deposition into the In-pit TSF • Leaching to ground water from release of moisture during consolidation of the tailings or from
rainfall percolation • Contaminated rainfall runoff to surface water and lakes
The Receptor sites identified:
• Mine workers in the vicinity or working at C Pit • Terrestrial biota in the vicinity of the C Pit
Potential Exposure Pathways considered to Receptor sites:
• Direct contact and ingestion of tailings dust by people and terrestrial biota • Direct contact with tailings leachate by people and terrestrial biota • Direct contact with tailings contaminated surface water by people or terrestrial biota
The following are considerations of contamination from tailings and the identified exposure pathways:
• Generation of Dust. The lithium tailings are very fine and will have inherent water content of approximately 24%. Because of the rapid drying properties of the tails, dusting is expected to be an issue. Tailings deposition in C Pit will be below the surrounding topography, sheltered from strong winds. The most plausible exposure pathway is to personnel, working in the vicinity of the tailings.

Koolyanobbing Range C In-pit TSF Risk Assessment Report
Page | 6
Management measures such as, sealed cabs in vehicles, personal protective equipment and/or water cart spraying will be required during tailings deposition into C Pit.
• Leaching to groundwater. The tailings are “dry stacked” and will be deposited above existing and projected ground water levels so will not be in direct contact with the ground water. The only mechanism of leachate is from rainwater percolation through the tails and discharge to the groundwater. The risks of generating a leachate containing metals only occurs below pH4 (Ramboll 2018). No plausible opportunity will exist for generation of acidic leachant and the groundwater is hypersaline with no foreseeable beneficial use, so there is no plausible pathway to receptors.
• Contamination of surface water by rainfall runoff after contact with tailings. The TSF is contained within the C Pit so no interaction with surface water flows is possible.
Summary of Conceptual Site Model
The main Receptor identified with a plausible pathway, are mine personnel working in the C Pit during tailings deposition. Any potential for dust from the TSF to deposit on terrestrial biota close to the pit is very low. Implementation of YIPL Dust Management Plan and standard mining practices will address the safety issues associated with exposure to any tailings dust.
Tailings deposition is “dry stacked” and will be compacted in 500mm lifts. Water management controls will divert any water from percolating into tailings therefore minimising any opportunity of leachate formation. Any excess water (liquor or incidental rainwater) will be diverted to a collection sump for infiltration and evaporation.

Koolyanobbing Range C In-pit TSF Risk Assessment Report
Page | 7
FIGURE 4: C IN-PIT TSF ENVIRONMENTAL RECEPTORS

Koolyanobbing Range C In-pit TSF Risk Assessment Report
Page | 8
Summary of Risk Assessment
The risk assessment shows that the risks are associated with dust during tailings deposition and handling. The risk of environmental impacts from the Project, given the receiving environment, is LOW.
TSF Design and the YIPL Environmental Management System procedures will be sufficient to address any worker exposure by controlling dust.
Management Commitments arising from the Risk Assessment:
• The design of the In-pit tailings handling and storage process will address safety issues associated with road train access into the pit, stacking of the tailings and drainage within the pit;
• Tailings deposition within the C Pit will be at 338m AHD, ie above the pre-mining groundwater level • The tailings will be capped as soon as practicable on completion of deposition, with 1m thick layer of
NAF waste rock; • The YIPL Dust Management Plan will be implemented to minimise tailings dust impact on personnel
and the surrounding environment; and • Visual monitoring of tailings dust impact on surrounding vegetation will be undertaken, and dust
control measures increased or modified as required.

Koolyanobbing Range C In-pit TSF Risk Assessment Report
Page | 9
Table 5: C In-pit TSF Risk Assessment Findings
Issue / concern Risk Factors & Context Inherent Likelihood Rating
Inherent Consequence Rating
Inherent Risk Ranking
Proposed Controls Residual Likelihood Rating
Residual Consequence Rating
Residual Risk Ranking
Separation of the tailings material into solid and liquid layers, and causing the material to stick to the trays and not tip out at the destination, and with runoff of the tailings liquor into the pit
This is largely a safety concern if material holds up in the trays and needs machinery to scrape it out. The environmental impact of the tailings liquor seeping into the ground are minimal as the pit groundwater is already hypersaline and there is no contaminants in the liquor
C 1 L4 • No action required C 1 L4
Tailings dust emissions during transport from Kemerton plant to C Pit
Tailings will air dry in transit and cause dust problems en route if not covered A 1 M11
• Trucks and trailers to have covers – no tailings to be transported uncovered
• This will be written into the transportation contract E 1 L1
Increased noise and / or odour from tailings handling and deposition at C Pit
There are no communities close by, and tailings handling at the pit is not likely to have significantly different impact on the workforce compared to other pit activities
D 1 L2 • No action required D 1 L2
Driving of mobile plant & vehicles on the tailings material may be a safety issue due to ground stability conditions
High or Unseasonal rainfall may cause the tailings to fluidise and spread within the pit and not drain quickly – safety issue for vehicles. Tipped tailings that have not been moved may create a surface hazard for vehicles after rainfall
C 1 L4
• TSF design has compaction of tailings every 500mm, and coarse material sheeting for wet weather to maintain a stable base for movement of vehicles.
• Design report allows for sheeting with coarse competent waste rock for dozer / vehicle trafficability in wet weather
E 1 L1
Rainwater percolating through the tailings material may leach tailings liquor / salts into ground water
Groundwater in Koolyanobbing Project Area is highly saline to saline in quality, therefore the impact of any rainwater leachate is considered minor. Leach results show that under neutral conditions there is no dissolution of COC’s
B 1 M7
• Tailings will be compacted to reduce voids • The TSF design includes a sump with 3.6ML capacity for
collection of tailings liquor drainage and rainfall runoff at 364m AHD for dust suppression use, or left to evaporate, or seep into groundwater without contacting encapsulated tailings
C 1 L4
A 100-year Annual Recurrence Interval (ARI) peak rainfall event (72 hour duration) occurs and erodes the tailings and contaminates the groundwater
100 year ARI event for 72 hours will cause approximately 45ML of water in the C Pit catchment area Such a large rainfall event is likely to cause widespread erosion of the pit and tailings. This volume would exceed the short term capacity of the infiltration basin. These conditions would impact on the operations but based on the geo-chemistry of the tailings is not expected to result in any leaching of contaminants The underlying aquifer is highly saline so the environmental impact is considered minor
D 1 L2
• After a large rainfall event, YIPL will inspect pit walls and tailings for erosion, as well as the infiltration basin (sump). Rectification works will be undertaken, the infiltration basin will be re-instated, and eroded surfaces will be repaired to make safe
• Post closure the slope angles on the cap material will be
low (<5%) to prevent surface water erosion
E 1 L1

Koolyanobbing Range C In-pit TSF Risk Assessment Report
Page | 10
Issue / concern Risk Factors & Context Inherent Likelihood Rating
Inherent Consequence Rating
Inherent Risk Ranking
Proposed Controls Residual Likelihood Rating
Residual Consequence Rating
Residual Risk Ranking
Groundwater may rise higher than the projected recovery level and cause the tailings to be in contact with the hypersaline water and then leach metals
Groundwater recovery level may rise above projected rebound level due to extreme rainfall event. Tailings may come into contact with groundwater or tailings leachate will enter the groundwater and impact on future land use / groundwater requirement Geochemical test work indicates the tailing material is unlikely to leach any COC’s The regional groundwater quality is hypersaline, and there are no environmental receptors close by
D 1 L2 • Base of C Pit will be filled in to 338m AHD, which is 1m
higher than pre-mining regional groundwater level
D 1 L2
Uncapped stored tailings may create a dust problem
The tailings could dry out prior to capping, and may cause excessive dust emissions within the confines of the pit B 1 M7
• If dust generation becomes excessive from uncapped tailings, then capping to commence on unconsolidated material to reduce dust emissions. YIPL will also investigate suitability of dust suppression polymers
• YIPL will implement its Dust Management Plan during
tailings deposition into C Pit
E 1 L1
C Pit wall failure may cause PAF contact with tailings, which may generate acid water seepage into tailings and releasing contaminants into the groundwater C Pit wall failure may cause injury to personnel in the vicinity
C Pit wall rock is slightly alkaline and has less than 0.1% sulphidic material C Pit walls are stable, there has not been any wall failure since C Pit closure in 2017 The tailings material are alkaline with a high acid neutralising capacity (1,500 Moles H+/Tonne) Groundwater is hypersaline.
C 1 L4
• No action required to manage the environmental risk - ALARP
• YIPL has operating procedures in place for mining
personnel working in pits and near high walls
D 1 L2
Waste rock for sheeting and capping may contain potential acid forming material, which may acidify rainwater and leach metals out of the tailings
According to Geochemical characterisation of the pit rock, there is 1% PAF with a low risk of acidic, metalliferous or saline drainage The tailings material are alkaline with a high acid neutralising capacity (1,500 Moles H+/Tonne) Leach test work shown no leaching of COC’s
D 1 L2 • ALARP
D 1 L2
Insufficient NAF material within C Pit for sheeting and capping of the tailings at closure
Testing of backfilled rock from E pit finds PAF content greater than 1% The tailings material are alkaline with a high acid neutralising capacity (1,500 Moles H+/Tonne) Leach test work shows no leaching of COC’s
C 1 L4
• Undertake testwork to confirm NAF material in surrounding waste dumps
• Any areas identified as PAF to be avoided for capping
D 1 L2
C In-pit TSF may not achieve Closure Criteria (safe, stable and non-polluting landform)
Capping over the tailings may erode if the surface slope is too high, resulting in release of tailings dust into the environment B 1 M7
• The tailings cap surface will be compacted with slope of not exceeding 5 degrees
• Survey control to be used to ensure final compliance to design
D 1 L2

Koolyanobbing Range C In-pit TSF Risk Assessment Report
Page | 11
Issue / concern Risk Factors & Context Inherent Likelihood Rating
Inherent Consequence Rating
Inherent Risk Ranking
Proposed Controls Residual Likelihood Rating
Residual Consequence Rating
Residual Risk Ranking
C In-pit TSF may not achieve Closure Criteria (safe, stable and non-polluting landform)
Tailings differential consolidation & settlement across the C Pit causes localised sinking of the cap layer and increased rainfall percolation through the encapsulated tailings with possible contamination of groundwater
C 2 M8
• After capping of the tailings, YIPL will undertake annual survey pickups of the C Pit to determine if there is differential settlement of the tailings. If no subsidence detected then the monitoring will stop at 3 years, otherwise the cap layer will be reshaped and monitoring will recommence
D 2 L5
YIPL Operations are placed in Care and Maintenance before Albemarle finalises a local TSF facility
YIPL must stop operations at Koolyanobbing and therefore stop receiving tailings to C Pit C 2 M8
• Should early, unplanned or permanent closure occur prior to completion of tailings deposition, the tailings will be capped, access will be restricted and warning signs will be erected. Existing abandonment bunds will be re-established and or repaired in line with current mine closure plan
• A Care and Maintenance plan will be developed that
includes annual inspections to assess TSF structural integrity, access restriction and signage
A 2 L3