Konica Minolta Group 3nd Quarter/March 2011 … · 3rd Quarter/March 2011 Consolidated Financial...
29
0 Konica Minolta Group 3rd Quarter/March 2011 Consolidated Financial Results Three months: October 1, 2010 – December 31, 2010 Nine months: April 1, 2010 – December 31, 2010 January 28, 2011 Yoshiaki Ando Senior Executive Officer Konica Minolta Holdings, Inc.
Transcript of Konica Minolta Group 3nd Quarter/March 2011 … · 3rd Quarter/March 2011 Consolidated Financial...

0
Konica Minolta Group 3rd Quarter/March 2011 Consolidated Financial ResultsThree months: October 1, 2010 – December 31, 2010Nine months: April 1, 2010 – December 31, 2010
January 28, 2011
Yoshiaki AndoSenior Executive OfficerKonica Minolta Holdings, Inc.

1
Cautionary Statement:The forecasts mentioned in this material are the results of estimations based on currently available information, and accordingly, contain risks and uncertainties. The actual results of business performance may sometimes differ from those forecasts due to various factors.
Remarks: Yen amounts are rounded to the nearest 100 million.

2
3Q/March 2011 financial results – Overview (vs. forecasts)
The Group results rose steadily until the first half of the fiscal year, but net sales and net income fell in Q3, and the sales recovery lost momentum. Based on this situation, we have revised the results forecast.
Business Technologies Business: Unit sales of profitable new products, both office and production print systems, were weak, and the target was not achieved. Sales of color MFPs fell, and the sales mix shifted to low-speed products. As a result, profitability declined.
Optics Business: While sales of TAC films recovered, sales of glass HD substrates and optical pickup lenses were sluggish with the effect of production adjustments at customers lasting longer than expected.
As a result, profits in the first nine months rose from a year ago but was below the forecast.
The Group will focus on expanding sales in Q4 to offset the difference between the target and actual results in Q3 and will strive to maximize profit in Q4, comprehensively reducing expenses and costs.

3
3Q/Mar2011 financial results - Overview
[Billions of yen]
9M 9MMar11 Mar10 YoY 3Q 2Q QoQ
Net sales 575.3 588.7 △ 13.5 183.5 197.2 △ 13.7
Operating income 28.3 21.2 7.0 5.6 12.8 △ 7.1
Operating income ratio 4.9% 3.6% 3.1% 6.5%
Goodwill amortization 6.3 7.0 △ 0.7 2.0 2.1 △ 0.0Operating income beforeamortization of Goodwill(b) 34.6 28.2 6.4 7.7 14.9 △ 7.2
(b)/(a) 6.0% 4.8% 4.2% 7.5%
Net income 10.8 9.0 1.8 2.2 5.1 △ 3.0
Net income ratio 1.9% 1.5% 1.2% 2.6%
FOREX [Yen] USD 86.84 93.56 △ 6.72 82.64 85.87 △ 3.23
Euro 113.30 133.00 △ 19.70 112.23 110.66 1.57
Mar11

4
3Q/March 2011 financial results - Group
393.9 396.3
102.6 99.476.4 62.5
18.1 26.010.3
10.0
△ 9 △ 10
3.6%
4.9%
Net sales588.7 575.3 Operating
income
21.228.3
OP ratio[¥ billions]
Net sales / Operating income (YoY)
9M/Mar2010 9M/Mar2011
■Other■Health Care■Optics■Business
Technologies■Other
[¥ billions] Net sales / Operating income (QoQ)
133.3 130.3
34.0 30.2
23.9 17.6
11.96.4
2.9
2.1
△ 3.3△ 3.4
6.5%
3.1%
2Q/Mar2011 3Q/Mar2011
Net sales197.2
Operatingincome
OP ratio
12.8183.5
5.6
■Other■Health Care■Optics■Business
Technologies■Other
9M/March 2011 results (YoY)Net sales: -2% (w/o forex: +5%)Operating income: +33% (w/o forex: +113%)
Net sales were about the same level as a year ago due to the strong yen, but rose without the effect of exchange rates.
Leaving out the effect of exchange rates, operating income doubled from a year ago, led by an increase in sales of new MFPs in the Business Technologies Business.
3Q/March 2011 results (QoQ)Net sales: -7% (w/o forex: -6%)Operating income: -56% (w/o forex: -55%)
Net sales declined, reflecting falls in unit sales of the main products in the Business Technologies Business, Optics Business, and Healthcare Business.
Operating income declined, attributable to a decrease in unit sales and changes in prices and the sales mix.
5
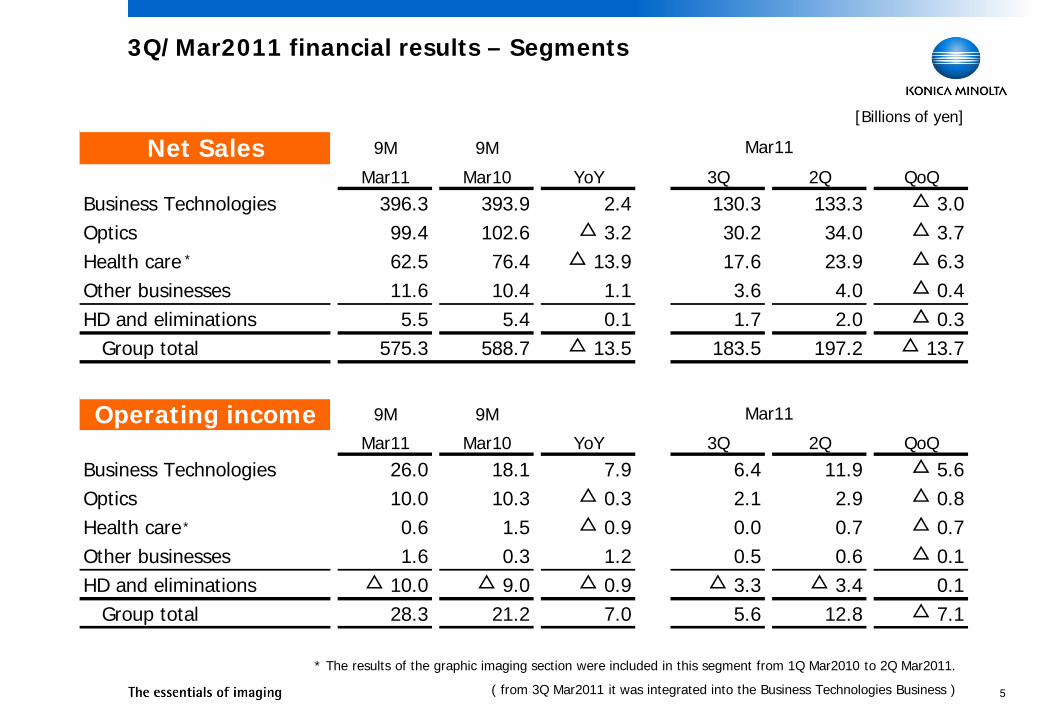
3Q/Mar2011 financial results – Segments
[Billions of yen]
Net Sales 9M 9M
Mar11 Mar10 YoY 3Q 2Q QoQBusiness Technologies 396.3 393.9 2.4 130.3 133.3 △ 3.0Optics 99.4 102.6 △ 3.2 30.2 34.0 △ 3.7Health care 62.5 76.4 △ 13.9 17.6 23.9 △ 6.3Other businesses 11.6 10.4 1.1 3.6 4.0 △ 0.4HD and eliminations 5.5 5.4 0.1 1.7 2.0 △ 0.3
Group total 575.3 588.7 △ 13.5 183.5 197.2 △ 13.7
Operating income 9M 9M
Mar11 Mar10 YoY 3Q 2Q QoQBusiness Technologies 26.0 18.1 7.9 6.4 11.9 △ 5.6Optics 10.0 10.3 △ 0.3 2.1 2.9 △ 0.8Health care 0.6 1.5 △ 0.9 0.0 0.7 △ 0.7Other businesses 1.6 0.3 1.2 0.5 0.6 △ 0.1HD and eliminations △ 10.0 △ 9.0 △ 0.9 △ 3.3 △ 3.4 0.1
Group total 28.3 21.2 7.0 5.6 12.8 △ 7.1
Mar11
Mar11
* The results of the graphic imaging section were included in this segment from 1Q Mar2010 to 2Q Mar2011.
( from 3Q Mar2011 it was integrated into the Business Technologies Business )
*
*

6
Business Technologies - Overview
336.3 337.4
57.7 59.04.6%
6.6%
[¥ billions]
Operating income
18.1
Net sales / Operating income (YoY)
9M/Mar2010 9M/Mar2011
Office
Production printing
Net sales393.9 396.3
26.0
OP ratio
114.1 108.7
19.2 21.69.0%
4.9%
[¥ billions] Net sales / Operating income (QoQ)
2Q/Mar2011 3Q/Mar2011
Operating income
11.9
6.4
Net sales133.3 130.3
OP ratio
Office
Production printing
9M/March 2011 results (YoY)Net sales: +1% (w/o forex: +10%)Operating income: +44% (w/o forex: +119%)Office: Sales improved, led by increases in sales of new color and B/W MFPs.
Production Printing: Sales remained unchanged without the inclusion of the graphic imaging section. The effect of the strong yen was offset by an increase in unit sales.
3Q/March 2011 results (QoQ)Net sales: -2% (w/o forex: -1%)Operating income: -46% (w/o forex: -49%)
Office: Sales of profitable new color MFPs declined. The margin fell, reflecting an increase of low-priced MFPs in the sales mix.
Production Printing: Sales of new color products started slowly, failing to reach their maximum level, as the Company carefully developed supply and sales structures.

7
Business Technologies – Sales performance
Production Printing Product unit sales
Office MFP unit sales
3Q(QoQ)9M(YoY)
36 44
6477
Color
B/W
38 33
6260
B/W
Color
9M/Mar2010 9M/Mar2011 2Q/Mar2011 3Q/Mar2011
100121
100 93
49 53
51 36
53 59
4750
100 109
2Q/Mar2011 3Q/Mar2011
10089B/W B/W
Color Color
*Base index : “9M/Mar2010“ and “2Q/Mar2011”= 100
Non-Hardware Sales (w/o FOREX)
100 104
9M/Mar2010 9M/Mar2011 2Q/Mar2011 3Q/Mar2011
100 103
Office MFP9M/March 2011 results (YoY)Unit sales: +21% (color +24%, BW +19%)
Sales of color MFPs and B/W MFPs both rose due to an increase in sales of new products.3Q/March 2011 results (QoQ)Unit sales: -7% (color -14%, BW -4%)
Sales of color MFPs and B/W MFPs both rose in Europe but were generally weak in other markets.
Production Printing Product9M/March 2011 results (YoY)Unit sales: +9% (color +12%, BW +5%)
Sales of color MFPs rose in the US and Europe. Sales of B/W MFPs grew in Japan, US and Europe.3Q/March 2011 results (QoQ)Unit sales: -11% (color +9%, BW -29%)
Sales of color MFPs increased in Europe and US. Sales of B/W MFPs were weak, reflecting a decrease in bid deals in North America.
Non-Hard Sales9M/March 2011 results (YoY)Sales: -4% (w/o forex: +4%)3Q/March 2011 results (QoQ)Sales: +2% (w/o forex: +3%)
Sales of non-hardware remained solid in Q3.
9M/Mar20119M/Mar2010
8
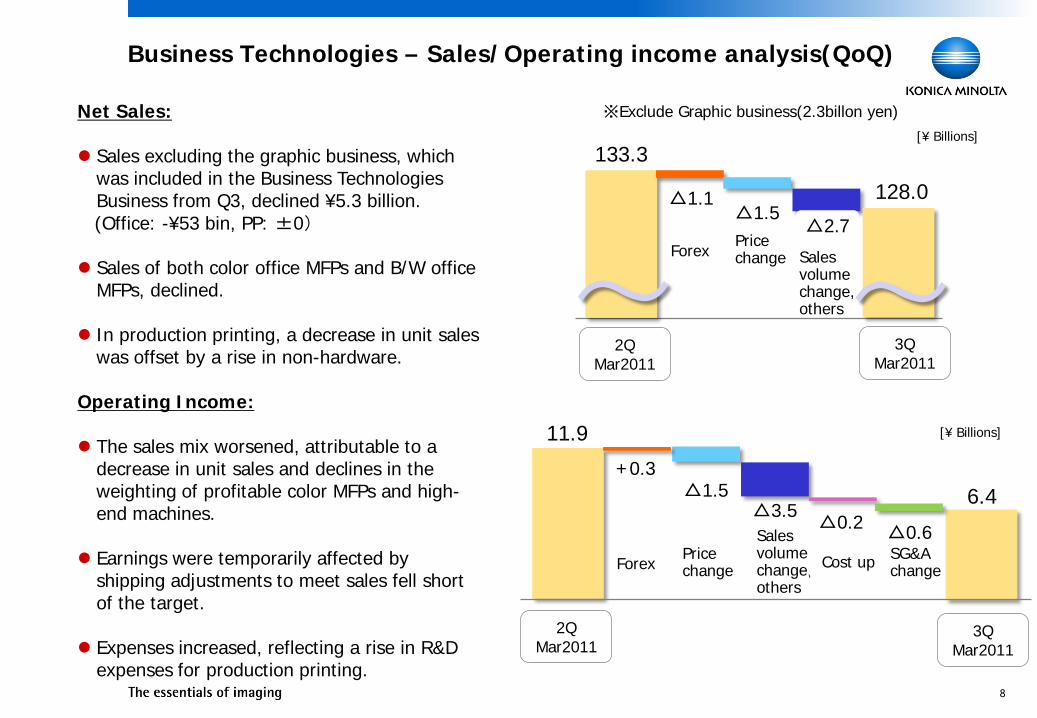
Business Technologies – Sales/Operating income analysis(QoQ)
[¥ Billions]
ForexPrice change Sales
volumechange,others
△1.1
2QMar2011
3QMar2011
~ ~
ForexPrice change
Sales volumechange,others
Cost up SG&Achange
△1.5△2.7
133.3
128.0
※Exclude Graphic business(2.3billon yen)
+0.3△1.5
△3.5△0.2
△0.6
11.9
6.4
[¥ Billions]
Net Sales:
Sales excluding the graphic business, which was included in the Business Technologies Business from Q3, declined ¥5.3 billion.(Office: -¥53 bin, PP: ±0)
Sales of both color office MFPs and B/W office MFPs, declined.
In production printing, a decrease in unit sales was offset by a rise in non-hardware.
Operating Income:
The sales mix worsened, attributable to a decrease in unit sales and declines in the weighting of profitable color MFPs and high-end machines.
Earnings were temporarily affected by shipping adjustments to meet sales fell short of the target.
Expenses increased, reflecting a rise in R&D expenses for production printing.
2QMar2011
3QMar2011

9
Optics - Overview
[¥ Billions] Net sales / Operating income (YoY)
43.0 41.2
22.6 27.4
37.0 30.9
10.0% 10.1%
Operating income
10.3
9M/Mar2010 9M/Mar2011
Image I/O
Memory
99.4
10.0
OP ratio
Net sales102.6
TAC film
13.1 13.1
9.7 7.7
11.19.5
8.5% 6.8%
[¥ Billions]
Net sales / Operating income (QoQ)
2Q/Mar2011 3Q/Mar2011
30.2
Net sales34.0Image I/O
Memory
TAC film
OP ratioOperating income
2.92.1
9M/March 2011 results (YoY)Net sales: -3%Operating income: -2%
TAC films: Sales declined slightly from Q2 due to the effect of adjustment.
Glass HD substrates: Sales increased, thanks to a density increase and larger volumes.
Optical pick-up lenses: Although unit sales of optical pickup lenses for Blu-ray (BD) rose, its contribution to revenues was limited by changing product mix shifted from glass to plastics.
3Q/March 2011 results (QoQ)Net sales: -11%Operating income: -29%
TAC films: While sales declined on a prolonged adjustment, both sales and profits were recovering in the second half of Q3 after bottoming out in October.
Glass HD substrates: Sales grew at a sluggish pace, reflecting production adjustment.
Optical pick-up lenses: Unit sales decreased, influenced by the lackluster market for high-end PCs.

10
Optics – Sales performance 9M/March 2011
TAC films sales volumes
Optical pickup lens unit sales
*Base index : “9M/Mar2010“ and “2Q/Mar2011”= 100
[¥ Billions]
Glass HD substrates unit sales2Q/Mar2011 3Q/Mar2011
3Q(QoQ)9M(YoY)
100
148100 96
9M/Mar2010 9M/Mar2011 2Q/Mar2011 3Q/Mar2011
14 11
86
54
2Q/Mar2011 3Q/Mar2011
100
65
100 99
9M/Mar2010 9M/Mar2011
100 103
TAC films9M/March 2011 results (YoY)
Although sales volumes of VA-TAC films declined, overall sales volume increased, driven by wide and thin plain TAC film. 3Q/March 2011 results (QoQ)
Thanks to the steady recovery in sales volume by VA-TAC films, overall volumes remained in line with the level in Q2, despite the market correction.
Glass HD substrates9M/March 2011 results (YoY)
Unit sales increased, centering on glass HD substrates for high density. 3Q/March 2011 results (QoQ)
Sales grew at a sluggish pace given the effects of production adjustment.
Optical pick-up lenses9M/March 2011 results (YoY)
Unit sales of optical pickup lenses for both BD and DVD increased. The contribution of optical pickup lenses for BD to revenues was limited because of the expansion of plastic lenses for BD.3Q/March 2011 results (QoQ)
Sales were generally weak, including pickup lenses for BD due to production adjustment. 10 19
90
110
100128
9M/Mar2010 9M/Mar2011
Others
Blu-ray

11
Optics- Sales/Operating income analysis(QoQ)
[¥ Billions]
Forex Price change Sales
volumechange,others
SG&Achange
3QMar2011
2QMar2011
~ ~
34.0
△0.4 △0.4
△3.0
30.2
2.9
△0.2△0.4
△0.8 +0.1 +0.5
2.1
Forex Price change Sales
volumechange,others
Cost cut, net
Net Sales:
A forex effect emerged mainly in the glass HD substrates and lens units.
A price change occurred, primarily in lens units.
In quantity terms, the major factor was a fall in unit sales of optical pickup lenses and glass HD substrates.
Operating Income:
Expenses were reduced primarily because of a decrease in R&D expenses.
2QMar2011
3QMar2011

12
Forecasts: FY/March 2011
※Foreign Exchange Impact(Annual)
Net Sales Operating Income
USD ¥2.5 bn ¥0.3 bn
Euro ¥1.3 bn ¥0.7 bn
[Billions of yen]CurrentForecast
PreviousForecast
ChangeFY
Mar10Net sales(a) 780.0 800.0 -20.0 804.5Operating income 45.0 50.0 -5.0 44.0
Operating income ratio 5.8% 6.3% 5.5%
Goodwill amortization 8.5 8.5 0.0 9.2Operating income beforeamortization of Goodwill(b) 53.5 58.5 -5.0 53.2
(b)/(a) 6.9% 7.3% 6.6%
Ordinary income 38.0 43.0 -5.0 40.8Net income 20.0 20.0 0.0 16.9
Net income ratio 2.6% 2.5% 2.1%
FOREX [Yen] USD 85.00 85.00 0.00 92.85
Euro 110.00 110.00 0.00 131.15
CAPEX 45.0 50.0 -5.0 36.9Depreciation 57.0 63.0 -6.0 61.2R&D expenses 75.0 78.0 -3.0 68.5FCF 15.0 25.0 -10.0 72.9

13
Forecasts: FY/March 2011 - Segments
[Billions of yen]
Net Sales CurrentForecast
PreviousForecast
ChangeFY
Mar10Business Technologies 541.0 549.0 -8.0 540.8Optics 130.0 137.0 -7.0 136.7Health care 85.5 89.0 -3.5 104.4Other businesses 17.0 17.0 0.0 14.5HD and eliminations 6.5 8.0 -1.5 8.1
Group total 780.0 800.0 -20.0 804.5
Operating income CurrentForecast
PreviousForecast
ChangeFY
Mar10Business Technologies 41.0 45.6 -4.6 39.0Optics 14.0 15.0 -1.0 14.4Health care 1.0 1.6 -0.6 1.5Other businesses 2.3 2.5 -0.2 1.1HD and eliminations -13.2 -14.7 1.5 -11.9
Group total 45.0 50.0 -5.0 44.0

14
To achieve forecasts for FY/March 2011
Business Technologies Business Focus on increasing the unit sales of profitable new MFPs in all regions and channels in the office
segment to offset the short fall in Q3. As the supply and sales structures of new color products have been established in production
printing, focus on expanding sales already in full swing in all channels of commercial printing, CRD and PFP.
In particular, execute initiatives that focus on bolstering sales of color products and high-end products, and strive to improve profitability and maximize gross profits through increases in unit sales and improvements in the sales mix.
In OPS and GMA, focus on promptly closing agreements and deliveries in 4Q for projects that have already been received.
Optics Business Make every effort to expand sales of competitive new VA-TAC film, as well as an extra-wide and
thin plain TAC film, and aim to outperform market growth. Seek to improve the profitability of the production of glass HD substrates and optical pickup lenses,
the markets for which remain in an adjustment phase, by pursuing initiatives to improve productivity and efficiency, including an acceleration of a shift to overseas production.
Expense control: Comprehensively reduce expenses, putting the priority on expenses for expanding sales.
15
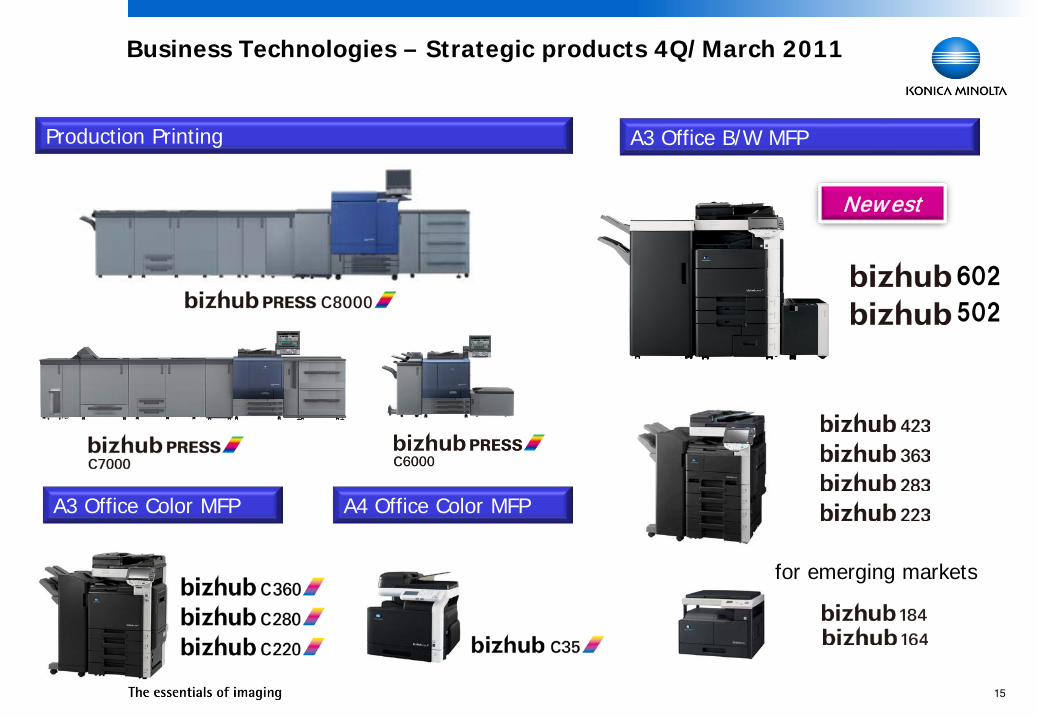
Business Technologies – Strategic products 4Q/March 2011
A3 Office Color MFP
A3 Office B/W MFP
A4 Office Color MFP
for emerging markets
Production Printing
Newest
602
502

16
Business Technologies Business: Initiatives to strengthen IT services
Alliance with Getronics N.V. (Europe, November 2010)
Has entered into a strategic cooperation contract with Getronics, a subsidiary of leading European telecom company KPN, a leading European IT service provider
Accelerate the operation of OPS and GMA in Europe, leveraging the capabilities of Getronics such as work space management, network connection, data centers, and consulting
Started cooperation on an European basis from January 2011 based on this strategic cooperation. In addition, consider operations on a global basis
Acquisition of All Covered, Inc. (United States, December 2010)
Acquired All Covered, which operates a business for SMBs across the United States in the managed IT service field
Accelerating the operation of vertical marketing and OPS in the United States, taking advantage of the capabilities of All Covered to provide IT services
Create synergy in the sales of MFPs, applying the SMB-driven customer approach, strength of Konica Minolta, to the SMB customer base of All Covered

17
Supplementary Information3Q/ Mar2011 Financial Results

18
Results: 9 months (Apr-Dec)
[Billions of yen]9MMar11
9MMar10
YoY
Net sales 575.3 588.7 -13.5Gross income 264.6 258.6 5.9
Gross income ratio 46.0% 43.9% -
Operating income 28.3 21.2 7.0Operating income ratio 4.9% 3.6% -
Ordinary income 22.3 19.1 3.1Net income before taxes 16.3 17.6 -1.3Net income 10.8 9.0 1.8
Net income ratio 1.9% 1.5% -
EPS [Yen] 20.35 16.99 -
CAPEX 33.1 24.4 8.7Depreciation 41.1 46.1 -4.9R&D expenses 54.1 52.0 2.1FCF 5.8 57.7 -52.0
Foreign exchange rate [Yen] USD 86.84 93.56 -6.72
Euro 113.30 133.00 -19.70

19
9MMar11
9MMar10
YoY
Business Technologies 396.3 393.9 2.4Optics 99.4 102.6 -3.2Healthcare 62.5 76.4 -13.9Other businesses 11.6 10.4 1.1HD and eliminations 5.5 5.4 0.1
Group total 575.3 588.7 -13.5
9MMar11
9MMar10
YoY
Business Technologies 26.0 18.1 7.9Operating income ratio 6.6% 4.6% -
Optics 10.0 10.3 -0.3Operating income ratio 10.1% 10.0% -
Healthcare 0.6 1.5 -0.9Operating income ratio 0.9% 2.0% -
Other businesses 1.6 0.3 1.2HD and eliminations -10.0 -9.0 -0.9
Group total 28.3 21.2 7.0Operating income ratio 4.9% 3.6% -
Results: 9 months (Apr-Dec) - Segment
* Other businesses: Sensing and Industrial Inkjet businesses
Net sales
Operating income
[Billions of yen]

20
Results: 3Q/March 2011[Billions of yen]
3QMar11
3QMar10
YoY
Net sales 183.5 195.4 -11.9Gross income 83.7 89.8 -6.1Gross income ratio 45.6% 45.9%
Operating income 5.6 12.0 -6.4Operating income ratio 3.1% 6.2%
Ordinary income 4.4 10.4 -6.0Net income before taxes 4.7 10.6 -6.0Net income 2.2 5.5 -3.3Net income ratio 1.2% 2.8%
EPS [Yen] 4.06 10.32
CAPEX 8.5 7.0 1.5Depreciation 13.7 15.2 -1.5R&D expenses 18.8 16.7 2.1FCF -6.8 25.6 -32.5
Foreign exchange rate [Yen] USD 82.64 89.72 -7.08
Euro 112.23 132.68 -20.45

21
Results: 3Q/March 2011 - Segments
* Other businesses: Sensing and Industrial Inkjet businesses
[Billions of yen]
Net sales
Operating income
3QMar11
3QMar10
YoY
Business Technologies 130.3 134.0 -3.7Optics 30.2 32.1 -1.9Healthcare 17.6 23.5 -5.9Other businesses 3.6 4.0 -0.4HD and eliminations 1.7 1.8 -0.1
Group total 183.5 195.4 -11.9
2QMar11
2QMar10
YoY
Business Technologies 6.4 10.2 -3.8Operating income ratio 4.9% 7.6% -
Optics 2.1 4.2 -2.1Operating income ratio 6.8% 13.0% -
Healthcare 0.0 -0.3 0.3Operating income ratio 0.0% -1.1% -
Other businesses 0.5 0.4 0.1HD and eliminations -3.3 -2.5 -0.8
Group total 5.6 12.0 -6.4Operating income ratio 3.1% 6.2% -

22
103
101 102 104102100 98
1Q 2Q 3Q 4Q
Mar10 Mar11
18.2 19.221.6
19.8 20.118.3
19.5
1Q 2Q 3Q 4QMar10 Mar11
18.2 19.221.6
19.8 20.118.3
19.5
1Q 2Q 3Q 4QMar10 Mar11
117112100
151
129131149
1Q 2Q 3Q 4QMar10 Mar11
Unit sales: Business Technologies
Production printing – Value
A3 color MFP– Units
MFP non-hardware * w/o forex effects
A4 color MFP – Units
YoY: +10% YoY: +17%
QoQ: △14% QoQ: △15%
YoY: +9%
QoQ : +13%
YoY: +3%
QoQ: +3%
[¥ billions]
* Base index : “1Q Mar2010 “= 100
249 256185
100134
186218
1Q 2Q 3Q 4QMar10 Mar11

23
Unit Sales: Optics
*Base index : “1Q Mar2010 “= 100
Glass HD substrates - Units
TAC film – Units Optical pickup lenses - Units
Mobile phone components – Units
YoY:△4%
QoQ: △1%
YoY:△15%
QoQ: △35%
YoY:+21%
QoQ: △4%
YoY: △50%
QoQ: △29%
120103 102
108100
109 106
1Q 2Q 3Q 4QMar10 Mar11
183194
126
157
100
143 149
1Q 2Q 3Q 4Q
Mar10 Mar11
191
100
135159
187200 193
1Q 2Q 3Q 4QMar10 Mar11
52 57
34 37
10091
26
1Q 2Q 3Q 4QMar10 Mar11

24
BusinessTechnologies
Optics Other Total
Forex impact -13.6 -1.8 -1.5 -16.8Prince change -13.1 -5.2 0.0 -18.3Sales volume change, and other, net 38.5 6.3 -1.1 43.6Cost down 6.5 1.9 0.3 8.7SG&A change, net -10.3 -1.5 1.7 -10.1
Change, YoY 7.9 -0.3 -0.6 7.0
BusinessTechnologies
Optics Other Total
Forex impact -4.2 -0.5 -0.6 -5.3Prince change -4.2 -1.4 0.0 -5.6Sales volume change, and other, net 8.1 -0.4 0.2 7.8Cost down 0.7 0.6 -0.1 1.3SG&A change, net -4.2 -0.3 0.0 -4.6
Change, YoY -3.8 -2.1 -0.5 -6.4
[Operating income]
[Factors]
[Factors]
[Operating income]
Operating profit analysis
9M/ Mar11 vs. 9M/ Mar10
3Q/ Mar11 vs. 3Q/ Mar10
[Billions of yen]
25
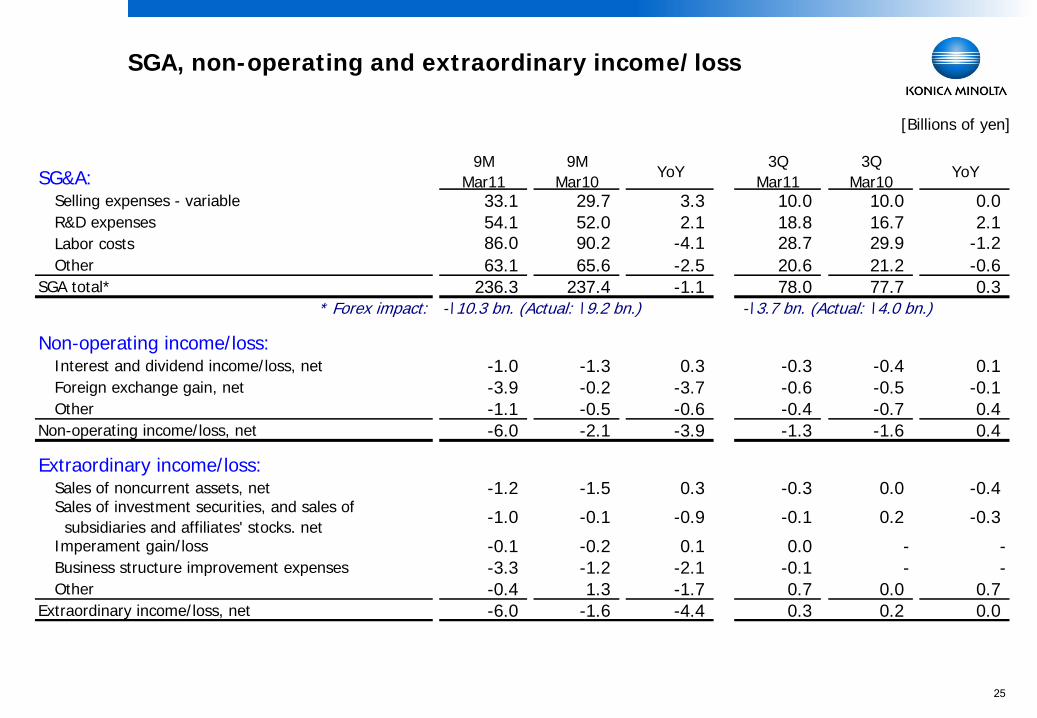
SGA, non-operating and extraordinary income/loss
[Billions of yen]
SG&A:9M
Mar119M
Mar10YoY
3QMar11
3QMar10
YoY
Selling expenses - variable 33.1 29.7 3.3 10.0 10.0 0.0R&D expenses 54.1 52.0 2.1 18.8 16.7 2.1Labor costs 86.0 90.2 -4.1 28.7 29.9 -1.2Other 63.1 65.6 -2.5 20.6 21.2 -0.6
SGA total* 236.3 237.4 -1.1 78.0 77.7 0.3* Forex impact: -\10.3 bn. (Actual: \9.2 bn.) -\3.7 bn. (Actual: \4.0 bn.)
Non-operating income/loss:Interest and dividend income/loss, net -1.0 -1.3 0.3 -0.3 -0.4 0.1Foreign exchange gain, net -3.9 -0.2 -3.7 -0.6 -0.5 -0.1Other -1.1 -0.5 -0.6 -0.4 -0.7 0.4
Non-operating income/loss, net -6.0 -2.1 -3.9 -1.3 -1.6 0.4
Extraordinary income/loss:Sales of noncurrent assets, net -1.2 -1.5 0.3 -0.3 0.0 -0.4Sales of investment securities, and sales of subsidiaries and affiliates' stocks, net -1.0 -0.1 -0.9 -0.1 0.2 -0.3
Imperament gain/loss -0.1 -0.2 0.1 0.0 - -Business structure improvement expenses -3.3 -1.2 -2.1 -0.1 - -Other -0.4 1.3 -1.7 0.7 0.0 0.7
Extraordinary income/loss, net -6.0 -1.6 -4.4 0.3 0.2 0.0

26
B/S[Billions of yen]
Assets: Dec 10 Mar 10 ChangeCash and short-term investment securities 192.5 164.1 28.3Notes and A/R-trade 153.1 177.7 -24.6Inventories 105.4 98.3 7.1Other 54.6 49.1 5.5
Total current assets 505.5 489.3 16.3Tangible assets 193.3 205.1 -11.7Intangible assets 90.1 99.1 -9.0Investments and other assets 68.9 72.4 -3.5Total noncurrent assets 352.4 376.5 -24.1Total assets 857.9 865.8 -7.9
Liabilities and Net Assets:Notes and A/P-trade 75.7 83.1 -7.4Interest bearing debts 223.8 197.4 26.4Other liabilities 150.2 164.5 -14.3
Total liabilities 449.7 445.0 4.7Total shareholders' equity* 406.9 419.5 -12.6Other 1.3 1.2 0.0
Total net assets 408.2 420.8 -12.6Total liabilities and net assets 857.9 865.8 -7.9
[yen]
Dec 10 Mar 10 YoYUS$ 81.49 93.04 △ 11.55Euro 107.90 124.92 △ 17.02

27
419.5 406.9
48.5 47.4
0
100
200
300
400
500
Mar 10 Dec 100
25
50
75
100
Shareholders'equityEquity ratio
223.8197.4
0.470.55
0
100
200
300
Mar 10 Dec 100.0
0.2
0.4
0.6
0.8
1.0
1.2
Debts D/E ratio
98.3 105.4
41
53
0
50
100
150
200
Mar 10 Dec 100
20
40
60
80
100InventoriesTurnover
[¥ billions]
B/S – Main indicators
D/E ratio =
Interest-bearing debts at year-end / Shareholders’ equity at year-end
Inventory turnover (days) =
Inventories at period-end / Average sales per day
Interest-bearing debts Inventories and inventory turnover
Equity ratio
[¥ billions] [Days][Times] [¥ billions][%]
Equity ratio = Equity / Total assets
*Equity = Shareholder’s equity + Total revaluation and translation adjustments

28
9MMar11
9MMar10
YoY3Q
Mar113Q
Mar10YoY
Income before income taxes andminority interests
16.3 17.6 -1.3 4.7 10.6 -6.0
Depreciation and amortization 41.1 46.1 -4.9 13.7 15.2 -1.5
Income taxes paid -6.4 0.4 -6.8 -3.3 -5.8 2.5
Change in working capital -11.6 24.5 -36.0 -7.4 14.4 -21.8
I.Net cash provided byoperating activities
39.5 88.5 -49.0 7.6 34.4 -26.8
II.Net cash used in investingactivities
-33.7 -30.8 -2.9 -14.5 -8.8 -5.7
I.+ II. Free cash flow 5.8 57.7 -52.0 -6.8 25.6 -32.5
Change in debts and bonds 31.0 -26.3 57.4 34.1 -40.0 74.1
Cash dividends paid -7.8 -9.1 1.3 -3.9 -3.8 -0.0
Other -1.1 -1.7 0.5 -0.4 -0.7 0.2
III.Net cash used in financingactivities
22.1 -37.1 59.2 29.8 -44.5 74.3
Cash flows
[Billions of yen]