KONE Q3 · KONE Q3 INTERIM REPORT ... We will launch this new product offering in the Americas in...
20
KONE Q3 INTERIM REPORT FOR JANUARY–SEPTEMBER 2012 Industrial Chic design for commercial buildings. Sophisticated, captivating interiors that reflect, reward, and inspire. Industrial Chic takes its inspiration from the cool sophistication of industrial design to create harmonious interiors that draw the eye in.
Transcript of KONE Q3 · KONE Q3 INTERIM REPORT ... We will launch this new product offering in the Americas in...

KONE Q3INTERIM REPORTFOR JANUARY–SEPTEMbER 2012
Industrial Chic design for commercial buildings.Sophisticated, captivating interiors that reflect, reward, and inspire. Industrial Chic takes its inspiration from the cool sophistication of industrial design to create harmonious interiors that draw the eye in.
2Q3
KONE’s Q3: Continued positivedevelopment and record high cash flow July–September 2012 In July–September 2012, orders received totaled EUR 1,296 (7–9/2011: 1,095) million. Orders received grew by
18.3% at historical exchange rates and by 10.5% at comparable exchange rates.
Net sales grew by 26.0% to EUR 1,634 (1,296) million. At comparable exchange rates the growth was 18.8%.
Operating income was EUR 224.5 (188.9) million or 13.7% (14.6%) of net sales.
Cash flow from operations was EUR 351.9 (240.1) million.
KONE specifies its outlook for 2012. KONE’s net sales is estimated to grow by 13–17% at comparable exchange rates as compared to 2011. The operating income (EbIT), excluding one-time costs, is expected to be in the range of EUR 780–820 million. KONE previously estimated its net sales to grow by 12–17% at comparable exchange rates as compared to 2011. The previous operating income (EbIT) outlook was EUR 760–820 million.
January–September 2012 In January–September 2012, orders received totaled EUR 4,175 (1–9/2011: 3,366) million. Orders received grew
by 24.0% at historical exchange rates and by 17.6% at comparable exchange rates. The order book stood at EUR 5,284 (Dec 31, 2011: 4,348) million at the end of September 2012.
Net sales grew by 21.5% to EUR 4,419 (3,636) million. At comparable exchange rates the growth was 15.9%.
Operating income excluding one-time costs was EUR 565.7 (492.1) million or 12.8% (13.5%) of net sales. The operating income, including the one-time cost of EUR 37.3 million related to the support function development and cost adjustment programs, was EUR 528.4 million.
The board proposes an extra dividend of EUR 1.50 per class b share for the financial year 2011.
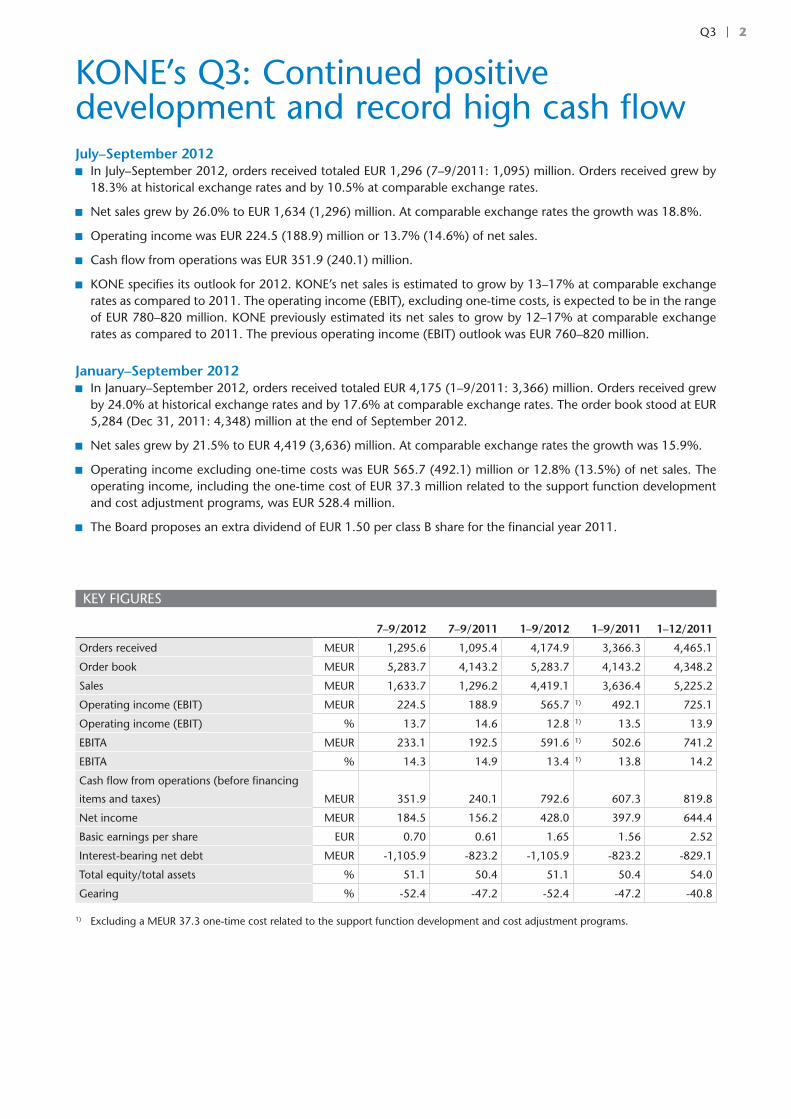
KEY FIgURES
7–9/2012 7–9/2011 1–9/2012 1–9/2011 1–12/2011
Orders received MEUR 1,295.6 1,095.4 4,174.9 3,366.3 4,465.1
Order book MEUR 5,283.7 4,143.2 5,283.7 4,143.2 4,348.2
Sales MEUR 1,633.7 1,296.2 4,419.1 3,636.4 5,225.2
Operating income (EbIT) MEUR 224.5 188.9 565.7 1) 492.1 725.1
Operating income (EbIT) % 13.7 14.6 12.8 1) 13.5 13.9
EbITA MEUR 233.1 192.5 591.6 1) 502.6 741.2
EbITA % 14.3 14.9 13.4 1) 13.8 14.2
Cash flow from operations (before financing
items and taxes) MEUR 351.9 240.1 792.6 607.3 819.8
Net income MEUR 184.5 156.2 428.0 397.9 644.4
basic earnings per share EUR 0.70 0.61 1.65 1.56 2.52
Interest-bearing net debt MEUR -1,105.9 -823.2 -1,105.9 -823.2 -829.1
Total equity/total assets % 51.1 50.4 51.1 50.4 54.0
gearing % -52.4 -47.2 -52.4 -47.2 -40.8
1) Excluding a MEUR 37.3 one-time cost related to the support function development and cost adjustment programs.

3Q3
Matti Alahuhta, President and CEO, in conjunction with the review:
“I am pleased with the continued good development of our business. Orders received growth was 18%, at compa-rable exchange rates 10.5%. Sales growth was 26%, at comparable exchange rates 19%. Operating income grew by 19% to EUR 224.5 million. I am particularly pleased with our record strong cash flow of EUR 352 million, which was the result of the growth in operating income and a strong improvement in net working capital. Our people have continued to do a good job for which I want to thank them.
Our net cash position is strong, and our cash flow has developed very positively. based on this, the KONE board has proposed an extra dividend of EUR 1.50 per b-share for the financial year 2011 to be paid to shareholders.
We announced in June the introduction of our new global volume elevator offering. We have now started selling the new products in the EMEA region and Asia-Pacific. We will launch this new product offering in the Americas in the first half of 2013. The first customer reactions to our new products have been very encouraging. by the end of 2014, this new offering will cover a very significant part of our new elevator and full replacement volumes. We do not expect the new offering to have a significant impact on our sales yet in 2013 as we will increase its volumes gradually.
Construction in most western markets is at a weak level, and also the world’s largest new equipment markets, China and India, are going through a lower growth phase in their cycles. The prolonged weakness in many new equipment markets has led to an adverse impact in the development of the maintenance market in some countries. We have been able to continue the good pricing development in all our businesses, but pricing has become more challenging in the current market environment.
Our approach continues to be to take the difficult market situation as an opportunity. We work all the time actively to understand the markets with better granularity in order to be able to catch growth opportunities. We also work hard to further improve quality and productivity. We will continue to invest a lot in developing our people and keeping up the good spirit. This approach with a positive forward-looking mindset will be very essential, because going forward it is very likely that our business environment will continue to become more challenging as a result of the difficulties and uncertainties in the world economy.”

4Q3
Accounting PrinciplesKONE Corporation’s Interim Report for January–September 2012 has been prepared in line with IAS 34, ‘Interim Financial Reporting’. KONE has applied the same accounting principles in the preparation of this Interim Report as in its Financial State-ments for 2011, published on January 26, 2012. Additionally, the effective changes in IAS/IFRS standards during 2012 have been adopted. These changes have no material impact on the Interim Report. The information presented in this Interim Report has not been audited.
July–September 2012 review
Operating environment in July–September In the third quarter of 2012, the development of the oper-ating environment was largely in line with KONE’s expecta-tions. In new equipment, in the Europe, Middle East and Africa (EMEA) region, the market declined somewhat in Central and North Europe, but remained at a relatively good level. In South Europe, the market declined further from an already weak level. In the Americas region, the gradual recovery continued. The market in Asia-Pacific continued to grow, although at a some-what slower rate than in the first half of the year. The major projects segment remained active, but lead times in decision-making became longer, which impacted the growth. The global modernization market was relatively stable, although with regional variations. Maintenance markets continued to develop favorably in most countries. Price competition intensi-fied further in most markets, particularly in regions where the new equipment market deteriorated.
In the EMEA region, the new equipment market declined somewhat in Central and North Europe. Activity in the residen-tial segment grew slightly, whereas the non-residential segment declined somewhat. The new equipment demand continued to grow in germany, Austria and Switzerland. In great britain, excluding the impact of individual major projects, the market declined. The market in the Netherlands and in Ireland contin-ued to decline. In South Europe, the new equipment demand continued to decline with the most negative development seen in the residential segment. In both Spain and Italy, the new equipment market declined further from an already low level. The market in France also saw a slight decline. growth contin-ued in Turkey and Russia. In the Middle East, the new equip-ment demand remained strong in Saudi Arabia, and continued to show signs of recovery in both Qatar, as well as Dubai in the United Arab Emirates. The modernization market grew slightly in Central and North Europe and continued to decline in South Europe. Maintenance markets continued to develop well in the EMEA region, although with clear variation between countries. Price competition in the maintenance markets has intensified in many countries.
In the Americas region, the gradual recovery of the new equipment demand continued. The recovery in the United States continued to be primarily driven by small and medium-sized projects in the residential and office segments. The infra-structure segment and other publicly funded projects remained at a low level. Vacancy rates in the office segment developed favorably, particularly on the West Coast and in Texas. Follow-ing a prolonged period of decline, market conditions contin-ued to slightly improve also in markets such as Florida and the Midwest. The new equipment market in Canada grew slightly, while remaining stable in Mexico. The modernization activity in the Americas grew slightly. Price competition in the main-
tenance markets intensified, particularly in the non-residential segments.
In the Asia-Pacific region, the new equipment markets con-tinued to grow. In China, all segments grew, albeit at a some-what slower rate than in the first half of the year. The growth in the residential segment in both higher and lower-tier cities continued to be driven by affordable housing and in the inland lower-tier cities also by other residential segments. In large cities, the residential segments other than affordable housing continued to be adversely impacted by Chinese government measures aimed at managing the development of housing prices and overall inflation. The commercial segment contin-ued to grow, supported by increased focus from the developers on non-residential segments as a result of government poli-cies impacting opportunities in the residential segment. Some growth was seen also on the infrastructure segment with metro and airport activity developing favorably, while high-speed railway investments remained stable at a low level. In India, despite the underlying healthy demand, the new equipment market was relatively stable. both in India and Australia, lead times in decision-making became longer due to general eco-nomic uncertainties. In Australia, this led to a significant decline in the new equipment market. The modernization demand in Australia declined slightly. The Southeast Asian markets contin-ued to grow, but the growth was more moderate than earlier. Maintenance markets in Asia-Pacific continued to grow. The pricing environment remained challenging in all markets.
Financial performance in July–September Orders received increased by 18.3% as compared to July–Sep-tember 2011, totaling EUR 1,296 (7–9/2011: 1,095) million. Excluding giantKONE, which was consolidated as a subsidiary as of December 2011, orders received grew by 7.9%. At com-parable exchange rates, KONE’s orders received increased by 10.5%. The positive development in the orders received mar-gin continued.
KONE was able to continue the good pricing development in all businesses in the third quarter of the year, but pricing has become more challenging in the current market environment.
New equipment orders received grew. Modernization orders received declined somewhat. KONE does not include maintenance contracts in orders received.
In Asia-Pacific, the growth in orders received was the stron-gest in Southeast Asia and China. Orders received grew slightly in the EMEA region. They grew clearly in Central and North Europe, while they declined clearly in South Europe. The best development was seen in Austria and Russia. KONE’s order intake decreased clearly in the Americas due to a decline in the United States.
KONE’s largest orders during the third quarter included two orders in great britain, the first to supply 47 elevators to eight new Crossrail stations under construction in central London, and the second to deliver 31 elevators to 5 broadgate, a new office building under construction in the City of London. In Finland, KONE was selected to modernize escalators at a metro station of the Helsinki City Transport. This order also included a five-year maintenance contract. In Sweden, KONE won an order to supply 33 elevators and 40 escalators for the Mall of Scandinavia located near Stockholm. In Singapore, KONE won an order to supply 52 elevators and 21 escalators to South beach, a new mixed use eco-quarter development.
KONE’s net sales grew by 26.0% as compared to July–Sep-tember 2011, totaling EUR 1,634 (7–9/2011: 1,296) million.
Interim Report for January–September 2012

5Q3
KONE’s January–September 2012 review
Net sales growth excluding giantKONE was 17.8%. At compa-rable exchange rates KONE’s net sales growth was 18.8%. Net sales grew in all geographical regions.
New equipment sales accounted for EUR 870.5 (599.4) mil-lion and represented an increase of 45.2% over the comparison period. At comparable exchange rates, new equipment sales grew by 35.0%.
Service (maintenance and modernization) sales grew by 9.5% totaling EUR 763.2 (696.8) million. At comparable exchange rates, this represents an increase of 4.6%. Mainte-nance and modernization sales grew at a rather similar rate.
KONE’s operating income for the July–September 2012 period totaled EUR 224.5 (188.9) million or 13.7% (14.6%) of net sales. The growth in operating income was a result of continued strong new equipment sales growth in China, good development in the maintenance business, as well as a favor-able development in translation exchange rates as compared to the previous year. The growth in operating income contin-ued to be burdened by intangible asset amortizations result-ing from the consolidation of giantKONE as a subsidiary, lower orders received margins in 2010 and 2011, and increased labor costs in Asia. The impact of the amortizations relating to the giantKONE consolidation on relative operating income was 0.3 percentage points. KONE also continued to increase resources and therefore fixed costs in areas that support the growth of the business, in particular in Asia-Pacific and process develop-ment. In addition, the growth of the share of new equipment sales relative to total sales is burdening KONE’s relative operat-ing income in 2012.
Cash flow from operations before financing items and taxes in July–September 2012 was very strong at EUR 351.9 (240.1) million. The primary drivers of the strong cash flow were a significant improvement in net working capital as well as the growth in operating income. The improvement in net working capital was a result of an improvement in the level of advance payments received relative to inventories, a good development in accounts receivable, and an increase in accounts payable and other non interest-bearing liabilities. Net working capital before financing items and taxes reached a very good level at the end of the reporting period.
January–September 2012 review
Orders received and Order book in January–SeptemberDuring January–September 2012, the new equipment market declined somewhat in Central and North Europe but remained at a relatively good level, whereas the market situation in South Europe weakened further from an already low level. The grad-ual recovery of the new equipment market in the Americas continued to progress. The growth of the new equipment mar-ket in Asia-Pacific continued, albeit at a clearly lower rate than
in the previous year. Modernization markets declined slightly. Maintenance markets continued to grow, but the growth rate slowed down in South Europe and the United States. The pric-ing environment was challenging in all businesses, particularly in markets suffering from a prolonged weakness in the new equipment market.
Orders received grew by 24.0% as compared to January–September 2011, and totaled EUR 4,175 (1–9/2011: 3,366) million. Excluding giantKONE, which was consolidated as a subsidiary as of December 2011, orders received growth was 14.0%. At comparable exchange rates, KONE’s orders received grew by 17.6%. The orders received margin developed posi-tively. KONE does not include maintenance contracts in orders received.
The order book grew from the end of 2011 by 21.5% and stood at EUR 5,284 (Dec 31, 2011: 4,348) million at the end of September 2012. At comparable exchange rates, the increase was 19.9%. The margin of the order book declined in 2011, but started to improve during the second quarter of 2012. This development continued in the third quarter of the year.
In the EMEA region, orders received grew slightly as com-pared to January–September 2011. The new equipment order intake growth was the fastest in the Middle East, Russia, Austria, and the Nordic countries. The biggest declines in new equip-ment orders received were seen in Italy, the Netherlands, and Ireland. KONE’s modernization order intake in the EMEA region declined slightly as compared to January–September 2011. The countries with the highest growth in modernization orders received were Austria, belgium and Switzerland. The biggest decline in modernization orders received occurred in germany.
In the Americas, orders received grew somewhat as com-pared to January–September 2011. New equipment orders received grew slightly in the United States and strongly in Canada and Mexico. The modernization order intake declined slightly as the result of a decline in the United States.
In Asia-Pacific, orders received grew very strongly as com-pared to January–September 2011. Orders received grew in China, Southeast Asia, and India, with Southeast Asia and China having the highest growth rates. Orders received declined in Australia due to a significant contraction in the construction market. Modernization orders received declined clearly from a high level in the corresponding period in 2011.
Net salesKONE’s net sales grew by 21.5% as compared to January–Sep-tember 2011, totaling EUR 4,419 (1–9/2011: 3,636) million. Net sales growth excluding giantKONE was 15.0%. At compa-rable exchange rates, KONE’s net sales grew by 15.9%.
New equipment sales accounted for EUR 2,188 (1,628) mil-lion and represented an increase of 34.4% over the comparison period. At comparable exchange rates, new equipment sales grew by 26.4%.
SALES bY gEOgRAPHICAL REgIONS, MEUR
7–9/2012 % 7–9/2011 % 1–9/2012 % 1–9/2011 % 1–12/2011 %
EMEA 1) 767.7 47 697.9 54 2,186.4 49 2,004.5 55 2,893.7 55
Americas 267.7 16 231.6 18 706.3 16 661.4 18 947.3 18
Asia-Pacific 598.3 37 366.7 28 1,526.4 35 970.5 27 1,384.2 27
Total 1,633.7 1,296.2 4,419.1 3,636.4 5,225.2
1) EMEA = Europe, Middle East, Africa

6Q3
Service (maintenance and modernization) sales increased by 11.1%, totaling EUR 2,231 (2,009) million. At comparable exchange rates, this represents an increase of 7.2%. both main-tenance and modernization sales grew at a good rate.
The shares of new equipment and service sales of total sales were equal at 50%.
Sales in the EMEA region showed clear growth as compared to January–September 2011. Sales grew in all businesses.
Sales in the Americas declined slightly in local currencies as compared to January–September 2011. New equipment sales decreased due to the weak new equipment order intake in 2010. In the American market, the time lag from order to delivery is longer than in other markets. Maintenance sales grew somewhat, while modernization sales remained stable.
Sales in Asia-Pacific grew very strongly as compared to Janu-ary–September 2011. New equipment and maintenance sales grew, while modernization sales declined.
The geographical distribution of net sales was 49% (55%) EMEA, 16% (18%) Americas and 35% (27%) Asia-Pacific.
Financial resultKONE’s operating income (EbIT) excluding one-time costs grew, reaching EUR 565.7 (1–9/2011: 492.1) million or 12.8% (13.5%) of net sales. The operating income, including the one-time cost of EUR 37.3 million related to the support function development and cost adjustment programs, was EUR 528.4 million. The growth in operating income was a result of con-tinued strong new equipment sales growth in Asia-Pacific, par-ticularly in China, good sales growth in the service business, as well as a favorable development in translation exchange rates as compared to the previous year. The growth in operating income was burdened by intangible asset amortizations result-ing from the consolidation of giantKONE as a subsidiary, lower orders received margins in 2010 and 2011, increased labor costs in Asia, and during the first half of the year also higher raw material costs. The impact of the amortizations relating to the consolidation of giantKONE on the relative operating income was 0.3 percentage points. KONE also continued to increase resources and therefore fixed costs in areas that sup-port the growth of the business, in particular in Asia-Pacific and process development. In addition, the growth of the share of new equipment sales relative to total sales burdens KONE’s relative operating income in 2012. Net financing items was EUR 24.3 (17.6) million.
KONE’s income before taxes was EUR 556.1 (517.2) million. Taxes totaled EUR 128.1 (119.3) million, taking into account taxes proportionate to the amount estimated for the financial year. The estimated effective tax rate for the full financial year is 23.5%. Net income for the period under review was EUR 428.0 (397.9) million.
Earnings per share was EUR 1.65 (1.56). Equity per share was EUR 8.17 (6.84).
During the reporting period, KONE announced the initia-tion of two programs targeting increased competitiveness, and started the implementation of the programs. The first of the programs targets improved quality and productivity of KONE’s support functions, and the second program an adjustment in resourcing in such countries, where the market has declined more permanently to a weak level. The programs are planned to be fully implemented by the end of 2013. They are expected to deliver approximately EUR 35 million annualized cost sav-ings, for which a corresponding run rate will be achieved by the end of 2013. The total one-time cost relating to the pro-
grams, EUR 37.3 million, was booked in the second quarter of 2012. Almost all of the cost was recognized as a restructur-ing provision in the second quarter. The programs progressed according to the plans during the third quarter of the year.
Consolidated statement of financial position and cash flowKONE’s financial position was very strong and the company had a strongly positive net cash position at the end of September 2012. Cash flow from operations before financing items and taxes in January–September 2012 was EUR 792.6 (1–9/2011: 607.3) million. Net working capital before financing items and taxes improved significantly. The primary reasons for the good cash flow were the growth in operating income, a good level of advance payments received relative to inventories, an improved rotation of accounts receivable and an increase in accounts payable. At the end of September 2012, net working capital was EUR -592.6 (December 31, 2011: -361.4) million, including financing items and taxes.
Interest-bearing assets exceeded interest-bearing debts and the net cash position totaled EUR 1,106 (December 31, 2011: 829.1) million. gearing was -52.4%, compared with -40.8% at the end of 2011. KONE’s total equity/total assets ratio was 51.1% (December 31, 2011: 54.0%) at the end of September.
Proposal for an extra dividend for the financial year 2011 In September 2012 KONE’s board of Directors made a proposal for an extra dividend for the financial year 2011 and issued a notice to an Extraordinary general Meeting to be held in Hel-sinki, Finland on October 24, 2012. The proposal for the extra dividend is EUR 1.495 to be paid for each class A share, and EUR 1.50 to be paid for each class b share. The date of record for the dividend distribution is proposed to be October 29, 2012 and the dividend is proposed to be paid on November 5, 2012.
The proposal for the extra dividend was supported by a very strong net cash and liquidity position. KONE’s capital structure would remain strong also after the payment of the extra divi-dend.
Capital expenditure and acquisitionsKONE’s capital expenditure, including acquisitions, totaled EUR 97.9 (1–9/2011: 92.5) million. Capital expenditure, excluding acquisitions, was mainly related to facilities and equipment in production, R&D and IT. Acquisitions accounted for EUR 25.5 (57.0) million of this figure.
In July 2010 KONE announced that it intended to relocate and expand its manufacturing and R&D unit in Kunshan, China. Construction has progressed well and is completed in phases during 2012 and 2013. Production was moved to the new facilities during the second and third quarters of 2012. The investments related to the production facilities were reported as capital expenditure during the second quarter of 2012. The remaining facilities including the office building and R&D units will be completed in phases during the last quarter of 2012 and during 2013. KONE was awarded a relocation grant from the city of Kunshan, the majority of which has already been received. This grant reduced the net investment in the first half of 2012.
During January–September 2012, KONE acquired the busi-ness of Eagle Elevator Corporation, an independent elevator service company in Minnesota, USA. In addition, KONE com-
KONE’s January–September 2012 review

7Q3
pleted a number of small acquisitions of European maintenance companies during the reporting period. The acquisitions com-pleted during the reporting period do not individually or as a whole have a material impact on the result or financial position of KONE.
Research and development Research and development expenses totaled EUR 62.7 (1–9/2011: 59.0) million, representing 1.4% (1.6%) of net sales. R&D expenses include the development of new prod-uct and service concepts as well as the further development of existing solutions and services. KONE’s elevators and escalators are based on industry-leading energy efficient technology.
KONE’s customers and end users are at the center of its research and development efforts. In accordance with its vision of delivering the best People Flow™ experience, KONE focuses on understanding the needs of its customers and the users of its solutions in order to make people flow in buildings smoother and improve the user experience. One of KONE’s five devel-opment programs, Innovative Solutions for People Flow, aims to develop innovative products for an increasingly urbanizing world with a focus on eco-efficiency, ride comfort, and visual design.
In September 2012 the business magazine Forbes again listed KONE among the 50 most innovative companies in the world.
In June 2012 KONE announced the introduction of a new innovative volume elevator offering. This new offering will comprise a significant part of KONE’s new equipment deliver-ies globally and is eventually expected to cover 60% of KONE’s new equipment volume and 90% of its full replacement vol-ume in modernization. During the reporting period, the selling of the new offering started in the EMEA region and Asia-Pacific. The new offering will be launched in the Americas in the first half of 2013. The new offering will further improve KONE’s product competitiveness from the already high current level. The most important improvements are in the area of eco-effi-ciency, ride comfort, visual design, as well as space efficiency. The new offering includes the machine room-less KONE Mono-Space® for the global markets, and the KONE N MiniSpace™ with a small machine room for the Asian markets.
The new elevators are up to 35% more energy efficient com-pared to the already high levels of energy efficiency of KONE’s present product range. The continued significant improvement in energy efficiency of the new product offering is delivered by the completely renewed KONE EcoDisc® hoisting machine, an efficient drive, as well as enhanced standby solutions.
In addition, a systematic and holistic redesign effort has enabled KONE to introduce a new level of ride comfort to its volume range elevators. This has been achieved through signif-icant improvements in multiple areas that impact elevator ride comfort, including a new motor control system, a new braking system, a new hoisting machine and system, and an improved car structure. A comprehensive test of the elevator’s ride perfor-mance, which will be carried out on every KONE elevator prior to handover, is a further significant improvement to the instal-lation process, contributing to enhanced ride comfort.
The new offering also features completely new designs for KONE’s elevator interior elements, including a new expanded KONE Design Collection, which offers both a selection of pre-designed car interiors, as well as a wide selection of separate patterns, materials and elements to combine in the elevator interior. The availability of a wide range of designs enables
KONE’s customers to choose elevator interiors that fit seam-lessly with the design of their building. KONE continues to differentiate itself through visually appealing product design, which was also noted by the design industry in the form of design awards during the reporting period.
The improved space efficiency of the new offering expands KONE’s addressable market in modernization, as the new eleva-tors can be installed in smaller shafts compared to previous models. This is expected to significantly improve the compe-tiveness of KONE’s modernization solutions.
KONE also launched Direct Drive, an innovative and energy-efficient escalator drive system designed for escalators and autowalks for the infrastructure and commercial segments during the reporting period. The new solution contributes to the reduction of the energy consumption of a typical escalator configuration by 19% from the 2010 base value.
Changes in the Executive BoardIn May 2012 KONE announced changes in the KONE Executive board and organization. KONE’s management structure for its geographical areas changed as of July 1, 2012. This change was made to reflect the rapid growth of the elevator and esca-lator market in Asia-Pacific, in particular in China. Following the change, KONE’s business in China was separated from the Asia-Pacific area. The new greater China area comprises of Mainland China, Hong Kong and Taiwan. William b. Johnson, country manager for China since 2004, was appointed Execu-tive Vice President, greater China and member of the Executive board. He reports to Matti Alahuhta, President and CEO. In the new structure, KONE Middle East is part of the new Asia-Pacific and Middle East area. Noud Veeger continues to lead the area, now as Executive Vice President, Asia-Pacific and Middle East.
Juho Malmberg, Executive Vice President, Customer Expe-rience left KONE as of June 30, 2012. In addition to his cur-rent role, Ari Lehtoranta, Executive Vice President, Central and North Europe assumed responsibility for the Customer Experi-ence development program, one of KONE’s five key develop-ment programs.
In June 2012 KONE announced the appointment of Larry g. Wash as Executive Vice President, Americas as of July 23, 2012, following Vance Tang, who decided to leave KONE. Larry Wash is a member of the Executive board and reports to Matti Alahuhta, President and CEO.
PersonnelThe objective of KONE’s personnel strategy is to support the company in meeting its business targets. The main goals of this strategy are to further secure the availability, engagement, motivation and continuous development of its employees. All of KONE’s activities are guided by ethical principles. The per-sonnel’s rights and responsibilities include the right to a safe and healthy working environment, personal well-being as well as the prohibition of discrimination of any kind.
KONE defined Employee Engagement as one of its five development programs at the beginning of 2011 and launched an action plan focusing on the further development of lead-ership capabilities, on providing growth and development opportunities for KONE employees, and on ensuring well-being and safety at work.
During the reporting period, KONE completed its annual leadership and talent review process and held a global Safety week, the central theme of which was “little things matter in safety”. KONE’s seventh annual employee survey was con-
KONE’s January–September 2012 review

8Q3
ducted with an all-time high response rate, the results were communicated to all employees and action plans were made. The implementation and follow-up of the action plans was also started. The delivery of learning programs such as the Super-visor Development Program and KONE Leader continued as planned.
KONE had 38,902 (December 31, 2011: 37,542) employees at the end of September 2012. The average number of employ-ees was 38,164 (1–9/2011: 34,386).
The geographical distribution of KONE employees was 48% (December 31, 2011: 50%) in EMEA, 14% (14%) in the Ameri-cas and 38% (36%) in Asia-Pacific.
Environment KONE’s aim is to be the industry leader in eco-efficiency. The focus in the development of eco-efficient solutions is on fur-ther improving energy-saving stand-by and hoisting solutions for elevators. The most significant environmental impact of KONE’s business globally relates to the amount of electricity used by KONE equipment over their lifetime. This underlines the importance of continuing to develop and improve energy-efficient innovations for elevators and escalators. The most significant impact on KONE’s carbon footprint from its own operations relates to the company’s logistics operations, vehicle fleet, and electricity consumption.
During January–September 2012, KONE continued to work on further decreasing the energy consumption of its elevators and further increasing energy efficient references globally, for example by installing elevators in net zero energy buildings. During the reporting period, KONE announced the launch of a new global volume elevator offering that is up to 35% more energy-efficient compared to levels of energy-efficiency achieved in 2010 for previous models.
In May 2012, KONE published its Corporate Responsibility Report 2011, which follows the b application level of the global Reporting Initiative guidelines. The reported greenhouse gas emissions for 2011 have been assured by an objective third party. KONE has identified new environmental targets to fur-ther improve the energy efficiency of the next generation KONE elevators and escalators. The other ambitious targets in the Environmental Excellence program for 2011–2013 focus on reducing greenhouse gas emissions from KONE’s operations. KONE also continues to focus on the environmental aspects of its supply chain network.
During the second and third quarters of 2012, KONE’s man-ufacturing unit in Kunshan, China, relocated to new facilities that have been designed and constructed according to modern green building standards. The operations are now running in the new, eco-efficient facilities. The manufacturing processes in the new facilities are highly efficient, with emphasis on further reducing energy consumption and carbon emissions.
Other eventsIn March 2010 KONE announced that certain municipalities, public authorities and companies in Austria had filed civil dam-age claims against leading elevator and escalator companies, including KONE’s Austrian subsidiary KONE Ag. The claims relate to the 2007 decision of the Austrian Cartel Court con-cerning practices prior to mid-2004. Some further claims have been served since the announcement. All claims are indepen-dent and are progressing procedurally at different stages, with some processes having ended favorably for KONE. The total amount claimed jointly and severally from all of the defendants
together was EUR 169 million at the end of September 2012. KONE’s position is that the claims are without merit. No provi-sion has been made.
In January 2011 KONE announced that certain companies and public entities had filed civil damage claims against KONE’s german subsidiary KONE gmbH and certain other elevator and escalator companies operating in germany. The claims relate to activities in the german market and are a result of the decision by the European Commission in 2007 on the respective com-panies concerning alleged anticompetitive practices in the local markets prior to early 2004. Some further claims have been served since the announcement. All claims are independent and are progressing procedurally at different stages. The total amount claimed jointly and severally from all of the defendants together was EUR 78 million at the end of September 2012. KONE’s position is that the claims are without merit. No provi-sion has been made.
Risk managementKONE is exposed to risks that may arise from its operations or changes in the business environment. The risk factors described below can potentially have an adverse effect on KONE’s busi-ness operations and financial position, and hence the value of the company. Other risks, which are currently either unknown or considered immaterial to KONE may, however, become material in the future.
A significant weakening of the global new equipment mar-kets, in China in particular, could result in a decrease in orders received, cancellations of agreed deliveries, delays in the com-mencement of projects, further intensified price competition, and, as a result, a negative effect on KONE’s profitability.
The continued uncertain global economic environment also exposes KONE to counterparty risks in respect of financial institutions and customers. Exposure to the counterparty risks related to financial institutions arises through the significant amounts of liquid funds deposited into financial institutions in Europe and China. In order to diversify the financial credit risk KONE deposits its funds into several banks and invests a part of its liquidity into highly liquid money market funds. KONE also manages its counterparty risk by accepting only counterparties with high creditworthiness. The size of each counterparty limit reflects the creditworthiness of the counterparty and KONE constantly evaluates such limits.
KONE is also exposed to risks related to the liquidity and payment schedules of its customers, which may lead to credit losses. To mitigate this risk, defined rules for tendering, levels of approval authority, and credit control have been established. The risks related to accounts receivable are minimized also through the use of advance payments, documentary credits and guarantees in KONE’s payment terms. KONE’s customer base consists of a large number of customers in several mar-ket areas, with no individual customer representing a material share of KONE’s sales.
KONE operates internationally and is thus exposed to risks arising from foreign exchange rate fluctuations related to cur-rency flows from revenues and expenses, as well as from the translation of income statement and statement of financial posi-tion items of foreign subsidiaries into euros. The KONE Treasury is responsible for the centralized management of financial risks in accordance with the KONE Treasury Policy approved by the board of Directors. For further information regarding financial risks, please refer to note 2 in the consolidated Financial State-ments.
KONE’s January–September 2012 review

9Q3
KONE’s business activities are dependent on the uninter-rupted operation, quality and reliability of sourcing channels, production plants, logistics processes, and IT systems. A signifi-cant part of KONE’s component suppliers and supply capacity is located in China. The risks related to the supply chain are controlled by analyzing and improving the fault tolerance of processes, accurate forecasting, close cooperation with KONE’s suppliers and by increasing the readiness for transferring the manufacturing of critical components from one production line or supplier to another. KONE actively monitors the operations and financial strength of its key suppliers. The aim is also to secure the availability of alternative sourcing channels for criti-cal components and services. Additionally, KONE has a global property damage and business interruption insurance program in place.
Changes in raw material and component prices are reflected directly in the production costs of elevators, escalators and automatic doors. The increases in raw material and compo-nent prices have had and may continue to have a negative impact on KONE’s profitability. In order to reduce the impact of material and sourcing price fluctuation KONE aims to enter into fixed-price contracts with its major suppliers for a part of its raw material and component purchases. because the maintenance business deploys a significant fleet of service vehicles, fuel price fluctuations have an effect on maintenance costs.
KONE operates in certain markets with high growth rates, where there are challenges in terms of the availability of skilled technicians. This can lead to delays in deliveries and increases in costs, which in turn can have an adverse impact on the profit-ability of the company. KONE manages this risk through proac-tive project and resource planning in order to ensure that the necessary resources are available.
A significant part of KONE’s sales consists of services that are less susceptible to the effects of economic cycles, but which are very labor-intensive. KONE’s profit development could be adversely affected if its productivity improvement targets were not met, in particular if salaries and costs increased more than KONE would be able to increase its prices or if it were not pos-sible to adapt the company’s resources in response to changing business opportunities and environments. These risks are man-aged through proactive planning and forecasting processes, the constant development of pricing processes and productiv-ity as well as through the outsourcing of certain activities.
Decisions of the Annual General MeetingKONE Corporation’s Annual general Meeting was held in Hel-sinki on March 5, 2012. The meeting approved the financial statements and discharged the responsible parties from liability for the January 1–December 31, 2011 financial period.
The general Meeting approved the amendment of para-graphs 4 and 8 of the Articles of Association concerning the number of the members of the board of Directors and the pub-lishing of the summons to the Shareholders’ general Meeting, respectively.
The number of Members of the board of Directors was con-firmed as nine. Re-elected as Members of the board were Matti Alahuhta, Anne brunila, Reino Hanhinen, Antti Herlin, Sirkka Hämäläinen-Lindfors, Juhani Kaskeala and Sirpa Pietikäinen and as new Members of the board were elected Shinichiro Akiba and Jussi Herlin.
At its meeting, held after the general Meeting, the board of Directors elected from among its members Antti Herlin as its Chair and Sirkka Hämäläinen-Lindfors as Vice Chair.
Antti Herlin was elected as Chairman and Sirkka Hämäläinen- Lindfors, Anne brunila and Jussi Herlin as members of the Audit Committee. Sirkka Hämäläinen-Lindfors and Anne brunila are independent of both the company and of significant share-holders.
Antti Herlin was elected as Chairman and Reino Hanhinen, Juhani Kaskeala and Jussi Herlin as members of the Nomination and Compensation Committee. Reino Hanhinen and Juhani Kaskeala are independent of both the company and of signifi-cant shareholders.
The general Meeting confirmed an annual compensation of EUR 54,000 for the Chairman of the board, EUR 44,000 for the Vice Chairman, and EUR 33,000 for board Members. In addi-tion, a compensation of EUR 500 was approved for attendance at board and Committee meetings.
The general Meeting approved the authorization for the board of Directors to repurchase KONE’s own shares. Alto-gether no more than 25,570,000 shares may be repurchased, of which no more than 3,810,000 may be class A shares and 21,760,000 class b shares. The minimum and maximum con-sideration for the shares to be purchased is determined for both class A and class b shares on the basis of the trading price for class b shares determined on the NASDAQ OMX Helsinki Ltd. at the time of purchase. The authorization shall remain in effect for a period of one year from the date of decision of the gen-eral Meeting.
Authorized public accountants Heikki Lassila and Pricewater-houseCoopers Oy were re-nominated as the company´s audi-tors.
The Annual general Meeting approved the board’s proposal for dividends of EUR 1.395 for each of the 38,104,356 class A shares and EUR 1.40 for the 216,635,414 outstanding class b shares. The date of record for dividend distribution was March 8, 2012, and the dividends were paid on March 15, 2012.
Share capital and market capitalizationIn 2007, KONE granted a conditional option program. The 2007 stock options were listed on the NASDAQ OMX Helsinki Ltd. as of April 1, 2010. Each option right entitled its owner to subscribe for two (2) existing class b shares held by the company at a price of, from March 6, 2012, EUR 20.545 per share. As the subscription period expired on April 30, 2012, the 888,000 KONE 2007 option rights held by KONE Capital Oy, a subsidiary of KONE Corporation, and otherwise unused 2,520 option rights expired. The remaining 1,109,480 options had been excercised.
The 2010 Annual general Meeting authorized the board of Directors to decide on the issuance of options and other spe-cial rights entitling to shares. The authorization is limited to a maximum of 3,810,000 class A shares and 21,760,000 class b shares. The authorization concerns both the issuance of new shares and the transfer of treasury shares, and the issuance of shares and of special rights entitling to shares may be carried out in deviation from the shareholders’ pre-emptive rights. The authorization will remain in effect for a period of five years from the date of the decision of the general Meeting.
In 2010, KONE granted a conditional option program to approximately 430 key employees, under which a maximum total of 3,000,000 options can be granted. Each option entitles its holder to subscribe for one (1) new or existing class b KONE share held by the company. The share subscription period for the 2010 stock options will be April 1, 2013–April 30, 2015. The share subscription period begins only if the financial per-
KONE’s January–September 2012 review

10Q3
formance of the KONE group for the financial years 2010–2012 is equal to or better than the average performance of KONE’s key competitors, based on the total consideration of the board of Directors. If the above-mentioned prerequisite is not fulfilled, the stock options will expire based on the consideration and in the extent and manner decided by the board of Directors and the terms of the stock options.
On September 30, 2012, KONE’s share capital was EUR 65,134,030.00, comprising 222,431,764 listed class b shares and 38,104,356 unlisted class A shares.
KONE’s market capitalization was EUR 13,806 million on September 30, 2012, disregarding shares in KONE’s posses-sion. Market capitalization is calculated on the basis of both the listed class b shares and the unlisted class A shares excluding treasury shares. Class A shares are valued at the closing price of the class b shares at the end of the reporting period.
Shares in KONE’s possessionOn the basis of the Annual general Meeting’s authorization, the board of Directors decided to commence the possible repurchasing of shares on March 13, 2012 at the earliest.
During January–September 2012, KONE used its previous authorization to repurchase its own shares in February, and bought back in total 834,174 of its own class b shares. In April 2012 KONE assigned 208,295 of its own class b shares to a share-based incentive plan. In addition, in April, 1,445,616 class b shares owned by KONE were subscribed with the 2007 option rights. In June and August, a total of 17,900 class b shares were returned free of consideration to KONE by virtue of the terms of KONE’s share-based incentive program for the years 2010–2012. At the end of September 2012, KONE had 4,160,339 class b shares in its possession. The shares in the KONE’s possession represent 1.9% of the total number of class b shares, which corresponds to 0.7% of the total voting rights.
Shares traded on the NASDAQ OMX Helsinki Ltd.The NASDAQ OMX Helsinki Ltd. traded 89.4 million KONE Corporation class b shares in January–September 2012, equiv-alent to a turnover of EUR 4,074 million. The daily average trading volume was 473,251 shares (1–9/2011: 622,287). The share price on September 30, 2012 was EUR 53.85. The vol-ume weighted average share price during the period was EUR 45.58. The highest quotation during the period under review was EUR 54.95 and the lowest EUR 39.19. In addition to the NASDAQ OMX Helsinki Stock Exchange, KONE’s class b share is also traded also various alternative trading platforms. The volume of KONE’s class b shares traded on the NASDAQ OMX Helsinki Stock Exchange represented approximately 42% of the total volume of KONE’s class b shares traded in January–September 2012 (source: Fidessa Fragmentation Index, www.fragmentation.fidessa.com).
The number of registered shareholders was 30,402 at the beginning of the review period and 30,736 at its end. The number of private households holding shares totaled 28,214 at the end of the period, which corresponds to approximately 13% of the total number of listed class b shares.
According to the nominee registers, 46.2% of the listed class b shares were owned by foreign shareholders on Septem-ber 30, 2012. Other foreign ownership at the end of the period totaled 6.5%. Thus, a total of 52.7% of KONE’s listed class b shares were owned by international investors, corresponding to approximately 19% of the total votes in the company.
KONE’s January–September 2012 review
Flagging notifications On June 28, 2012, KONE Corporation was informed by Capital Research and Management Company pursuant to the Securi-ties Markets Act, chapter 2, section 9, that its holding in KONE Corporation had exceeded 5% of the share capital. The date of change in the holdings was June 26, 2012. On September 7, 2012, KONE Corporation was informed by the Capital group Companies, Inc. that following a corporate re-organization, effective as of September 1, 2012, Capital Research and Man-agement Company and Capital group International Inc. would report relevant holdings in aggregate under the group’s par-ent company, The Capital group Companies, Inc. The Capi-tal group Companies’ holding in KONE was above 5% of the share capital on September 3, 2012.
Market outlook In new equipment, the markets in Asia-Pacific are expected to grow slightly in the last quarter of the year. The markets in Cen-tral and North Europe are expected to decline somewhat, and the markets in South Europe are expected to further decline from an already weak level. The market in North America is expected to continue to gradually recover from a low level. The modernization markets are expected to be stable or decline slightly in the last quarter of the year. The maintenance mar-kets are expected to continue to develop rather well in most countries.
Business outlook 2012KONE specifies its outlook for 2012.
KONE’s net sales is estimated to grow by 13–17% at com-parable exchange rates as compared to 2011.
The operating income (EbIT), excluding one-time costs, is expected to be in the range of EUR 780–820 million.
Previous business outlook 2012KONE’s net sales is estimated to grow by 12–17% at comparable exchange rates as compared to 2011.
The operating income (EBIT), excluding one-time costs, is expected to be in the range of EUR 760–820 million.
Helsinki, October 23, 2012KONE Corporation’s board of Directors

11Q3
MEUR 7–9/2012 % 7–9/2011 % 1–9/2012 % 1–9/2011 % 1–12/2011 %
Sales 1,633.7 1,296.2 4,419.1 3,636.4 5,225.2Costs and expenses -1,386.9 -1,091.4 -3,788.1 -3,096.7 -4,434.2Depreciation and amortization -22.3 -15.9 -65.3 -47.6 -65.9One-time cost - - -37.3 - -
Operating income 224.5 13.7 188.9 14.6 528.4 12.0 492.1 13.5 725.1 13.9Share of associated companies' net income 1.0 3.2 3.4 7.5 73.3Financing income 14.8 14.1 30.2 22.3 26.4Financing expenses -0.9 -1.0 -5.9 -4.7 -8.2
Income before taxes 239.4 14.7 205.2 15.8 556.1 12.6 517.2 14.2 816.6 15.6Taxes -54.9 -49.0 -128.1 -119.3 -172.2
Net income 184.5 11.3 156.2 12.1 428.0 9.7 397.9 10.9 644.4 12.3
Net income attributable to:Shareholders of the parent company 180.6 156.0 421.2 397.3 643.6Non-controlling interests 3.9 0.2 6.8 0.6 0.8
Total 184.5 156.2 428.0 397.9 644.4
Earnings per share for profit attributable to the shareholders of the parent company, EUR
basic earnings per share, EUR 0.70 0.61 1.65 1.56 2.52Diluted earnings per share, EUR 0.70 0.61 1.64 1.55 2.51
Consolidated statement of comprehensive income
MEUR 7–9/2012 % 7–9/2011 % 1–9/2012 % 1–9/2011 % 1–12/2011 %
Net income 184.5 156.2 428.0 397.9 644.4
Other comprehensive income, net of tax:
Translation differences -14.2 32.2 8.8 -6.8 29.0Hedging of foreign subsidiaries 4.3 3.8 -0.5 5.3 -2.3Cash flow hedges 0.4 -0.7 -5.0 5.4 -1.6
Other comprehensive income, net of tax -9.5 35.3 3.3 3.9 25.1
Total comprehensive income 175.0 191.5 431.3 401.8 669.5
Total comprehensive income attributable to:
Shareholders of the parent company 171.1 191.3 424.5 401.2 668.7Non-controlling interests 3.9 0.2 6.8 0.6 0.8
Total 175.0 191.5 431.3 401.8 669.5
Consolidated statement of income

12Q3
Condensed consolidated statement of financial position
Assets MEUR Sep 30, 2012 Sep 30, 2011 Dec 31, 2011
Non-current assets
Intangible assets 1,176.4 899.8 1,165.3
Tangible assets 246.3 210.7 231.6
Loans receivable and other interest-bearing assets 5.5 7.7 5.5
Deferred tax assets 185.5 179.2 178.3
Investments 172.9 181.7 169.4
Total non-current assets 1,786.6 1,479.1 1,750.1
Current assets
Inventories 1,087.1 874.0 794.7
Accounts receivable and other non interest-bearing assets 1,379.2 1,232.4 1,262.1
Current deposits and loan receivables 1,010.3 705.3 686.3
Cash and cash equivalents 185.7 147.5 234.0
Total current assets 3,662.3 2,959.2 2,977.1
Total assets 5,448.9 4,438.3 4,727.2
Equity and liabilities MEUR Sep 30, 2012 Sep 30, 2011 Dec 31, 2011
Equity 2,108.9 1,745.8 2,034.0
Non-current liabilities
Loans 22.6 23.2 21.1
Deferred tax liabilities 74.6 58.5 81.6
Employee benefits 105.3 108.9 105.2
Total non-current liabilities 202.5 190.6 207.9
Provisions 120.6 86.0 88.7
Current liabilities
Loans 73.0 14.1 75.6
Advance payments received 1,323.7 977.7 962.1
Accounts payable and other liabilities 1,620.2 1,424.1 1,358.9
Total current liabilities 3,016.9 2,415.9 2,396.6
Total equity and liabilities 5,448.9 4,438.3 4,727.2
13Q3
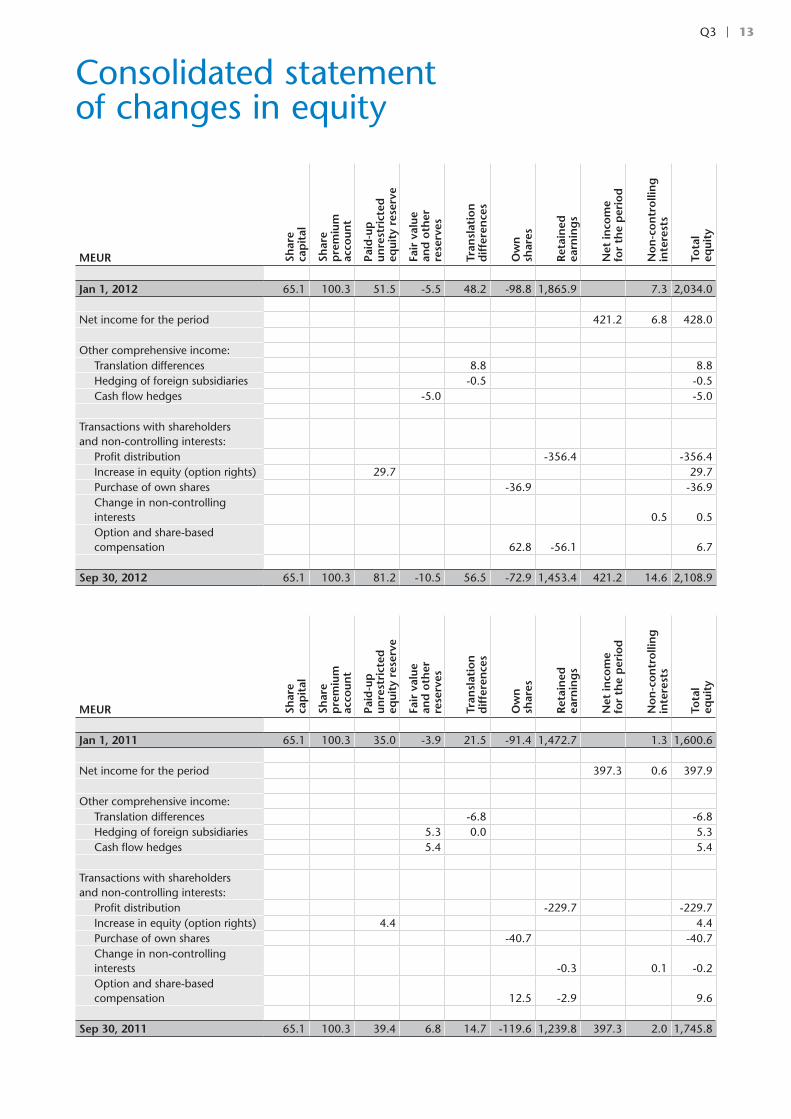
Consolidated statement of changes in equity
MEUR Shar
e ca
pit
al
Shar
e
pre
miu
m
acco
unt
Paid
-up
un
rest
rict
ed
equi
ty r
eser
ve
Fair
val
ue
and
oth
er
rese
rves
Tran
slat
ion
d
iffe
ren
ces
Ow
n
shar
es
Ret
ain
ed
earn
ing
s
Net
inco
me
fo
r th
e p
erio
d
No
n-c
on
tro
llin
g
inte
rest
s
Tota
l eq
uity
Jan 1, 2012 65.1 100.3 51.5 -5.5 48.2 -98.8 1,865.9 7.3 2,034.0
Net income for the period 421.2 6.8 428.0
Other comprehensive income:Translation differences 8.8 8.8Hedging of foreign subsidiaries -0.5 -0.5Cash flow hedges -5.0 -5.0
Transactions with shareholders and non-controlling interests:
Profit distribution -356.4 -356.4Increase in equity (option rights) 29.7 29.7Purchase of own shares -36.9 -36.9Change in non-controlling interests 0.5 0.5Option and share-based compensation 62.8 -56.1 6.7
Sep 30, 2012 65.1 100.3 81.2 -10.5 56.5 -72.9 1,453.4 421.2 14.6 2,108.9
MEUR Shar
e ca
pit
al
Shar
e
pre
miu
m
acco
unt
Paid
-up
un
rest
rict
ed
equi
ty r
eser
ve
Fair
val
ue
and
oth
er
rese
rves
Tran
slat
ion
d
iffe
ren
ces
Ow
n
shar
es
Ret
ain
ed
earn
ing
s
Net
inco
me
fo
r th
e p
erio
d
No
n-c
on
tro
llin
g
inte
rest
s
Tota
l eq
uity
Jan 1, 2011 65.1 100.3 35.0 -3.9 21.5 -91.4 1,472.7 1.3 1,600.6
Net income for the period 397.3 0.6 397.9
Other comprehensive income:Translation differences -6.8 -6.8Hedging of foreign subsidiaries 5.3 0.0 5.3Cash flow hedges 5.4 5.4
Transactions with shareholders and non-controlling interests:
Profit distribution -229.7 -229.7Increase in equity (option rights) 4.4 4.4Purchase of own shares -40.7 -40.7Change in non-controlling interests -0.3 0.1 -0.2Option and share-based compensation 12.5 -2.9 9.6
Sep 30, 2011 65.1 100.3 39.4 6.8 14.7 -119.6 1,239.8 397.3 2.0 1,745.8

14Q3
Consolidated statement of changes in equity
MEUR Shar
e ca
pit
al
Shar
e
pre
miu
m
acco
unt
Paid
-up
un
rest
rict
ed
equi
ty r
eser
ve
Fair
val
ue
and
oth
er
rese
rves
Tran
slat
ion
d
iffe
ren
ces
Ow
n
shar
es
Ret
ain
ed
earn
ing
s
Net
inco
me
fo
r th
e p
erio
d
No
n-c
on
tro
llin
g
inte
rest
s
Tota
l eq
uity
Jan 1, 2011 65.1 100.3 35.0 -3.9 21.5 -91.4 1,472.7 1.3 1,600.6
Net income for the period 643.6 0.8 644.4
Other comprehensive income:Translation differences 29.0 29.0Hedging of foreign subsidiaries -2.3 -2.3Cash flow hedges -1.6 -1.6
Transactions with shareholders and non-controlling interests:
Profit distribution -229.7 -229.7Increase in equity (option rights) 16.5 16.5Purchase of own shares -40.7 -40.7Change in non-controlling interests -0.3 5.2 4.9Option and share-based compensation 33.3 -20.4 12.9
Dec 31, 2011 65.1 100.3 51.5 -5.5 48.2 -98.8 1,222.3 643.6 7.3 2,034.0

15Q3
MEUR 7–9/2012 7–9/2011 1–9/2012 1–9/2011 1–12/2011
Operating income 224.5 188.9 528.4 492.1 725.1
Change in working capital before
financing items and taxes 105.1 35.3 198.9 67.6 28.8
Depreciation and amortization 22.3 15.9 65.3 47.6 65.9
Cash flow from operations
before financing items and taxes 351.9 240.1 792.6 607.3 819.8
Cash flow from financing items and taxes -26.2 -42.5 -77.2 -141.3 -216.8
Cash flow from operating activities 325.7 197.6 715.4 466.0 603.0
Cash flow from investing activities -20.9 -81.2 -85.9 -119.6 -225.6
Cash flow after investing activities 304.8 116.4 629.5 346.4 377.4
Purchase, sale and distribution of own shares - -28.9 -36.9 -40.7 -40.7
Increase in equity (option rights) - 4.4 29.7 4.4 16.7
Profit distribution - - -356.4 -229.7 -229.7
Change in deposits and loans receivable, net -287.9 -117.7 -321.8 -83.0 -42.0
Change in loans payable -10.2 -32.4 4.1 -37.2 -38.3
Cash flow from financing activities -298.1 -174.6 -681.3 -386.2 -334.0
Change in cash and cash equivalents 6.7 -58.2 -51.8 -39.8 43.4
Cash and cash equivalents at end of period 185.7 147.5 185.7 147.5 234.0
Translation difference 1.0 1.0 -3.5 5.2 1.9
Cash and cash equivalents at beginning of period 180.0 206.7 234.0 192.5 192.5
Change in cash and cash equivalents 6.7 -58.2 -51.8 -39.8 43.4
CHANgE IN INTEREST-bEARINg NET DEbT
MEUR 7–9/2012 7–9/2011 1–9/2012 1–9/2011 1–12/2011
Interest-bearing net debt at beginning of period -805.1 -715.6 -829.1 -749.8 -749.8
Interest-bearing net debt at end of period -1,105.9 -823.2 -1,105.9 -823.2 -829.1
Change in interest-bearing net debt -300.8 -107.6 -276.8 -73.4 -79.3
Condensed consolidated statement of cash flows

16Q3
KEY FIgURES
1–9/2012 1–9/2011 1–12/2011
basic earnings per share EUR 1.65 1.56 2.52
Diluted earnings per share EUR 1.64 1.55 2.51
Equity per share EUR 8.17 6.84 7.93
Interest-bearing net debt MEUR -1,105.9 -823.2 -829.1
Total equity/total assets % 51.1 50.4 54.0
gearing % -52.4 -47.2 -40.8
Return on equity % 27.5 31.7 35.5
Return on capital employed % 26.7 31.1 34.3
Total assets MEUR 5,448.9 4,438.3 4,727.2
Assets employed MEUR 1,003.0 922.6 1,204.9
Working capital (including financing and tax items) MEUR -592.6 -369.6 -361.4
QUARTERLY FIgURES
Q3/2012 Q2/2012 Q1/2012
Orders received MEUR 1,295.6 1,513.4 1,365.9
Order book MEUR 5,283.7 5,305.3 4,842.8
Sales MEUR 1,633.7 1,544.1 1,241.3
Operating income MEUR 224.5 208.5 1) 132.7
Operating income % 13.7 13.5 1) 10.7
Q4/2011 Q3/2011 Q2/2011 Q1/2011 Q4/2010 Q3/2010 Q2/2010 Q1/2010
Orders received MEUR 1,098.8 1,095.4 1,226.2 1,044.7 1,006.3 865.2 1,042.8 894.7
Order book MEUR 4,348.2 4,143.2 3,947.7 3,737.5 3,597.8 3,657.9 3,933.7 3,638.5
Sales MEUR 1,588.8 1,296.2 1,286.4 1,053.8 1,488.8 1,235.9 1,258.9 1,003.0
Operating income MEUR 233.0 188.9 184.5 118.7 227.3 184.8 175.7 108.6
Operating income % 14.7 14.6 14.3 11.3 15.3 15.0 14.0 10.8
Q4/2009 Q3/2009 Q2/2009 Q1/2009 Q4/2008 Q3/2008 Q2/2008 Q1/2008
Orders received MEUR 813.5 766.5 953.9 898.5 845.2 892.4 1,092.4 1,117.5
Order book MEUR 3,309.1 3,603.4 3,754.1 3,753.1 3,576.7 4,002.8 3,838.7 3,617.4
Sales MEUR 1,426.8 1,127.3 1,168.6 1,021.0 1,431.6 1,123.8 1,142.1 905.3
Operating income MEUR 202.7 160.1 146.3 2) 91.2 189.2 146.0 136.7 86.5
Operating income % 14.2 14.2 12.5 2) 8.9 13.2 13.0 12.0 9.6
Q4/2007 Q3/2007 Q2/2007 Q1/2007 Q4/2006 Q3/2006 Q2/2006 Q1/2006
Orders received MEUR 901.9 926.3 944.4 902.1 712.1 742.0 821.9 840.3
Order book MEUR 3,282.3 3,473.6 3,318.0 3,105.7 2,762.1 2,951.0 2,818.0 2,654.0
Sales MEUR 1,294.2 971.6 1,001.9 811.2 1,145.6 879.8 840.4 735.0
Operating income MEUR 160.8 3) 126.7 116.4 69.3 4) 123.4 101.1 83.9 51.7
Operating income % 12.4 3) 13.0 11.6 8.5 4) 10.8 11.5 10.0 7.0
1) Excluding a MEUR 37.3 one-time cost related to the support function development and cost adjustment programs.2) Excluding a MEUR 33.6 one-time restructuring cost related to the fixed cost adjustment program.3) Excluding a MEUR 22.5 provision for the Austrian cartel court’s fine decision and a MEUR 12.1 sales profit from the sale
of KONE building.4) Excluding a MEUR 142.0 fine for the European Commission´s decision.
Notes for the interim report

17Q3
Notes for the interim report
SALES bY gEOgRAPHICAL REgIONS
MEUR 1–9/2012 % 1–9/2011 % 1–12/2011 %
EMEA1) 2,186.4 49 2,004.5 55 2,893.7 55
Americas 706.3 16 661.4 18 947.3 18
Asia-Pacific 1,526.4 35 970.5 27 1,384.2 27
Total 4,419.1 3,636.4 5,225.2
1) EMEA = Europe, Middle East, Africa
ORDERS RECEIVED
MEUR 1–9/2012 1–9/2011 1–12/2011
4,174.9 3,366.3 4,465.1
ORDER bOOK
MEUR Sep 30, 2012 Sep 30, 2011 Dec 31, 2011
5,283.7 4,143.2 4,348.2
CAPITAL EXPENDITURE
MEUR 1–9/2012 1–9/2011 1–12/2011
In fixed assets 62.3 24.3 39.5
In leasing agreements 10.1 11.2 12.3
In acquisitions 25.5 57.0 185.3
Total 97.9 92.5 237.1
DEPRECIATION AND AMORTIzATION
MEUR 1–9/2012 1–9/2011 1–12/2011
Depreciation and amortization 39.4 37.1 49.8
Amortization of acquisition-related intangible assets 25.9 10.5 16.1
Total 65.3 47.6 65.9
R&D EXPENDITURE
MEUR 1–9/2012 1–9/2011 1–12/2011
62.7 59.0 82.5
R&D Expenditure as percentage of sales 1.4 1.6 1.6
NUMbER OF EMPLOYEES
1–9/2012 1–9/2011 1–12/2011
Average 38,164 34,386 34,769
At the end of the period 38,902 35,117 37,542

18Q3
COMMITMENTS
MEUR Sep 30, 2012 Sep 30, 2011 Dec 31, 2011
Mortgages
group and parent company - - -
Pledged assets
group and parent company 0.1 0.1 0.1
guarantees
Associated companies 8.6 3.4 6.5
Others 5.3 8.2 5.6
Operating leases 246.3 178.5 202.8
Total 260.3 190.2 215.0
banks and financial institutions have guaranteed obligations arising in the ordinary course of business of KONE companies up to a maximum of EUR 859.2 (708.0) million as of September 30, 2012.
Possible unidentified debts and liabilities of the in 2005 demerged Kone Corporation were transferred to the new KONE Corpora-tion according to the demerger plan.
KONE leases cars, machinery & equipment and buildings under operating leases with varying terms.
The future minimum lease payments under non-cancellable operating leasesMEUR Sep 30, 2012 Sep 30, 2011 Dec 31, 2011
Less than 1 year 56.0 48.1 53.1
1–5 years 141.2 106.1 124.3
Over 5 years 49.1 24.3 25.4
Total 246.3 178.5 202.8
DERIVATIVES
Fair values of derivative financial instruments positivefair value
negativefair value
netfair value
netfair value
netfair value
MEUR Sep 30, 2012 Sep 30, 2012 Sep 30, 2012 Sep 30, 2011 Dec 31, 2011
Foreign exchange forward contracts and swaps 5.4 16.6 -11.2 9.2 -3.8
Cross-currency swaps - 33.3 -33.3 -27.1 -33.2
Electricity price forward contracts 0.2 0.6 -0.4 0.1 -0.4
Total 5.6 50.5 -44.9 -17.8 -37.4
Nominal values of derivative financial instrumentsMEUR Sep 30, 2012 Sep 30, 2011 Dec 31, 2011
Foreign exchange forward contracts and swaps 1,034.4 782.7 814.8
Cross-currency swaps 139.3 139.3 139.3
Electricity price forward contracts 4.1 4.5 4.0
Total 1,177.8 926.5 958.1
Notes for the interim report

19Q3
Sep 30, 2012 Class A-shares Class B-shares Total
Number of shares 38,104,356 222,431,764 260,536,120
Own shares in possession 1) 4,160,339
Share capital, EUR 65,134,030
Market capitalization, MEUR 13,806
Number of class b shares traded (millions), 1–9/2012 89.4
Value of class b shares traded, MEUR, 1–9/2012 4,074
Number of shareholders 3 30,736 30,736
Close High Low
Class b-share price, EUR, Jan–Sep 2012 53.85 54.95 39.19
1) During January–September 2012, KONE used its previous authorization to repurchase its own shares in February, and bought back in total 834,174 of its own class b shares. In April 2012 KONE assigned 208,295 of its own class b shares to a share-based incentive plan. In addition, in April, 1,445,616 class b shares owned by KONE were subscribed with the 2007 option rights. In June and August, a total of 17,900 class b shares were returned free of consideration to KONE by virtue of the terms of KONE’s share-based incentive program for the years 2010–2012.
Shares and shareholders

KONE Corporation
Corporate OfficesKeilasatama 3P.O. box 7FI-02151 Espoo, FinlandTel. +358 (0)204 751Fax +358 (0)204 75 4496
www.kone.com
For further information please contact:Henrik EhrnroothCFOTel. +358 (0)204 75 4260
Karla LindahlDirector, Investor RelationsTel. +358 (0)204 75 4441
KONE is one of the global leaders in the elevator and escalator industry. The company has been committed to under-standing the needs of its customers for the past century, providing industry-leading elevators, escalators and automatic building doors as well as innovative solutions for modernization and maintenance. The company’s objective is to offer the best People Flow™ experience by developing and delivering solutions that enable people to move smoothly, safely, comfortably and without waiting in buildings in an increasingly urbanizing environment. In 2011, KONE had annual net sales of EUR 5.2 billion and on average 35,000 employees. KONE class B shares are listed on the NASDAQ OMX Helsinki Ltd in Finland. www.kone.com
This bulletin contains forward-looking statements that are based on the current expectations, known factors, decisions and plans of the management of KONE. Although the management believes that the expectations reflected in such forward-looking statements are reasonable, no assurance can be given that such expectations will prove to be correct. Accordingly, results could differ materially from those implied in the forward-looking statements as a result of, among other factors, changes in economic, market and competitive conditions, changes in the regulatory environment and other government actions as well as fluctuations in exchange rates.