KONE Q1 2018 - Seeking Alpha
31
KONE Q1 2018 APRIL 25, 2018 HENRIK EHRNROOTH, PRESIDENT & CEO ILKKA HARA, CFO
Transcript of KONE Q1 2018 - Seeking Alpha

KONE Q1 2018APRIL 25, 2018
HENRIK EHRNROOTH, PRESIDENT & CEO
ILKKA HARA, CFO
Q1 2018 Highlights
▪ Solid growth in orders received
with stabilizing margins
▪ Profitability continued to be
burdened
▪ Good progress in driving
differentiation

Q1/2018 Q1/2017 ChangeComparable
change
Orders received MEUR 1,908.7 1,913.0 -0.2% 6.8%
Order book MEUR 7,786.6 7,960.5 -2.2% 5.9%
Sales MEUR 2,008.0 1,943.4 3.3% 10.6%
Operating income (EBIT) MEUR 211.5 245.8 -14.0%
Operating income margin (EBIT %) % 10.5 12.6
Adjusted EBIT MEUR 218.3 245.8 -11.2%
Adjusted EBIT margin % 10.9 12.6
Cash flow from operations
(before financing items and taxes)MEUR 179.0 305.3
Basic earnings per share EUR 0.33 0.40 -17.5%
April 25, 2018 Interim Report January-March 2018 | © KONE Corporation3
SOLID GROWTH IN ORDERS RECEIVED AT COMPARABLE CURRENCIES
Q1 2018 Key figures
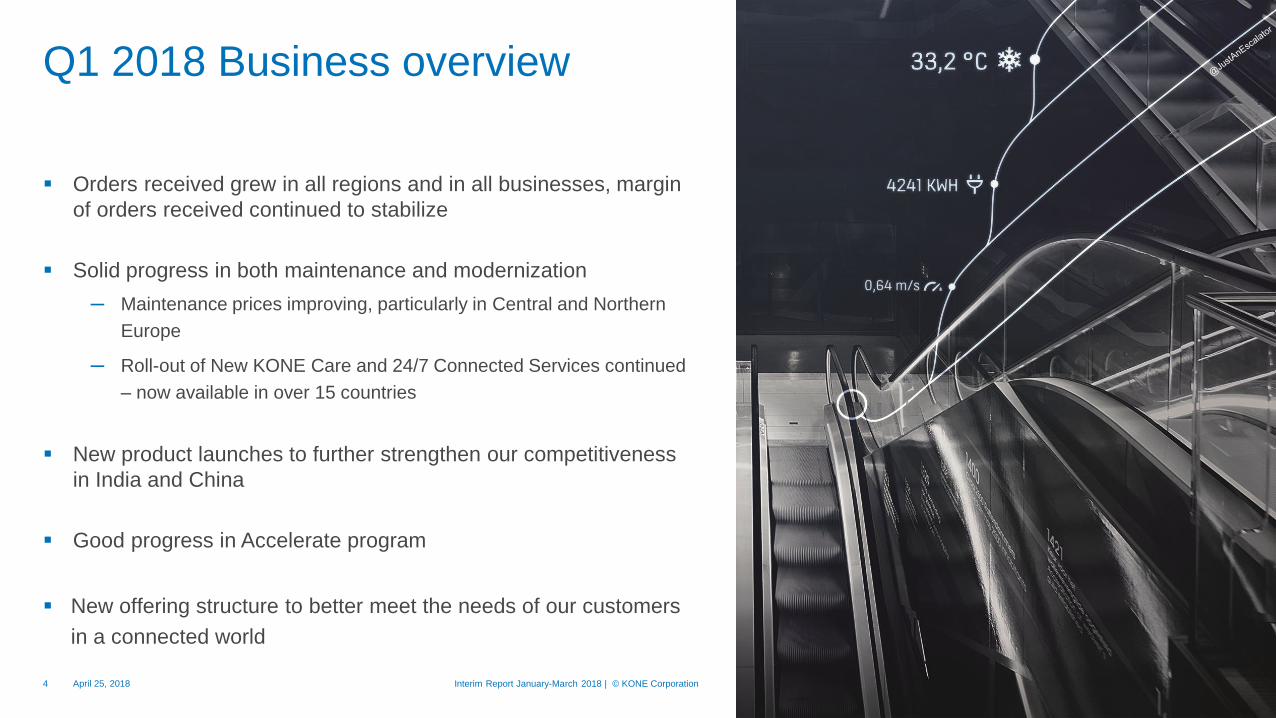
Q1 2018 Business overview
▪ Orders received grew in all regions and in all businesses, margin
of orders received continued to stabilize
▪ Solid progress in both maintenance and modernization
─ Maintenance prices improving, particularly in Central and Northern
Europe
─ Roll-out of New KONE Care and 24/7 Connected Services continued
– now available in over 15 countries
▪ New product launches to further strengthen our competitiveness
in India and China
▪ Good progress in Accelerate program
▪ New offering structure to better meet the needs of our customers
in a connected world
April 25, 2018 Interim Report January-March 2018 | © KONE Corporation4
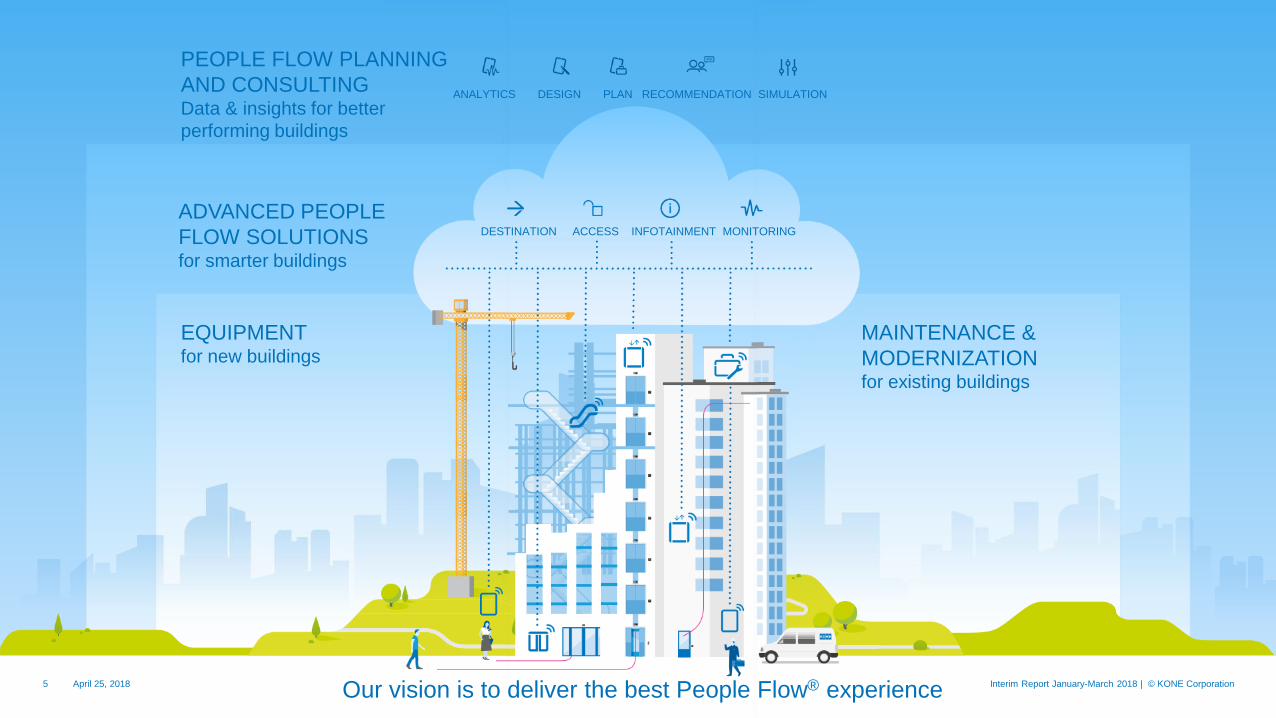
EQUIPMENTfor new buildings
MAINTENANCE &
MODERNIZATIONfor existing buildings
ADVANCED PEOPLE
FLOW SOLUTIONSfor smarter buildings
DESTINATION ACCESS INFOTAINMENT MONITORING
April 25, 2018 Interim Report January-March 2018 | © KONE Corporation5 Our vision is to deliver the best People Flow® experience
PEOPLE FLOW PLANNING
AND CONSULTINGData & insights for better
performing buildings
ANALYTICS DESIGN PLAN RECOMMENDATION SIMULATION

Market development
7
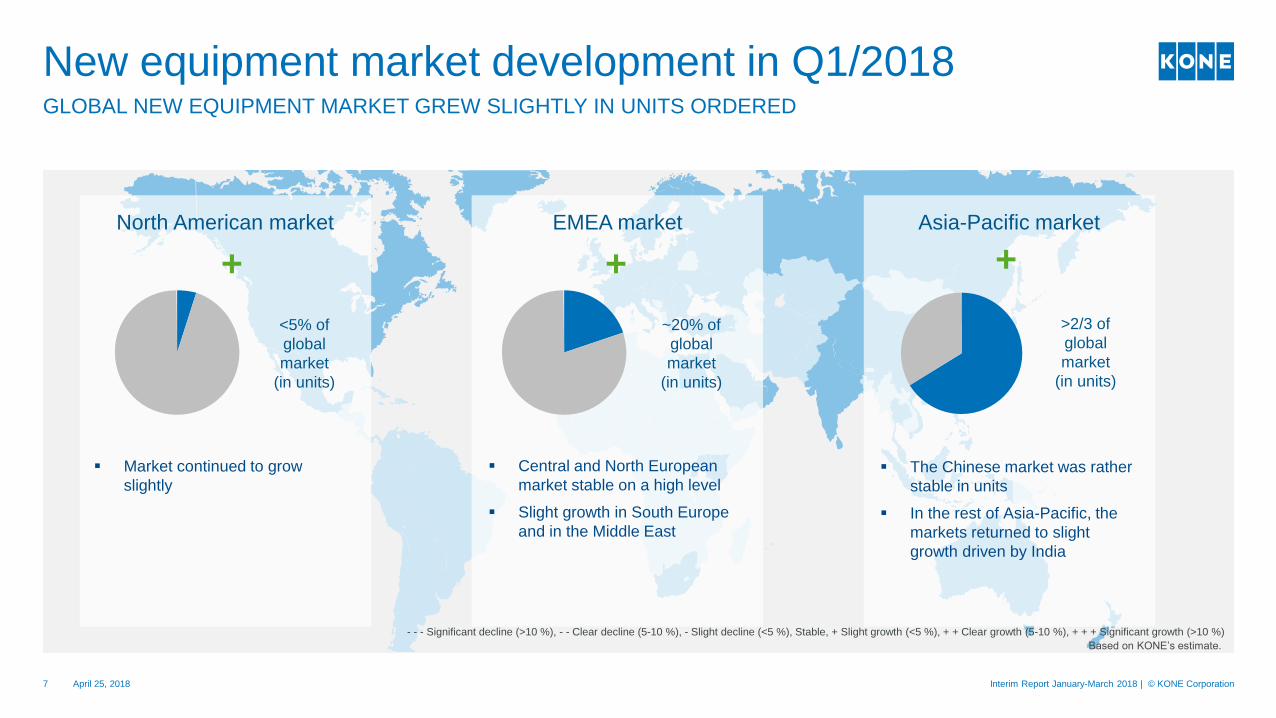
GLOBAL NEW EQUIPMENT MARKET GREW SLIGHTLY IN UNITS ORDERED
New equipment market development in Q1/2018
April 25, 2018 Interim Report January-March 2018 | © KONE Corporation
EMEA market Asia-Pacific marketNorth American market
>2/3 of
global
market
(in units)
~20% of
global
market
(in units)
<5% of
global
market
(in units)
++
▪ Market continued to grow
slightly
▪ Central and North European
market stable on a high level
▪ Slight growth in South Europe
and in the Middle East
▪ The Chinese market was rather
stable in units
▪ In the rest of Asia-Pacific, the
markets returned to slight
growth driven by India
- - - Significant decline (>10 %), - - Clear decline (5-10 %), - Slight decline (<5 %), Stable, + Slight growth (<5 %), + + Clear growth (5-10 %), + + + Significant growth (>10 %)
Based on KONE’s estimate.
+
8
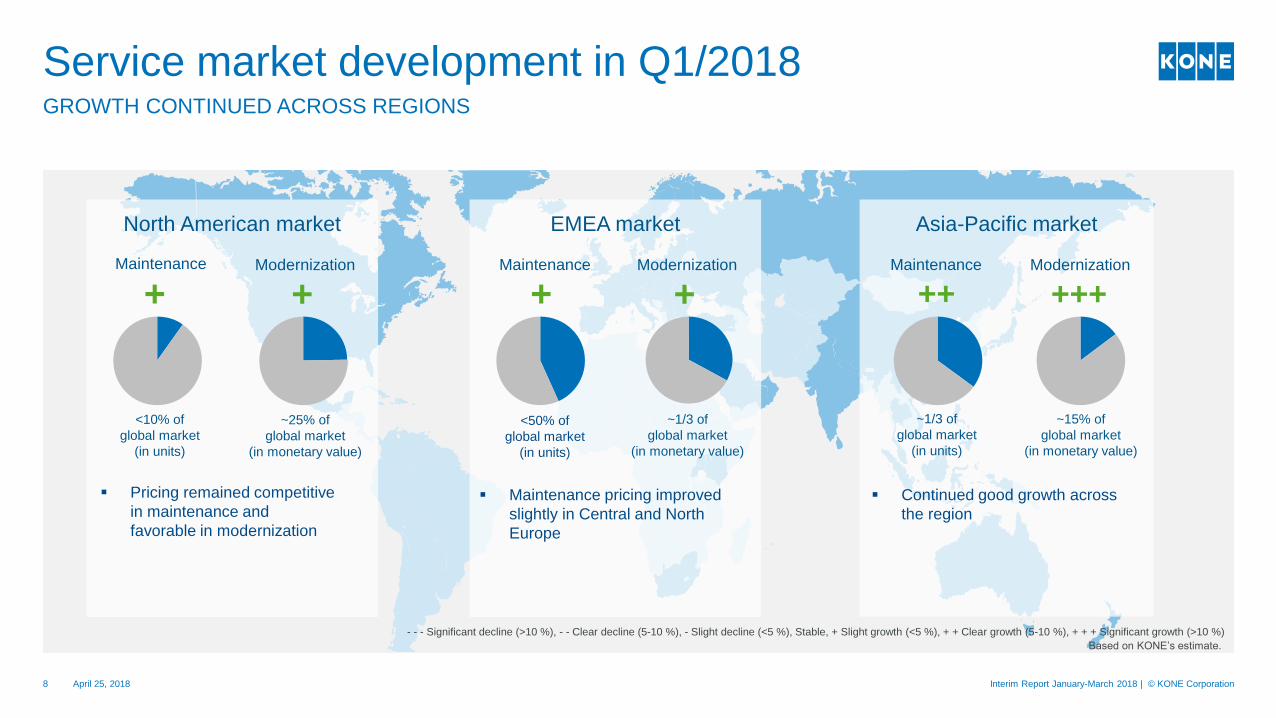
GROWTH CONTINUED ACROSS REGIONS
Service market development in Q1/2018
April 25, 2018 Interim Report January-March 2018 | © KONE Corporation
North American market
<10% of
global market
(in units)
+ +Maintenance Modernization
~25% of
global market
(in monetary value)
EMEA market
<50% of
global market
(in units)
Maintenance
+ +
~1/3 of
global market
(in monetary value)
Modernization
Asia-Pacific market
~1/3 of
global market
(in units)
~15% of
global market
(in monetary value)
++ +++Maintenance Modernization
- - - Significant decline (>10 %), - - Clear decline (5-10 %), - Slight decline (<5 %), Stable, + Slight growth (<5 %), + + Clear growth (5-10 %), + + + Significant growth (>10 %)
Based on KONE’s estimate.
▪ Maintenance pricing improved
slightly in Central and North
Europe
▪ Pricing remained competitive
in maintenance and
favorable in modernization
▪ Continued good growth across
the region
April 25, 2018 Interim Report January-March 2018 | © KONE Corporation9
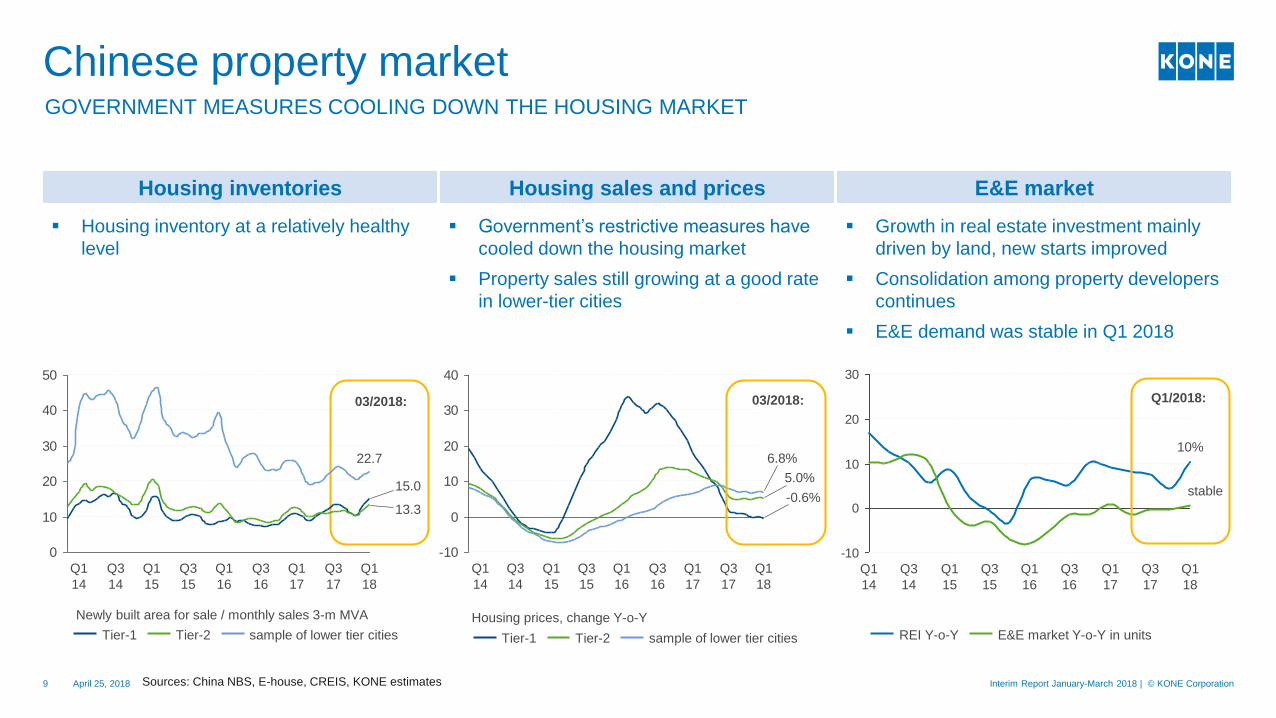
Chinese property market
Housing inventories Housing sales and prices E&E market
▪ Housing inventory at a relatively healthy
level
▪ Government’s restrictive measures have
cooled down the housing market
▪ Property sales still growing at a good rate
in lower-tier cities
▪ Growth in real estate investment mainly
driven by land, new starts improved
▪ Consolidation among property developers
continues
▪ E&E demand was stable in Q1 2018
-10
0
10
20
30
40
Q1
18
6.8%
5.0%
-0.6%
Q1
17
Q3
15
Q1
14
Q3
17
Q1
16
Q3
16
Q1
15
Q3
14
Tier-2 sample of lower tier citiesTier-1
-10
0
10
20
30
Q1
16
10%
Q3
14
stable
Q1
15
Q3
15
Q1
18
Q1
14
Q3
16
Q3
17
Q1
17
E&E market Y-o-Y in unitsREI Y-o-Y
Sources: China NBS, E-house, CREIS, KONE estimates
03/2018: Q1/2018:
0
10
20
30
40
50
Q3
16
13.3
Q1
16
Q1
18
Q3
17
Q1
15
Q3
14
Q1
14
22.7
15.0
Q1
17
Q3
15
sample of lower tier citiesTier-2Tier-1
03/2018:
Newly built area for sale / monthly sales 3-m MVA
GOVERNMENT MEASURES COOLING DOWN THE HOUSING MARKET
Housing prices, change Y-o-Y
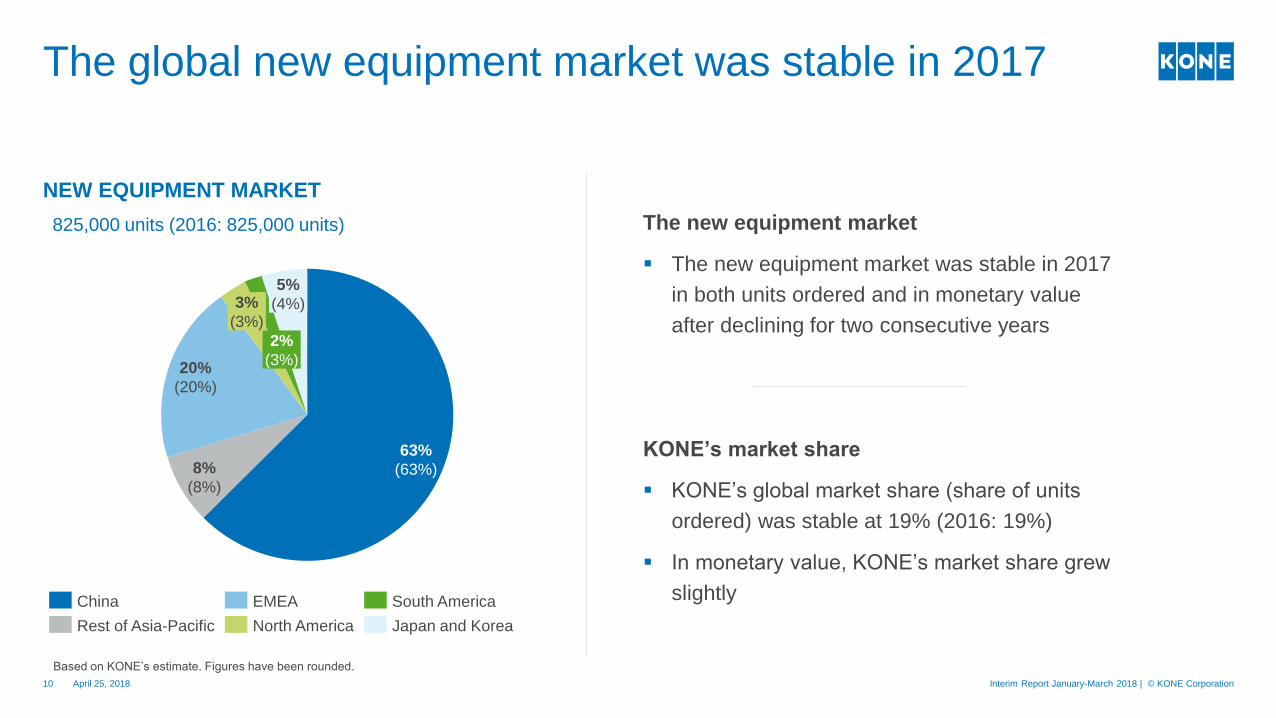
NEW EQUIPMENT MARKET
April 25, 2018 Interim Report January-March 2018 | © KONE Corporation10
The global new equipment market was stable in 2017
825,000 units (2016: 825,000 units)
20%
(20%)
5%
(4%)
2%
(3%)
3%
(3%)
8%
(8%)
63%
(63%)
North America
China South AmericaEMEA
Japan and KoreaRest of Asia-Pacific
Based on KONE’s estimate. Figures have been rounded.
The new equipment market
▪ The new equipment market was stable in 2017
in both units ordered and in monetary value
after declining for two consecutive years
KONE’s market share
▪ KONE’s global market share (share of units
ordered) was stable at 19% (2016: 19%)
▪ In monetary value, KONE’s market share grew
slightly
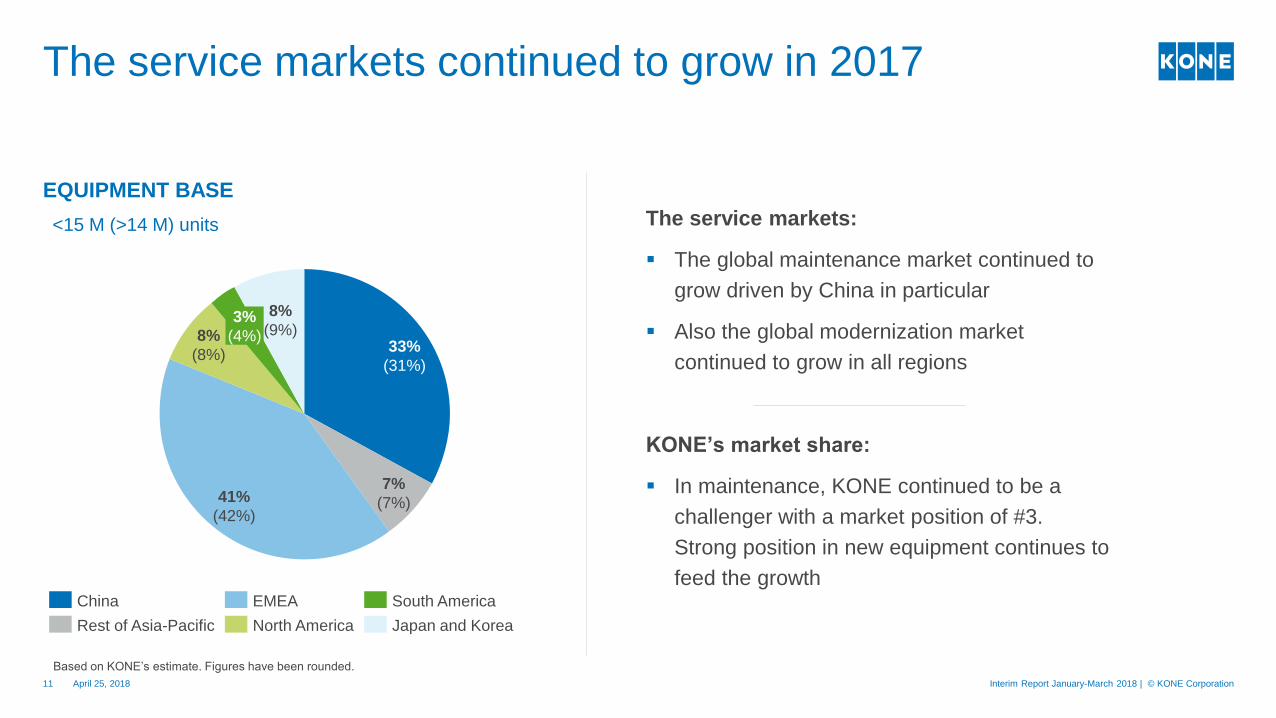
EQUIPMENT BASE
April 25, 2018 Interim Report January-March 2018 | © KONE Corporation11
The service markets continued to grow in 2017
<15 M (>14 M) units The service markets:
▪ The global maintenance market continued to
grow driven by China in particular
▪ Also the global modernization market
continued to grow in all regions
KONE’s market share:
▪ In maintenance, KONE continued to be a
challenger with a market position of #3.
Strong position in new equipment continues to
feed the growth
Based on KONE’s estimate. Figures have been rounded.
8%
(8%)
41%
(42%)
8%
(9%)3%
(4%)
7%
(7%)
33%
(31%)
South America
Japan and KoreaNorth America
EMEAChina
Rest of Asia-Pacific
April 25, 2018 Interim Report January-March 2018 | © KONE Corporation12
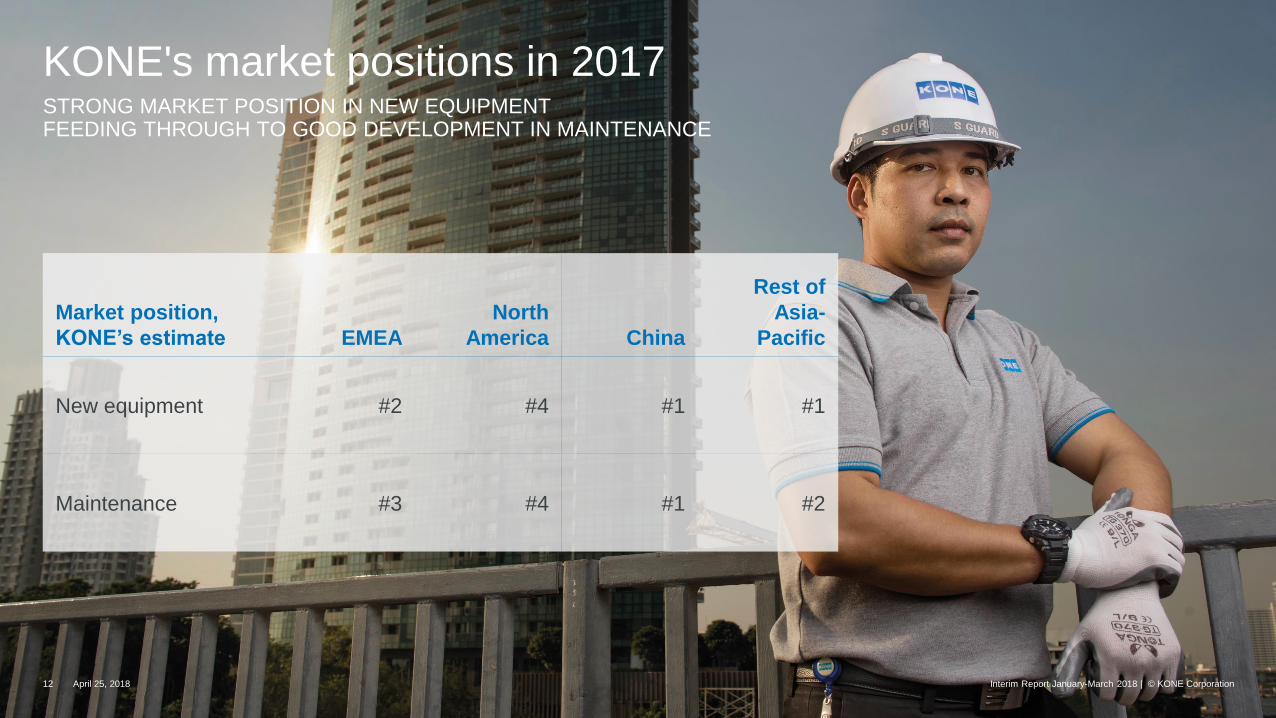
STRONG MARKET POSITION IN NEW EQUIPMENT FEEDING THROUGH TO GOOD DEVELOPMENT IN MAINTENANCE
KONE's market positions in 2017
Market position,
KONE’s estimate EMEA
North
America China
Rest of
Asia-
Pacific
New equipment #2 #4 #1 #1
Maintenance #3 #4 #1 #2

Q1 Financials
April 25, 2018 Interim Report January-March 2018 | © KONE Corporation14
MEUR
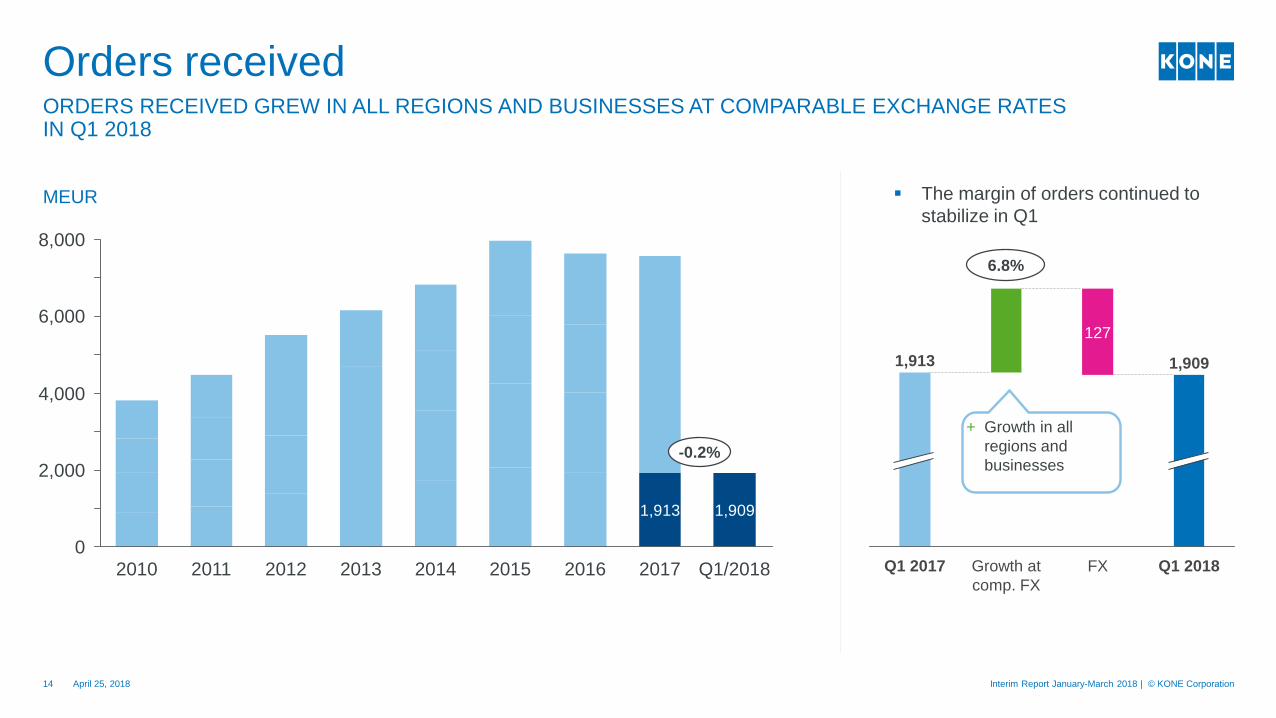
ORDERS RECEIVED GREW IN ALL REGIONS AND BUSINESSES AT COMPARABLE EXCHANGE RATES IN Q1 2018
Orders received
0
2,000
8,000
6,000
4,000
Q1/2018
1,909
20172016
1,913
2012 20152011 201420132010
127
FXQ1 2017
1,913 1,909
Q1 2018Growth at
comp. FX
+ Growth in all
regions and
businesses
6.8%
▪ The margin of orders continued to
stabilize in Q1
-0.2%
April 25, 2018 Interim Report January-March 2018 | © KONE Corporation15
MEUR
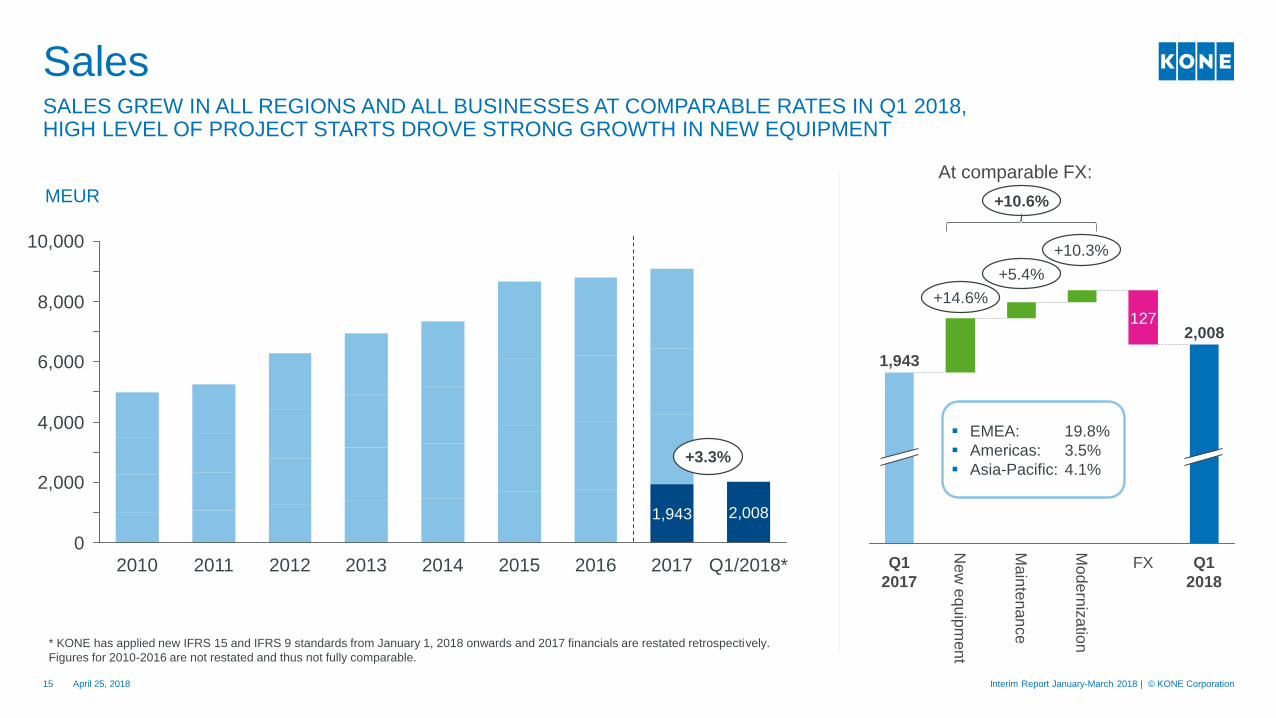
SALES GREW IN ALL REGIONS AND ALL BUSINESSES AT COMPARABLE RATES IN Q1 2018, HIGH LEVEL OF PROJECT STARTS DROVE STRONG GROWTH IN NEW EQUIPMENT
Sales
4,000
6,000
0
8,000
2,000
10,000
2017 Q1/2018*201520112010
2,008
2016
1,943
201420132012
127
Q1
2018
Ma
inte
nan
ce
New
equ
ipm
en
t
Q1
2017
FX
Mo
de
rniz
atio
n
1,943
2,008
+10.6%
At comparable FX:
+3.3%
+14.6%
+5.4%
+10.3%
▪ EMEA: 19.8%
▪ Americas: 3.5%
▪ Asia-Pacific: 4.1%
* KONE has applied new IFRS 15 and IFRS 9 standards from January 1, 2018 onwards and 2017 financials are restated retrospectively.
Figures for 2010-2016 are not restated and thus not fully comparable.
April 25, 2018 Interim Report January-March 2018 | © KONE Corporation16
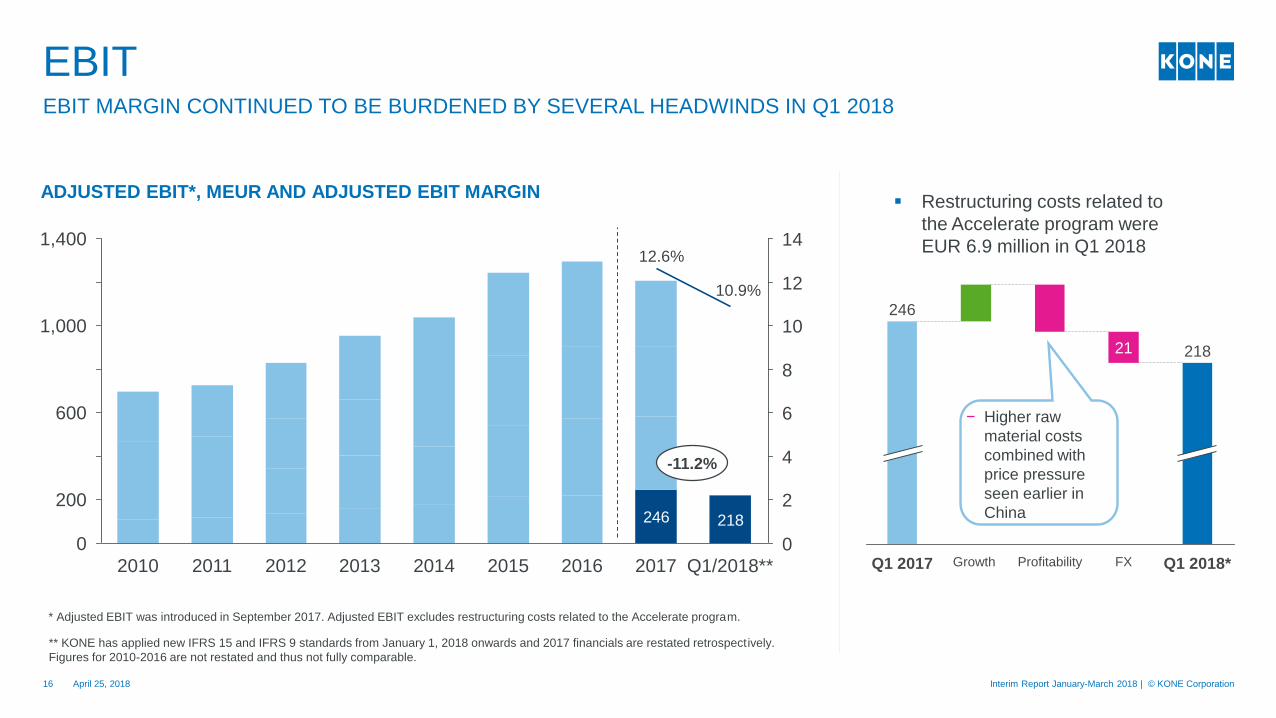
EBIT MARGIN CONTINUED TO BE BURDENED BY SEVERAL HEADWINDS IN Q1 2018
EBIT
218246
0
2
4
6
8
10
12
14
1,000
1,400
0
200
600
2010 Q1/2018**2015 20162014201320122011 2017
ADJUSTED EBIT*, MEUR AND ADJUSTED EBIT MARGIN
* Adjusted EBIT was introduced in September 2017. Adjusted EBIT excludes restructuring costs related to the Accelerate program.
21
Q1 2018*
218
FXGrowthQ1 2017 Profitability
246
▪ Restructuring costs related to
the Accelerate program were
EUR 6.9 million in Q1 2018
-11.2%
− Higher raw
material costs
combined with
price pressure
seen earlier in
China
12.6%
10.9%
** KONE has applied new IFRS 15 and IFRS 9 standards from January 1, 2018 onwards and 2017 financials are restated retrospectively.
Figures for 2010-2016 are not restated and thus not fully comparable.
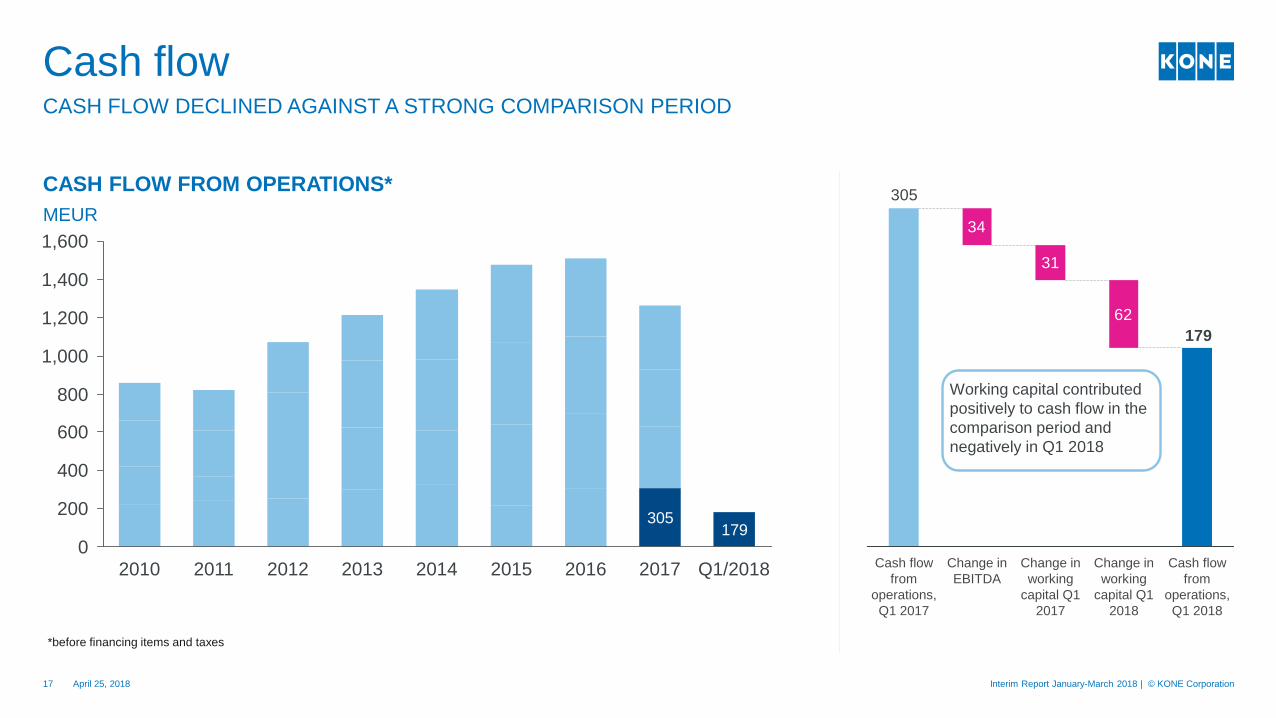
April 25, 2018 Interim Report January-March 2018 | © KONE Corporation17
CASH FLOW FROM OPERATIONS*
CASH FLOW DECLINED AGAINST A STRONG COMPARISON PERIOD
Cash flow
179305
200
1,000
400
0
800
600
1,600
1,400
1,200
Q1/20182011 2016 201720142010 2012 2013 2015
34
31
62
179
305
Change in
working
capital Q1
2018
Change in
EBITDA
Cash flow
from
operations,
Q1 2017
Change in
working
capital Q1
2017
Cash flow
from
operations,
Q1 2018
MEUR
*before financing items and taxes
Working capital contributed
positively to cash flow in the
comparison period and
negatively in Q1 2018

Market and business outlook for 2018

Market outlook for 2018
April 25, 2018 Interim Report January-March 2018 | © KONE Corporation19
▪ Asia-Pacific: The market in China is expected to decline slightly or to be
stable in units ordered and competition to remain intense. In the rest of
Asia-Pacific, the market is expected to grow.
▪ Europe, Middle East and Africa: The market is expected to grow slightly
▪ North America: The market is expected to grow slightly
NEW EQUIPMENT MARKETS
MAINTENANCE MARKETS
▪ The maintenance market is expected to see the strongest growth rate
in Asia-Pacific, and to grow slightly in other regions
MODERNIZATION MARKETS
▪ The modernization market is expected to grow slightly in the Europe,
Middle East and Africa region and in North America and to develop
strongly in Asia-Pacific.
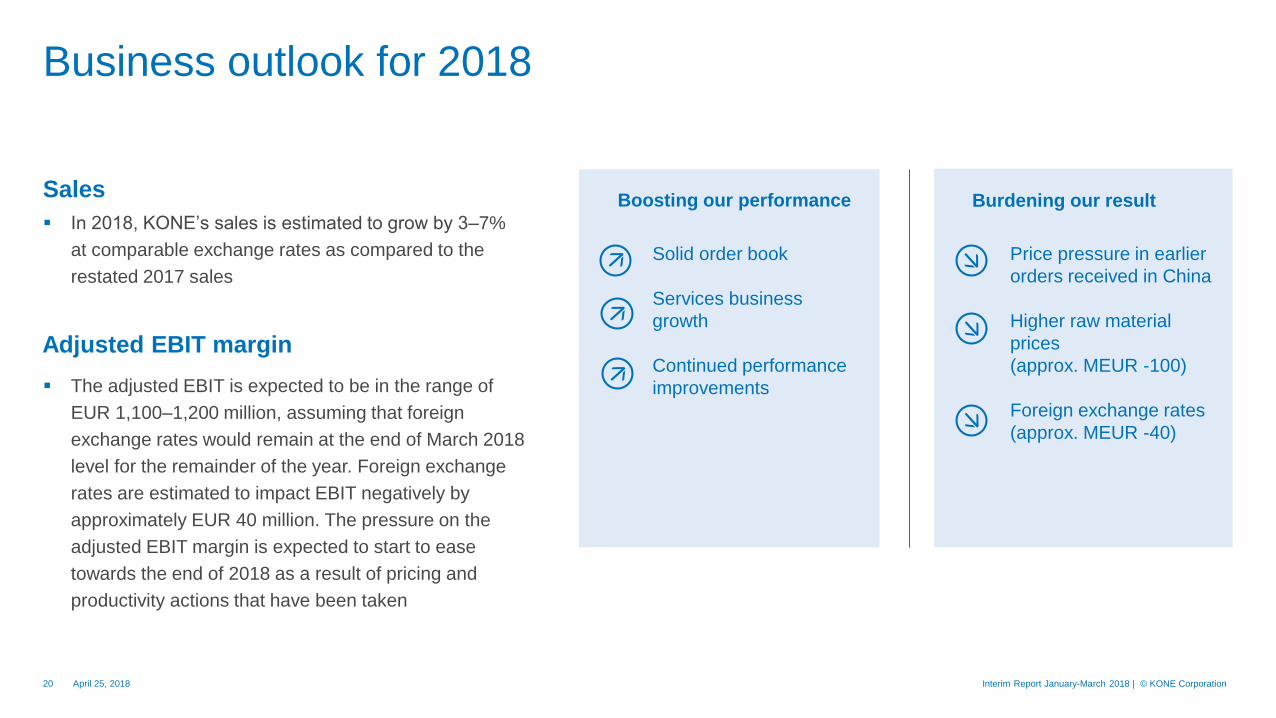
Business outlook for 2018
▪ In 2018, KONE’s sales is estimated to grow by 3–7%
at comparable exchange rates as compared to the
restated 2017 sales
April 25, 2018 Interim Report January-March 2018 | © KONE Corporation20
▪ The adjusted EBIT is expected to be in the range of
EUR 1,100–1,200 million, assuming that foreign
exchange rates would remain at the end of March 2018
level for the remainder of the year. Foreign exchange
rates are estimated to impact EBIT negatively by
approximately EUR 40 million. The pressure on the
adjusted EBIT margin is expected to start to ease
towards the end of 2018 as a result of pricing and
productivity actions that have been taken
Sales
Adjusted EBIT margin
Burdening our resultBoosting our performance
Price pressure in earlier
orders received in China
Higher raw material
prices
(approx. MEUR -100)
Foreign exchange rates
(approx. MEUR -40)
Solid order book
Services business
growth
Continued performance
improvements

Summary
▪ Good start to the year in terms
of growth in orders received
▪ Actions to improve profitability
showing progress
▪ Gaining momentum in strategic
initiatives such as new services
2017Sustainability Report
published today

APPENDIX
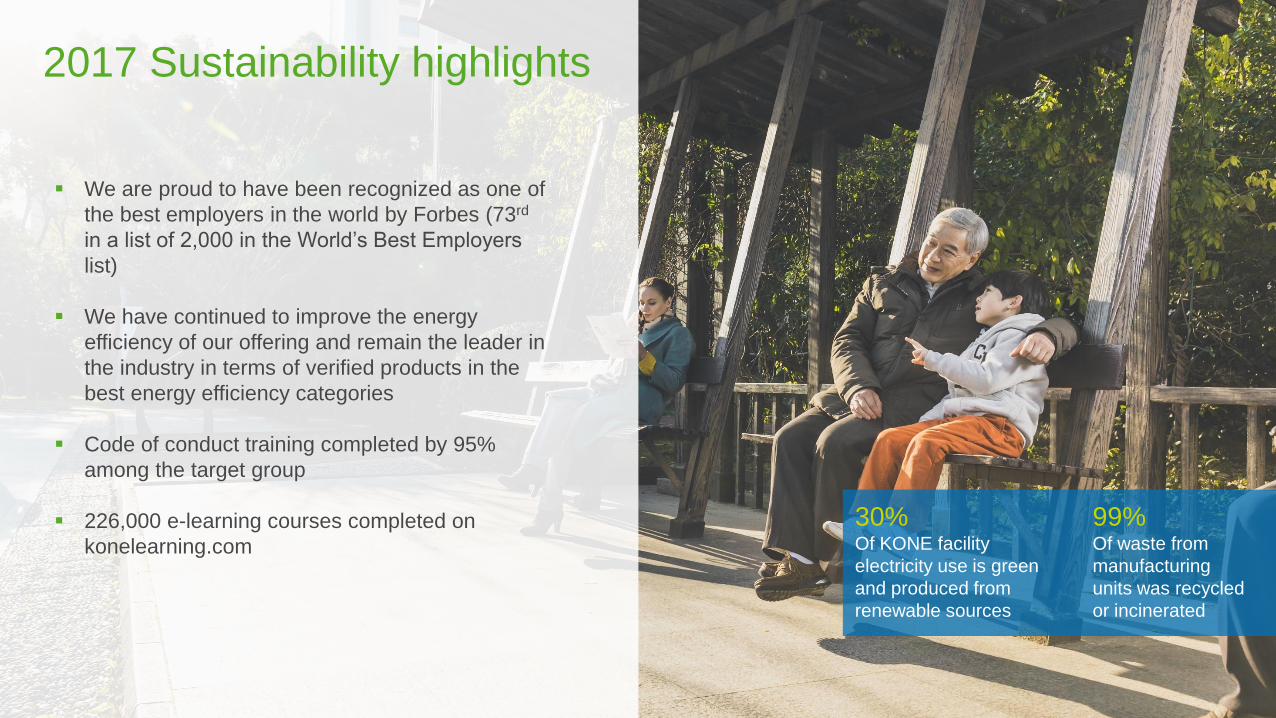
2017 Sustainability highlights
99%Of waste from
manufacturing
units was recycled
or incinerated
30%Of KONE facility
electricity use is green
and produced from
renewable sources
▪ We are proud to have been recognized as one of
the best employers in the world by Forbes (73rd
in a list of 2,000 in the World’s Best Employers
list)
▪ We have continued to improve the energy
efficiency of our offering and remain the leader in
the industry in terms of verified products in the
best energy efficiency categories
▪ Code of conduct training completed by 95%
among the target group
▪ 226,000 e-learning courses completed on
konelearning.com

April 25, 2018 Interim Report January-March 2018 | © KONE Corporation25
Q1 2018 Sales split
15%
(15%)
36%
(37%)
50%
(48%)
ModernizationMaintenanceNew equipment
21%
(24%)
46%
(40%)
34%
(36%)
EMEA (Europe, Middle East and Africa) AmericasAsia-Pacific
BY BUSINESS BY AREA
1–3/2017 figures in brackets.
Figures in charts are rounded and at historical exchange rates.

KONE in China
April 25, 2018 Interim Report January-March 2018 | © KONE Corporation26
Q1/2018
<35%
Q1/2017
<35%>20%>20%
Q1/2017 Q1/2018
Share of
sales
NEW EQUIPMENT MARKET
New equipment orders received in units vs. market development
CHINA’S SHARE OF KONE’S ORDERS AND SALES
In monetary value
-5
0
5
10
15
20
25
30
35
40
45
50
2006-2014
CAGR
<5%
Q1 2018201720162015
~-5%
<20%
>35%
Market
KONE
Share of
orders received
The China
market was
stable in units
KONE’s orders
grew slightly in
both units and
in monetary
value
stable
~-5%
~5%
stable

Currencies
April 25, 2018 Interim Report January-March 2018 | © KONE Corporation27
SALES BY CURRENCY 1–12/2017
(MEUR) Q1/2018 1-12/2017
Sales -127 -200
EBIT -21 -37
Orders
received-127 -195
Others
USD
RMB
EUR
MAIN CURRENCIESCURRENCY IMPACT
Q1
average
2017
average
Mar 31,
2018 spot
EUR / RMB 7.7784 7.3199 7.7468
EUR / USD 1.2246 1.1021 1.2321
EUR / GBP 0.8813 0.8159 0.8749
EUR / AUD 1.5594 1.4807 1.6036
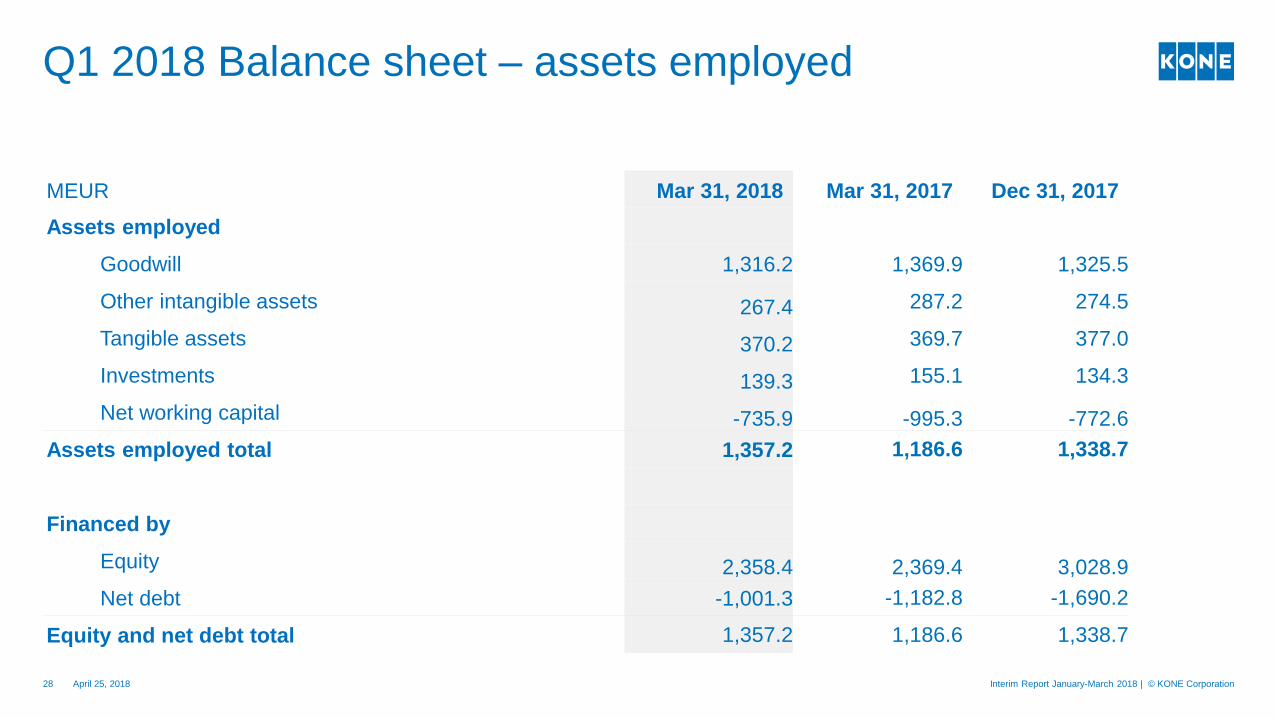
Q1 2018 Balance sheet – assets employed
April 25, 2018 Interim Report January-March 2018 | © KONE Corporation28
MEUR Mar 31, 2018 Mar 31, 2017 Dec 31, 2017
Assets employed
Goodwill 1,316.2 1,369.9 1,325.5
Other intangible assets 267.4 287.2 274.5
Tangible assets 370.2 369.7 377.0
Investments 139.3 155.1 134.3
Net working capital -735.9 -995.3 -772.6
Assets employed total 1,357.2 1,186.6 1,338.7
Financed by
Equity 2,358.4 2,369.4 3,028.9
Net debt -1,001.3 -1,182.8 -1,690.2
Equity and net debt total 1,357.2 1,186.6 1,338.7
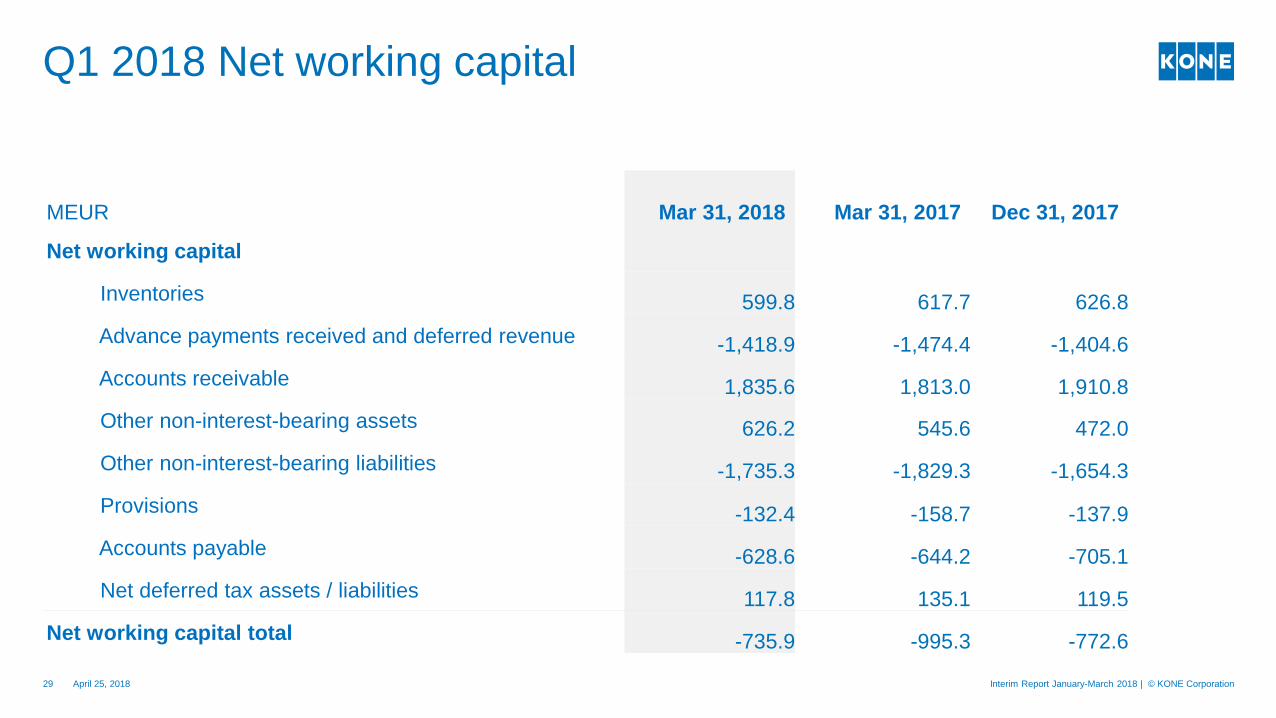
Q1 2018 Net working capital
April 25, 2018 Interim Report January-March 2018 | © KONE Corporation29
MEUR Mar 31, 2018 Mar 31, 2017 Dec 31, 2017
Net working capital
Inventories 599.8 617.7 626.8
Advance payments received and deferred revenue -1,418.9 -1,474.4 -1,404.6
Accounts receivable 1,835.6 1,813.0 1,910.8
Other non-interest-bearing assets 626.2 545.6 472.0
Other non-interest-bearing liabilities -1,735.3 -1,829.3 -1,654.3
Provisions -132.4 -158.7 -137.9
Accounts payable -628.6 -644.2 -705.1
Net deferred tax assets / liabilities 117.8 135.1 119.5
Net working capital total -735.9 -995.3 -772.6
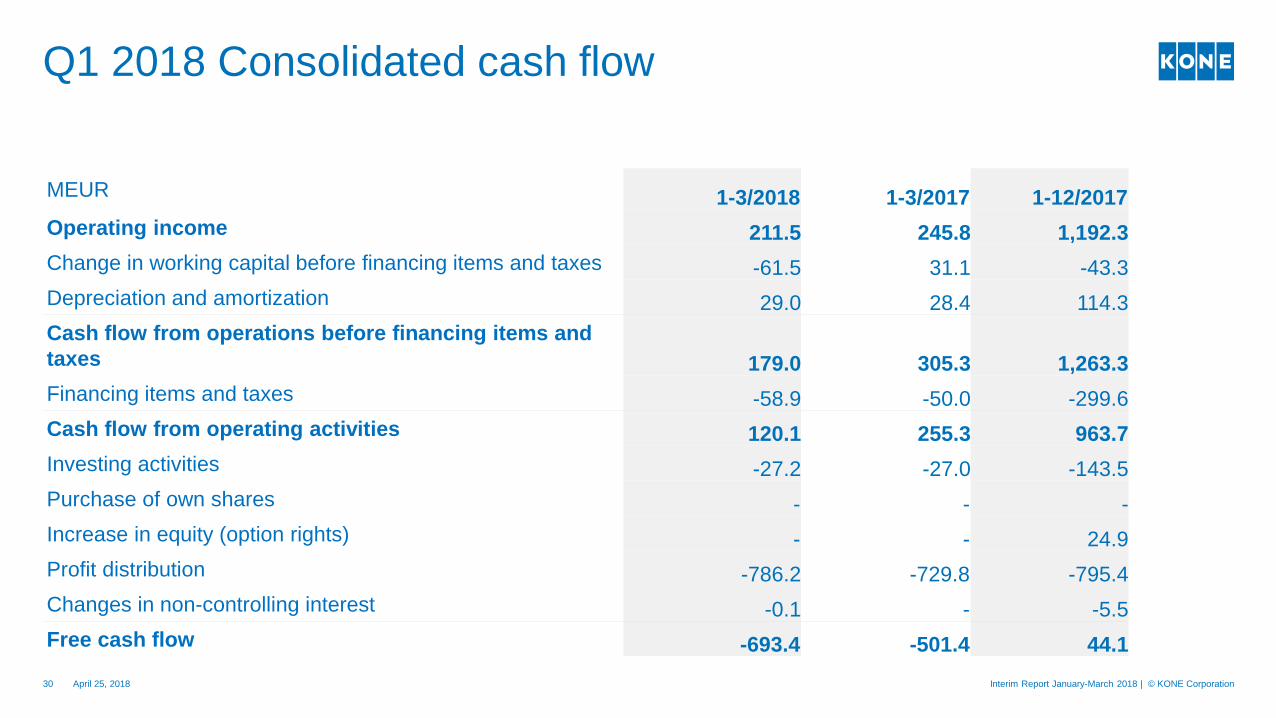
Q1 2018 Consolidated cash flow
April 25, 2018 Interim Report January-March 2018 | © KONE Corporation30
MEUR 1-3/2018 1-3/2017 1-12/2017
Operating income 211.5 245.8 1,192.3
Change in working capital before financing items and taxes -61.5 31.1 -43.3
Depreciation and amortization 29.0 28.4 114.3
Cash flow from operations before financing items and
taxes 179.0 305.3 1,263.3
Financing items and taxes -58.9 -50.0 -299.6
Cash flow from operating activities 120.1 255.3 963.7
Investing activities -27.2 -27.0 -143.5
Purchase of own shares - - -
Increase in equity (option rights) - - 24.9
Profit distribution -786.2 -729.8 -795.4
Changes in non-controlling interest -0.1 - -5.5
Free cash flow -693.4 -501.4 44.1
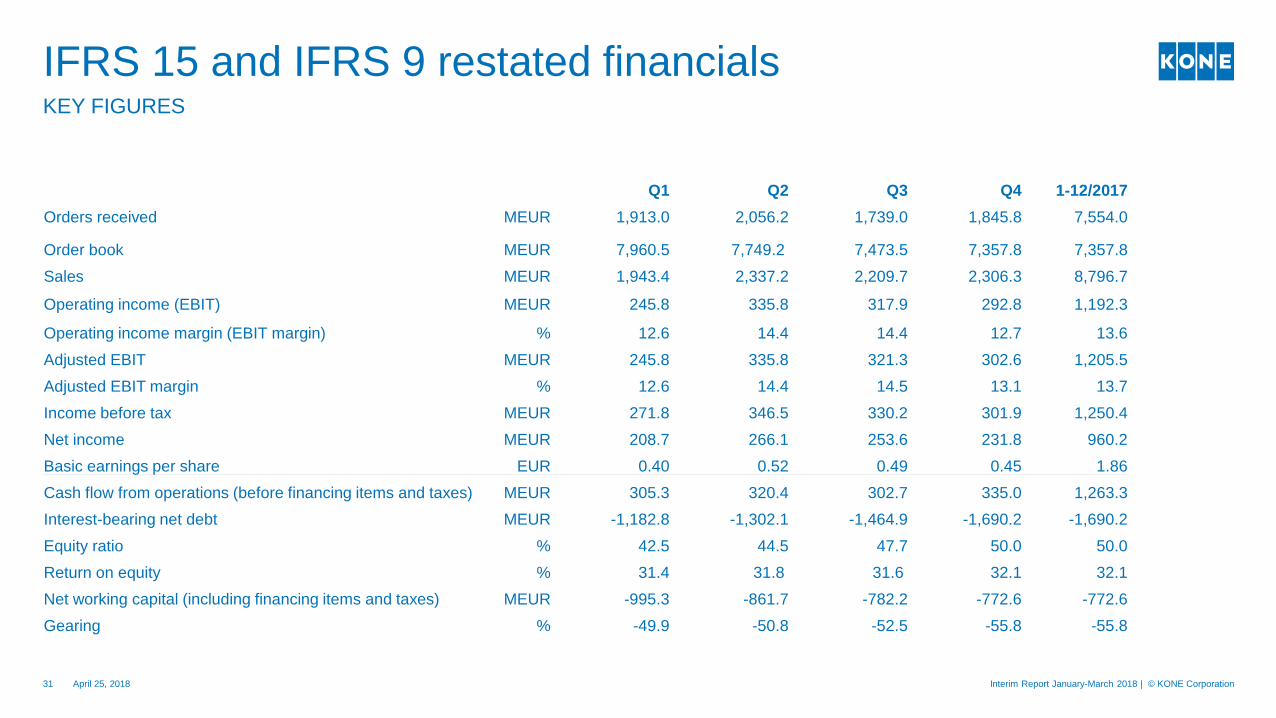
Q1 Q2 Q3 Q4 1-12/2017
Orders received MEUR 1,913.0 2,056.2 1,739.0 1,845.8 7,554.0
Order book MEUR 7,960.5 7,749.2 7,473.5 7,357.8 7,357.8
Sales MEUR 1,943.4 2,337.2 2,209.7 2,306.3 8,796.7
Operating income (EBIT) MEUR 245.8 335.8 317.9 292.8 1,192.3
Operating income margin (EBIT margin) % 12.6 14.4 14.4 12.7 13.6
Adjusted EBIT MEUR 245.8 335.8 321.3 302.6 1,205.5
Adjusted EBIT margin % 12.6 14.4 14.5 13.1 13.7
Income before tax MEUR 271.8 346.5 330.2 301.9 1,250.4
Net income MEUR 208.7 266.1 253.6 231.8 960.2
Basic earnings per share EUR 0.40 0.52 0.49 0.45 1.86
Cash flow from operations (before financing items and taxes) MEUR 305.3 320.4 302.7 335.0 1,263.3
Interest-bearing net debt MEUR -1,182.8 -1,302.1 -1,464.9 -1,690.2 -1,690.2
Equity ratio % 42.5 44.5 47.7 50.0 50.0
Return on equity % 31.4 31.8 31.6 32.1 32.1
Net working capital (including financing items and taxes) MEUR -995.3 -861.7 -782.2 -772.6 -772.6
Gearing % -49.9 -50.8 -52.5 -55.8 -55.8
April 25, 2018 Interim Report January-March 2018 | © KONE Corporation31
KEY FIGURES
IFRS 15 and IFRS 9 restated financials