KNOXVILLE UTILITIES BOARD - KUB2012+-+A133+KUB...Knoxville Utilities Board Management’s Discussion...
277
Knoxville Utilities Board Consolidated Financial Statements and Supplemental Information June 30, 2012 and 2011
Transcript of KNOXVILLE UTILITIES BOARD - KUB2012+-+A133+KUB...Knoxville Utilities Board Management’s Discussion...
Knoxville Utilities Board Consolidated Financial Statements and Supplemental Information June 30, 2012 and 2011
Knoxville Utilities Board Index June 30, 2012 and 2011
Page(s)
Independent Auditors’ Report ................................................................................................ 1-2
Management’s Discussion and Analysis .................................................................................. 3-19
Financial Statements
Consolidated Statements of Net Assets ................................................................................ 20-21
Consolidated Statements of Revenues, Expenses and Changes in Net Assets ........................ 22
Consolidated Statements of Cash Flows .................................................................................... 23
Notes to Consolidated Financial Statements ......................................................................... 24-42
Required Supplementary Information – Schedule of Funding Progress ..................................... 43
Supplemental Information
Schedule 1 – Schedule of Expenditures of Federal Awards ...................................................... 44
Schedule 2 – Schedule of Findings and Questioned Costs ........................................................ 45
Schedule 3 – Schedule of Insurance in Force ............................................................................ 46
Report of Independent Auditors on Internal Control over Financial Reporting and on Compliance and Other Matters Based on an Audit of Financial Statements Performed in Accordance with Government Auditing Standards .......................................................... 47-48 Report of Independent Auditors Report on Compliance with Requirements that could have a Direct Material Effect on each Major Program and on Internal Control over Compliance in Accordance with OMB Circular A-133 ...................................................... 49-50
Knoxville Utilities Board Management’s Discussion and Analysis June 30, 2012 and 2011
3
Knoxville Utilities Board (KUB), comprised of the Electric Division, Gas Division, Water Division, and Wastewater Division (Divisions), is reported as a component unit enterprise fund in the financial statements of the City of Knoxville. KUB's responsibility is to oversee the purchase, production, distribution, and processing of electricity, water, natural gas, and wastewater services. A seven-member Board of Commissioners governs KUB. The Board has all powers to construct, acquire, expand, or operate the Divisions. It has full control and complete jurisdiction over the management and operation of the Divisions including setting rates. KUB's accounts are maintained in conformity with the Uniform System of Accounts of the Federal Energy Regulatory Commission (FERC), the Uniform System of Accounts of the National Association of Regulatory Utility Commissioners (NARUC), and the Governmental Accounting Standards Board (GASB), as applicable. This discussion and analysis is designed to (a) assist the reader in focusing on significant financial issues, (b) provide an overview of KUB’s financial activity, (c) identify major changes in KUB’s financial position, and (d) identify any financial concerns. The Management Discussion and Analysis (“MD&A”) focuses on the fiscal year ending June 30, 2012 activities, resulting changes and current known facts, and should be read in conjunction with KUB’s consolidated financial statements.
Consolidated Highlights Financial Highlights Net assets increased $26.3 million or 3.3 percent in fiscal year 2012, compared to a $27.7 million increase last fiscal year. Operating revenue decreased $28.9 million or 4 percent, the net result of a decline in sales volumes for all four utility systems, the flow through of higher wholesale power rates to KUB’s retail electric customers, additional revenue from electric, water, and wastewater rate increases, and the flow through of lower wholesale natural gas rates to KUB’s gas customers. Purchased energy expense (power and natural gas) decreased $27.2 million or 5.6 percent. Margin from sales (operating revenue less purchased energy expense) was down $1.7 million or 0.7 percent compared with the prior fiscal year. Operating expenses (excluding purchased power and purchased gas expense) decreased $1.5 million, or 0.8 percent. Operating and maintenance (O&M) expenses declined $4.1 million or 3.6 percent. Depreciation and amortization expense increased $2 million or 4.4 percent. Taxes and tax equivalents increased $0.6 million or 2.5 percent. Lower interest rates on contingency reserve investments resulted in a $0.4 million decrease in interest income. Interest expense increased $1.8 million or 5.7 percent, due to the issuance of $25 million in water revenue bonds during the fiscal year and a full year of interest on $112 million of debt issued the previous year. These items contributed to a net decrease in non-operating revenues (expenses) of $2.1 million compared to the prior year. Capital contributions increased $0.9 million, the result of growth in contributed assets from developers due to new construction in the water and wastewater service areas.
Total plant assets (net) increased $97.6 million or 7.7 percent over the last fiscal year. In December 2011, the Water Division issued $25 million of new long-term debt to fund capital system improvements.
Knoxville Utilities Board Management’s Discussion and Analysis June 30, 2012 and 2011
4
In April 2012, $94.6 million of outstanding debt was refunded, which will result in a cost savings of $15.4 million over the term of the debt ($12.3 million on a net present value basis). As a result of the refunding, the principal owed was reduced by $5.7 million. Long-term debt represented 47 percent of KUB’s capital structure, compared to 47.9 percent last year. Capital structure equals long-term debt (including the current portion of revenue bonds and notes, as applicable, due to be retired next fiscal year), plus net assets. Other Highlights As of June 30, 2012, KUB served 442,500 customers. During the year, 2,700 new customers were added, representing growth of less than 1 percent. A historically mild winter had a significant impact on energy sales for fiscal year 2012. The winter was 23 percent warmer than normal and, as a result, electric sales volumes were 4.6 percent lower than the prior fiscal year and natural gas sales volumes were 13.3 percent lower. KUB refunded $94.6 million in outstanding bonds at lower interest rates, which will provide debt service savings of $15.4 million over the life of the bonds. KUB achieved its goal of reducing full-time staffing to 875 full-time employees by June 30, 2012. KUB’s full-time staffing level as of fiscal year-end was 872. The staffing goal was a key component of KUB’s recession response plan, which was initiated in January 2009. Prior to setting this goal, KUB’s long-term staffing plan anticipated 980 full-time employees by June 2012. Achieving the goal will provide approximately $5 million in annual savings. Two historic storm events, with combined restoration costs of $8.4 million, impacted the KUB electric system during fiscal year 2011. KUB received $4.2 million in reimbursements from the Federal Emergency Management Agency (FEMA) during fiscal year 2012. KUB anticipates an additional $2.1 million in reimbursements from FEMA in fiscal year 2013. KUB was awarded a grant from the Department of Energy in October 2009 through the DOE’s Smart Grid Investment Grant Program. The grant, which totals $3.58 million, will be used to help fund a smart grid pilot project in the University of Tennessee and surrounding areas. The pilot includes the installation of over 6,000 digital electronic smart meters and an advanced metering infrastructure (AMI) communications backbone, which will provide coverage for KUB’s entire service territory. The communications infrastructure will enable KUB to remotely read meters, and also provide remote service connection/disconnection capabilities. The term of the pilot is approximately three years. During fiscal year 2012, KUB installed the AMI communication backbone. The grant funded $2.1 million of pilot expenditures for fiscal year 2012. Each of KUB’s four wastewater treatment plants received an award from the National Association of Clean Water Agencies for outstanding permit compliance in 2011. KUB also received a National Biosolids Partnership certification in December 2011 following an independent review and audit (Biosolids are nutrient-rich organic matter produced by wastewater treatment that can be recycled as fertilizer).
Knoxville Utilities Board Management’s Discussion and Analysis June 30, 2012 and 2011
5
Century II Infrastructure Program
In 2007 KUB launched Century II, a new infrastructure management program, which included the assessment of each utility system’s infrastructure and the appropriateness of current life cycle replacement programs. KUB placed it’s electric and water Century II programs on hold in 2009 in response to the economic recession in an effort to help customers struggling in a difficult economy. Although major increases to infrastructure replacement funding were delayed, significant investments were made to maintain reliability and system integrity. In April 2011, management provided an updated assessment of the overall condition of each utility system’s infrastructure to the KUB Board of Commissioners. The assessment concluded that current funding levels were appropriate to support the natural gas system infrastructure replacement program and the wastewater capital program, however, given the critical infrastructure needs of the electric and water distribution systems, management recommended the KUB Board endorse a plan to resume the Century II electric and water programs in fiscal year 2012. A ten-year funding plan was developed to support the implementation of the electric and water Century II programs, including a combination of rate increases and debt issues to fully fund the programs for the next ten years. In September 2011, the Board adopted a resolution, which endorsed the Century II electric and water programs and the associated ten-year funding plans. The resolution also adopted the initial three electric and water rate increases, the first of which were effective October 1, 2011, and January 1, 2012, respectively. Each of the electric rate increases will generate an additional $5 million in annual electric sales revenue. For residential electric customers this will result in an increase of $1 in their monthly electric bills for each of the rate increases. Each of the water rate increases will generate an additional $1.7 million in annual water sales revenue. For residential water customers this will result in an increase of $1 in their monthly water bills for each of the rate increases. With Board approval, KUB immediately began implementing the accelerated pace of infrastructure replacement for the electric and water systems. For the fiscal year ended June 30, 2012, KUB exceeded its target replacement levels for all of its Century II programs, while maintaining its overall capital budget. For the electric system, 2,800 poles were replaced, exceeding the target level of 2,300; 17.5 miles of underground electric cable were replaced, exceeding the target level of 12.5 miles. For the water system, 11.5 miles of galvanized water main were replaced, exceeding the target level of 10 miles; 4.1 miles of cast iron water main were replaced, exceeding the target level of 3.5 miles. For the natural gas system, 9.75 miles of cast iron/ductile iron gas main were replaced, exceeding the target level of 8 miles. For the wastewater system, 29 miles of wastewater system main were rehabilitated or replaced, exceeding the target level of 25 miles. Consent Decree In February 2005, a Consent Decree was entered into federal court regarding the operation of KUB’s wastewater system. Under the terms of the Consent Decree, the remediation of identified sanitary sewer overflows (“SSOs”) on KUB’s wastewater system must be completed by June 30, 2016. KUB anticipates the Division will spend approximately $530 million in capital investments in order to comply with the terms of the Consent Decree related to the collection system. The Consent Decree also required KUB to perform an evaluation of the wet-weather performance and capacity of its wastewater treatment plants. In July 2007, KUB submitted a Composite Correction Plan (CCP) for its wastewater treatment plants to EPA for review. The development and filing of the CCP was a requirement of the federal order of February 2005. The CCP includes recommended improvements to KUB’s Kuwahee and Fourth Creek treatment plants to address wet weather capacity issues noted in prior assessments. The EPA approved the CCP in January 2009 including a recommended schedule of plant improvements that extends beyond the expiration date of the original Consent Decree. An amendment to the Consent Decree incorporating and establishing this schedule was agreed to by all parties and was entered on June 23, 2009. The
Knoxville Utilities Board Management’s Discussion and Analysis June 30, 2012 and 2011
6
purpose of the Amendment is to allow KUB to complete a portion of work outlined in the CCP after the Consent Decree deadline of June 30, 2016. The CCP provides for a biologically enhanced high-rate clarification (the “BEHRC”) secondary treatment system to be installed at the Fourth Creek treatment plant by June 30, 2018 and at the Kuwahee treatment plant by June 30, 2021. The total cost of such improvements is estimated to be approximately $120 million. KUB’s total estimated capital investment to comply with the terms of the Consent Decree is $650 million. During fiscal year 2006, KUB launched the Private Lateral Program (PLP), as required by the Consent Decree, under which KUB tests private collection system laterals on its wastewater system over a ten-year period. Defective laterals and improper connections can introduce rainwater overloading the wastewater system and add pollution to area waterways. If a private lateral fails the respective inspection test, then the customer is required to have the lateral repaired/replaced within a specified time period. The $2 million SEP provides funding for lateral repairs/replacements for eligible low-income customers. All of the SEP funds were disbursed as of April 2012. KUB’s funding plan for the Consent Decree includes approximately $680 million in bond issues through June 2021 plus a series of rate increases phased in over the term of the order. Bond proceeds fund all wastewater capital projects, the majority of which are related to the Consent Decree. As of June 30, 2012, the Wastewater Division had issued $360 million in bonds to fund system capital improvements since the inception of the Consent Decree. The KUB Board of Commissioners approved two 50 percent rate increases, which went into effect in April 2005 and January 2007, respectively. The Board also approved an 8 percent rate increase, which was effective in September 2008, and a 12 percent rate increase, which was effective in April 2011. The Board also adopted a 12 percent rate increase to be effective October 2012. KUB anticipates additional bond issues and rate increases over the next decade to help fund PACE 10. KUB continues to be in compliance with Consent Decree requirements. In August 2004, KUB launched PACE 10, an accelerated ten-year program to help improve Knoxville’s waterways, the quality of life, and the economic well being of the community. As part of the PACE 10 program, KUB has installed storage tanks providing 34 million gallons of wastewater storage to control wet-weather overflows and rehabilitated or replaced approximately 203 miles of collection system pipe. KUB also continues to maintain a proactive operations and maintenance plan for the wastewater collection system including inspection, cleaning, grease control, and private lateral enforcement. The result of the PACE 10 program has been a substantial reduction in sanitary sewer overflows.
During fiscal year 2012, the Wastewater Division incurred $60.5 million in total expenditures related to Consent Decree requirements, including $3.7 million for operating costs and $56.8 million in capital improvements. During the fiscal year, $20.4 million was spent on sewer mini-basin rehab and replacement. Trunk line replacement and rehabilitation accounted for $17 million of capital expenditures during the fiscal year. Upgrades currently in progress at the Kuwahee and Fourth Creek Treatment Facilities accounted for $11.8 million of fiscal year 2012 capital expenditures. As of June 30, 2012, the Wastewater Division had spent $371.5 million in capital investments to meet the requirements of the Consent Decree.
Knoxville Utilities Board Management’s Discussion and Analysis June 30, 2012 and 2011
7
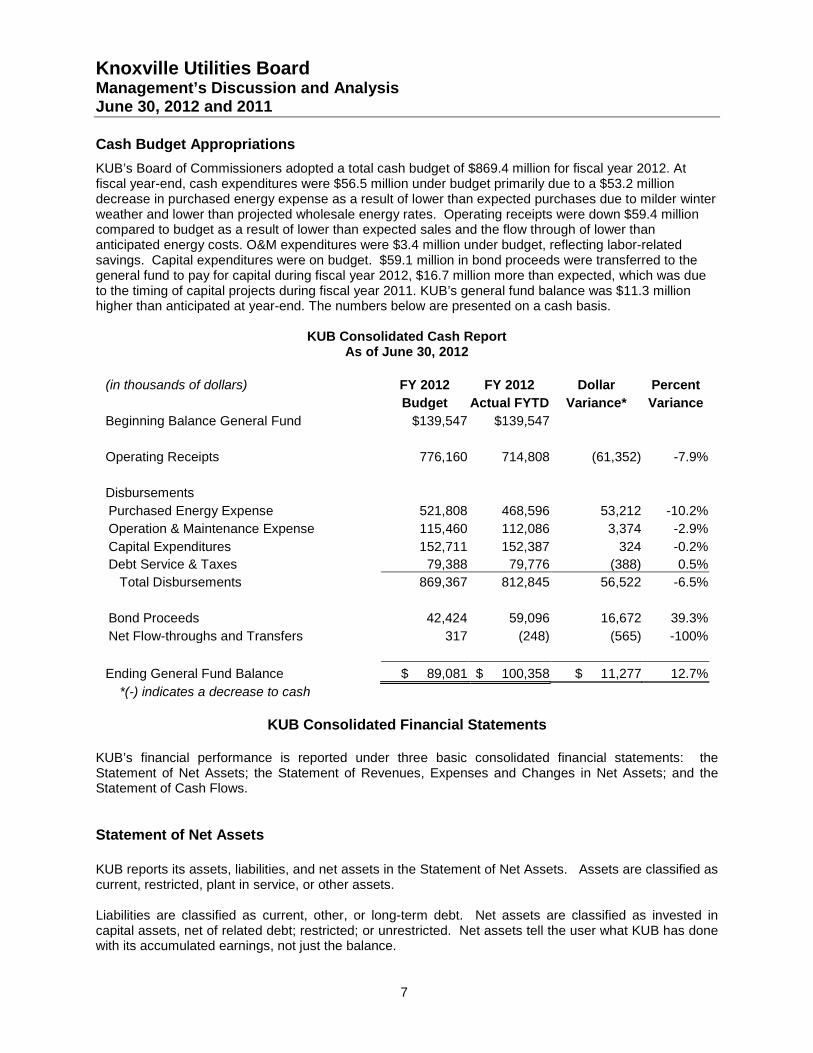
Cash Budget Appropriations KUB’s Board of Commissioners adopted a total cash budget of $869.4 million for fiscal year 2012. At fiscal year-end, cash expenditures were $56.5 million under budget primarily due to a $53.2 million decrease in purchased energy expense as a result of lower than expected purchases due to milder winter weather and lower than projected wholesale energy rates. Operating receipts were down $59.4 million compared to budget as a result of lower than expected sales and the flow through of lower than anticipated energy costs. O&M expenditures were $3.4 million under budget, reflecting labor-related savings. Capital expenditures were on budget. $59.1 million in bond proceeds were transferred to the general fund to pay for capital during fiscal year 2012, $16.7 million more than expected, which was due to the timing of capital projects during fiscal year 2011. KUB’s general fund balance was $11.3 million higher than anticipated at year-end. The numbers below are presented on a cash basis.
KUB Consolidated Cash Report As of June 30, 2012
(in thousands of dollars) FY 2012 FY 2012 Dollar Percent Budget Actual FYTD Variance* Variance Beginning Balance General Fund $139,547 $139,547 Operating Receipts 776,160 714,808 (61,352) -7.9% Disbursements Purchased Energy Expense 521,808 468,596 53,212 -10.2% Operation & Maintenance Expense 115,460 112,086 3,374 -2.9% Capital Expenditures 152,711 152,387 324 -0.2% Debt Service & Taxes 79,388 79,776 (388) 0.5% Total Disbursements 869,367 812,845 56,522 -6.5% Bond Proceeds 42,424 59,096 16,672 39.3% Net Flow-throughs and Transfers 317 (248) (565) -100% Ending General Fund Balance $ 89,081 $ 100,358 $ 11,277 12.7%
*(-) indicates a decrease to cash
KUB Consolidated Financial Statements KUB’s financial performance is reported under three basic consolidated financial statements: the Statement of Net Assets; the Statement of Revenues, Expenses and Changes in Net Assets; and the Statement of Cash Flows. Statement of Net Assets KUB reports its assets, liabilities, and net assets in the Statement of Net Assets. Assets are classified as current, restricted, plant in service, or other assets. Liabilities are classified as current, other, or long-term debt. Net assets are classified as invested in capital assets, net of related debt; restricted; or unrestricted. Net assets tell the user what KUB has done with its accumulated earnings, not just the balance.
Knoxville Utilities Board Management’s Discussion and Analysis June 30, 2012 and 2011
8
Invested in capital assets, net of related debt, reflects the book value of all capital assets less the outstanding balances of debt used to acquire, construct, or improve those assets. Restricted net assets are assets that have been limited to specific uses by KUB’s bond covenants or through resolutions passed by the KUB Board of Commissioners. Unrestricted net assets are a residual classification; the amount remaining after reporting net assets as either invested in capital or restricted is reported there. Statement of Revenues, Expenses and Changes in Net Assets KUB reports its revenues and expenses (both operating and non-operating) on the Statement of Revenues, Expenses and Changes in Net Assets. In addition, any capital contributions or assets donated by developers are reported on this statement. Total revenue less total expense equals the change in net assets for the reporting period. Net assets at the beginning of the period is increased or decreased, as applicable, by the change in net assets for the reporting period. The change in net assets for the reporting period is added to the net assets segment of the Statement of Net Assets. Statement of Cash Flows KUB reports cash flows from operating activities, capital and related-financing activities, and investing activities on the Statement of Cash Flows. This statement tells the user the sources and uses of cash during the reporting period. The statement indicates the beginning cash balance and ending cash balance and the means by which it was either increased or decreased during the reporting period. The statement also reconciles cash flow to operating income as it appears on the Statement of Revenues, Expenses and Changes in Net Assets.
Knoxville Utilities Board Management’s Discussion and Analysis June 30, 2012 and 2011
9
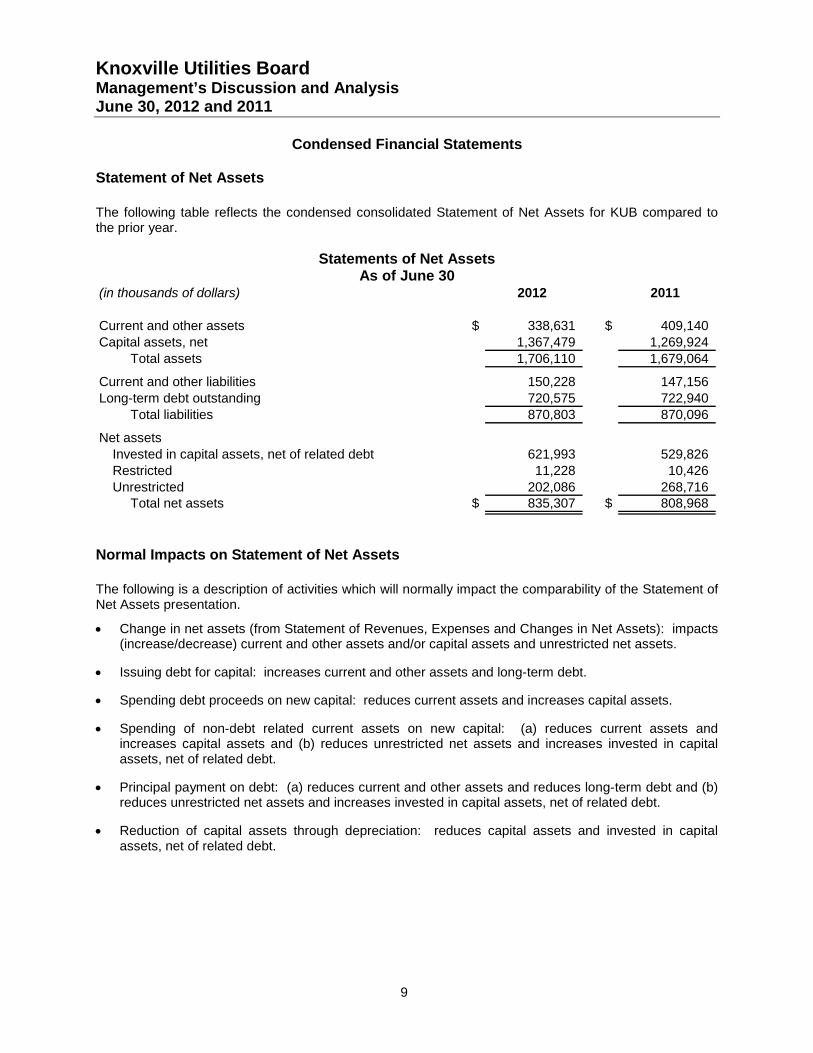
Condensed Financial Statements Statement of Net Assets The following table reflects the condensed consolidated Statement of Net Assets for KUB compared to the prior year.
Statements of Net Assets As of June 30
(in thousands of dollars) 2012 2011
Current and other assets $ 338,631 $ 409,140 Capital assets, net 1,367,479 1,269,924
Total assets 1,706,110 1,679,064
Current and other liabilities 150,228 147,156 Long-term debt outstanding 720,575 722,940
Total liabilities 870,803 870,096
Net assetsInvested in capital assets, net of related debt 621,993 529,826 Restricted 11,228 10,426 Unrestricted 202,086 268,716
Total net assets $ 835,307 $ 808,968
Normal Impacts on Statement of Net Assets The following is a description of activities which will normally impact the comparability of the Statement of Net Assets presentation.
• Change in net assets (from Statement of Revenues, Expenses and Changes in Net Assets): impacts (increase/decrease) current and other assets and/or capital assets and unrestricted net assets.
• Issuing debt for capital: increases current and other assets and long-term debt.
• Spending debt proceeds on new capital: reduces current assets and increases capital assets.
• Spending of non-debt related current assets on new capital: (a) reduces current assets and increases capital assets and (b) reduces unrestricted net assets and increases invested in capital assets, net of related debt.
• Principal payment on debt: (a) reduces current and other assets and reduces long-term debt and (b) reduces unrestricted net assets and increases invested in capital assets, net of related debt.
• Reduction of capital assets through depreciation: reduces capital assets and invested in capital assets, net of related debt.
Knoxville Utilities Board Management’s Discussion and Analysis June 30, 2012 and 2011
10
Current Year Impacts and Analysis
Current and Other Assets Current and other assets decreased $70.5 million or 17.2 percent. General fund cash (including cash and cash equivalents, short-term investments, and long-term investments) decreased $39.2 million or 28.1 percent, due to the use of general fund cash to fund a portion of the year’s capital improvements. Accounts receivable was $9 million or 17.8 percent lower than last year, partially due to lower June sales in all divisions compared to the prior year. The cost of gas in storage rose $3 million or 27.2 percent, due to an increase in the volume of stored gas compared to last year. The total of unused bond proceeds, $13.8 million, represented the remainder of $25 million in water bonds issued in December 2011. During fiscal year 2012, $47.8 million of unused proceeds available at the end of the prior year were expended to fund capital system improvements in the Electric, Gas, and Wastewater Divisions. This amount contributed to the overall decrease in restricted assets.
In the previous fiscal year, KUB instituted a deferred accounting component to its Purchased Power Adjustment to ensure appropriate cost recovery over the long-term. As of June 30, 2012, KUB had under recovered $17.7 million in wholesale power costs, which reflected a $1.7 million increase in net assets compared to the prior year. This under recovery of wholesale power costs will be recovered from KUB’s electric customers through future adjustments to electric rates via the Purchased Power Adjustment.
The Gas Division under recovered $3.9 million in wholesale gas costs from its customers in fiscal year 2012, as compared to a $1.1 million over recovery in fiscal year 2011. This under recovery of costs will be flowed back to gas customers next fiscal year through adjustments to natural gas rates via the Purchased Gas Adjustment. The net effect was a $2.8 million addition in assets.
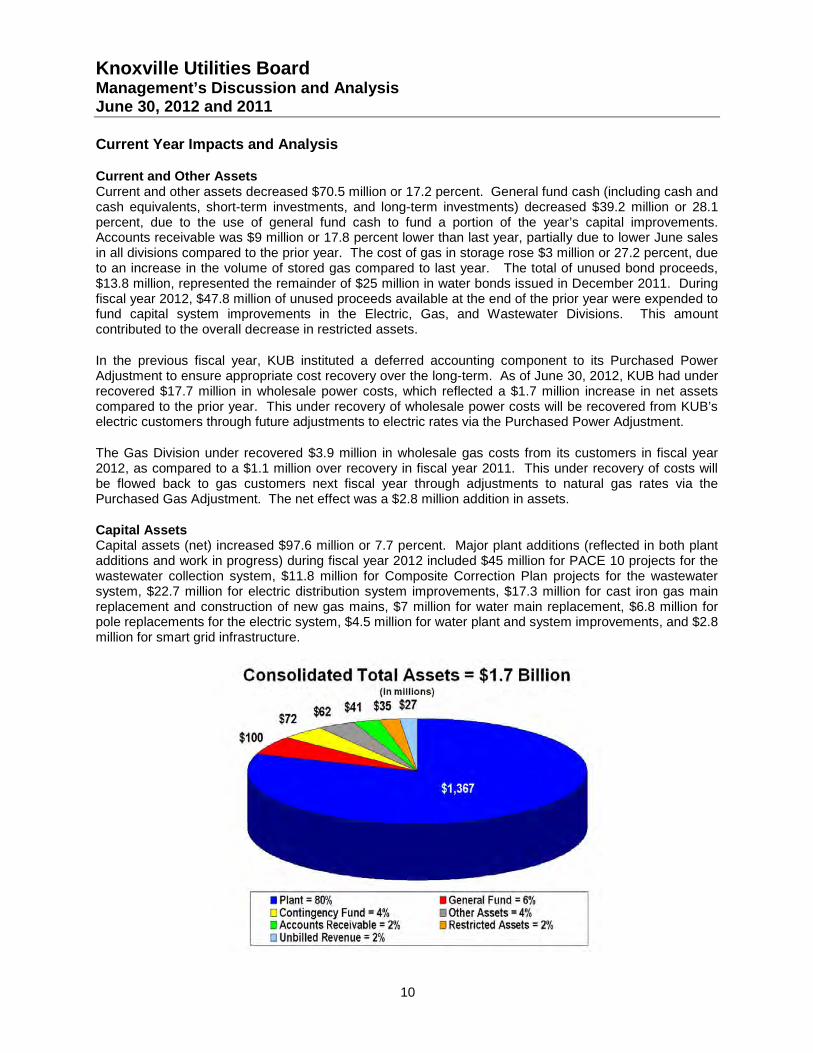
Capital Assets Capital assets (net) increased $97.6 million or 7.7 percent. Major plant additions (reflected in both plant additions and work in progress) during fiscal year 2012 included $45 million for PACE 10 projects for the wastewater collection system, $11.8 million for Composite Correction Plan projects for the wastewater system, $22.7 million for electric distribution system improvements, $17.3 million for cast iron gas main replacement and construction of new gas mains, $7 million for water main replacement, $6.8 million for pole replacements for the electric system, $4.5 million for water plant and system improvements, and $2.8 million for smart grid infrastructure.
Knoxville Utilities Board Management’s Discussion and Analysis June 30, 2012 and 2011
11
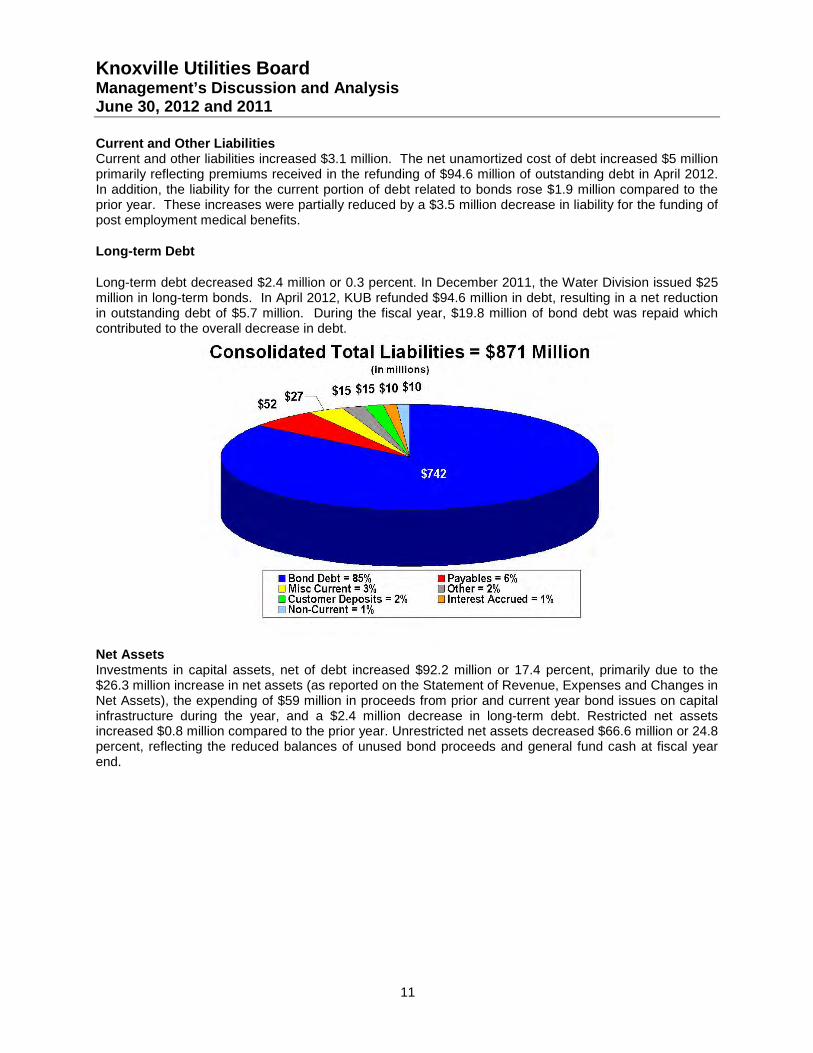
Current and Other Liabilities Current and other liabilities increased $3.1 million. The net unamortized cost of debt increased $5 million primarily reflecting premiums received in the refunding of $94.6 million of outstanding debt in April 2012. In addition, the liability for the current portion of debt related to bonds rose $1.9 million compared to the prior year. These increases were partially reduced by a $3.5 million decrease in liability for the funding of post employment medical benefits.
Long-term Debt
Long-term debt decreased $2.4 million or 0.3 percent. In December 2011, the Water Division issued $25 million in long-term bonds. In April 2012, KUB refunded $94.6 million in debt, resulting in a net reduction in outstanding debt of $5.7 million. During the fiscal year, $19.8 million of bond debt was repaid which contributed to the overall decrease in debt.
Net Assets Investments in capital assets, net of debt increased $92.2 million or 17.4 percent, primarily due to the $26.3 million increase in net assets (as reported on the Statement of Revenue, Expenses and Changes in Net Assets), the expending of $59 million in proceeds from prior and current year bond issues on capital infrastructure during the year, and a $2.4 million decrease in long-term debt. Restricted net assets increased $0.8 million compared to the prior year. Unrestricted net assets decreased $66.6 million or 24.8 percent, reflecting the reduced balances of unused bond proceeds and general fund cash at fiscal year end.
Knoxville Utilities Board Management’s Discussion and Analysis June 30, 2012 and 2011
12
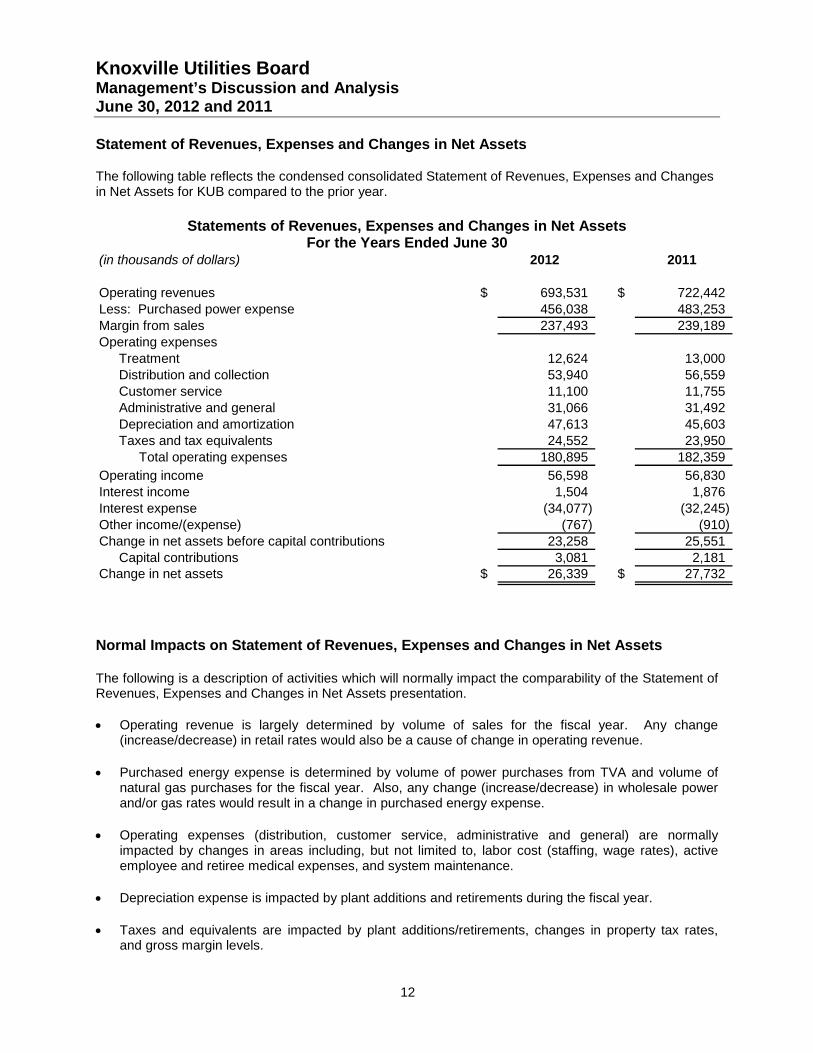
Statement of Revenues, Expenses and Changes in Net Assets
The following table reflects the condensed consolidated Statement of Revenues, Expenses and Changes in Net Assets for KUB compared to the prior year.
Statements of Revenues, Expenses and Changes in Net Assets For the Years Ended June 30
(in thousands of dollars) 2012 2011
Operating revenues $ 693,531 $ 722,442 Less: Purchased power expense 456,038 483,253 Margin from sales 237,493 239,189 Operating expenses
Treatment 12,624 13,000 Distribution and collection 53,940 56,559 Customer service 11,100 11,755 Administrative and general 31,066 31,492 Depreciation and amortization 47,613 45,603 Taxes and tax equivalents 24,552 23,950
Total operating expenses 180,895 182,359 Operating income 56,598 56,830 Interest income 1,504 1,876 Interest expense (34,077) (32,245) Other income/(expense) (767) (910) Change in net assets before capital contributions 23,258 25,551
Capital contributions 3,081 2,181 Change in net assets $ 26,339 $ 27,732
Normal Impacts on Statement of Revenues, Expenses and Changes in Net Assets The following is a description of activities which will normally impact the comparability of the Statement of Revenues, Expenses and Changes in Net Assets presentation. • Operating revenue is largely determined by volume of sales for the fiscal year. Any change
(increase/decrease) in retail rates would also be a cause of change in operating revenue.
• Purchased energy expense is determined by volume of power purchases from TVA and volume of natural gas purchases for the fiscal year. Also, any change (increase/decrease) in wholesale power and/or gas rates would result in a change in purchased energy expense.
• Operating expenses (distribution, customer service, administrative and general) are normally impacted by changes in areas including, but not limited to, labor cost (staffing, wage rates), active employee and retiree medical expenses, and system maintenance.
• Depreciation expense is impacted by plant additions and retirements during the fiscal year.
• Taxes and equivalents are impacted by plant additions/retirements, changes in property tax rates, and gross margin levels.
Knoxville Utilities Board Management’s Discussion and Analysis June 30, 2012 and 2011
13
• Interest income is impacted by level of interest rates and investments.
• Interest expense on debt is impacted by level of outstanding debt and the interest rate(s) on the outstanding debt.
• Other income/(expenses) is impacted by non-operating revenues, netted against miscellaneous non-operating expenses.
• Capital contributions are impacted by a donation of facilities/infrastructure to KUB by developers and governmental agencies. The contributions are recognized as revenue and recorded as plant in service based on the fair market value of the asset(s).
Current Year Impacts and Analysis Net assets increased $26.3 million, compared to a $27.7 million increase last fiscal year. Operating revenue declined $28.9 million or 4 percent for the fiscal year ending June 30, 2012. Electric Division operating revenue decreased $15.5 million, the net result of a 4.6 percent decline in sales volumes, additional revenue from a one percent electric margin rate increase, and the flow through of higher wholesale power rates. Gas Division revenue decreased $19.5 million or 18.4 percent for the fiscal year, the result of lower wholesale gas prices, which flowed through to KUB’s gas customers, and a 13.3 percent decline in natural gas sales volumes. Water Division revenue increased $1.1 million or 2.9 percent, the result of additional revenue from a five percent rate increase, which was effective January 2012. Wastewater Division revenue was $4.7 million higher than the previous year, reflecting a full year of revenue from a twelve percent rate increase effective April 2011.
Wholesale energy expense decreased $27.2 million or 5.6 percent. Both purchased power and natural gas volumes were significantly impacted by the mildest winter in KUB’s service territory in 25 years. Purchased power expense decreased $14.6 million compared to last year, the net result of higher wholesale power rates and lower sales volumes. Purchased gas cost fell $13 million, the combined result of a decline in sales volumes and lower wholesale natural gas prices.
Margin from sales (operating revenue less purchased energy expense) declined $1.7 million compared to the previous year, the net result of lower billed sales volumes in all divisions, a full year of margin from the prior year wastewater rate increase, and a partial year’s revenue from the electric and water rate increases.
Operating Expenses
Operating expenses (excluding wholesale purchased energy expense) decreased $1.5 million or 0.8 percent compared to last fiscal year.
Treatment expenses were $0.4 million or 2.9 percent lower than the prior year, reflecting a decrease in labor-related expenses.
Distribution and collection expenses decreased $2.6 million or 4.6 percent. Prior year expenditures of $3.7 million for the gas saddle inspection and replacement program and $1.7 million for electric system storm restoration for the April and June 2011 storm events (net of accrued FEMA reimbursement) offset current year increases, including higher vegetation management and facilities maintenance costs.
Customer service expenses declined $0.7 million or 5.6 percent, due to a $1.1 million decline in labor-related expenses compared with the prior year.
Knoxville Utilities Board Management’s Discussion and Analysis June 30, 2012 and 2011
14
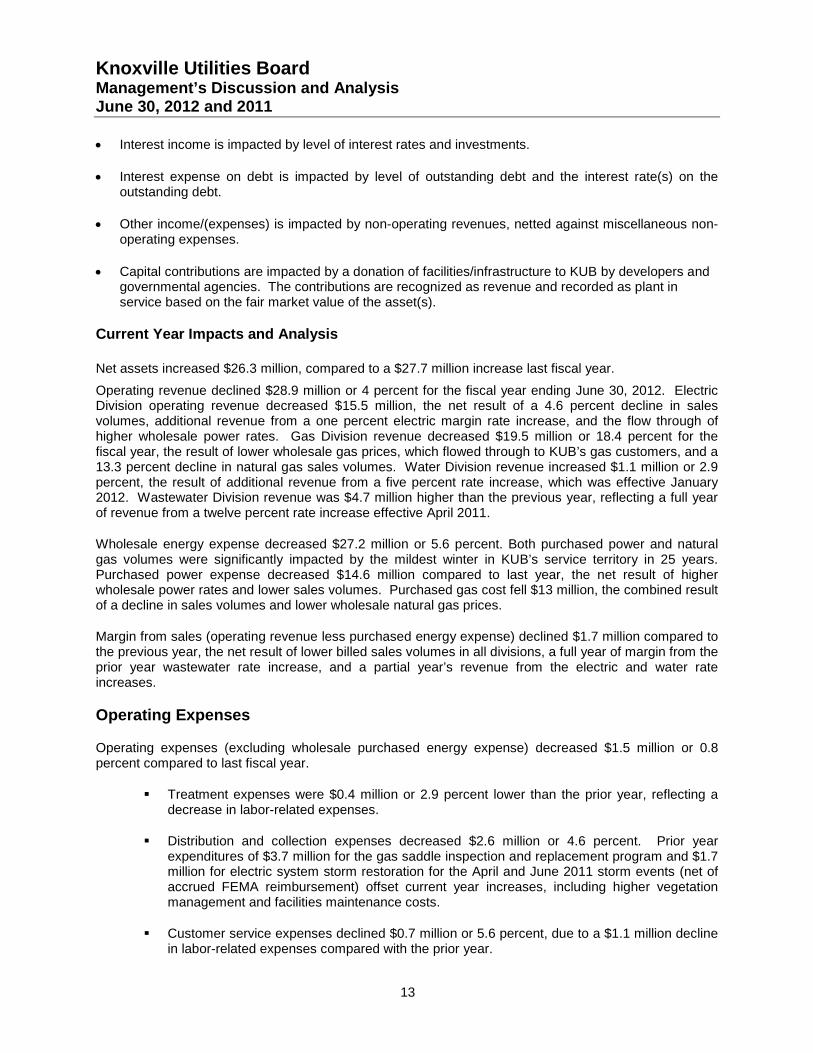
Administrative and general expenses decreased $0.4 million or 1.4 percent, due to a $0.3 million decline in labor-related expenses compared with the prior year.
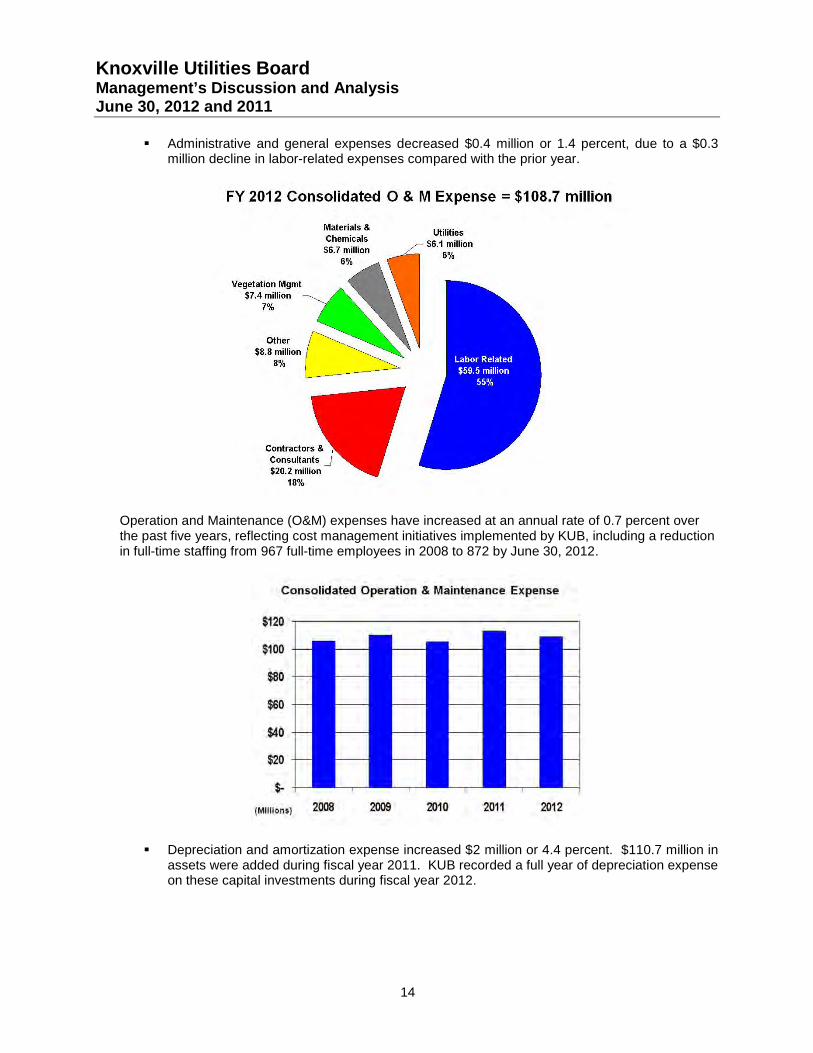
Operation and Maintenance (O&M) expenses have increased at an annual rate of 0.7 percent over the past five years, reflecting cost management initiatives implemented by KUB, including a reduction in full-time staffing from 967 full-time employees in 2008 to 872 by June 30, 2012.
Depreciation and amortization expense increased $2 million or 4.4 percent. $110.7 million in assets were added during fiscal year 2011. KUB recorded a full year of depreciation expense on these capital investments during fiscal year 2012.
Knoxville Utilities Board Management’s Discussion and Analysis June 30, 2012 and 2011
15
Taxes and tax equivalents increased $0.6 million or 2.5 percent. Tax equivalent payments to taxing jurisdictions in which KUB’s utility systems are located are based on a combination of net plant values and margin from sales. This increase was primarily due to the rise in KUB’s plant values and margin from sales in fiscal year 2011.
Interest income decreased $0.4 million or 19.8 percent due to less interest earned on investments, the result of lower interest rates.
Interest expense increased $1.8 million or 5.7 percent, reflecting interest expense on $112 million in bonds sold in December 2010 and $25 million in bonds sold in December 2011.
Other income (net) increased $0.1 million. The market value of contingency fund investments increased $0.1 million.
Capital contributions were $0.9 million higher than last fiscal year. Capital contributions for the water and wastewater systems each increased $0.6 million, while electric system contributions were down $0.3 million.
(Space left intentionally blank)
Knoxville Utilities Board Management’s Discussion and Analysis June 30, 2012 and 2011
16
Capital Assets and Debt Administration
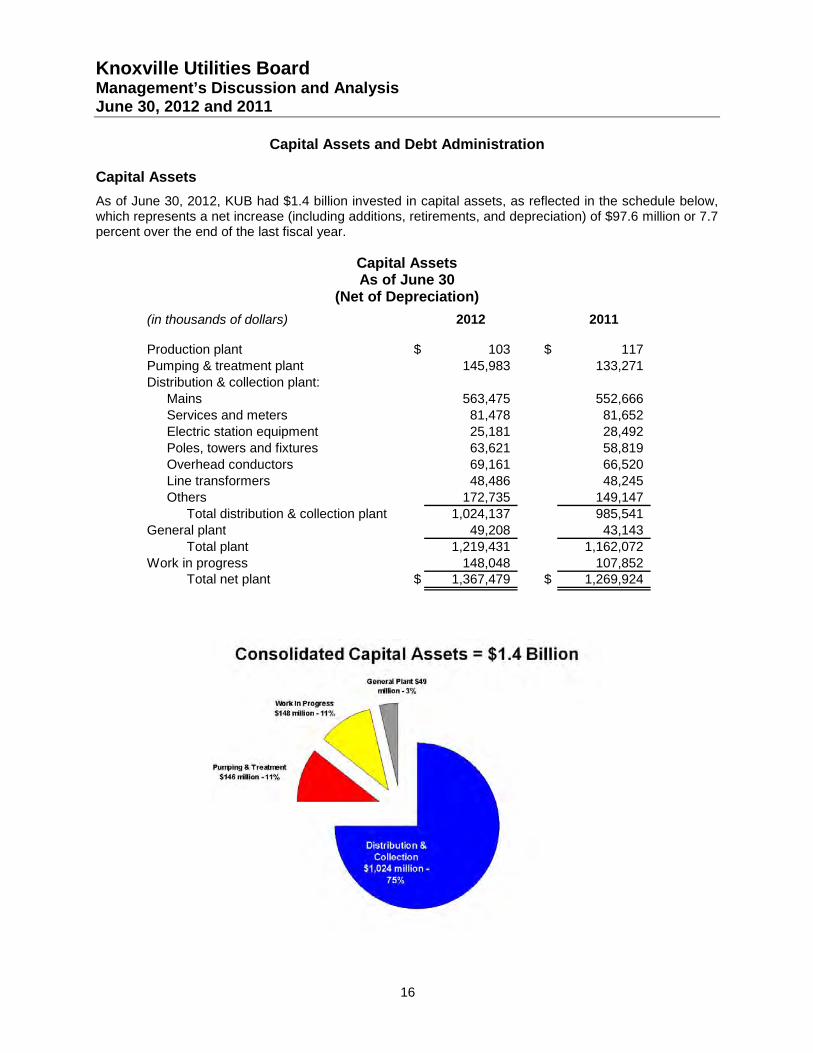
Capital Assets As of June 30, 2012, KUB had $1.4 billion invested in capital assets, as reflected in the schedule below, which represents a net increase (including additions, retirements, and depreciation) of $97.6 million or 7.7 percent over the end of the last fiscal year.
Capital Assets As of June 30
(Net of Depreciation) (in thousands of dollars) 2012 2011
Production plant $ 103 $ 117 Pumping & treatment plant 145,983 133,271 Distribution & collection plant:
Mains 563,475 552,666 Services and meters 81,478 81,652 Electric station equipment 25,181 28,492 Poles, towers and fixtures 63,621 58,819 Overhead conductors 69,161 66,520 Line transformers 48,486 48,245 Others 172,735 149,147
Total distribution & collection plant 1,024,137 985,541 General plant 49,208 43,143
Total plant 1,219,431 1,162,072 Work in progress 148,048 107,852
Total net plant $ 1,367,479 $ 1,269,924
Knoxville Utilities Board Management’s Discussion and Analysis June 30, 2012 and 2011
17
Major capital asset additions during the year were as follows: • $45 million related to PACE 10 projects. $20.4 million for sewer mini-basin rehabilitation and replacement $17 million for sewer trunk line replacement and rehabilitation $3.2 million for pump station design and construction $2.7 million for storage tank design and construction
• $11.8 million for Composite Correction Plan projects. $9.3 million for upgrades to the Kuwahee Wastewater Treatment Plant $2.5 million for upgrades at the Fourth Creek Wastewater Treatment Facility
• $22.7 million for electric distribution system improvements.
• $17.3 million for gas main replacement and construction of new mains for the gas system.
• $7 million for pipe replacement for the water system.
• $6.8 million for pole replacements for the electric system.
• $4.5 million for water plant and system improvements.
• $2.8 million for smart grid infrastructure.
(Space left intentionally blank)
Knoxville Utilities Board Management’s Discussion and Analysis June 30, 2012 and 2011
18
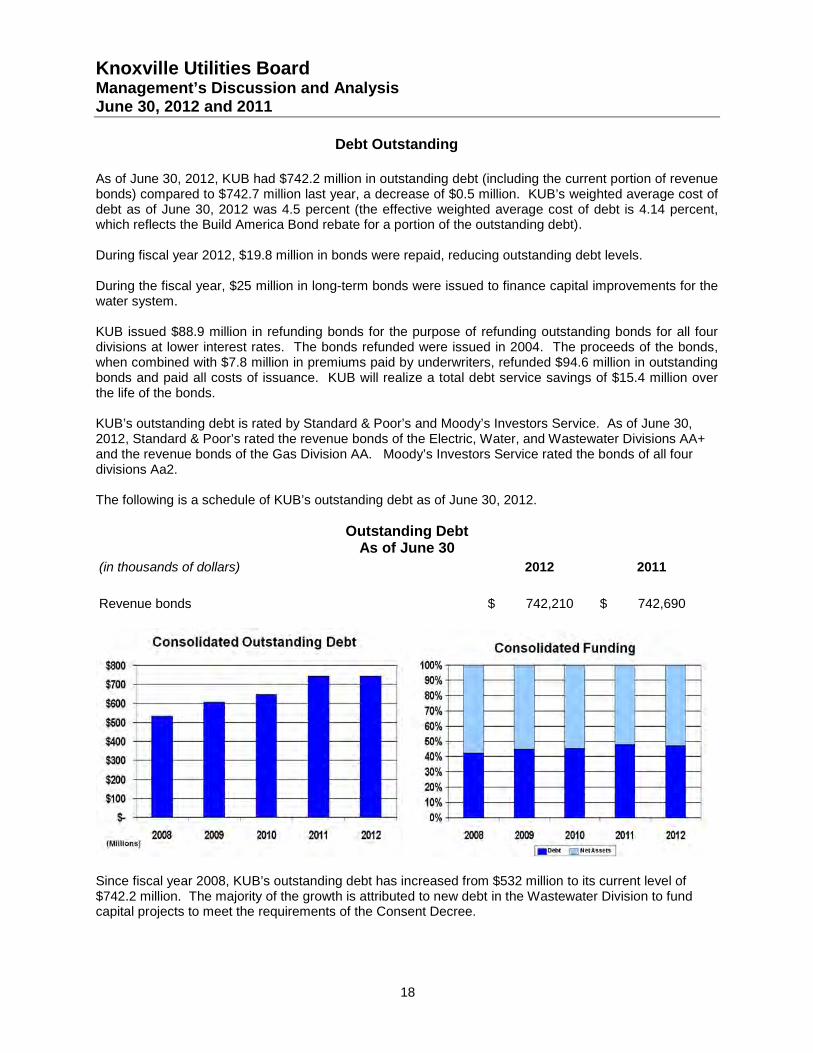
Debt Outstanding As of June 30, 2012, KUB had $742.2 million in outstanding debt (including the current portion of revenue bonds) compared to $742.7 million last year, a decrease of $0.5 million. KUB’s weighted average cost of debt as of June 30, 2012 was 4.5 percent (the effective weighted average cost of debt is 4.14 percent, which reflects the Build America Bond rebate for a portion of the outstanding debt). During fiscal year 2012, $19.8 million in bonds were repaid, reducing outstanding debt levels. During the fiscal year, $25 million in long-term bonds were issued to finance capital improvements for the water system. KUB issued $88.9 million in refunding bonds for the purpose of refunding outstanding bonds for all four divisions at lower interest rates. The bonds refunded were issued in 2004. The proceeds of the bonds, when combined with $7.8 million in premiums paid by underwriters, refunded $94.6 million in outstanding bonds and paid all costs of issuance. KUB will realize a total debt service savings of $15.4 million over the life of the bonds. KUB’s outstanding debt is rated by Standard & Poor’s and Moody’s Investors Service. As of June 30, 2012, Standard & Poor’s rated the revenue bonds of the Electric, Water, and Wastewater Divisions AA+ and the revenue bonds of the Gas Division AA. Moody’s Investors Service rated the bonds of all four divisions Aa2. The following is a schedule of KUB’s outstanding debt as of June 30, 2012.
Outstanding Debt As of June 30
(in thousands of dollars) 2012 2011
Revenue bonds $ 742,210 $ 742,690
Since fiscal year 2008, KUB’s outstanding debt has increased from $532 million to its current level of $742.2 million. The majority of the growth is attributed to new debt in the Wastewater Division to fund capital projects to meet the requirements of the Consent Decree.
Knoxville Utilities Board Management’s Discussion and Analysis June 30, 2012 and 2011
19
Impacts on Future Financial Position KUB anticipates net customer growth of 500 customers over the course of the next fiscal year. KUB expects to issue $120 million in long-term bonds during the next fiscal year to fund electric, gas, and wastewater system capital projects. In July 2012, the Gas Division issued a short-term revenue anticipation note (line of credit) for $20 million for the purpose of managing seasonal cash flow during the winter heating season. A previously adopted one percent electric rate increase, to help fund Century II electric system improvements, will be effective October 1, 2012. A previously adopted five percent water rate increase, designed to help fund Century II water system improvements, will be effective January 1, 2013. The KUB Board of Commissioners adopted a 12 percent wastewater rate increase to be effective October 1, 2012. The rate increase will raise the typical residential wastewater customer’s monthly bill $5.20. In fiscal year 2013, KUB will enter into the third year of a three-year smart grid pilot project partially funded by a grant from the Department of Energy. Looking forward to the final year of the project in fiscal year 2013, KUB will deploy conservation voltage reduction equipment on select circuits in and around the core project area. The core project area spans the University of Tennessee and Fort Sanders area. Also, KUB will deploy smart metering technology on its largest commercial and industrial customers through-out the KUB service territory.
No other facts, decisions, or conditions are currently known which would have a significant impact on KUB’s financial position or results of operations during fiscal year 2013.
Financial Contact KUB’s financial statements are designed to present users (citizens, customers, investors, and creditors) with a general overview of KUB’s financial position and results of operations for the fiscal years ending June 30, 2012 and 2011. If you have questions about the statements or need additional financial information, contact KUB’s Chief Financial Officer at 445 South Gay Street, Knoxville, Tennessee 37902.
Knoxville Utilities Board Consolidated Statements of Net Assets June 30, 2012 and 2011
20
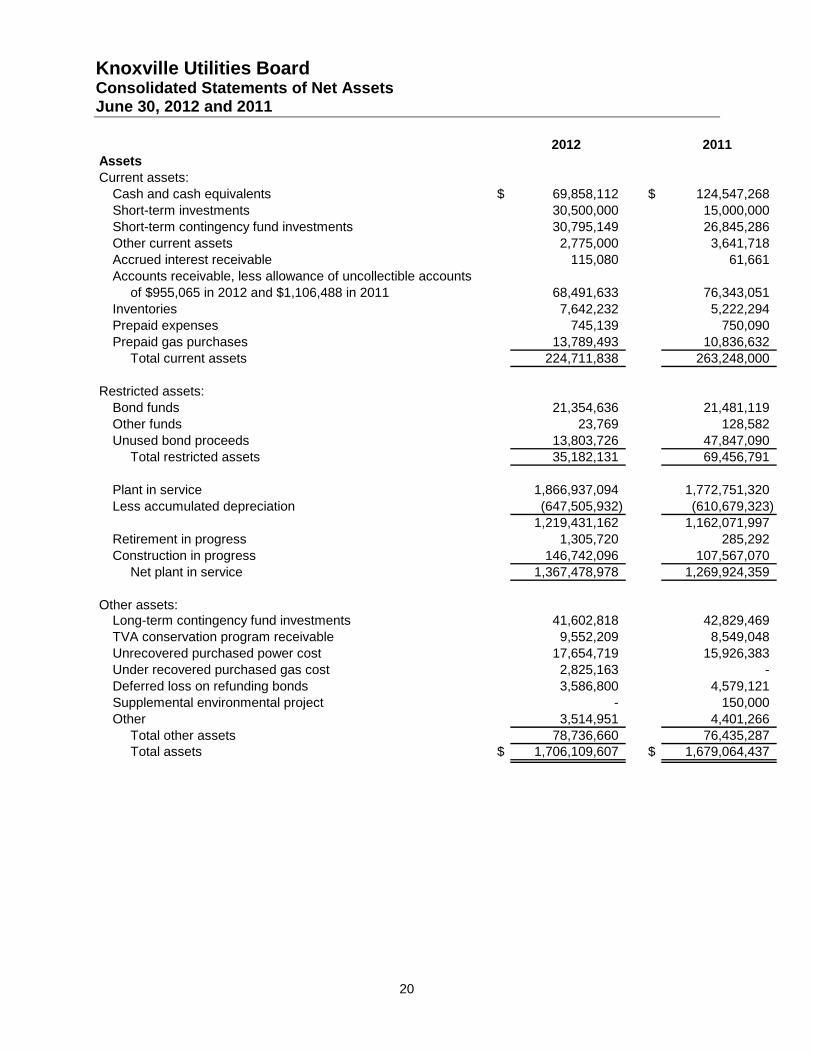
2012 2011AssetsCurrent assets:
Cash and cash equivalents $ 69,858,112 $ 124,547,268 Short-term investments 30,500,000 15,000,000 Short-term contingency fund investments 30,795,149 26,845,286 Other current assets 2,775,000 3,641,718 Accrued interest receivable 115,080 61,661 Accounts receivable, less allowance of uncollectible accounts
of $955,065 in 2012 and $1,106,488 in 2011 68,491,633 76,343,051 Inventories 7,642,232 5,222,294 Prepaid expenses 745,139 750,090 Prepaid gas purchases 13,789,493 10,836,632
Total current assets 224,711,838 263,248,000
Restricted assets:Bond funds 21,354,636 21,481,119 Other funds 23,769 128,582 Unused bond proceeds 13,803,726 47,847,090
Total restricted assets 35,182,131 69,456,791
Plant in service 1,866,937,094 1,772,751,320 Less accumulated depreciation (647,505,932) (610,679,323)
1,219,431,162 1,162,071,997 Retirement in progress 1,305,720 285,292 Construction in progress 146,742,096 107,567,070
Net plant in service 1,367,478,978 1,269,924,359
Other assets:Long-term contingency fund investments 41,602,818 42,829,469 TVA conservation program receivable 9,552,209 8,549,048 Unrecovered purchased power cost 17,654,719 15,926,383 Under recovered purchased gas cost 2,825,163 - Deferred loss on refunding bonds 3,586,800 4,579,121 Supplemental environmental project - 150,000 Other 3,514,951 4,401,266
Total other assets 78,736,660 76,435,287 Total assets $ 1,706,109,607 $ 1,679,064,437
Knoxville Utilities Board Consolidated Statements of Net Assets June 30, 2012 and 2011
21
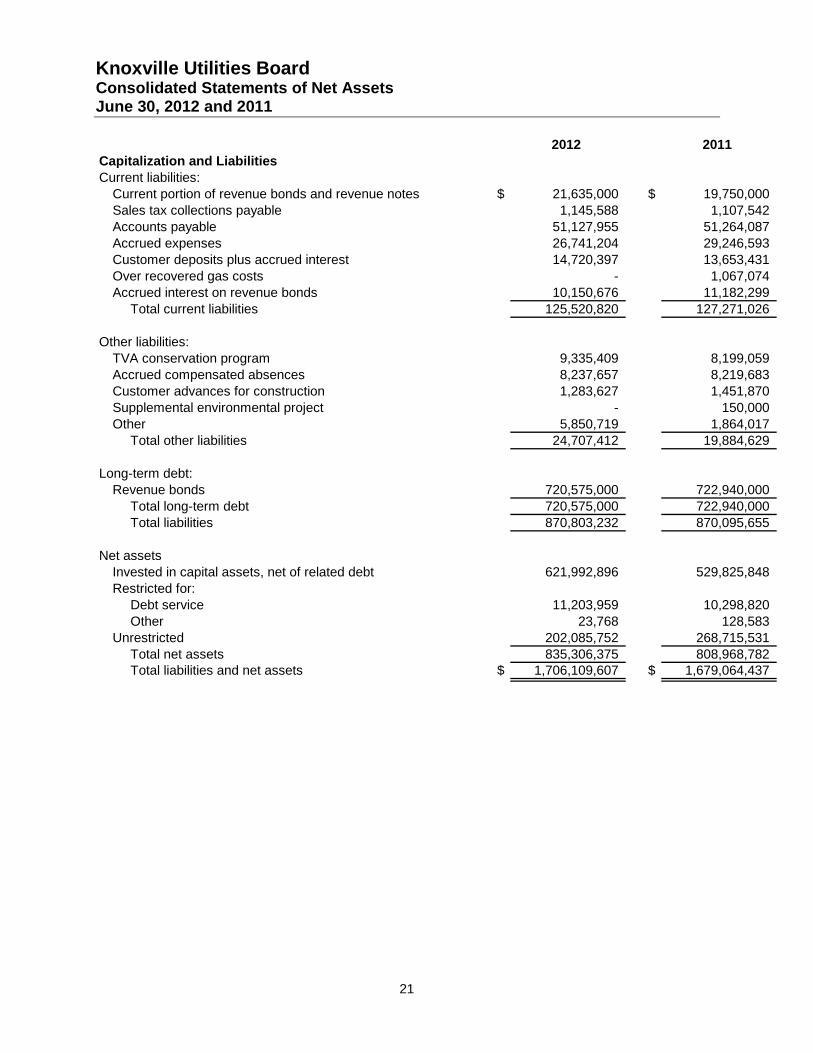
2012 2011Capitalization and LiabilitiesCurrent liabilities:
Current portion of revenue bonds and revenue notes $ 21,635,000 $ 19,750,000 Sales tax collections payable 1,145,588 1,107,542 Accounts payable 51,127,955 51,264,087 Accrued expenses 26,741,204 29,246,593 Customer deposits plus accrued interest 14,720,397 13,653,431 Over recovered gas costs - 1,067,074 Accrued interest on revenue bonds 10,150,676 11,182,299
Total current liabilities 125,520,820 127,271,026
Other liabilities:TVA conservation program 9,335,409 8,199,059 Accrued compensated absences 8,237,657 8,219,683 Customer advances for construction 1,283,627 1,451,870 Supplemental environmental project - 150,000 Other 5,850,719 1,864,017
Total other liabilities 24,707,412 19,884,629
Long-term debt:Revenue bonds 720,575,000 722,940,000
Total long-term debt 720,575,000 722,940,000 Total liabilities 870,803,232 870,095,655
Net assetsInvested in capital assets, net of related debt 621,992,896 529,825,848 Restricted for:
Debt service 11,203,959 10,298,820 Other 23,768 128,583
Unrestricted 202,085,752 268,715,531 Total net assets 835,306,375 808,968,782 Total liabilities and net assets $ 1,706,109,607 $ 1,679,064,437
Knoxville Utilities Board Consolidated Statements of Revenues, Expenses and Changes in Net Assets June 30, 2012 and 2011
The accompanying notes are an integral part of these consolidated financial statements.
22
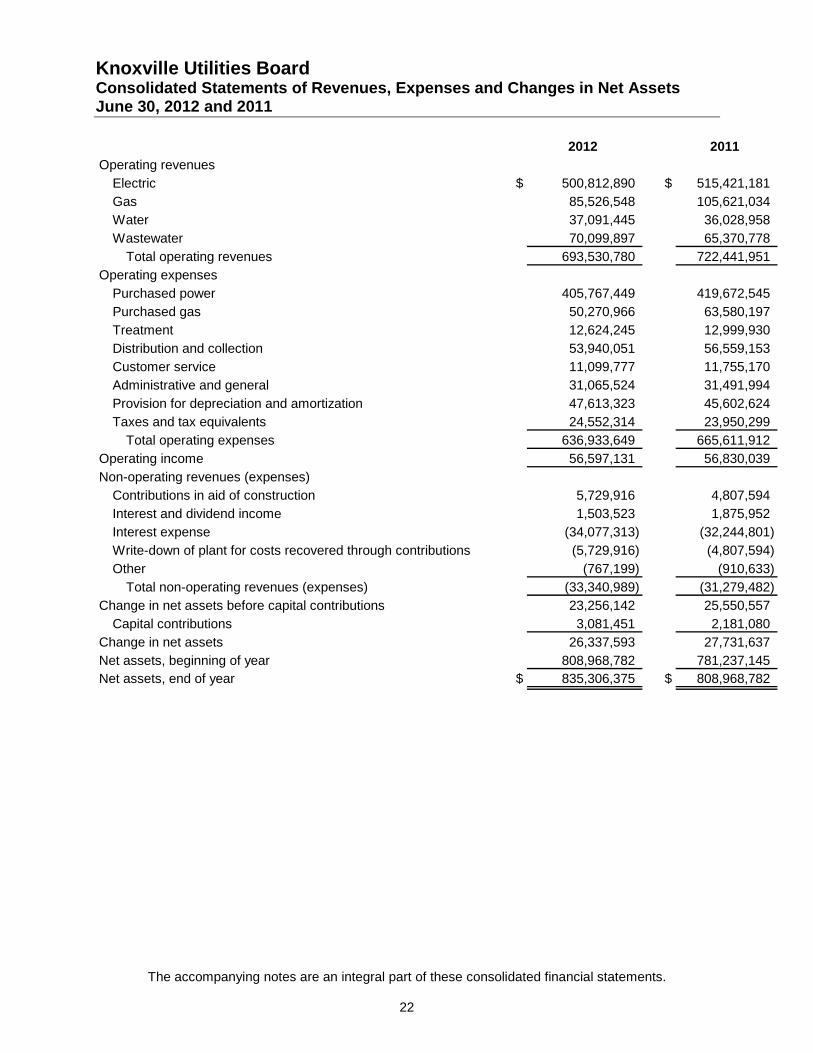
2012 2011Operating revenues
Electric $ 500,812,890 $ 515,421,181 Gas 85,526,548 105,621,034 Water 37,091,445 36,028,958 Wastewater 70,099,897 65,370,778
Total operating revenues 693,530,780 722,441,951 Operating expenses
Purchased power 405,767,449 419,672,545 Purchased gas 50,270,966 63,580,197 Treatment 12,624,245 12,999,930 Distribution and collection 53,940,051 56,559,153 Customer service 11,099,777 11,755,170 Administrative and general 31,065,524 31,491,994 Provision for depreciation and amortization 47,613,323 45,602,624 Taxes and tax equivalents 24,552,314 23,950,299
Total operating expenses 636,933,649 665,611,912 Operating income 56,597,131 56,830,039 Non-operating revenues (expenses)
Contributions in aid of construction 5,729,916 4,807,594 Interest and dividend income 1,503,523 1,875,952 Interest expense (34,077,313) (32,244,801) Write-down of plant for costs recovered through contributions (5,729,916) (4,807,594) Other (767,199) (910,633)
Total non-operating revenues (expenses) (33,340,989) (31,279,482) Change in net assets before capital contributions 23,256,142 25,550,557
Capital contributions 3,081,451 2,181,080 Change in net assets 26,337,593 27,731,637 Net assets, beginning of year 808,968,782 781,237,145 Net assets, end of year $ 835,306,375 $ 808,968,782
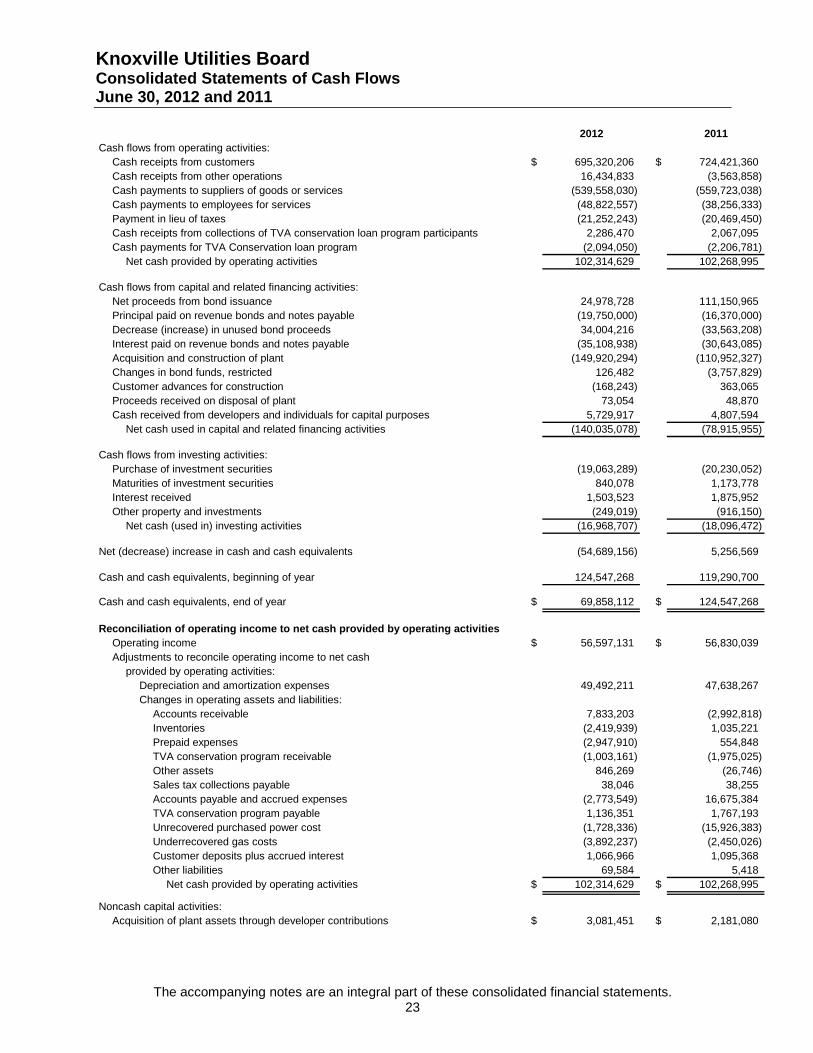
Knoxville Utilities Board Consolidated Statements of Cash Flows June 30, 2012 and 2011
The accompanying notes are an integral part of these consolidated financial statements. 23
2012 2011Cash flows from operating activities:
Cash receipts from customers $ 695,320,206 $ 724,421,360 Cash receipts from other operations 16,434,833 (3,563,858) Cash payments to suppliers of goods or services (539,558,030) (559,723,038) Cash payments to employees for services (48,822,557) (38,256,333) Payment in lieu of taxes (21,252,243) (20,469,450) Cash receipts from collections of TVA conservation loan program participants 2,286,470 2,067,095 Cash payments for TVA Conservation loan program (2,094,050) (2,206,781)
Net cash provided by operating activities 102,314,629 102,268,995
Cash flows from capital and related financing activities:Net proceeds from bond issuance 24,978,728 111,150,965 Principal paid on revenue bonds and notes payable (19,750,000) (16,370,000) Decrease (increase) in unused bond proceeds 34,004,216 (33,563,208) Interest paid on revenue bonds and notes payable (35,108,938) (30,643,085) Acquisition and construction of plant (149,920,294) (110,952,327) Changes in bond funds, restricted 126,482 (3,757,829) Customer advances for construction (168,243) 363,065 Proceeds received on disposal of plant 73,054 48,870 Cash received from developers and individuals for capital purposes 5,729,917 4,807,594
Net cash used in capital and related financing activities (140,035,078) (78,915,955)
Cash flows from investing activities:Purchase of investment securities (19,063,289) (20,230,052) Maturities of investment securities 840,078 1,173,778 Interest received 1,503,523 1,875,952 Other property and investments (249,019) (916,150)
Net cash (used in) investing activities (16,968,707) (18,096,472)
Net (decrease) increase in cash and cash equivalents (54,689,156) 5,256,569
Cash and cash equivalents, beginning of year 124,547,268 119,290,700
Cash and cash equivalents, end of year $ 69,858,112 $ 124,547,268
Reconciliation of operating income to net cash provided by operating activitiesOperating income $ 56,597,131 $ 56,830,039 Adjustments to reconcile operating income to net cash
provided by operating activities:Depreciation and amortization expenses 49,492,211 47,638,267 Changes in operating assets and liabilities:
Accounts receivable 7,833,203 (2,992,818) Inventories (2,419,939) 1,035,221 Prepaid expenses (2,947,910) 554,848 TVA conservation program receivable (1,003,161) (1,975,025) Other assets 846,269 (26,746) Sales tax collections payable 38,046 38,255 Accounts payable and accrued expenses (2,773,549) 16,675,384 TVA conservation program payable 1,136,351 1,767,193 Unrecovered purchased power cost (1,728,336) (15,926,383) Underrecovered gas costs (3,892,237) (2,450,026) Customer deposits plus accrued interest 1,066,966 1,095,368 Other liabilities 69,584 5,418
Net cash provided by operating activities $ 102,314,629 $ 102,268,995
Noncash capital activities:Acquisition of plant assets through developer contributions $ 3,081,451 $ 2,181,080
Knoxville Utilities Board Notes to Consolidated Financial Statements June 30, 2012 and 2011
24
1. Description of Business:
Knoxville Utilities Board (KUB), comprised of the Electric Division, Gas Division, Water Division, and Wastewater Division (Divisions), is reported as a component unit enterprise fund in the financial statements of the City of Knoxville. KUB's responsibility is to oversee the purchase, production, distribution, and processing of electricity, water, natural gas, and wastewater services. A seven-member Board of Commissioners governs KUB. The Board has all powers to construct, acquire, expand, or operate the Divisions. It has full control and complete jurisdiction over the management and operation of the Divisions including setting rates. KUB's accounts are maintained in conformity with the Uniform System of Accounts of the Federal Energy Regulatory Commission (FERC), the Uniform System of Accounts of the National Association of Regulatory Utility Commissioners (NARUC), and the Governmental Accounting Standards Board (GASB), as applicable.
2. Significant Accounting Policies:
Basis of Accounting KUB follows the provisions of Statement No. 34 (Statement 34) of the Governmental Accounting Standards Board Basic Financial Statements − and Management’s Discussion and Analysis − for State and Local Governments. Statement 34 established standards for external financial reporting for all state and local governmental entities, which includes a statement of net assets; a statement of revenues, expenses and changes in net assets; and a statement of cash flows. It requires the classification of net assets into three components − invested in capital assets, net of related debt; restricted; and unrestricted. These classifications are defined as follows:
• Invested in capital assets, net of related debt − This component of net assets consists of capital assets, including restricted capital assets, net of accumulated depreciation and reduced by the outstanding balances of any bonds, mortgages, notes, or other borrowings that are attributable to the acquisition, construction, or improvement of those assets. If there are significant unspent related debt proceeds at year end, the portion of the debt attributable to the unspent proceeds are not included in the calculation of invested in capital assets, net of related debt. Rather, that portion of the debt is included in the same net assets component as the unspent proceeds.
• Restricted − This component of net assets consists of restrictions placed on net asset use through external constraints imposed by creditors (such as through debt covenants), grantors, contributors, or laws or regulations of other governments or restrictions imposed by law through constitutional provisions or enabling legislation.
• Unrestricted net assets − This component of net assets consists of net assets that do not meet the definition of “restricted” or “invested in capital assets, net of related debt.”
Principles of Consolidation The consolidated financial statements include the accounts of the Electric, Gas, Water and Wastewater Divisions. All significant intercompany balances and transactions have been eliminated in consolidation.
The consolidated financial statements are prepared on the accrual basis of accounting, whereby revenues are recognized when earned and expenses are recognized when incurred. The accounting and financial reporting treatment is determined by measurement focus. The transactions are accounted for on a flow of economic resources measurement focus. With this measurement focus, all assets and all liabilities associated with the operations are included on the consolidated statement of net assets. Net assets (i.e., total assets net of total liabilities) are segregated into invested in capital assets, net of related debt; restricted for capital activity and debt service; and unrestricted components.
Knoxville Utilities Board Notes to Consolidated Financial Statements June 30, 2012 and 2011
25
As allowed by the Governmental Accounting Standards Board (GASB) Statement No. 20, Accounting and Financial Reporting for Proprietary Funds and Other Governmental Entities That Use Proprietary Fund Accounting, KUB’s policy is to apply only those Financial Accounting Standards Board statements, related interpretations, Accounting Principles Board opinions and accounting research bulletins issued on or prior to November 30, 1989 that do not conflict with Governmental Accounting Standards.
KUB issues separate financial reports, which include financial statements and required supplementary information, for the Electric, Gas, Water, and Wastewater Divisions. These reports may be obtained by writing Knoxville Utilities Board, P.O. Box 59017, Knoxville, TN 37950-9017.
Plant Plant and other property are stated on the basis of original cost. The costs of current repairs and minor replacements are charged to operating expense. The costs of renewals and improvements are capitalized. The original cost of utility plant assets retired or otherwise disposed of and the cost of removal less salvage value is charged to accumulated depreciation. When other property is retired, the related asset and accumulated depreciation are removed from the accounts, and the gain or loss is included in the results of operations.
The provision for depreciation of plants in service is based on the estimated useful lives of the assets, which range from three to sixty-seven years, and is computed using the straight-line method. Pursuant to FERC/NARUC, the caption "Provision for depreciation" in the consolidated statements of revenues, expenses and changes in net assets does not include depreciation for transportation equipment of $1,878,888 in 2012 and $2,035,642 in 2011. Interest costs are expensed as incurred.
Operating Revenue Operating revenue consists primarily of charges for services provided by the principal operations of KUB. Operating revenue is recorded when the service is rendered, on a cycle basis, and includes an estimate of unbilled revenue. Revenues are reported net of bad debt expense of $1,599,128 in 2012 and $2,958,582 in 2011.
Non-operating Revenue Non-operating revenue consists of revenues that are related to financing and investing types of activities and result from non-exchange transactions or ancillary activities.
Expense When an expense is incurred for purposes for which there are both restricted and unrestricted net assets available, it is KUB’s policy to apply those expenses to restricted net assets to the extent such are available and then to unrestricted net assets.
Contributions in Aid of Construction and Capital Contributions Contributions in aid of construction are cash collections from customers or others for a particular purpose, generally the construction of new facilities to serve new customers in excess of the investment KUB is willing to make for a particular incremental revenue source. KUB reduces the plant account balances to which contributions relate by the actual amount of the contribution and recognizes the contributions as non operating revenue in accordance with FAS 71, “Accounting for the Effects of Certain Types of Regulation”.
Capital contributions represent contributions of utility plant infrastructure constructed by developers and others in industrial parks and other developments, and transferred to KUB upon completion of construction and the initiation of utility service. In accordance with GASB 33, “Accounting and Financial Reporting for Nonexchange Transactions”, such contributions are recognized as revenues and capital assets upon receipt.
Knoxville Utilities Board Notes to Consolidated Financial Statements June 30, 2012 and 2011
26
Inventories Inventories, consisting of plant materials and operating supplies, are valued at the lower of average cost or replacement value.
Pension Plan KUB’s employees are participants in the Knoxville Utilities Board Pension Plan as authorized by the Charter of the City of Knoxville §1107(J) (Note 10). KUB’s policy is to fund pension cost accrued. As required by GASB Statement No. 27, KUB measures and discloses the annual pension cost on the accrual basis of accounting. At the time the funding method is introduced, there is a liability, which represents the contributions that would have been accumulated if this method of funding had always been used. The excess, if any, of this liability over the actuarial value of the assets held in the fund is the unfunded actuarial accrued liability, which is typically funded over a chosen period in accordance with an amortization schedule.
Investments Investments are carried at fair value as determined by quoted market prices at the reporting date.
KUB has established self-insurance programs covering portions of workers' compensation, employee health, environmental liability, general liability, property and casualty liability, and automobile liability claims. A liability is accrued for claims as they are incurred. When applicable, claims in excess of the self-insured risk are covered by KUB's insurance carriers. Additionally, KUB provides certain lifetime health benefits to eligible retired employees under a self-insurance plan administered by a third party.
Self-Insurance
Purchased Gas Adjustment In November 1990, the Division implemented a deferred Purchased Gas (Cost) Adjustment (PGA) mechanism, which allows the Division to flow changes in purchased gas costs through to its customers. These changes in gas costs are reflected as adjustments to the base gas rates established by KUB's Board of Commissioners. The rate-setting authority vested in the KUB Board by the City Charter meets the “self-regulated” provisions of SFAS No. 71, “Accounting for the Effects of Certain Types of Regulation,” and KUB meets the remaining criteria of SFAS No. 71. The PGA is intended to assure that KUB recovers the total cost of natural gas purchased, transported and/or reserved for delivery to its sales and transportation customers on an equitable basis. The PGA is also intended to assure that no excess or deficient cost recovery from KUB’s customers occurs.
Under the PGA mechanism, the Division tracks the actual over/under recovered amount in the Over/Under recovered Purchased Gas Costs accounts. These accounts are rolled into the PGA rate adjustment on June 30 of each year thereby assuring that any (under)/over recovered amounts are passed on to the Division's customers. The amount of (under)/over recovered cost was ($2,825,163) at June 30, 2012 and $1,067,074 at June 30, 2011.
Purchased Power Adjustment In October 2002, the Board adopted a Purchased Power Adjustment (PPA) to address changes in wholesale power costs. The PPA was established in response to an amendment to KUB’s power supply contract under which, among other things, TVA relinquished its regulatory authority over KUB retail electric rates. The PPA allows KUB to promptly adjust retail electric rates in response to wholesale rate changes or adjustments, thus ensuring that KUB will recover the costs incurred for purchased power. These changes in electric costs are reflected as adjustments to the base electric rates established by KUB's Board of Commissioners. The rate-setting authority vested in the KUB Board by the City Charter meets the “self-regulated” provisions of SFAS No. 71, “Accounting for the Effects of Certain Types of Regulation,” and KUB meets the remaining criteria of SFAS No. 71.
TVA implemented a fuel cost adjustment in October 2006 applied on a quarterly basis to wholesale power rates. TVA’s quarterly fuel cost adjustment became a monthly fuel cost adjustment effective October 2009. KUB flows changes to wholesale power rates, from TVA’s fuel cost adjustment mechanism, directly through to its retail electric rates via the PPA.
Knoxville Utilities Board Notes to Consolidated Financial Statements June 30, 2012 and 2011
27
In April 2011, TVA modified its wholesale rate structure to demand & energy billing for its distributors. In response, KUB revised its PPA to include a deferred accounting component to ensure appropriate matching of revenue and expense and cost recovery. KUB will adjust its retail rates on an annual basis to flow any over or under recovery of wholesale power costs through to its customers via the PPA.
Estimates The preparation of financial statements in conformity with generally accepted accounting principles requires management to make estimates and assumptions that affect the reported amounts of assets and liabilities and disclosures of contingent assets and liabilities at the date of the financial statements and the reported amounts of revenues and expenses during the reporting period. These estimates are based on historical experience and various other assumptions that KUB believes are reasonable under the circumstances. However, future events are subject to change and the best estimates and judgments routinely require adjustment. Estimates are used for, but not limited to, inventory valuation, provision for doubtful accounts, depreciable lives of plant assets, unbilled revenue volumes, pension trust valuations, OPEB trust valuations, insurance liability reserves, and potential losses from contingencies and litigation. Actual results could differ from those estimates.
Restricted and Designated Assets Certain assets are restricted by bond resolutions for the construction of utility plant and debt repayment. Certain additional assets are designated by management for contingency purposes and economic development.
Cash Equivalents For purposes of the statements of cash flows, KUB considers all unrestricted and undesignated highly liquid investments with an original maturity of three months or less when purchased to be cash equivalents.
Environmental Cleanup Matters KUB’s policy is to accrue environmental cleanup costs when those costs are believed to be probable and can be reasonably estimated. For certain matters, KUB expects to share costs with other parties. KUB does not include anticipated recoveries from insurance carriers in the estimated liability.
Compensated Absences KUB accrues a liability for earned but unpaid paid-time off (PTO) days.
Subsequent Events KUB has evaluated events and transactions through October 18, 2012, the date these financial statements were issued, for items that should potentially be recognized or disclosed.
Reclassifications Certain reclassifications have been made to the 2011 balances to conform to the 2012 presentation.
Knoxville Utilities Board Notes to Consolidated Financial Statements June 30, 2012 and 2011
28
3. Deposits and Investments
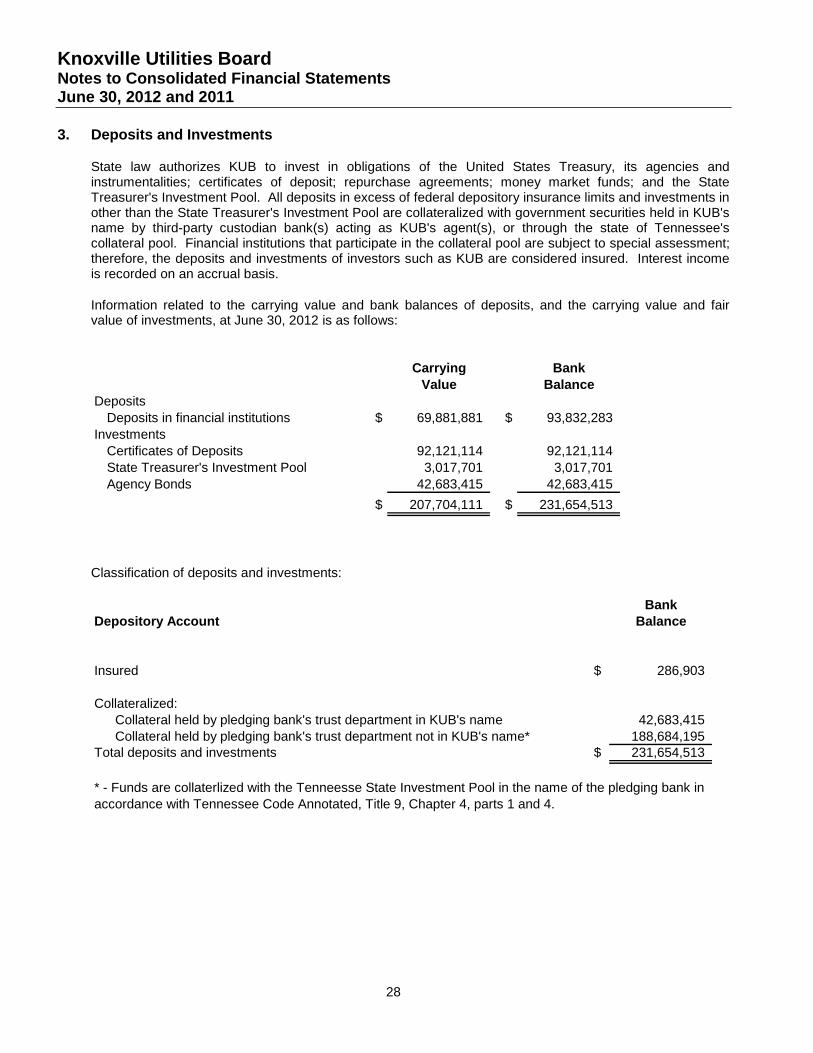
State law authorizes KUB to invest in obligations of the United States Treasury, its agencies and instrumentalities; certificates of deposit; repurchase agreements; money market funds; and the State Treasurer's Investment Pool. All deposits in excess of federal depository insurance limits and investments in other than the State Treasurer's Investment Pool are collateralized with government securities held in KUB's name by third-party custodian bank(s) acting as KUB's agent(s), or through the state of Tennessee's collateral pool. Financial institutions that participate in the collateral pool are subject to special assessment; therefore, the deposits and investments of investors such as KUB are considered insured. Interest income is recorded on an accrual basis.
Information related to the carrying value and bank balances of deposits, and the carrying value and fair value of investments, at June 30, 2012 is as follows:
Carrying Bank
Value BalanceDeposits
Deposits in financial institutions $ 69,881,881 $ 93,832,283 Investments
Certificates of Deposits 92,121,114 92,121,114 State Treasurer's Investment Pool 3,017,701 3,017,701 Agency Bonds 42,683,415 42,683,415
$ 207,704,111 $ 231,654,513
Classification of deposits and investments:
BankDepository Account Balance
Insured $ 286,903
Collateralized:Collateral held by pledging bank's trust department in KUB's name 42,683,415 Collateral held by pledging bank's trust department not in KUB's name* 188,684,195
Total deposits and investments $ 231,654,513
* - Funds are collaterlized with the Tenneesse State Investment Pool in the name of the pledging bank in accordance with Tennessee Code Annotated, Title 9, Chapter 4, parts 1 and 4.

Knoxville Utilities Board Notes to Consolidated Financial Statements June 30, 2012 and 2011
29
Classification of deposits and investments per statement of net assets: 2012
Current assetsCash and cash equivalents $ 69,858,112 Short-term investments 30,500,000 Short-term contingency fund investments 30,775,170
Other assetsLong-term contingency fund investments 41,403,246
Restricted assetsUnused bond proceeds 13,789,178 Bond fund 21,354,636 Other funds 23,769
$ 207,704,111
The above amounts do not include accrued interest of $234,101.
KUB follows the provisions of Statement No. 40 (Statement 40) of the Governmental Accounting Standards Board Deposit and Investment Risk Disclosures an amendment of GASB Statement No. 3. This Statement establishes and modifies disclosure requirements for state and local governments related to deposit and investment risks.
Fair LessValue Than 1 1-5
Supersweep NOW and Other Deposits $ 93,832,283 $ 93,832,283 $ -State Treasurer's Investment Pool 3,017,701 3,017,701 -Agency Bonds 42,683,415 9,100,149 33,583,266 Certificates of Deposits 92,121,114 84,321,115 7,799,999
$ 231,654,513 $ 190,271,248 $ 41,383,265
Deposit and Investment Maturities (in Years)
Interest Rate Risk. KUB’s primary investment objectives, in order, are to place investments in a manner to ensure the preservation of capital, remain sufficiently liquid to meet all operating requirements, and maximize yield of return. KUB minimizes its exposure to interest rate risk by adhering to Tennessee state law requirements for the investment of public funds. This includes types of investments, as described above, and investment maturity. The maximum maturity is four years from the date of investment. KUB also limits its exposure by holding investments to maturity unless cash flow requirements dictate otherwise.
Credit Risk. KUB’s investment policy, as required by state law, is to apply the prudent-person rule: Investments are made with judgment and care, under circumstances then prevailing, which persons of prudence, discretion, and intelligence exercise in the management of their own affairs, not for speculation, but for investment, considering the probable income to be derived, as well as the probable safety of their capital. KUB’s Agency Bond investments are rated Aaa by Moody’s Investors Service.
Knoxville Utilities Board Notes to Consolidated Financial Statements June 30, 2012 and 2011
30
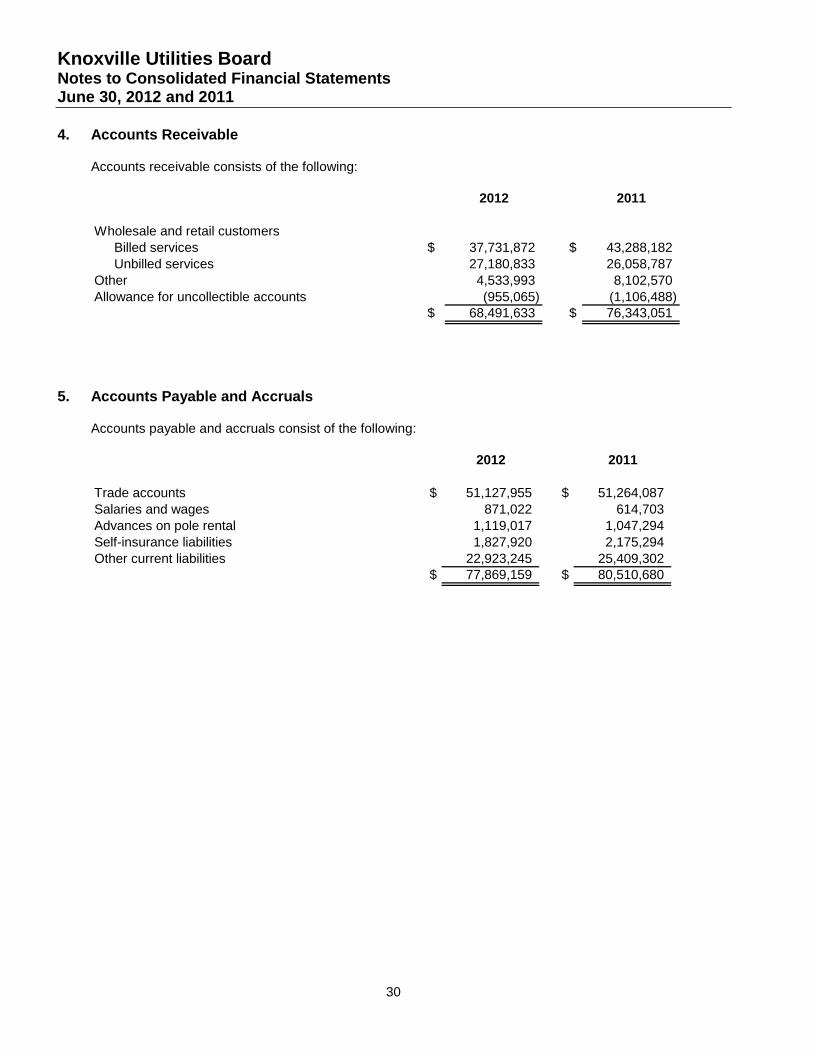
4. Accounts Receivable
Accounts receivable consists of the following:
2012 2011
Wholesale and retail customers Billed services $ 37,731,872 $ 43,288,182 Unbilled services 27,180,833 26,058,787 Other 4,533,993 8,102,570 Allowance for uncollectible accounts (955,065) (1,106,488)
$ 68,491,633 $ 76,343,051
5. Accounts Payable and Accruals
Accounts payable and accruals consist of the following:
2012 2011
Trade accounts $ 51,127,955 # $ 51,264,087 Salaries and wages 871,022 # 614,703 Advances on pole rental 1,119,017 # 1,047,294 Self-insurance liabilities 1,827,920 # 2,175,294 Other current liabilities 22,923,245 # 25,409,302
$ 77,869,159 $ 80,510,680
Knoxville Utilities Board Notes to Consolidated Financial Statements June 30, 2012 and 2011
31
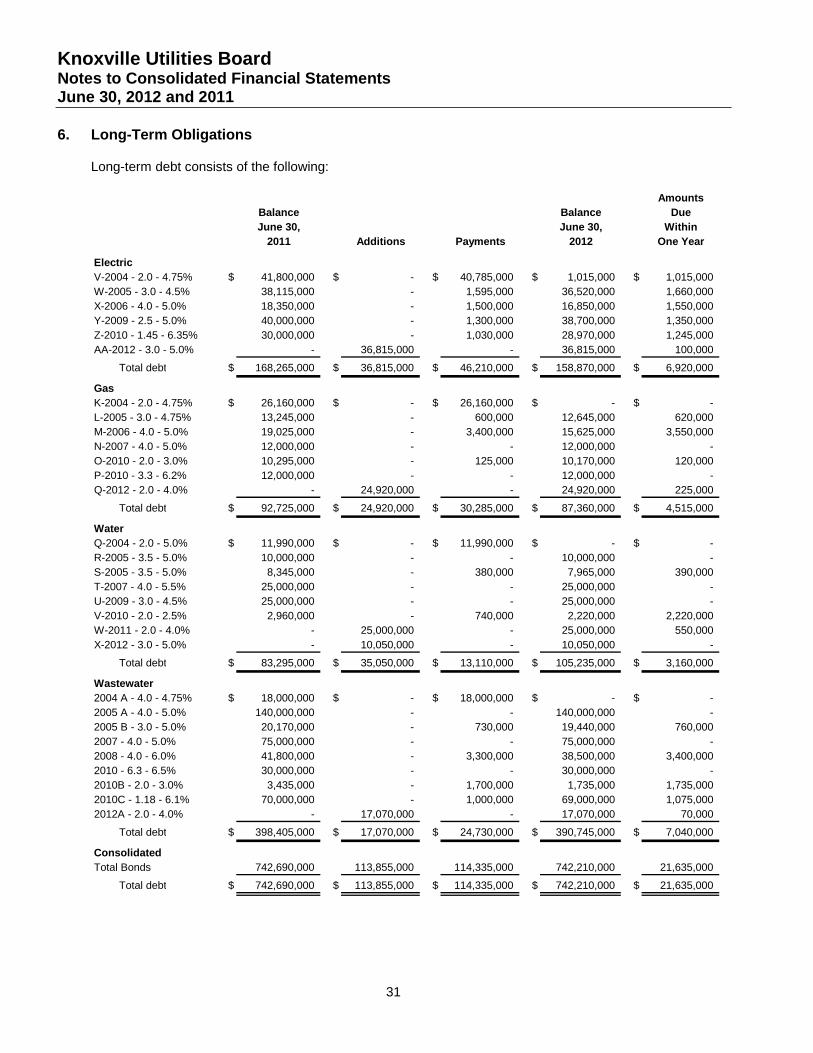
6. Long-Term Obligations
Long-term debt consists of the following:
AmountsBalance Balance DueJune 30, June 30, Within
2011 Additions Payments 2012 One Year
ElectricV-2004 - 2.0 - 4.75% $ 41,800,000 $ - $ 40,785,000 $ 1,015,000 $ 1,015,000 W-2005 - 3.0 - 4.5% 38,115,000 - 1,595,000 36,520,000 1,660,000 X-2006 - 4.0 - 5.0% 18,350,000 - 1,500,000 16,850,000 1,550,000 Y-2009 - 2.5 - 5.0% 40,000,000 - 1,300,000 38,700,000 1,350,000 Z-2010 - 1.45 - 6.35% 30,000,000 - 1,030,000 28,970,000 1,245,000 AA-2012 - 3.0 - 5.0% - 36,815,000 - 36,815,000 100,000
Total debt $ 168,265,000 $ 36,815,000 $ 46,210,000 $ 158,870,000 $ 6,920,000
GasK-2004 - 2.0 - 4.75% $ 26,160,000 $ - $ 26,160,000 $ - $ - L-2005 - 3.0 - 4.75% 13,245,000 - 600,000 12,645,000 620,000 M-2006 - 4.0 - 5.0% 19,025,000 - 3,400,000 15,625,000 3,550,000 N-2007 - 4.0 - 5.0% 12,000,000 - - 12,000,000 - O-2010 - 2.0 - 3.0% 10,295,000 - 125,000 10,170,000 120,000 P-2010 - 3.3 - 6.2% 12,000,000 - - 12,000,000 - Q-2012 - 2.0 - 4.0% - 24,920,000 - 24,920,000 225,000
Total debt $ 92,725,000 $ 24,920,000 $ 30,285,000 $ 87,360,000 $ 4,515,000
WaterQ-2004 - 2.0 - 5.0% $ 11,990,000 $ - $ 11,990,000 $ - $ - R-2005 - 3.5 - 5.0% 10,000,000 - - 10,000,000 - S-2005 - 3.5 - 5.0% 8,345,000 - 380,000 7,965,000 390,000 T-2007 - 4.0 - 5.5% 25,000,000 - - 25,000,000 - U-2009 - 3.0 - 4.5% 25,000,000 - - 25,000,000 - V-2010 - 2.0 - 2.5% 2,960,000 - 740,000 2,220,000 2,220,000 W-2011 - 2.0 - 4.0% - 25,000,000 - 25,000,000 550,000 X-2012 - 3.0 - 5.0% - 10,050,000 - 10,050,000 -
Total debt $ 83,295,000 $ 35,050,000 $ 13,110,000 $ 105,235,000 $ 3,160,000
Wastewater2004 A - 4.0 - 4.75% $ 18,000,000 $ - $ 18,000,000 $ - $ - 2005 A - 4.0 - 5.0% 140,000,000 - - 140,000,000 - 2005 B - 3.0 - 5.0% 20,170,000 - 730,000 19,440,000 760,000 2007 - 4.0 - 5.0% 75,000,000 - - 75,000,000 - 2008 - 4.0 - 6.0% 41,800,000 - 3,300,000 38,500,000 3,400,000 2010 - 6.3 - 6.5% 30,000,000 - - 30,000,000 - 2010B - 2.0 - 3.0% 3,435,000 - 1,700,000 1,735,000 1,735,000 2010C - 1.18 - 6.1% 70,000,000 - 1,000,000 69,000,000 1,075,000 2012A - 2.0 - 4.0% - 17,070,000 - 17,070,000 70,000
Total debt $ 398,405,000 $ 17,070,000 $ 24,730,000 $ 390,745,000 $ 7,040,000
ConsolidatedTotal Bonds 742,690,000 113,855,000 114,335,000 742,210,000 21,635,000
Total debt $ 742,690,000 $ 113,855,000 $ 114,335,000 $ 742,210,000 $ 21,635,000
Knoxville Utilities Board Notes to Consolidated Financial Statements June 30, 2012 and 2011
32
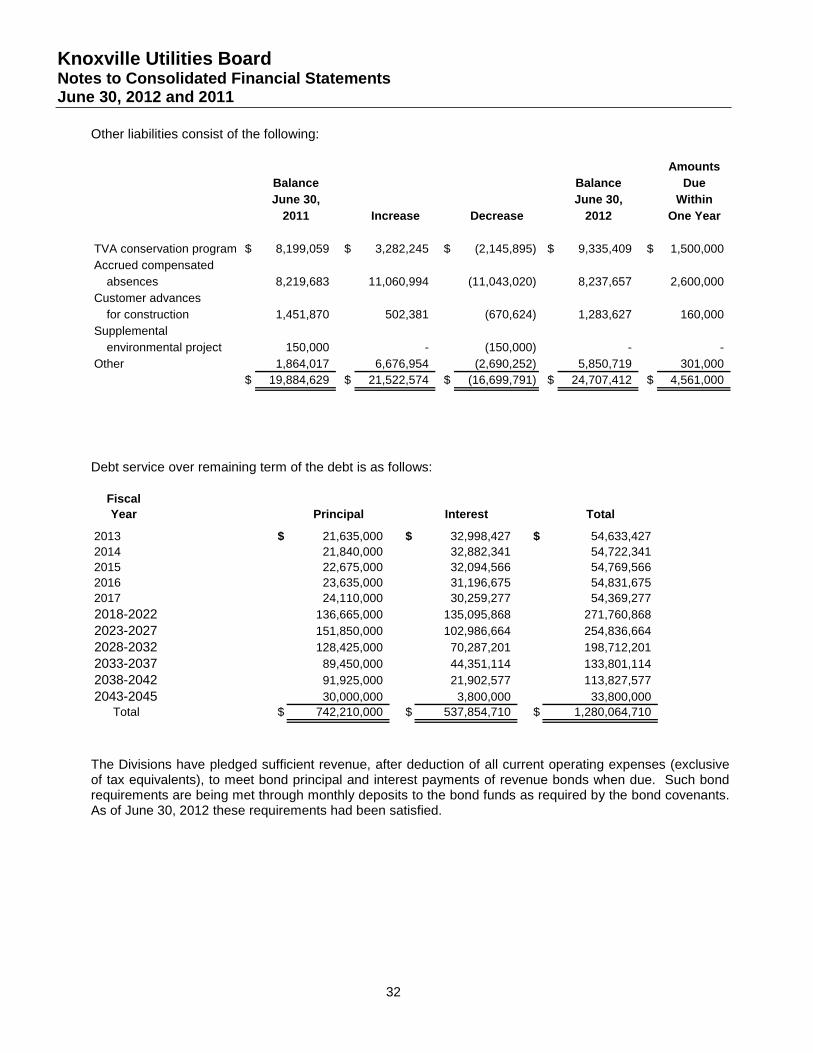
Other liabilities consist of the following:
AmountsBalance Balance DueJune 30, June 30, Within
2011 Increase Decrease 2012 One Year
TVA conservation program $ 8,199,059 $ 3,282,245 $ (2,145,895) $ 9,335,409 $ 1,500,000 Accrued compensated
absences 8,219,683 11,060,994 (11,043,020) 8,237,657 2,600,000 Customer advances
for construction 1,451,870 502,381 (670,624) 1,283,627 160,000 Supplemental
environmental project 150,000 - (150,000) - - Other 1,864,017 6,676,954 (2,690,252) 5,850,719 301,000
$ 19,884,629 $ 21,522,574 $ (16,699,791) $ 24,707,412 $ 4,561,000
Debt service over remaining term of the debt is as follows:
FiscalYear Principal Interest Total
2013 $ 21,635,000 $ 32,998,427 $ 54,633,427 2014 21,840,000 32,882,341 54,722,341 2015 22,675,000 32,094,566 54,769,566 2016 23,635,000 31,196,675 54,831,675 2017 24,110,000 30,259,277 54,369,277 2018-2022 136,665,000 135,095,868 271,760,868 2023-2027 151,850,000 102,986,664 254,836,664 2028-2032 128,425,000 70,287,201 198,712,201 2033-2037 89,450,000 44,351,114 133,801,114 2038-2042 91,925,000 21,902,577 113,827,577 2043-2045 30,000,000 3,800,000 33,800,000
Total $ 742,210,000 $ 537,854,710 $ 1,280,064,710
The Divisions have pledged sufficient revenue, after deduction of all current operating expenses (exclusive of tax equivalents), to meet bond principal and interest payments of revenue bonds when due. Such bond requirements are being met through monthly deposits to the bond funds as required by the bond covenants. As of June 30, 2012 these requirements had been satisfied.
Knoxville Utilities Board Notes to Consolidated Financial Statements June 30, 2012 and 2011
33
During fiscal year 2004, KUB’s Electric Division issued Series V 2004 bonds in part to retire certain existing debt and to fund electric system capital improvements. Concurrent with issuance of these bonds, KUB transferred funds to an irrevocable trust to pay a portion of the Series S 1998 revenue bonds as such amounts mature. During fiscal year 2006, KUB’s Electric Division issued Series W 2005 bonds in part to retire certain existing debt and fund electric system capital improvements. Concurrent with the issuance of these bonds, KUB transferred funds to an irrevocable trust to pay a portion of the Series U 2001 bonds, as such amounts mature. KUB’s Electric Division also issued Series X 2006 bonds in part to retire certain existing debt and to fund electric system capital improvements. Concurrent with the issuance of these bonds, KUB transferred funds to an irrevocable trust to pay the remaining maturities of principal and interest on the Series S 1998 revenue bonds. During fiscal year 2009, KUB’s Electric Division issued Series Y 2009 bonds to fund electric system capital improvements. During fiscal year 2011, KUB’s Electric Division issued series Z 2010 bonds to fund electric system capital improvements. The bonds were issued as federally taxable Build America Bonds with a 35 percent interest payment rebate to be received from the United States Government for each interest payment. During fiscal year 2012, KUB’s Electric Division issued Series AA 2012 bonds to retire a portion of outstanding Series V 2004 bonds. The outstanding principal balances on defeased bond issues were $106.2 million at June 30, 2012.
During fiscal year 2004, KUB’s Gas Division issued Series K 2004 bonds to retire certain existing debt and fund gas system capital improvements. Concurrent with the issuance of these bonds, KUB transferred funds to an irrevocable trust to pay a portion of the Series H 1998 bonds as such amounts mature. During fiscal year 2006, KUB’s Gas Division issued Series L 2005 bonds in part to retire certain existing debt. Concurrent with the issuance of these bonds, KUB transferred funds to an irrevocable trust to pay a portion of the Series J 2001 bonds, as such amounts mature. KUB’s Gas Division also issued Series M 2006 bonds in part to retire certain existing debt and to fund gas system capital improvements. Concurrent with the issuance of these bonds, KUB transferred funds to an irrevocable trust to pay the remaining maturities of principal and interest on the Series H 1998 bonds. During fiscal year 2008, KUB’s Gas Division issued Series N 2007 to fund gas system capital improvements. During fiscal year 2010, KUB’s Gas Division issued Series O 2010 bonds to retire Series I 2001 bonds. During fiscal year 2011, KUB’s Gas Division issued Series P 2010 bonds to fund gas system capital improvements. The bonds were issued as federally taxable Build America Bonds with a 35 percent interest payment rebate to be received from the United States Government for each interest payment. During fiscal year 2012, KUB’s Gas Division issued Series Q 2012 bonds to retire Series K 2004 bonds. The outstanding principal balances on defeased bond issues were $76.1 million at June 30, 2012. During fiscal year 2004, KUB’s Water Division issued Series Q 2004 bonds to retire certain existing debt and fund water system capital improvements. Concurrent with the issuance of these bonds, KUB transferred funds to an irrevocable trust to pay the remaining maturities of principal and interest on the Series N 1998 bonds, as such amounts mature. During fiscal year 2006, KUB’s Water Division issued Series R 2005 bonds for the purpose of funding water system capital improvements. KUB’s Water Division also issued Series S 2005 bonds to retire certain existing debt and fund water system capital improvements. Concurrent with the issuance of these bonds, KUB transferred funds to an irrevocable trust to pay a portion of the Series P 2001 bonds, as such amounts mature. During fiscal year 2008, KUB’s Water Division issued Series T 2007 bonds to fund water system capital improvements. During fiscal year 2010, KUB’s Water Division issued Series U 2009 bonds to fund water system capital improvements. KUB’s Water Division also issued Series V 2010 bonds to retire Series O 2001 bonds. During fiscal year 2012, KUB’s Water Division issued Series W 2011 bonds to fund water system capital improvements. KUB’s Water Division also issued Series X 2012 bonds to retire Series Q 2004 bonds. The outstanding principal balances on defeased bond issues were $23 million at June 30, 2012.
Knoxville Utilities Board Notes to Consolidated Financial Statements June 30, 2012 and 2011
34
During fiscal year 2004, KUB’s Wastewater Division issued Series 2004A bonds to fund wastewater system capital improvements. During fiscal year 2006, KUB’s Wastewater Division issued Series 2005A bonds for the purpose of funding wastewater system capital improvements and to pay off a previously issued $30 million revenue anticipation note (line of credit), which was used to fund capital improvements to the wastewater system. KUB’s Wastewater Division also issued Series 2005B bonds in part to retire certain existing debt and fund wastewater system capital improvements. Concurrent with the issuance of these bonds, KUB transferred funds to an irrevocable trust to pay a portion of the Series 1998 bonds and Series 2001A bonds, as such amounts mature. During fiscal year 2008, KUB’s Wastewater Division issued Series 2007 bonds in part to pay off the outstanding balance on a previously issued revenue anticipation note (line of credit), and to fund wastewater system capital improvements. During fiscal year 2009, KUB’s Wastewater Division issued Series 2008 bonds to fund wastewater system capital improvements. During fiscal year 2010, KUB’s Wastewater Division issued Series 2010 bonds to fund capital improvements. These bonds were issued as federally taxable Build America Bonds with a 35 percent interest payment rebate to be received from the United States Government for each interest payment. KUB’s Wastewater Division also issued Series 2010B bonds to retire Series 2001 bonds. During fiscal year 2011, KUB’s Wastewater Division issued Series 2010C bonds to fund capital improvements. These bonds were issued as federally taxable Build America Bonds with a 35 percent interest payment rebate to be received from the United States Government for each interest payment. During fiscal year 2012, KUB’s Wastewater Division issued Series 2012A bonds to retire Series 2004A bonds. The outstanding principal balances on defeased bond issues were $40.9 million at June 30, 2012.
7. Lease Commitments
KUB has non-cancelable operating lease commitments for office equipment and vehicles, summarized for the following fiscal years: 2013 $ 23,524 2014 20,899 2015 26,648 2016 6,917
Total operating minimum lease payments $ 77,988
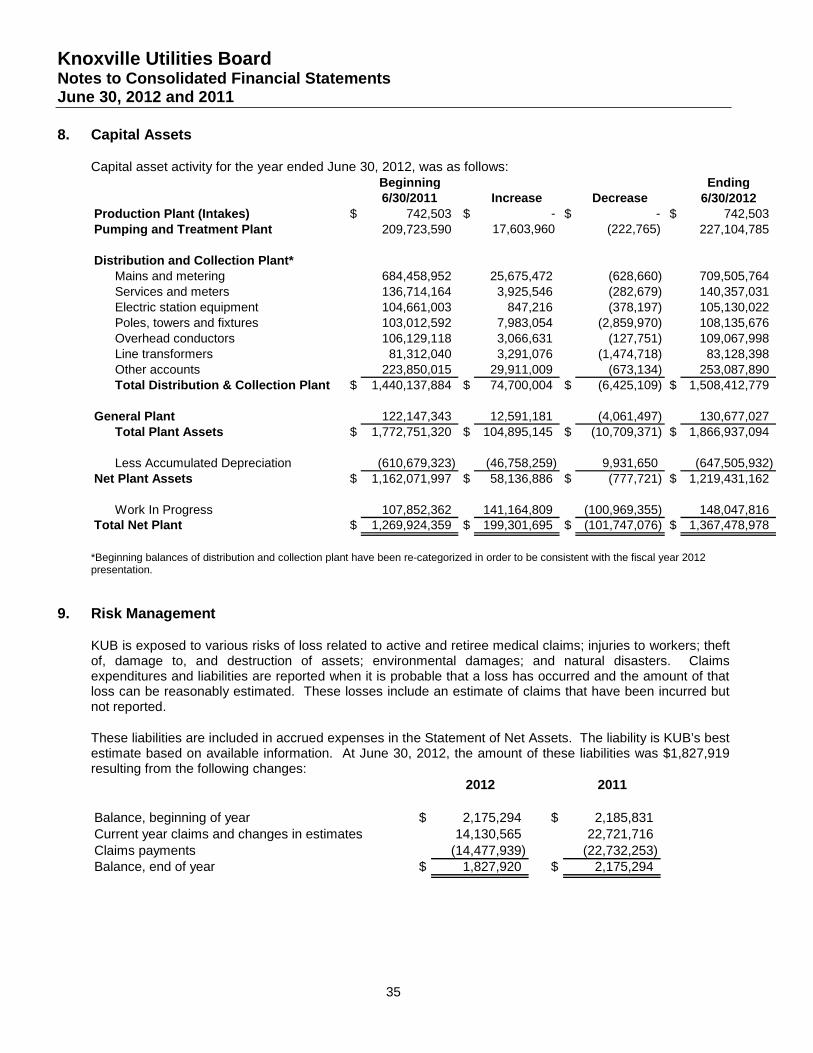
Knoxville Utilities Board Notes to Consolidated Financial Statements June 30, 2012 and 2011
35
8. Capital Assets
Capital asset activity for the year ended June 30, 2012, was as follows: Beginning Ending6/30/2011 Increase Decrease 6/30/2012
Production Plant (Intakes) $ 742,503 $ - $ - $ 742,503 Pumping and Treatment Plant 209,723,590 17,603,960 (222,765) 227,104,785
Distribution and Collection Plant* Mains and metering 684,458,952 25,675,472 (628,660) 709,505,764 Services and meters 136,714,164 3,925,546 (282,679) 140,357,031 Electric station equipment 104,661,003 847,216 (378,197) 105,130,022 Poles, towers and fixtures 103,012,592 7,983,054 (2,859,970) 108,135,676 Overhead conductors 106,129,118 3,066,631 (127,751) 109,067,998 Line transformers 81,312,040 3,291,076 (1,474,718) 83,128,398 Other accounts 223,850,015 29,911,009 (673,134) 253,087,890 Total Distribution & Collection Plant $ 1,440,137,884 $ 74,700,004 $ (6,425,109) $ 1,508,412,779
General Plant 122,147,343 12,591,181 (4,061,497) 130,677,027 Total Plant Assets $ 1,772,751,320 $ 104,895,145 $ (10,709,371) $ 1,866,937,094
Less Accumulated Depreciation (610,679,323) (46,758,259) 9,931,650 (647,505,932) Net Plant Assets $ 1,162,071,997 $ 58,136,886 $ (777,721) $ 1,219,431,162
Work In Progress 107,852,362 141,164,809 (100,969,355) 148,047,816 Total Net Plant $ 1,269,924,359 $ 199,301,695 $ (101,747,076) $ 1,367,478,978
*Beginning balances of distribution and collection plant have been re-categorized in order to be consistent with the fiscal year 2012 presentation.
9. Risk Management
KUB is exposed to various risks of loss related to active and retiree medical claims; injuries to workers; theft of, damage to, and destruction of assets; environmental damages; and natural disasters. Claims expenditures and liabilities are reported when it is probable that a loss has occurred and the amount of that loss can be reasonably estimated. These losses include an estimate of claims that have been incurred but not reported.
These liabilities are included in accrued expenses in the Statement of Net Assets. The liability is KUB’s best estimate based on available information. At June 30, 2012, the amount of these liabilities was $1,827,919 resulting from the following changes:
2012 2011
Balance, beginning of year $ 2,175,294 $ 2,185,831 Current year claims and changes in estimates 14,130,565 22,721,716 Claims payments (14,477,939) (22,732,253) Balance, end of year $ 1,827,920 $ 2,175,294
Knoxville Utilities Board Notes to Consolidated Financial Statements June 30, 2012 and 2011
36
10. Pension Plan
Description of Plan The Plan is a single-employer contributory, defined benefit pension plan established by Resolution No. 980 dated February 18, 1999, effective July 1, 1999, as authorized by the Charter of the City of Knoxville § 1107(J). The Plan is designed to provide retirement, disability and death benefits. The Plan is a governmental plan as defined by the Employee Retirement Income Security Act of 1974 and is not subject to any of the provisions of the Act. The Plan is funded by contributions from KUB, if funding is required, and from Plan A and Plan B employee participants.
At December 31, 2011, the Plan had approximately 652 retirees and beneficiaries currently receiving benefits and 56 terminated employees entitled to benefits but not yet receiving them. Of the approximately 873 current employees in the Plan, 730 were fully vested at December 31, 2011. The Plan issues a financial report, which includes financial statements and required supplementary information. The report may be obtained by writing the Knoxville Utilities Board Retirement System, P.O. Box 59017, Knoxville, TN 37950-9017.
Effective January 1, 2011, KUB has frozen the Plan such that persons employed or re-employed by KUB on or after January 1, 2011, shall not be eligible to participate, but that eligible employees hired prior to January 1, 2011, who have not separated from service, shall continue as Participants and accrue benefits under the Plan.
The Plan provided three different benefit arrangements for KUB participants, retirees, and beneficiaries, as follows:
Career Equity Program (CEP) CEP is for eligible employees hired on or after January 1, 1999, and for eligible former City System Plan A members who elected CEP coverage as of July 1, 1999. CEP is a closed plan.
All eligible employees became participants on the date of his/her KUB employment. Participants are covered by Social Security. Participation in CEP does not require or permit employee contributions.
Plan A Plan A benefits are for former City System Plan A active employees, vested terminated employees, retirees, and beneficiaries. Plan A is a closed plan.
All employees participating in the City System Plan A as of June 30, 1999 were eligible to participate in KUB’s Plan A or the CEP program. Participants of Plan A are covered by Social Security. Plan A is a closed plan and is not available to KUB employees hired after July 1, 1999. Participation in Plan A requires employee contributions of 3 percent of the first $4,800 of annual earnings and 5 percent of annual earnings in excess of $4,800. Plan A provides for early retirement benefits with 25 years of service and normal retirement benefits at age 62 or older.
Plan B Plan B benefits are for former City System Plan B active employees, vested terminated employees, retirees, and beneficiaries. Plan B is a closed plan.
All employees participating in the City System Plan B as of June 30, 1999 are eligible to participate in KUB’s Plan B. Plan B is now a closed plan and no participants can be added. Participants of Plan B are not covered by Social Security. Participation in Plan B requires employee contributions of 4 percent of annual earnings. Plan B provides for retirement benefits after 25 years of service and the attainment of age 50.
Knoxville Utilities Board Notes to Consolidated Financial Statements June 30, 2012 and 2011
37
Funding Policy For the Plan year ended December 31, 2011, a contribution of $3,593,282 is required to be made in the Plan sponsor’s fiscal year ending June 30, 2013. The annual required contribution was determined as part of the January 1, 2011 valuation using the Individual Entry Age Normal funding method. The objective under this method is to fund each participant’s benefits under the Plan as payments which are level as a percentage of salary, starting on the original participation date (employment date) and continuing until the assumed retirement, termination, disability or death. For the Plan year ended December 31, 2011, the Plan’s actuarial funded ratio was 104.5 percent.
At the time the funding method is introduced, there is a liability, which represents the contributions that would have been accumulated if this method of funding had always been used. The excess, if any, of this liability over the actuarial value of the assets held in the fund, is the unfunded actuarial accrued liability, which is typically funded over a chosen period in accordance with an amortization schedule.
Significant actuarial assumptions used in the valuation include (a) rate of return of investments of 8 percent, (b) the RP2000 Mortality Table, (c) annual projected salary increases based on participants’ ages ranging from age 25 to age 65 with salary increases from 2.58 percent to 7.92 percent, and (d) cost of living adjustment of 2.8 percent annually. The actuarial value of assets was determined using techniques that smooth the effect of short-term volatility in the market value of equities over a five-year period.
As of the actuarial report for the Plan year ended December 31, 2011, contributions of $3,593,282 and $3,244,057 for 2011 and 2010, respectively, are required to be made during the Plan sponsor’s fiscal years ending June 30, 2013 and 2012, respectively.
Subsequent to June 30, 2012, the actuarial report for the Plan year ending December 31, 2012 was completed.
For the Plan year ending December 31, 2012, a contribution of $5,502,677 is required to be made in the Plan sponsor’s fiscal year ending June 30, 2014. For the Plan year ending December 31, 2012, the Plan’s actuarial funded ratio was 94.1 percent.
11. Defined Contribution Plan
KUB has a defined contribution 401(k) employee retirement savings plan covering eligible KUB employees. Employees hired prior to January 1, 2011 may participate and receive a matching contribution of 50 percent of their own contribution up to a maximum match of 3 percent. Employees hired on or after January 1, 2011 have an enhanced 401(k) Plan due to the closure of the Defined Benefit Pension Plan. They may participate and receive a matching contribution of 50 percent of their own contribution up to a maximum match of 3 percent. They also receive a nonelective KUB contribution of from 3 percent to 6 percent, depending on years of service, whether they contribute or not.
Since July 1, 2000, 401(k) matching contributions for employees eligible to participate in the KUB Pension Plan have been funded by the Pension Plan. These funds are held by the Pension trustee until eligible for distribution. IRS rules permit the funding of 401(k) matching contributions from excess pension assets for employees covered under the Pension Plan. Given the current funding level of the Pension Plan, effective July 1, 2011, KUB began to reimburse the Pension Plan for the current matching contributions. The match and nonelective contributions for employees hired on or after January 1, 2011 are paid directly by KUB.
Knoxville Utilities Board Notes to Consolidated Financial Statements June 30, 2012 and 2011
38
12. Other Post-Employment Benefits (OPEB)
The Governmental Accounting Standards Board (GASB) established new standards for the measurement, recognition, and reporting of other post-employment benefits (OPEB). OPEB includes post-employment benefits other than pension, which, for KUB, is presently limited to post-employment health care. GASB 45 requires the recognition of the accrued OPEB liability for the respective year, plus the disclosure of the total unfunded liability. GASB 45 was effective for KUB for the fiscal year beginning July 1, 2007.
KUB currently provides post-employment health care benefits to 633 former employees and 647 covered dependents. The cost of coverage is shared with retirees and beneficiaries. KUB recognizes its share of the cost of post-employment health care benefits as an expense as claims are paid.
In anticipation of GASB 45, KUB amended its Group Health Plan in 1999, eliminating post-employment health care benefits for all employees hired on or after July 1, 1999. As of June 30, 2012, 450 active employees were eligible for individual and dependent coverage at separation if the employee meets the Rule of 80 (age plus years of service) with a minimum of 20 years of service.
In May 2006, the state of Tennessee adopted Tennessee Code Annotated, Title 8, Chapter 50, Part 12 authorizing governmental entities to establish Trusts for the purpose of pre-funding their respective OPEB liabilities. Although GASB 45 does not require pre-funding of the liability, KUB has determined that it is in the long-term economic interest of KUB and its ratepayers to establish a Trust to pre-fund KUB’s OPEB liability.
In October 2007, the KUB Board authorized the establishment of an OPEB Trust. The applicable documentation was submitted to the State Funding Board and, in December 2007, the State Funding Board approved the Trust. The Trust was also approved by the Internal Revenue Service in June 2008.
The Trust issues a financial report, which includes financial statements and required supplementary information. The report may be obtained by writing the Knoxville Utilities Board Retirement System, P.O. Box 59017, Knoxville, TN 37950-9017. The general administration and responsibility for the proper operation of the Trust is governed by a board of trustees, appointed by KUB’s President & CEO. The investment of all deposits to the Trust is governed by an Investment Policy, which was adopted by the KUB Board and approved by the State Funding Board.
Total contributions to the OPEB Trust for the fiscal year ended June 30, 2012 were $8.1 million. The contribution to the Trust exceeded the annual required contribution (ARC), as determined by the Postretirement Benefit Plan’s actuarial valuation for the year ended December 31, 2010, which was $4.6 million. As of June 30, 2012, the employer’s net OPEB obligation was $1.7 million.
The ARC for the fiscal year ending June 30, 2013, as determined by the Plan’s actuarial valuation for the year ended December 31, 2011 is $3.3 million.
The actuarial valuation for the Plan for the year ending December 31, 2012 has been completed. The valuation determined that the Plan’s actuarial accrued liability was $61.6 million. The actuarial value of the Plan’s assets was $37.9 million. As a result, the Plan’s unfunded actuarial accrued liability was $23.7 million. The Plan’s actuarial funded ratio was 62 percent. The valuation also determined that the employer’s ARC is $3.3 million for the fiscal year ending June 30, 2014.
Knoxville Utilities Board Notes to Consolidated Financial Statements June 30, 2012 and 2011
39
13. Related Party Transactions
KUB, in the normal course of operations, is involved in transactions with the City of Knoxville. Such transactions for the years ended June 30, 2012 and 2011 are summarized as follows:
2012 2011
City of KnoxvilleAmounts billed by KUB for utilities and
related services $ 11,457,145 $ 11,678,173 Payments by KUB in lieu of property tax 13,453,228 12,899,181 Payments by KUB for services provided 1,118,297 1,217,819
With respect to these transactions, accounts receivable from and accounts payable to the City of Knoxville included in the balance sheet at year end were:
2012 2011
Accounts receivable $ 726,455 $ 831,191
14. Natural Gas Supply Contract Commitments
For fiscal year 2012 the Gas Division hedged 67 percent of its total gas purchases via gas supply contracts. As of June 30, 2012, the Gas Division had hedged the price on approximately 10 percent of its anticipated gas purchases for fiscal year 2013.
KUB contracts separately for the purchase, transportation and storage of natural gas. Purchase commitments for the next five years are as follows:
Firm obligations related to purchased gas – demand
2013 2014 2015 2016 2017
TransportationTennessee Gas Pipeline $ 7,325,892 $ 9,211,524 $ 9,211,524 $ 3,070,508 $ - East Tennessee Natural Gas 10,066,388 10,066,388 10,066,388 3,355,463 -
StorageTennessee Gas Pipeline 2,076,288 2,076,288 2,076,288 692,096 - East Tennessee Natural Gas 757,460 757,460 757,460 252,487 - Saltville Natural Gas 1,545,960 981,900 981,900 981,900 981,900
Demand Total $ 21,771,988 $ 23,093,560 $ 23,093,560 $ 8,352,454 $ 981,900
Knoxville Utilities Board Notes to Consolidated Financial Statements June 30, 2012 and 2011
40
Firm obligations related to purchased gas – commodity
2013 2014 2015 2016 2017
BaseloadConoco $ 1,251,400 $ - $ - $ - $ - Equitable - - - - - Shell Energy 2,423,970 CNX 2,286,518 2,286,518 - - - Commodity Total $ 5,961,888 $ 2,286,518 $ - $ - $ -
The total commodity values presented here are based upon firm supply obligations with each individual natural gas supplier. The firm obligations value for Conoco, and Shell Energy are based upon firm supply obligations at locked prices with those suppliers. The firm obligations value for the CNX contract is based upon firm supply obligations and the applicable four month NYMEX strip prices on July 31, 2012.
15. Other Commitments and Contingencies
In the normal course of business, there are various lawsuits pending against KUB. Management has reviewed these lawsuits with counsel, who is vigorously defending KUB's position and is of the opinion that the ultimate disposition of these matters will not have a material adverse effect on KUB's financial position, results of operations or cash flows.
In February 2005, a Consent Decree was entered into federal court regarding the operation of KUB’s wastewater system. Under the terms of the Consent Decree, the remediation of identified sanitary sewer overflows (“SSOs”) on KUB’s wastewater system must be completed by December 31, 2016. KUB anticipates the Division will spend approximately $530 million in capital investments in order to comply with the terms of the Consent Decree related to the collection system. The Consent Decree also required KUB to perform an evaluation of the wet-weather performance and capacity of its wastewater treatment plants.
In July 2007, KUB submitted a Composite Correction Plan (CCP) for its wastewater treatment plants to EPA for review. The development and filing of the CCP was a requirement of the federal order of February 2005. The CCP includes recommended improvements to KUB’s Kuwahee and Fourth Creek treatment plants to address wet weather capacity issues noted in prior assessments. The EPA approved the CCP in January 2009 including a recommended schedule of plant improvements that extends beyond the expiration date of the original Consent Decree. An amendment to the Consent Decree incorporating and establishing this schedule was agreed to by all parties and was entered on June 23, 2009. The purpose of the Amendment is to allow KUB to complete a portion of work outlined in the CCP after the Consent Decree deadline of June 30, 2016. The CCP provides for a biologically enhanced high-rate clarification (the “BEHRC”) secondary treatment system to be installed at the Fourth Creek treatment plant by June 30, 2018, and at the Kuwahee treatment plant by June 30, 2021. The total cost of such improvements is estimated to be approximately $120 million. KUB anticipates it will invest a total of $650 million in capital improvements to meet the requirements of the Consent Decree.
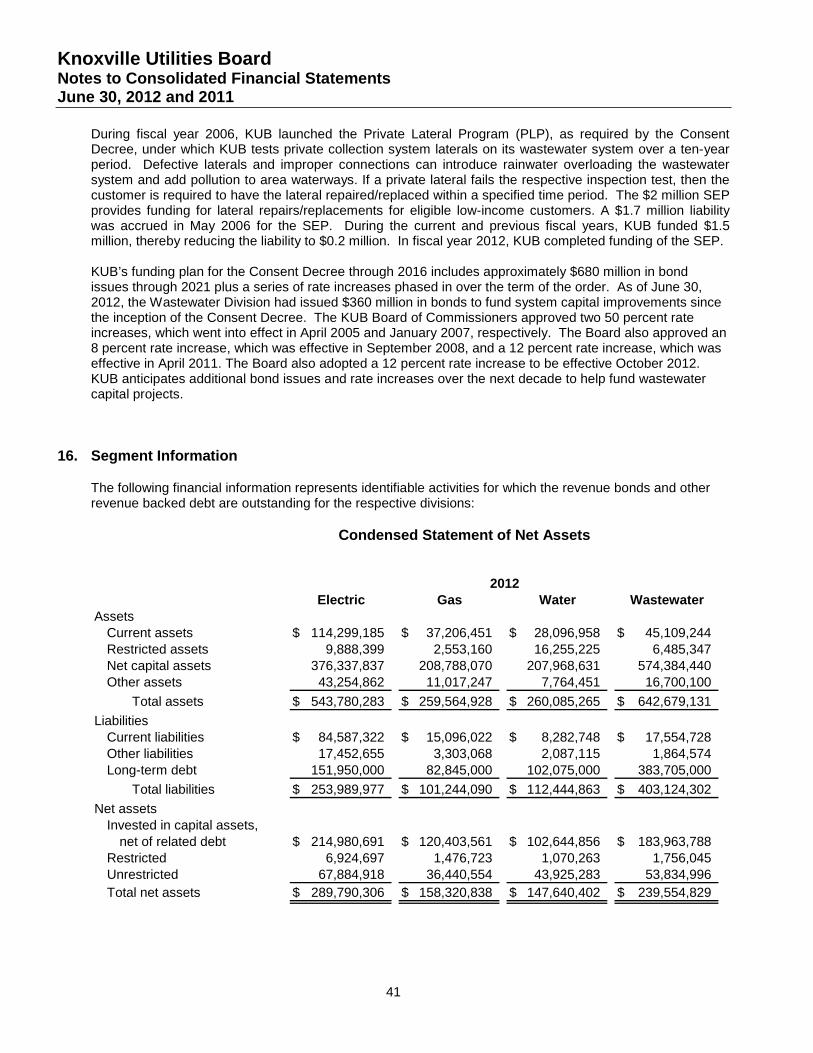
Knoxville Utilities Board Notes to Consolidated Financial Statements June 30, 2012 and 2011
41
During fiscal year 2006, KUB launched the Private Lateral Program (PLP), as required by the Consent Decree, under which KUB tests private collection system laterals on its wastewater system over a ten-year period. Defective laterals and improper connections can introduce rainwater overloading the wastewater system and add pollution to area waterways. If a private lateral fails the respective inspection test, then the customer is required to have the lateral repaired/replaced within a specified time period. The $2 million SEP provides funding for lateral repairs/replacements for eligible low-income customers. A $1.7 million liability was accrued in May 2006 for the SEP. During the current and previous fiscal years, KUB funded $1.5 million, thereby reducing the liability to $0.2 million. In fiscal year 2012, KUB completed funding of the SEP. KUB’s funding plan for the Consent Decree through 2016 includes approximately $680 million in bond issues through 2021 plus a series of rate increases phased in over the term of the order. As of June 30, 2012, the Wastewater Division had issued $360 million in bonds to fund system capital improvements since the inception of the Consent Decree. The KUB Board of Commissioners approved two 50 percent rate increases, which went into effect in April 2005 and January 2007, respectively. The Board also approved an 8 percent rate increase, which was effective in September 2008, and a 12 percent rate increase, which was effective in April 2011. The Board also adopted a 12 percent rate increase to be effective October 2012. KUB anticipates additional bond issues and rate increases over the next decade to help fund wastewater capital projects.
16. Segment Information
The following financial information represents identifiable activities for which the revenue bonds and other revenue backed debt are outstanding for the respective divisions:
Condensed Statement of Net Assets
2012
Electric Gas Water WastewaterAssets
Current assets 114,299,185$ 37,206,451$ 28,096,958$ 45,109,244$ Restricted assets 9,888,399 2,553,160 16,255,225 6,485,347 Net capital assets 376,337,837 208,788,070 207,968,631 574,384,440 Other assets 43,254,862 11,017,247 7,764,451 16,700,100
Total assets 543,780,283$ 259,564,928$ 260,085,265$ 642,679,131$ Liabilities
Current liabilities 84,587,322$ 15,096,022$ 8,282,748$ 17,554,728$ Other liabilities 17,452,655 3,303,068 2,087,115 1,864,574 Long-term debt 151,950,000 82,845,000 102,075,000 383,705,000
Total liabilities 253,989,977$ 101,244,090$ 112,444,863$ 403,124,302$ Net assets
Invested in capital assets, net of related debt 214,980,691$ 120,403,561$ 102,644,856$ 183,963,788$
Restricted 6,924,697 1,476,723 1,070,263 1,756,045 Unrestricted 67,884,918 36,440,554 43,925,283 53,834,996 Total net assets 289,790,306$ 158,320,838$ 147,640,402$ 239,554,829$
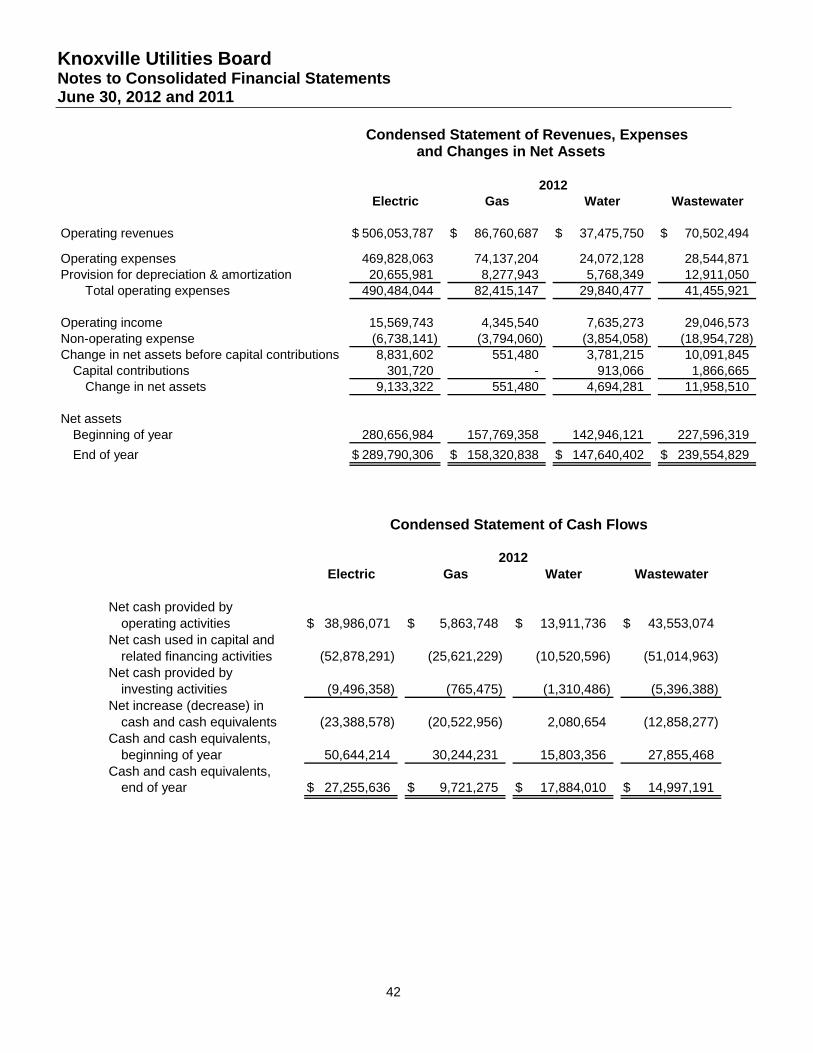
Knoxville Utilities Board Notes to Consolidated Financial Statements June 30, 2012 and 2011
42
Condensed Statement of Revenues, Expenses and Changes in Net Assets
2012Electric Gas Water Wastewater
Operating revenues 506,053,787$ 86,760,687$ 37,475,750$ 70,502,494$
Operating expenses 469,828,063 74,137,204 24,072,128 28,544,871 Provision for depreciation & amortization 20,655,981 8,277,943 5,768,349 12,911,050
Total operating expenses 490,484,044 82,415,147 29,840,477 41,455,921
Operating income 15,569,743 4,345,540 7,635,273 29,046,573 Non-operating expense (6,738,141) (3,794,060) (3,854,058) (18,954,728) Change in net assets before capital contributions 8,831,602 551,480 3,781,215 10,091,845
Capital contributions 301,720 - 913,066 1,866,665 Change in net assets 9,133,322 551,480 4,694,281 11,958,510
Net assetsBeginning of year 280,656,984 157,769,358 142,946,121 227,596,319 End of year 289,790,306$ 158,320,838$ 147,640,402$ 239,554,829$
Condensed Statement of Cash Flows
2012Electric Gas Water Wastewater
Net cash provided byoperating activities 38,986,071$ 5,863,748$ 13,911,736$ 43,553,074$
Net cash used in capital andrelated financing activities (52,878,291) (25,621,229) (10,520,596) (51,014,963)
Net cash provided byinvesting activities (9,496,358) (765,475) (1,310,486) (5,396,388)
Net increase (decrease) incash and cash equivalents (23,388,578) (20,522,956) 2,080,654 (12,858,277)
Cash and cash equivalents,beginning of year 50,644,214 30,244,231 15,803,356 27,855,468
Cash and cash equivalents,end of year 27,255,636$ 9,721,275$ 17,884,010$ 14,997,191$
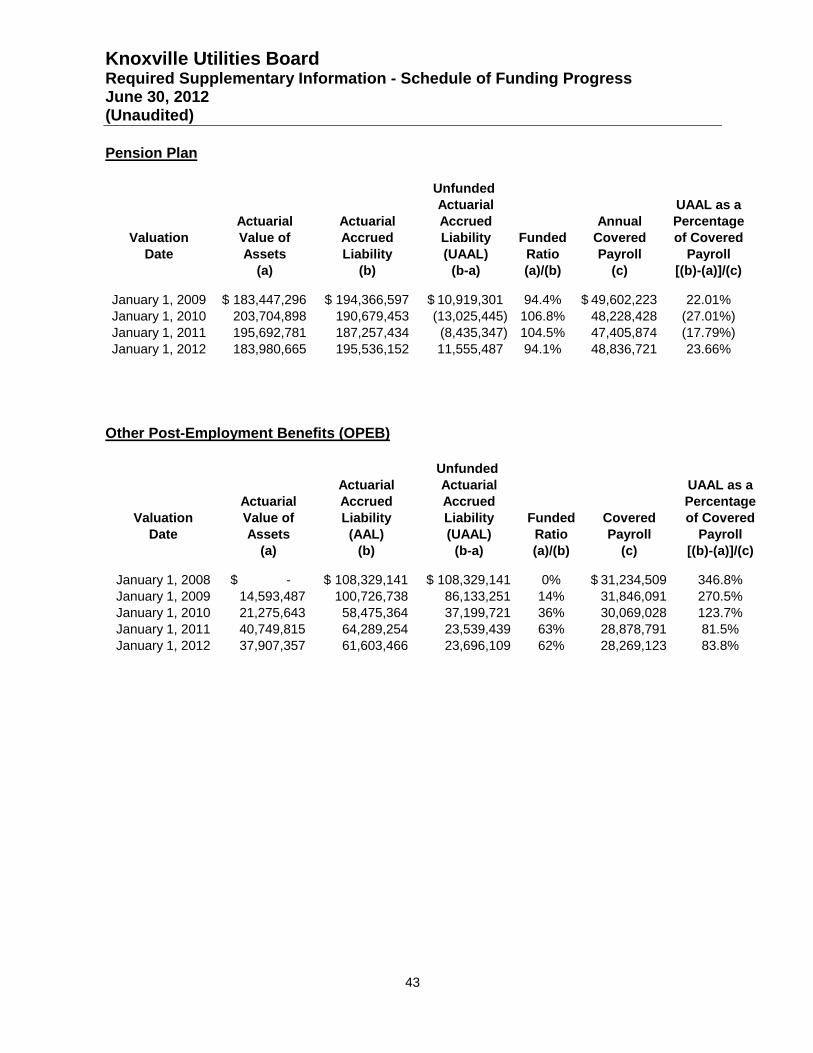
Knoxville Utilities Board Required Supplementary Information - Schedule of Funding Progress June 30, 2012 (Unaudited)
43
Pension Plan
Unfunded Actuarial UAAL as a
Actuarial Actuarial Accrued Annual PercentageValuation Value of Accrued Liability Funded Covered of Covered
Date Assets Liability (UAAL) Ratio Payroll Payroll(a) (b) (b-a) (a)/(b) (c) [(b)-(a)]/(c)
January 1, 2009 183,447,296$ 194,366,597$ 10,919,301$ 94.4% 49,602,223$ 22.01%January 1, 2010 203,704,898 190,679,453 (13,025,445) 106.8% 48,228,428 (27.01%)January 1, 2011 195,692,781 187,257,434 (8,435,347) 104.5% 47,405,874 (17.79%)January 1, 2012 183,980,665 195,536,152 11,555,487 94.1% 48,836,721 23.66%
Other Post-Employment Benefits (OPEB)
Unfunded Actuarial Actuarial UAAL as a
Actuarial Accrued Accrued PercentageValuation Value of Liability Liability Funded Covered of Covered
Date Assets (AAL) (UAAL) Ratio Payroll Payroll(a) (b) (b-a) (a)/(b) (c) [(b)-(a)]/(c)
January 1, 2008 -$ 108,329,141$ 108,329,141$ 0% 31,234,509$ 346.8%January 1, 2009 14,593,487 100,726,738 86,133,251 14% 31,846,091 270.5%January 1, 2010 21,275,643 58,475,364 37,199,721 36% 30,069,028 123.7%January 1, 2011 40,749,815 64,289,254 23,539,439 63% 28,878,791 81.5%January 1, 2012 37,907,357 61,603,466 23,696,109 62% 28,269,123 83.8%
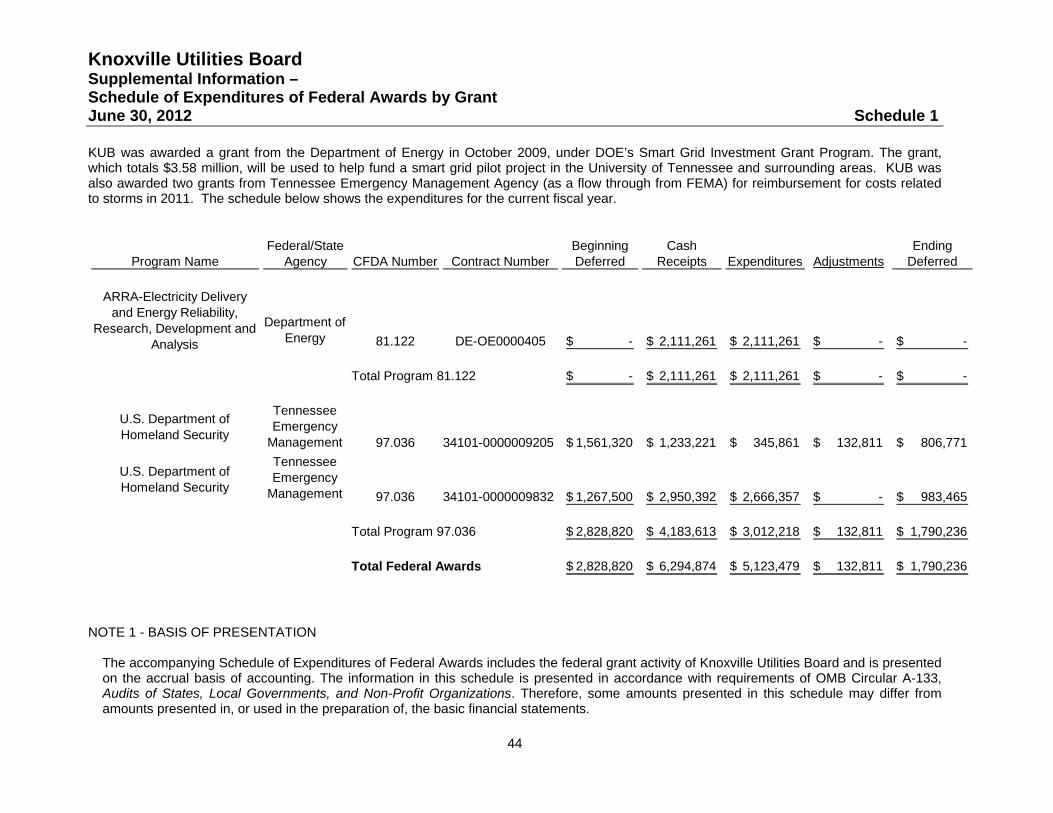
Knoxville Utilities Board Supplemental Information – Schedule of Expenditures of Federal Awards by Grant June 30, 2012 Schedule 1
44
KUB was awarded a grant from the Department of Energy in October 2009, under DOE’s Smart Grid Investment Grant Program. The grant, which totals $3.58 million, will be used to help fund a smart grid pilot project in the University of Tennessee and surrounding areas. KUB was also awarded two grants from Tennessee Emergency Management Agency (as a flow through from FEMA) for reimbursement for costs related to storms in 2011. The schedule below shows the expenditures for the current fiscal year.
Federal/State Beginning Cash EndingProgram Name Agency CFDA Number Contract Number Deferred Receipts Expenditures Adjustments Deferred
ARRA-Electricity Delivery and Energy Reliability,
Research, Development and Analysis
Department of Energy 81.122 DE-OE0000405 -$ 2,111,261$ 2,111,261$ -$ -$
Total Program 81.122 -$ 2,111,261$ 2,111,261$ -$ -$
U.S. Department of Homeland Security
Tennessee Emergency
Management 97.036 34101-0000009205 1,561,320$ 1,233,221$ 345,861$ 132,811$ 806,771$
U.S. Department of Homeland Security
Tennessee Emergency
Management 97.036 34101-0000009832 1,267,500$ 2,950,392$ 2,666,357$ -$ 983,465$
Total Program 97.036 2,828,820$ 4,183,613$ 3,012,218$ 132,811$ 1,790,236$
Total Federal Awards 2,828,820$ 6,294,874$ 5,123,479$ 132,811$ 1,790,236$
NOTE 1 - BASIS OF PRESENTATION
The accompanying Schedule of Expenditures of Federal Awards includes the federal grant activity of Knoxville Utilities Board and is presented on the accrual basis of accounting. The information in this schedule is presented in accordance with requirements of OMB Circular A-133, Audits of States, Local Governments, and Non-Profit Organizations. Therefore, some amounts presented in this schedule may differ from amounts presented in, or used in the preparation of, the basic financial statements.
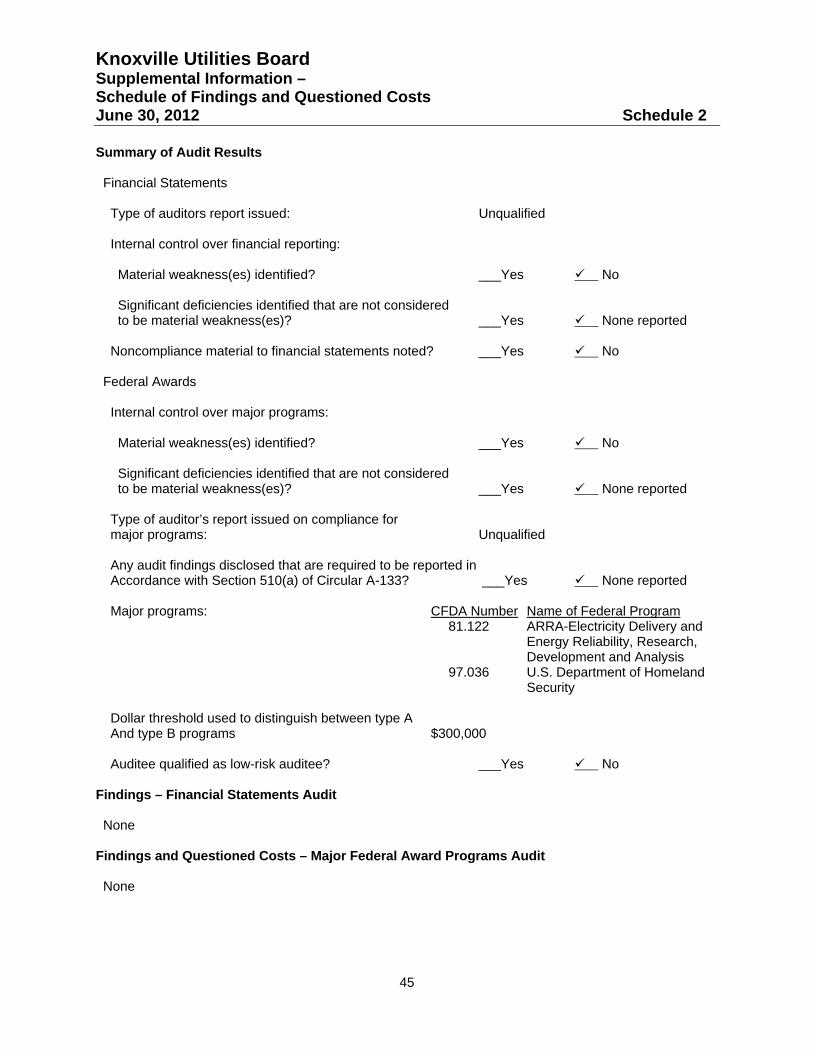
Knoxville Utilities Board Supplemental Information – Schedule of Findings and Questioned Costs June 30, 2012 Schedule 2
45
Summary of Audit Results Financial Statements Type of auditors report issued: Unqualified Internal control over financial reporting: Material weakness(es) identified? ___Yes No Significant deficiencies identified that are not considered to be material weakness(es)? ___Yes None reported Noncompliance material to financial statements noted? ___Yes No Federal Awards Internal control over major programs: Material weakness(es) identified? ___Yes No Significant deficiencies identified that are not considered to be material weakness(es)? ___Yes None reported Type of auditor’s report issued on compliance for major programs: Unqualified Any audit findings disclosed that are required to be reported in Accordance with Section 510(a) of Circular A-133? ___Yes None reported Major programs: CFDA Number Name of Federal Program
81.122 ARRA-Electricity Delivery and Energy Reliability, Research, Development and Analysis
97.036 U.S. Department of Homeland Security
Dollar threshold used to distinguish between type A And type B programs $300,000 Auditee qualified as low-risk auditee? ___Yes No Findings – Financial Statements Audit None Findings and Questioned Costs – Major Federal Award Programs Audit None
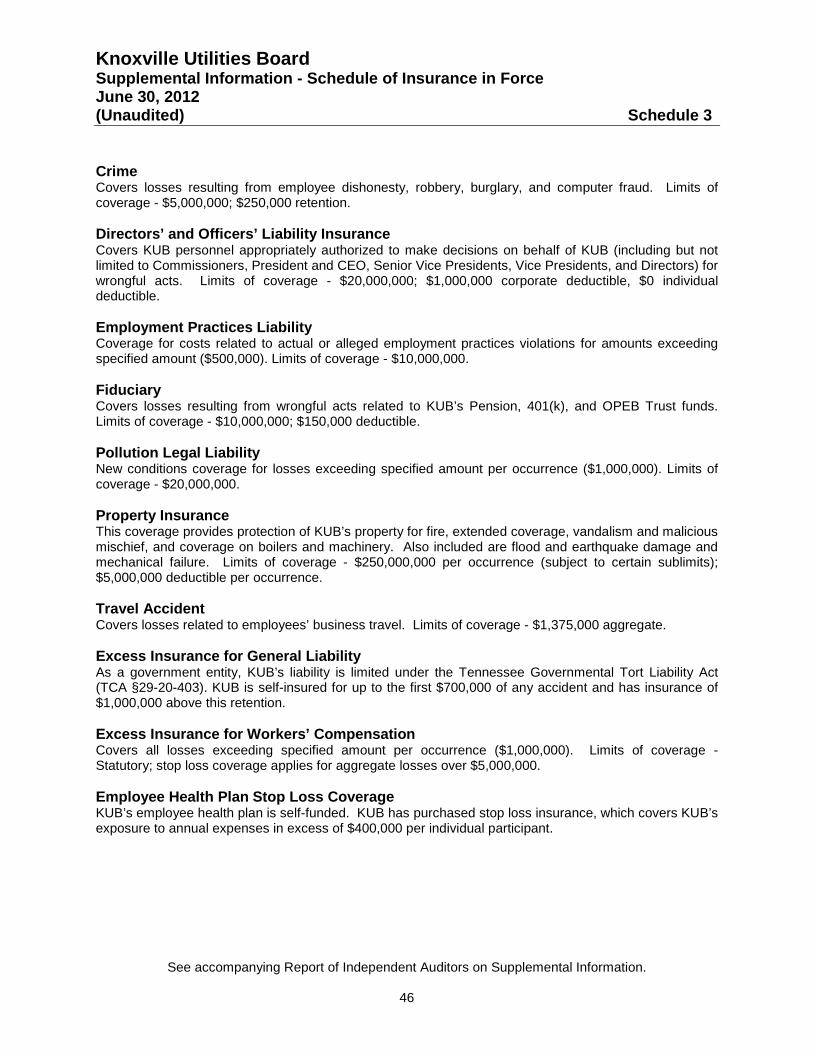
Knoxville Utilities Board Supplemental Information - Schedule of Insurance in Force June 30, 2012 (Unaudited) Schedule 3
See accompanying Report of Independent Auditors on Supplemental Information.
46
Crime Covers losses resulting from employee dishonesty, robbery, burglary, and computer fraud. Limits of coverage - $5,000,000; $250,000 retention. Directors’ and Officers’ Liability Insurance Covers KUB personnel appropriately authorized to make decisions on behalf of KUB (including but not limited to Commissioners, President and CEO, Senior Vice Presidents, Vice Presidents, and Directors) for wrongful acts. Limits of coverage - $20,000,000; $1,000,000 corporate deductible, $0 individual deductible. Employment Practices Liability Coverage for costs related to actual or alleged employment practices violations for amounts exceeding specified amount ($500,000). Limits of coverage - $10,000,000. Fiduciary Covers losses resulting from wrongful acts related to KUB’s Pension, 401(k), and OPEB Trust funds. Limits of coverage - $10,000,000; $150,000 deductible. Pollution Legal Liability New conditions coverage for losses exceeding specified amount per occurrence ($1,000,000). Limits of coverage - $20,000,000. Property Insurance This coverage provides protection of KUB’s property for fire, extended coverage, vandalism and malicious mischief, and coverage on boilers and machinery. Also included are flood and earthquake damage and mechanical failure. Limits of coverage - $250,000,000 per occurrence (subject to certain sublimits); $5,000,000 deductible per occurrence. Travel Accident Covers losses related to employees’ business travel. Limits of coverage - $1,375,000 aggregate. Excess Insurance for General Liability As a government entity, KUB’s liability is limited under the Tennessee Governmental Tort Liability Act (TCA §29-20-403). KUB is self-insured for up to the first $700,000 of any accident and has insurance of $1,000,000 above this retention. Excess Insurance for Workers’ Compensation Covers all losses exceeding specified amount per occurrence ($1,000,000). Limits of coverage - Statutory; stop loss coverage applies for aggregate losses over $5,000,000. Employee Health Plan Stop Loss Coverage KUB’s employee health plan is self-funded. KUB has purchased stop loss insurance, which covers KUB’s exposure to annual expenses in excess of $400,000 per individual participant.
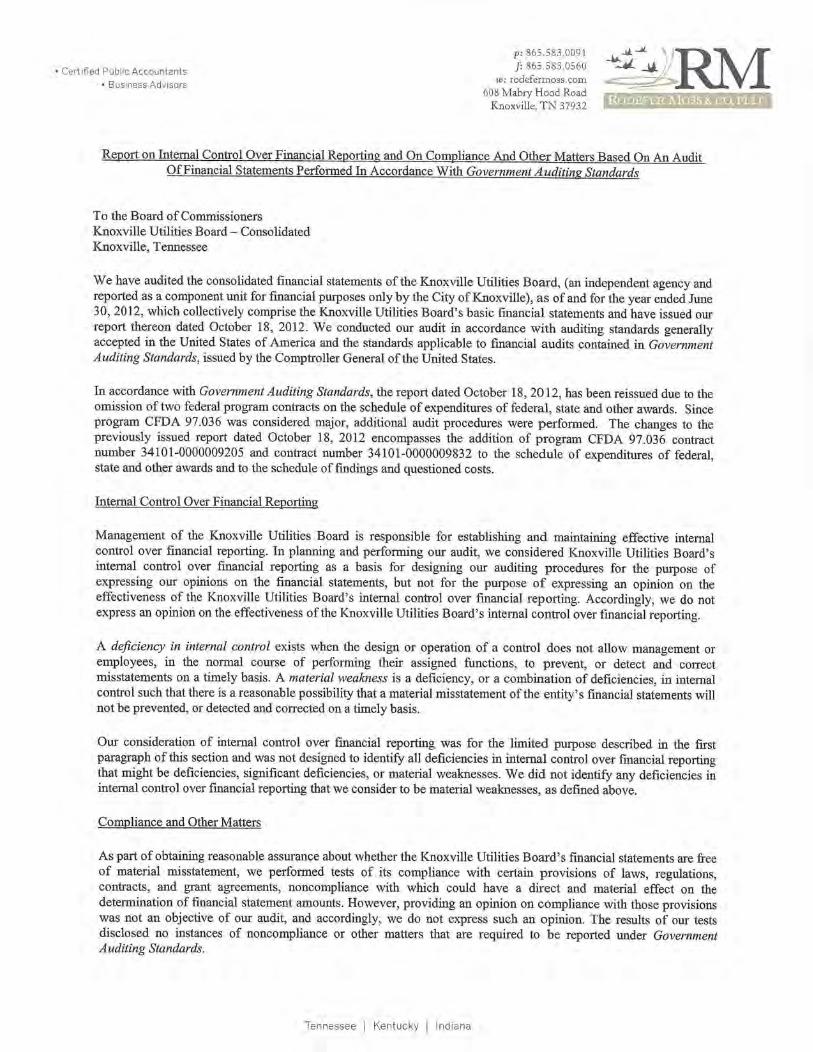
Knoxville Utilities Board Electric Division Financial Statements and Supplemental Information June 30, 2012 and 2011
Knoxville Utilities Board Electric Division Index June 30, 2012 and 2011
Page(s)
Independent Auditors’ Report ................................................................................................ 1-2
Management’s Discussion and Analysis .................................................................................. 3-19
Basic Financial Statements
Statements of Net Assets ...................................................................................................... 20-21
Statements of Revenues, Expenses and Changes in Net Assets .............................................. 22
Statements of Cash Flows .......................................................................................................... 23
Notes to Financial Statements ............................................................................................... 24-37
Required Supplementary Information – Schedule of Funding Progress ..................................... 38
Supplemental Information
Schedule 1 – Schedule of Expenditures of Federal Awards ...................................................... 39
Schedule 2 – Schedule of Findings and Questioned Costs ........................................................ 40
Schedule 3 – Schedule of Insurance in Force ............................................................................ 41
Schedule 4 – Schedule of Debt Maturities by Fiscal Year .......................................................... 42
Schedule 5 – Schedule of Current Rates in Force ................................................................. 43-67
Report of Independent Auditors on Internal Control over Financial Reporting and on Compliance and Other Matters Based on an Audit of Financial Statements Performed in Accordance with Government Auditing Standards .......................................................... 68-69
Report of Independent Auditors Report on Compliance with Requirements that could have a Direct Material Effect on each Major Program and on Internal Control over Compliance in Accordance with OMB Circular A-133 ...................................................... 70-71
Knoxville Utilities Board Electric Division Management’s Discussion and Analysis June 30, 2012 and 2011
3
Knoxville Utilities Board (KUB), comprised of the Electric Division, Water Division, Gas Division, and Wastewater Division (Divisions), is reported as a component unit enterprise fund in the financial statements of the City of Knoxville. KUB's responsibility is to oversee the purchase, production, distribution, and processing of electricity, water, natural gas, and wastewater services. A seven-member Board of Commissioners governs KUB. The Board has all powers to construct, acquire, expand, or operate the Divisions. It has full control and complete jurisdiction over the management and operation of the Divisions. The Electric Division (Division) provides services to certain customers in Knox County and in seven surrounding counties in East Tennessee. The Division's accounts are maintained in conformity with the Uniform System of Accounts of the Federal Energy Regulatory Commission and the Governmental Accounting Standards Board, as applicable. The financial statements present only the Electric Division and do not purport to, and do not, present fairly the consolidated financial position of Knoxville Utilities Board at June 30, 2012 and 2011, and the changes in its financial position for the years then ended in conformity with accounting principles generally accepted in the United States of America.
The Division’s discussion and analysis is designed to (a) assist the reader in focusing on significant financial issues, (b) provide an overview of the Division’s financial activity, (c) identify major changes in the Division’s financial position, and (d) identify any financial concerns.
The Division’s Management Discussion and Analysis (“MD&A”) focuses on the fiscal year ending June 30, 2012 activities, resulting changes and current known facts, and should be read in conjunction with the Division’s financial statements.
Electric Division Highlights
System Highlights KUB serves 197,700 customers over a 688 square mile service area. KUB maintains 5,280 miles of service lines and 64 electric substations to provide 5.6 million mega watt-hours to its customers annually. Electric distribution system capacity is 2.6 million kVA. KUB met its peak single day capacity of 1,246,398 kW in January 2009.
Financial Highlights The Division’s net assets increased $9.1 million or 3.25 percent, compared to a $12.2 million increase last fiscal year.
Operating revenue decreased $15.5 million or 3 percent as purchased power expense declined $14.6 million compared with the prior year. The drop in operating revenue was primarily due to lower sales volumes, the result of the mildest winter in KUB’s service territory in the last 25 years. The impact of lower sales was partially offset by additional revenue from a one percent KUB rate increase and the flow through of TVA rate adjustments. KUB flows changes to wholesale power rates directly through to its retail electric rates via its Purchased Power Adjustment. Margin on electric sales (operating revenue less purchased power expense) decreased $0.9 million or 1 percent, the combined result of a 4.6 percent decline in billed sales and a one percent rate increase effective October 2011.
Operating expenses (excluding purchased power expense) increased $1.6 million or 2 percent. Operating and maintenance (“O&M”) expenditures increased $1.3 million or 2.7 percent. Depreciation expense decreased $0.1 million or 0.4 percent. Taxes and tax equivalents were $0.4 million higher than the prior fiscal year.
Lower interest rates on investments resulted in a $0.1 million decrease in interest income. Interest expense increased $0.2 million or 3.1 percent, reflecting a full year of interest expense on revenue bonds sold in December 2010. Those items contributed to a net decrease in other income of $0.3 million compared to the prior year.
Knoxville Utilities Board Electric Division Management’s Discussion and Analysis June 30, 2012 and 2011
4
Capital contributions fell $0.3 million, the result of street lighting assets provided to KUB in the prior fiscal year.
Total plant assets (net) increased $27.1 million or 7.7 percent over the end of the last fiscal year due to the net addition of $26.2 million for distribution system improvements and the installation of electric system facilities to provide for new electric services.
Long-term debt represented 35.4 percent of the Division’s capital structure as of June 30, 2012, compared to 37.5 percent last year. Capital structure equals long-term debt (including the current portion of any revenue bonds and notes, as applicable, due to be retired the next fiscal year) plus net assets.
The Division’s bond covenants require a debt service coverage ratio of at least 1.2 times the maximum principal and interest payments over the life of the Division’s outstanding bonds. Current year debt coverage for the fiscal year was 3.43. Maximum debt service coverage was 3.49.
Division Highlights KUB added 1,200 customers to its electric system in fiscal year 2012. Last fiscal year KUB experienced a net reduction of 800 electric system customers.
The Board of Commissioners adopted a one percent rate increase, effective on October 2011 customer bills, to help fund the Century II electric program. The Division generated $4.8 million of additional margin during the fiscal year as a result of the rate increase.
The Division refunded $39.8 million in outstanding electric system revenue bonds at lower interest rates in April 2012. This refunding will provide debt service savings of $6.8 million over the life of the bonds. In October 2011, TVA increased wholesale base power rates by 3 percent. KUB passed this rate increase along to its electric customers through the Purchased Power Adjustment.
The typical residential customer’s monthly electric bill was $97.04 of June 30, 2012, representing a increase of $0.67 or 0.7 percent compared to June 30, 2011. The increase in the monthly bill was the combined result of KUB’s 1 percent rate increase and the flow-through of TVA wholesale rate adjustments.
81 percent of electric system sales revenue was paid to TVA for wholesale power purchases for the fiscal year ended June 30, 2012.
Two historic storm events, with a combined cost of $8.4 million, impacted the electric system during fiscal year 2011. KUB received $4.2 million in reimbursements from the Federal Emergency Management Agency (FEMA) during fiscal year 2012. KUB anticipates an additional $2.1 million in reimbursements from FEMA in fiscal year 2013.
KUB was awarded a grant from the Department of Energy in October 2009 under DOE’s Smart Grid Investment Grant Program. The grant, which totals $3.58 million, will be used to help fund a smart grid pilot project in the University of Tennessee and surrounding areas. The pilot project includes the installation of over 6,000 digital electronic smart meters and an advanced metering infrastructure (AMI) communications backbone, which will provide coverage for KUB’s entire service territory. The communications infrastructure will enable KUB to remotely read the meters, and also provide remote service connection/disconnection capabilities. The term of the pilot is approximately three years. During fiscal year 2012, KUB installed the advanced metering infrastructure (AMI) communications backbone. The grant funded $2.1 million of the communications infrastructure installed this fiscal year.
Knoxville Utilities Board Electric Division Management’s Discussion and Analysis June 30, 2012 and 2011
5
Century II Infrastructure Program
In 2007 KUB launched Century II, a new infrastructure management program, which includes the assessment of each utility system’s infrastructure and the appropriateness of current life cycle replacement programs. KUB placed its electric and water Century II programs on hold in 2009 in response to the economic recession in an effort to help customers struggling in the difficult economy. Although major increases to infrastructure replacement funding were delayed, significant investments were made to maintain reliability and system integrity. In April 2011, given the critical infrastructure needs of the electric and water distribution systems, management recommended the Board endorse a plan to resume Century II electric and water programs in fiscal year 2012. A ten year funding plan was developed to support the implementation of the electric and water Century II programs, which included a combination of rate increases and debt issues to fully fund the programs for the next ten years. The electric distribution system is an older system with several major components nearing the end of or exceeding their respective service lives, including certain substation transformers, wood poles, and underground cable. In addition, KUB needs to upgrade certain existing circuits and build new circuits to provide greater operational flexibility and reduce storm restoration times. Ten years of Century II funding for the electric system would cover replacing all critical substation transformers, 26,000 wood poles, and all XLP (cross-linked polyethylene) underground cable. At the proposed rate of pole replacement, no poles older than the mid-1960s would remain after ten years. Replacing all XLP cable is critical, as this type of cable has experienced a significantly higher failure rate in recent years. In September 2011, the KUB Board adopted a resolution, which endorsed the Century II electric program and the associated ten-year funding plan. The resolution also adopted the initial three electric rate increases, the first of which was effective October 1, 2011. The remaining two will be effective October 1, 2012 and October 1, 2013, respectively. Each of the rate increases will generate an additional $5 million in annual electric sales revenue. For residential electric customers this will result in an increase of $1 in their monthly electric bill for each of the rate increases. With Board approval, KUB immediately began implementing the accelerated pace of infrastructure replacement for the electric system. For the fiscal year ending June 30, 2012, KUB exceeded its target replacement goals for its key electric system assets, while staying within its total capital budget. 2,800 poles were replaced, exceeding the target level of 2,300, and 17.5 miles of underground electric cable were replaced, exceeding the target level of 12.5 miles.
(Space left intentionally blank)
Knoxville Utilities Board Electric Division Management’s Discussion and Analysis June 30, 2012 and 2011
6
Division Cash Budget Appropriations KUB’s Board of Commissioners adopted an Electric Division budget of $579.2 million for fiscal year 2012, which included additional funding of $7.2 million for Century II capital projects. At year end, actual cash expenditures were $42.6 million or 7.4 percent below budget. Purchased power expense was $44.1 million below budget, reflecting lower than planned energy purchases as a result of warmer winter weather and lower than expected wholesale power rates. Capital expenditures were $1.2 million higher than expected, as KUB exceeded its planned replacement levels for its key electric asset programs. Operating receipts were $37.3 million less than expected, due to lower than expected customer demand and the flow-through of lower than expected wholesale power rates. Bond proceeds of $9.9 million were transferred to the Division’s general fund to pay for capital during fiscal year 2012. The amount transferred was $4.2 million more than expected due to the timing of capital projects in fiscal year 2011. The Electric Division general fund year-end balance was $9.2 million higher than budgeted. The numbers below are presented on a cash basis.
Electric Division Cash Report As of June 30, 2012
(in thousands of dollars) FY 2012 FY 2012 Dollar Percent Budget Actual FYTD Variance* Variance Beginning Balance General Fund $ 58,644 $ 58,644 Operating Receipts 551,784 511,452 (40,332) -7.3% Disbursements Purchased Energy Expense 450,454 406,376 44,078 -9.8% Operation & Maintenance Expense 48,299 48,047 252 -0.5% Capital Expenditures 54,744 55,915 (1,171) 2.1% Debt Service & Taxes 25,688 26,214 (526) 2.0% Total Disbursements 579,185 536,552 42,633 -7.4% Bond Proceeds 5,657 9,879 4,222 74.6% Net Flow-throughs and Transfers 148 (167) (315) - Ending General Fund Balance $ 37,048 $ 43,256 $ 6,208 16.8%
*(-) indicates a decrease to cash
KUB, Electric Division, Financial Statements The Division’s financial performance is reported under three basic financial statements: the Statement of Net Assets; the Statement of Revenues, Expenses and Changes in Net Assets; and the Statement of Cash Flows. Statement of Net Assets The Division reports its assets, liabilities, and net assets in the Statement of Net Assets. Assets are classified as current, restricted, electric plant in service, or other assets. Liabilities are classified as current, other, or long-term debt. Net assets are classified as invested in
Knoxville Utilities Board Electric Division Management’s Discussion and Analysis June 30, 2012 and 2011
7
capital assets, net of related debt; restricted; or unrestricted. Net assets tell the user what the Division has done with its accumulated earnings, not just the balance. Invested in capital assets, net of related debt, is the net book value of all capital assets less the outstanding balances of debt used to acquire, construct, or improve those assets. Restricted net assets are assets that have been limited to specific uses by the Division’s bond covenants or through resolutions passed by the KUB Board of Commissioners. Unrestricted net assets are a residual classification; the amount remaining after reporting net assets as either invested in capital or restricted is reported there. Statement of Revenues, Expenses and Changes in Net Assets The Division reports its revenues and expenses (both operating and non-operating) on the Statement of Revenues, Expenses and Changes in Net Assets. In addition, any capital contributions or assets donated by developers are reported on this statement. Total revenue less total expense equals the change in net assets for the reporting period. Net assets at the beginning of the period are increased or decreased, as applicable, by the change in net assets for the reporting period. The change in net assets for the reporting period is added to the net assets segment of the Statement of Net Assets. Statement of Cash Flows The Division reports its cash flows from operating activities, capital and related-financing activities, and investing activities on its Statement of Cash Flows. This statement tells the user the Division’s sources and uses of cash during the reporting period. The statement indicates the Division’s beginning cash balance and ending cash balance and how it was either increased or decreased during the reporting period. The statement also reconciles cash flow back to operating income as it appears on the Statement of Revenues, Expenses and Changes in Net Assets.
(Space left intentionally blank)
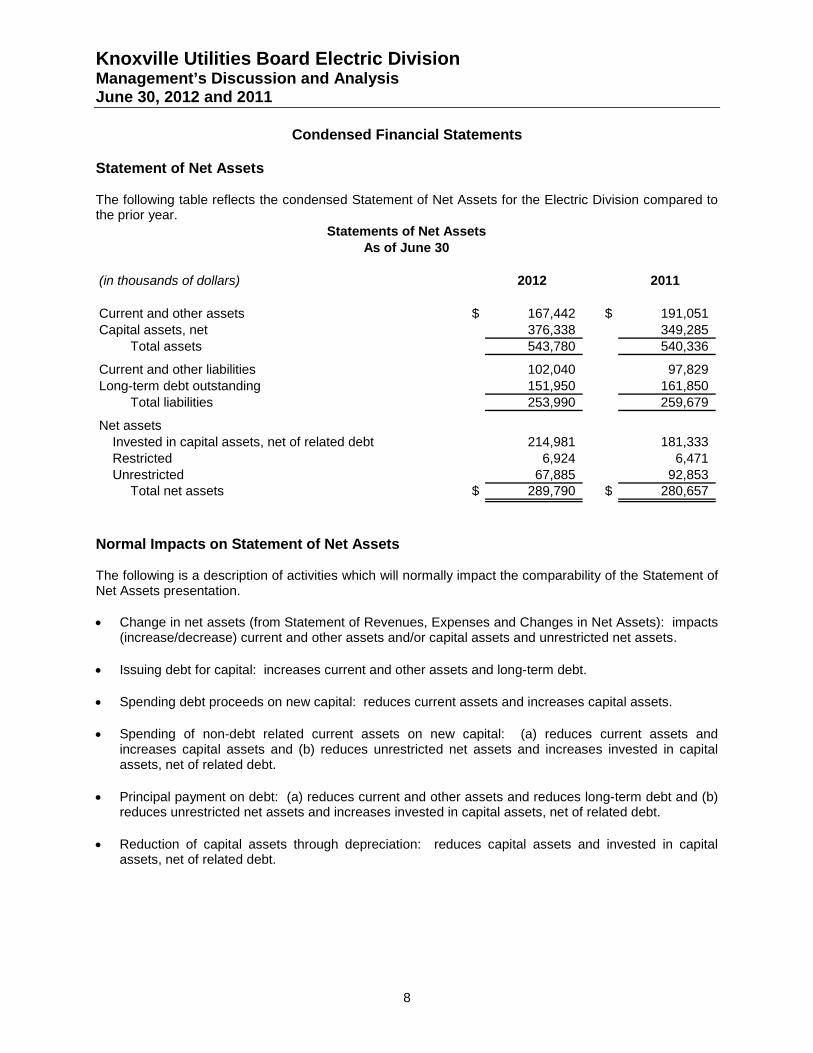
Knoxville Utilities Board Electric Division Management’s Discussion and Analysis June 30, 2012 and 2011
8
Condensed Financial Statements Statement of Net Assets The following table reflects the condensed Statement of Net Assets for the Electric Division compared to the prior year.
(in thousands of dollars) 2012 2011
Current and other assets $ 167,442 $ 191,051 Capital assets, net 376,338 349,285
Total assets 543,780 540,336
Current and other liabilities 102,040 97,829 Long-term debt outstanding 151,950 161,850
Total liabilities 253,990 259,679
Net assetsInvested in capital assets, net of related debt 214,981 181,333 Restricted 6,924 6,471 Unrestricted 67,885 92,853
Total net assets $ 289,790 $ 280,657
Statements of Net AssetsAs of June 30
Normal Impacts on Statement of Net Assets The following is a description of activities which will normally impact the comparability of the Statement of Net Assets presentation. • Change in net assets (from Statement of Revenues, Expenses and Changes in Net Assets): impacts
(increase/decrease) current and other assets and/or capital assets and unrestricted net assets.
• Issuing debt for capital: increases current and other assets and long-term debt.
• Spending debt proceeds on new capital: reduces current assets and increases capital assets.
• Spending of non-debt related current assets on new capital: (a) reduces current assets and increases capital assets and (b) reduces unrestricted net assets and increases invested in capital assets, net of related debt.
• Principal payment on debt: (a) reduces current and other assets and reduces long-term debt and (b) reduces unrestricted net assets and increases invested in capital assets, net of related debt.
• Reduction of capital assets through depreciation: reduces capital assets and invested in capital assets, net of related debt.
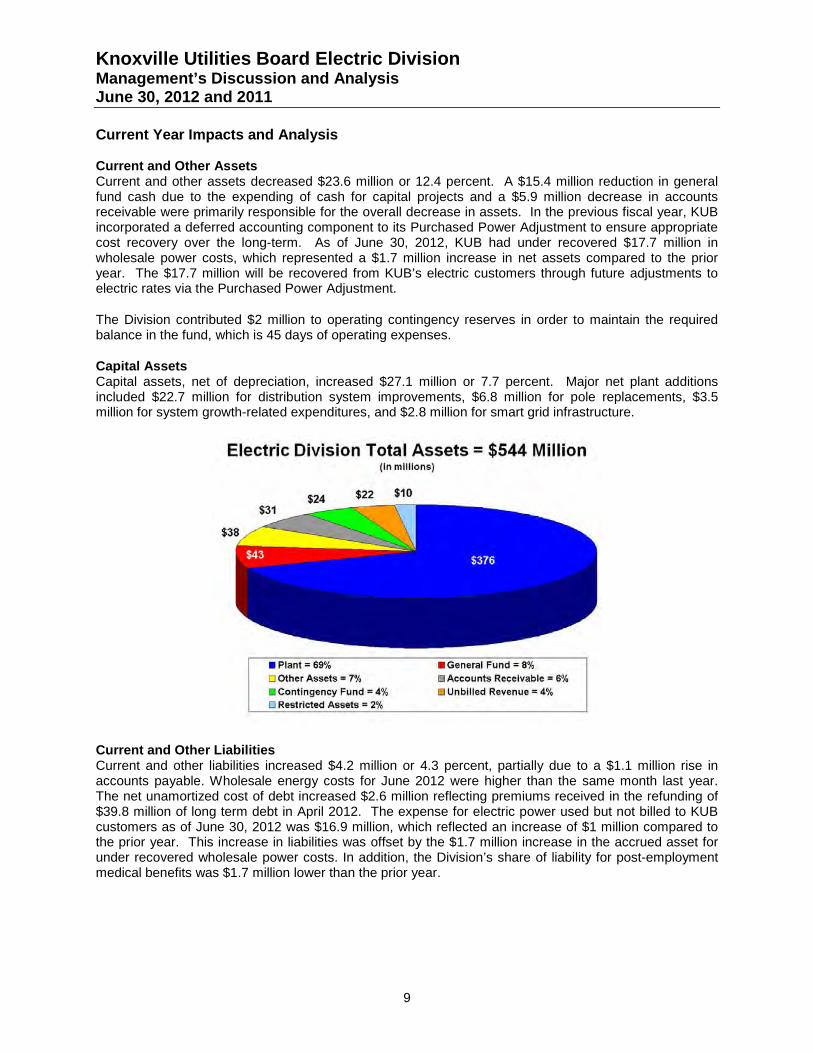
Knoxville Utilities Board Electric Division Management’s Discussion and Analysis June 30, 2012 and 2011
9
Current Year Impacts and Analysis Current and Other Assets Current and other assets decreased $23.6 million or 12.4 percent. A $15.4 million reduction in general fund cash due to the expending of cash for capital projects and a $5.9 million decrease in accounts receivable were primarily responsible for the overall decrease in assets. In the previous fiscal year, KUB incorporated a deferred accounting component to its Purchased Power Adjustment to ensure appropriate cost recovery over the long-term. As of June 30, 2012, KUB had under recovered $17.7 million in wholesale power costs, which represented a $1.7 million increase in net assets compared to the prior year. The $17.7 million will be recovered from KUB’s electric customers through future adjustments to electric rates via the Purchased Power Adjustment.
The Division contributed $2 million to operating contingency reserves in order to maintain the required balance in the fund, which is 45 days of operating expenses.
Capital Assets Capital assets, net of depreciation, increased $27.1 million or 7.7 percent. Major net plant additions included $22.7 million for distribution system improvements, $6.8 million for pole replacements, $3.5 million for system growth-related expenditures, and $2.8 million for smart grid infrastructure.
Current and Other Liabilities Current and other liabilities increased $4.2 million or 4.3 percent, partially due to a $1.1 million rise in accounts payable. Wholesale energy costs for June 2012 were higher than the same month last year. The net unamortized cost of debt increased $2.6 million reflecting premiums received in the refunding of $39.8 million of long term debt in April 2012. The expense for electric power used but not billed to KUB customers as of June 30, 2012 was $16.9 million, which reflected an increase of $1 million compared to the prior year. This increase in liabilities was offset by the $1.7 million increase in the accrued asset for under recovered wholesale power costs. In addition, the Division’s share of liability for post-employment medical benefits was $1.7 million lower than the prior year.
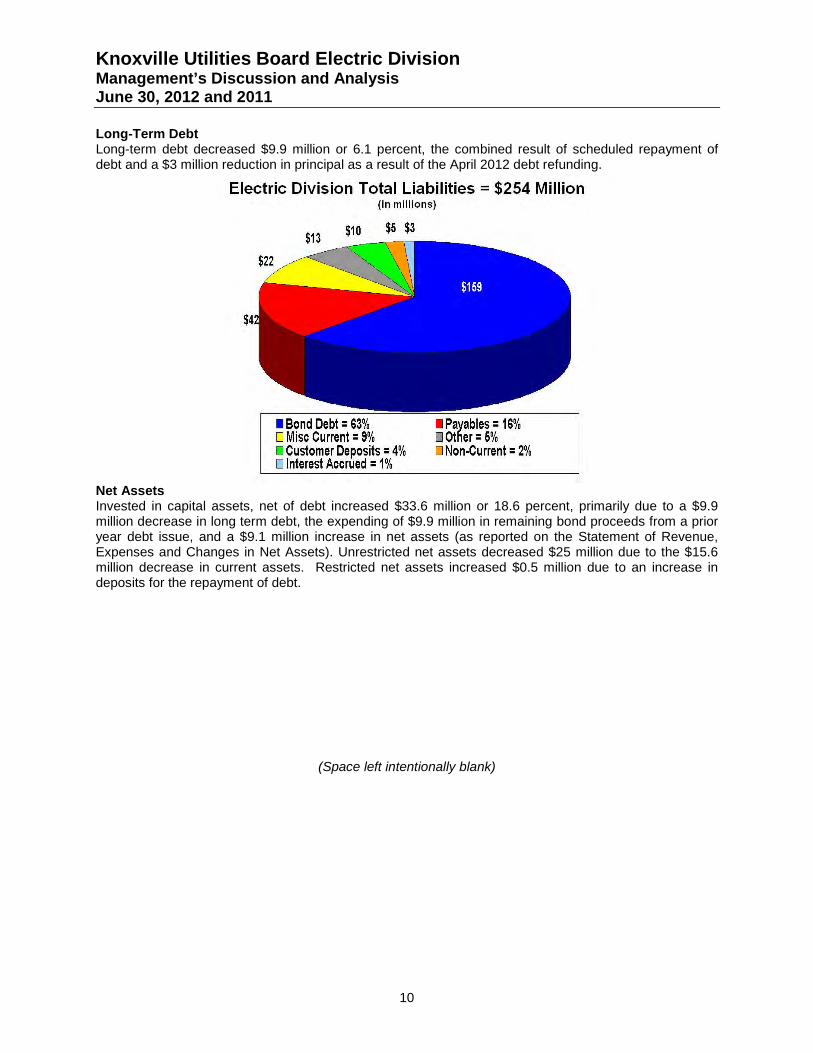
Knoxville Utilities Board Electric Division Management’s Discussion and Analysis June 30, 2012 and 2011
10
Long-Term Debt Long-term debt decreased $9.9 million or 6.1 percent, the combined result of scheduled repayment of debt and a $3 million reduction in principal as a result of the April 2012 debt refunding.
Net Assets Invested in capital assets, net of debt increased $33.6 million or 18.6 percent, primarily due to a $9.9 million decrease in long term debt, the expending of $9.9 million in remaining bond proceeds from a prior year debt issue, and a $9.1 million increase in net assets (as reported on the Statement of Revenue, Expenses and Changes in Net Assets). Unrestricted net assets decreased $25 million due to the $15.6 million decrease in current assets. Restricted net assets increased $0.5 million due to an increase in deposits for the repayment of debt.
(Space left intentionally blank)
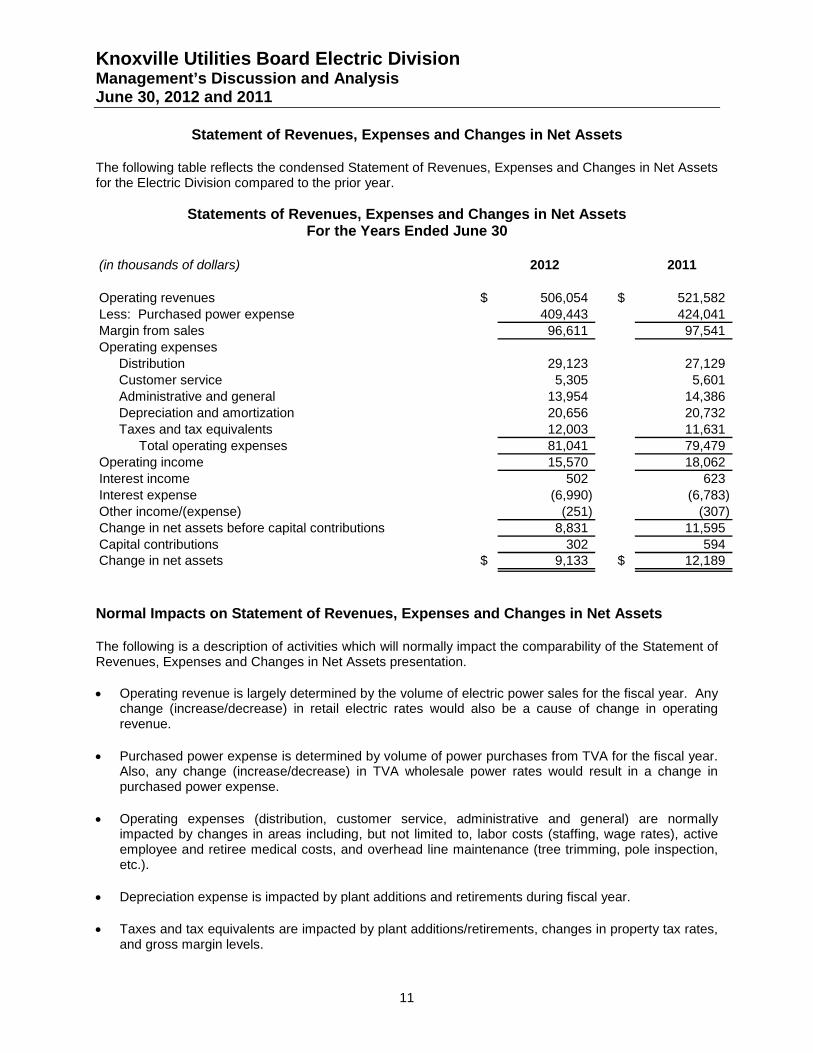
Knoxville Utilities Board Electric Division Management’s Discussion and Analysis June 30, 2012 and 2011
11
Statement of Revenues, Expenses and Changes in Net Assets The following table reflects the condensed Statement of Revenues, Expenses and Changes in Net Assets for the Electric Division compared to the prior year.
Statements of Revenues, Expenses and Changes in Net Assets For the Years Ended June 30
(in thousands of dollars) 2012 2011
Operating revenues $ 506,054 $ 521,582 Less: Purchased power expense 409,443 424,041 Margin from sales 96,611 97,541 Operating expenses
Distribution 29,123 27,129 Customer service 5,305 5,601 Administrative and general 13,954 14,386 Depreciation and amortization 20,656 20,732 Taxes and tax equivalents 12,003 11,631
Total operating expenses 81,041 79,479 Operating income 15,570 18,062 Interest income 502 623 Interest expense (6,990) (6,783) Other income/(expense) (251) (307) Change in net assets before capital contributions 8,831 11,595 Capital contributions 302 594 Change in net assets $ 9,133 $ 12,189
Normal Impacts on Statement of Revenues, Expenses and Changes in Net Assets The following is a description of activities which will normally impact the comparability of the Statement of Revenues, Expenses and Changes in Net Assets presentation. • Operating revenue is largely determined by the volume of electric power sales for the fiscal year. Any
change (increase/decrease) in retail electric rates would also be a cause of change in operating revenue.
• Purchased power expense is determined by volume of power purchases from TVA for the fiscal year. Also, any change (increase/decrease) in TVA wholesale power rates would result in a change in purchased power expense.
• Operating expenses (distribution, customer service, administrative and general) are normally impacted by changes in areas including, but not limited to, labor costs (staffing, wage rates), active employee and retiree medical costs, and overhead line maintenance (tree trimming, pole inspection, etc.).
• Depreciation expense is impacted by plant additions and retirements during fiscal year.
• Taxes and tax equivalents are impacted by plant additions/retirements, changes in property tax rates, and gross margin levels.
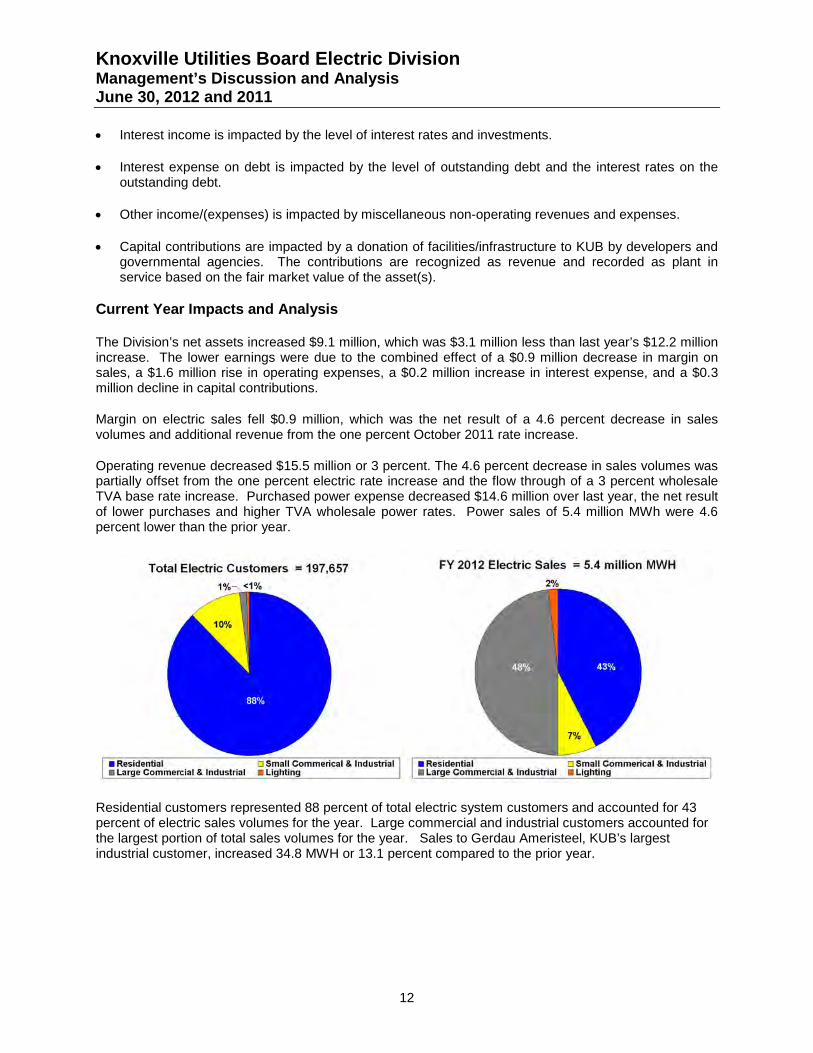
Knoxville Utilities Board Electric Division Management’s Discussion and Analysis June 30, 2012 and 2011
12
• Interest income is impacted by the level of interest rates and investments.
• Interest expense on debt is impacted by the level of outstanding debt and the interest rates on the outstanding debt.
• Other income/(expenses) is impacted by miscellaneous non-operating revenues and expenses.
• Capital contributions are impacted by a donation of facilities/infrastructure to KUB by developers and governmental agencies. The contributions are recognized as revenue and recorded as plant in service based on the fair market value of the asset(s).
Current Year Impacts and Analysis The Division’s net assets increased $9.1 million, which was $3.1 million less than last year’s $12.2 million increase. The lower earnings were due to the combined effect of a $0.9 million decrease in margin on sales, a $1.6 million rise in operating expenses, a $0.2 million increase in interest expense, and a $0.3 million decline in capital contributions.
Margin on electric sales fell $0.9 million, which was the net result of a 4.6 percent decrease in sales volumes and additional revenue from the one percent October 2011 rate increase.
Operating revenue decreased $15.5 million or 3 percent. The 4.6 percent decrease in sales volumes was partially offset from the one percent electric rate increase and the flow through of a 3 percent wholesale TVA base rate increase. Purchased power expense decreased $14.6 million over last year, the net result of lower purchases and higher TVA wholesale power rates. Power sales of 5.4 million MWh were 4.6 percent lower than the prior year.
Residential customers represented 88 percent of total electric system customers and accounted for 43 percent of electric sales volumes for the year. Large commercial and industrial customers accounted for the largest portion of total sales volumes for the year. Sales to Gerdau Ameristeel, KUB’s largest industrial customer, increased 34.8 MWH or 13.1 percent compared to the prior year.
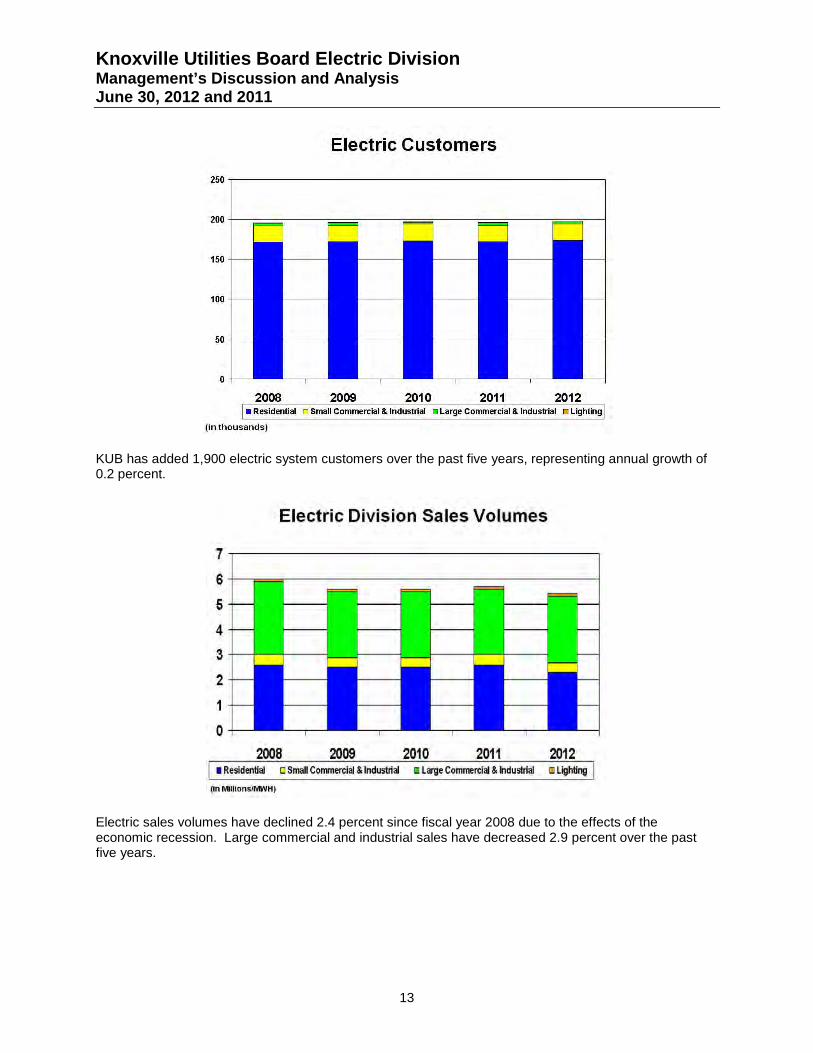
Knoxville Utilities Board Electric Division Management’s Discussion and Analysis June 30, 2012 and 2011
13
KUB has added 1,900 electric system customers over the past five years, representing annual growth of 0.2 percent.
Electric sales volumes have declined 2.4 percent since fiscal year 2008 due to the effects of the economic recession. Large commercial and industrial sales have decreased 2.9 percent over the past five years.
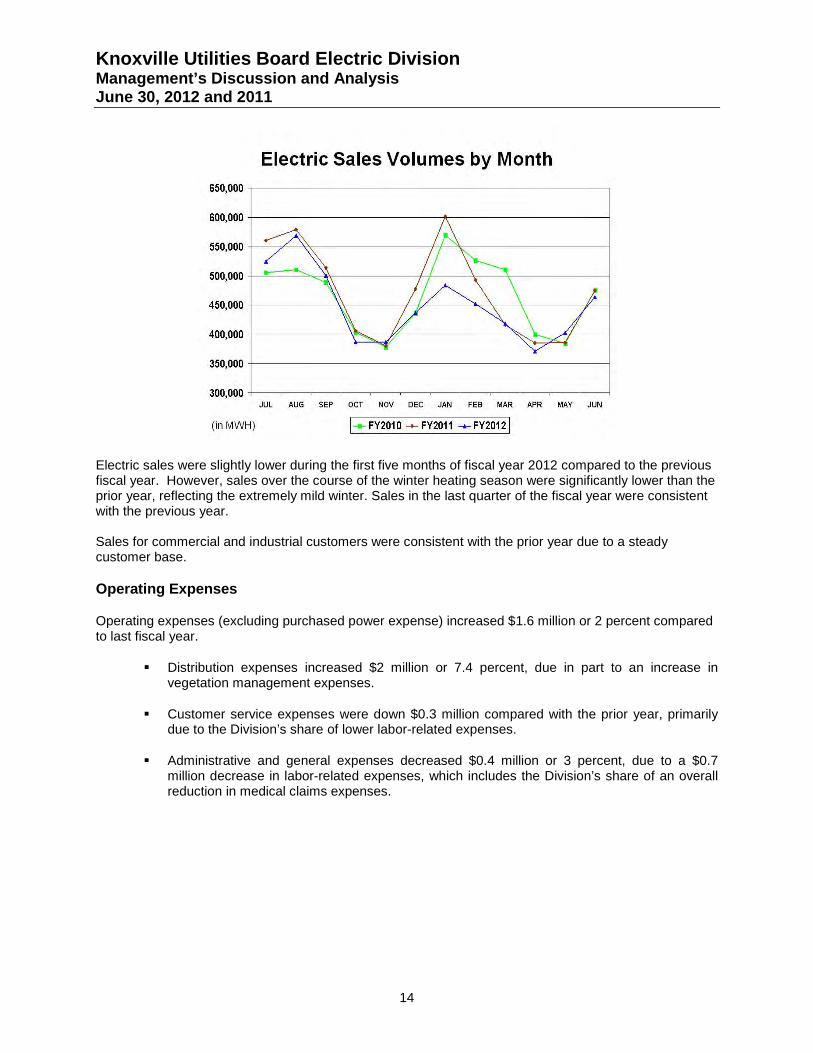
Knoxville Utilities Board Electric Division Management’s Discussion and Analysis June 30, 2012 and 2011
14
Electric sales were slightly lower during the first five months of fiscal year 2012 compared to the previous fiscal year. However, sales over the course of the winter heating season were significantly lower than the prior year, reflecting the extremely mild winter. Sales in the last quarter of the fiscal year were consistent with the previous year. Sales for commercial and industrial customers were consistent with the prior year due to a steady customer base.
Operating Expenses
Operating expenses (excluding purchased power expense) increased $1.6 million or 2 percent compared to last fiscal year.
Distribution expenses increased $2 million or 7.4 percent, due in part to an increase in vegetation management expenses.
Customer service expenses were down $0.3 million compared with the prior year, primarily due to the Division’s share of lower labor-related expenses.
Administrative and general expenses decreased $0.4 million or 3 percent, due to a $0.7 million decrease in labor-related expenses, which includes the Division’s share of an overall reduction in medical claims expenses.
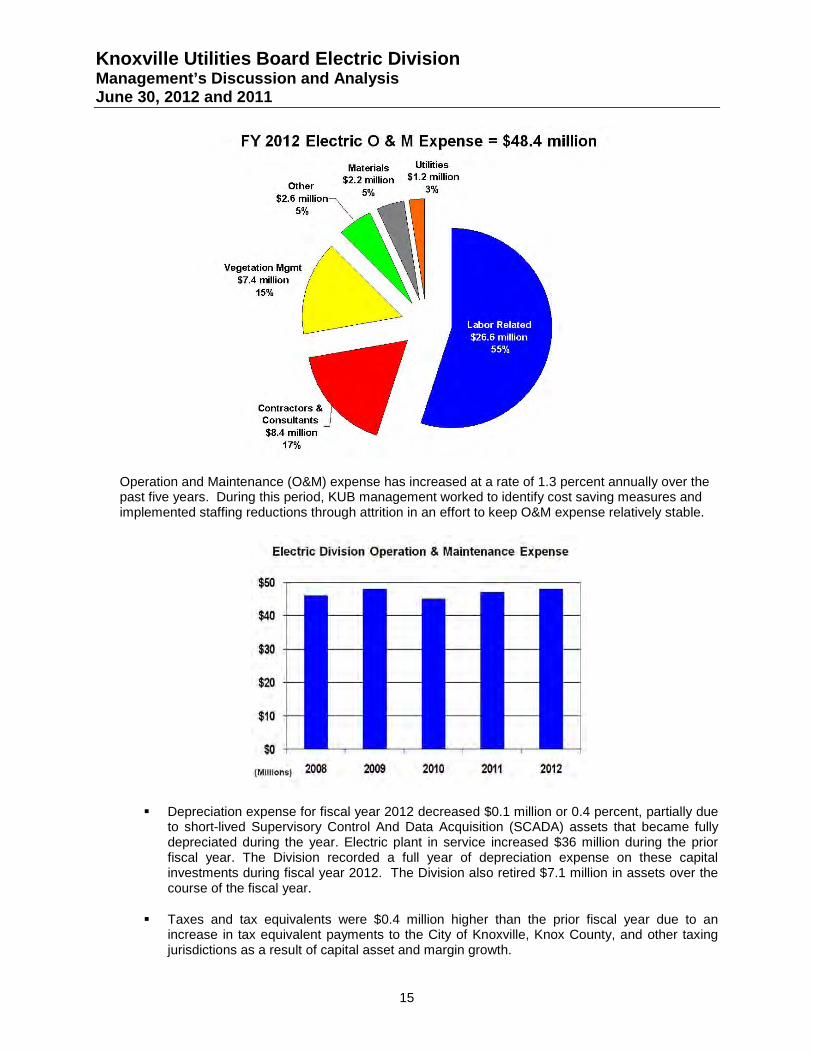
Knoxville Utilities Board Electric Division Management’s Discussion and Analysis June 30, 2012 and 2011
15
Operation and Maintenance (O&M) expense has increased at a rate of 1.3 percent annually over the past five years. During this period, KUB management worked to identify cost saving measures and implemented staffing reductions through attrition in an effort to keep O&M expense relatively stable.
Depreciation expense for fiscal year 2012 decreased $0.1 million or 0.4 percent, partially due to short-lived Supervisory Control And Data Acquisition (SCADA) assets that became fully depreciated during the year. Electric plant in service increased $36 million during the prior fiscal year. The Division recorded a full year of depreciation expense on these capital investments during fiscal year 2012. The Division also retired $7.1 million in assets over the course of the fiscal year.
Taxes and tax equivalents were $0.4 million higher than the prior fiscal year due to an increase in tax equivalent payments to the City of Knoxville, Knox County, and other taxing jurisdictions as a result of capital asset and margin growth.
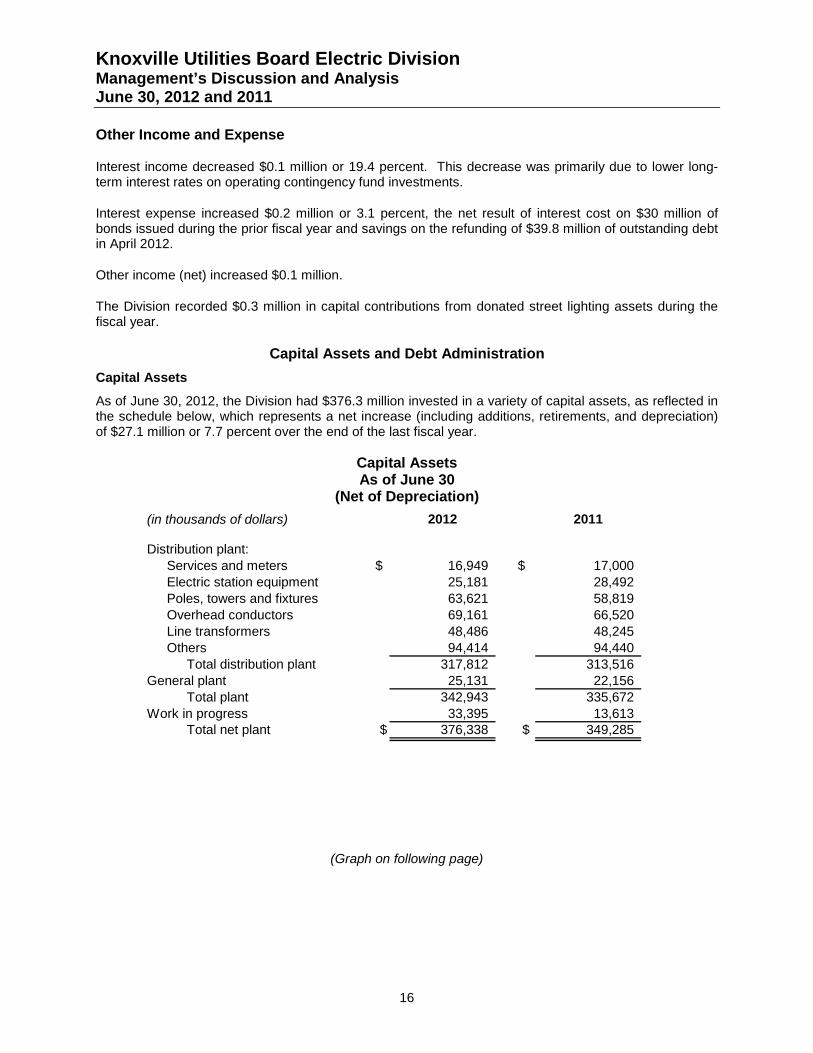
Knoxville Utilities Board Electric Division Management’s Discussion and Analysis June 30, 2012 and 2011
16
Other Income and Expense
Interest income decreased $0.1 million or 19.4 percent. This decrease was primarily due to lower long-term interest rates on operating contingency fund investments.
Interest expense increased $0.2 million or 3.1 percent, the net result of interest cost on $30 million of bonds issued during the prior fiscal year and savings on the refunding of $39.8 million of outstanding debt in April 2012.
Other income (net) increased $0.1 million.
The Division recorded $0.3 million in capital contributions from donated street lighting assets during the fiscal year.
Capital Assets and Debt Administration Capital Assets
As of June 30, 2012, the Division had $376.3 million invested in a variety of capital assets, as reflected in the schedule below, which represents a net increase (including additions, retirements, and depreciation) of $27.1 million or 7.7 percent over the end of the last fiscal year.
Capital Assets As of June 30
(Net of Depreciation)
(in thousands of dollars) 2012 2011
Distribution plant:Services and meters $ 16,949 $ 17,000 Electric station equipment 25,181 28,492 Poles, towers and fixtures 63,621 58,819 Overhead conductors 69,161 66,520 Line transformers 48,486 48,245 Others 94,414 94,440
Total distribution plant 317,812 313,516 General plant 25,131 22,156
Total plant 342,943 335,672 Work in progress 33,395 13,613
Total net plant $ 376,338 $ 349,285
(Graph on following page)
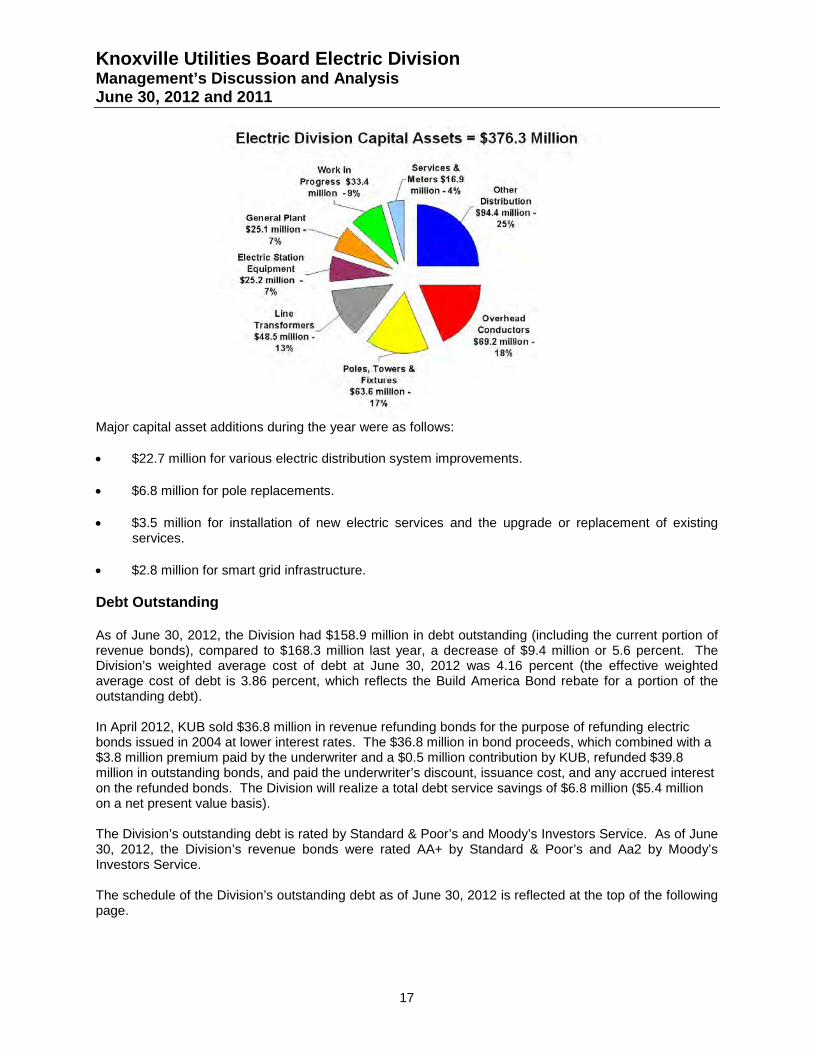
Knoxville Utilities Board Electric Division Management’s Discussion and Analysis June 30, 2012 and 2011
17
Major capital asset additions during the year were as follows: • $22.7 million for various electric distribution system improvements.
• $6.8 million for pole replacements.
• $3.5 million for installation of new electric services and the upgrade or replacement of existing services.
• $2.8 million for smart grid infrastructure.
Debt Outstanding As of June 30, 2012, the Division had $158.9 million in debt outstanding (including the current portion of revenue bonds), compared to $168.3 million last year, a decrease of $9.4 million or 5.6 percent. The Division’s weighted average cost of debt at June 30, 2012 was 4.16 percent (the effective weighted average cost of debt is 3.86 percent, which reflects the Build America Bond rebate for a portion of the outstanding debt). In April 2012, KUB sold $36.8 million in revenue refunding bonds for the purpose of refunding electric bonds issued in 2004 at lower interest rates. The $36.8 million in bond proceeds, which combined with a $3.8 million premium paid by the underwriter and a $0.5 million contribution by KUB, refunded $39.8 million in outstanding bonds, and paid the underwriter’s discount, issuance cost, and any accrued interest on the refunded bonds. The Division will realize a total debt service savings of $6.8 million ($5.4 million on a net present value basis). The Division’s outstanding debt is rated by Standard & Poor’s and Moody’s Investors Service. As of June 30, 2012, the Division’s revenue bonds were rated AA+ by Standard & Poor’s and Aa2 by Moody’s Investors Service. The schedule of the Division’s outstanding debt as of June 30, 2012 is reflected at the top of the following page.
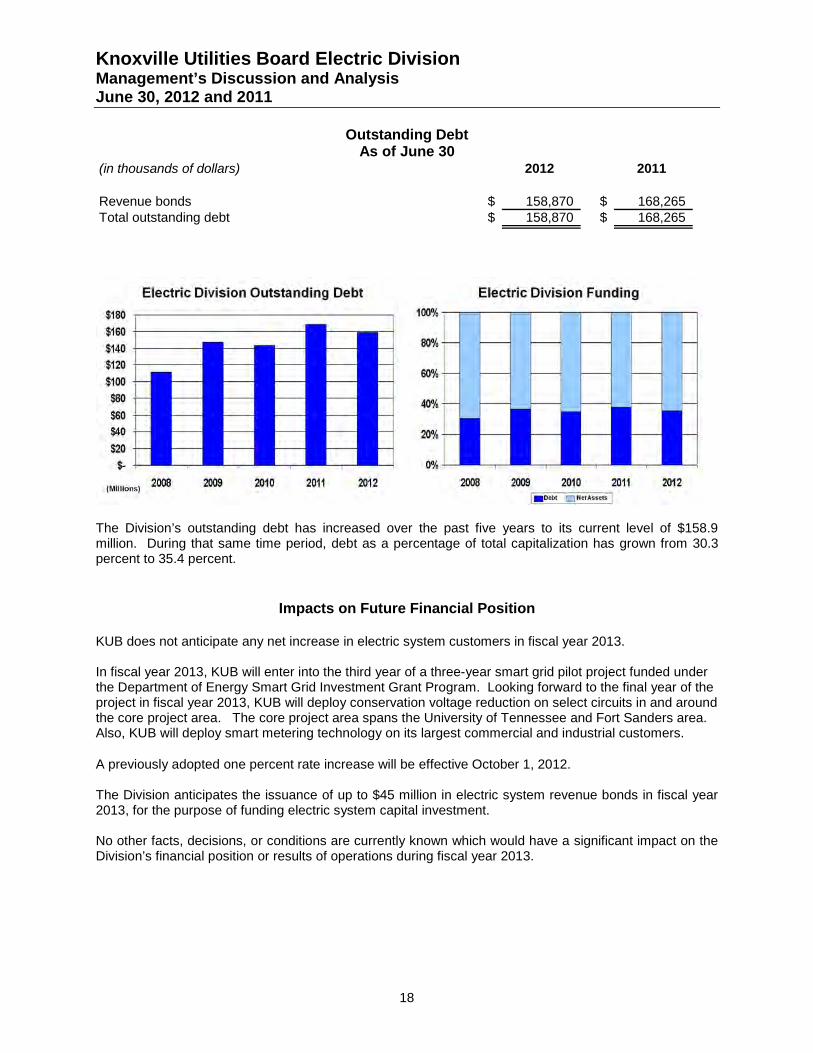
Knoxville Utilities Board Electric Division Management’s Discussion and Analysis June 30, 2012 and 2011
18
Outstanding Debt As of June 30
(in thousands of dollars) 2012 2011
Revenue bonds $ 158,870 $ 168,265 Total outstanding debt $ 158,870 $ 168,265
The Division’s outstanding debt has increased over the past five years to its current level of $158.9 million. During that same time period, debt as a percentage of total capitalization has grown from 30.3 percent to 35.4 percent.
Impacts on Future Financial Position KUB does not anticipate any net increase in electric system customers in fiscal year 2013. In fiscal year 2013, KUB will enter into the third year of a three-year smart grid pilot project funded under the Department of Energy Smart Grid Investment Grant Program. Looking forward to the final year of the project in fiscal year 2013, KUB will deploy conservation voltage reduction on select circuits in and around the core project area. The core project area spans the University of Tennessee and Fort Sanders area. Also, KUB will deploy smart metering technology on its largest commercial and industrial customers.
A previously adopted one percent rate increase will be effective October 1, 2012. The Division anticipates the issuance of up to $45 million in electric system revenue bonds in fiscal year 2013, for the purpose of funding electric system capital investment. No other facts, decisions, or conditions are currently known which would have a significant impact on the Division’s financial position or results of operations during fiscal year 2013.
Knoxville Utilities Board Electric Division Management’s Discussion and Analysis June 30, 2012 and 2011
19
Financial Contact The Division’s financial statements are designed to present users (citizens, customers, investors, and creditors) with a general overview of the Division’s financial position and results of operations for the fiscal years ending June 30, 2012 and 2011. If you have questions about the statements or need additional financial information, contact KUB’s Chief Financial Officer at 445 South Gay Street, Knoxville, Tennessee 37902.
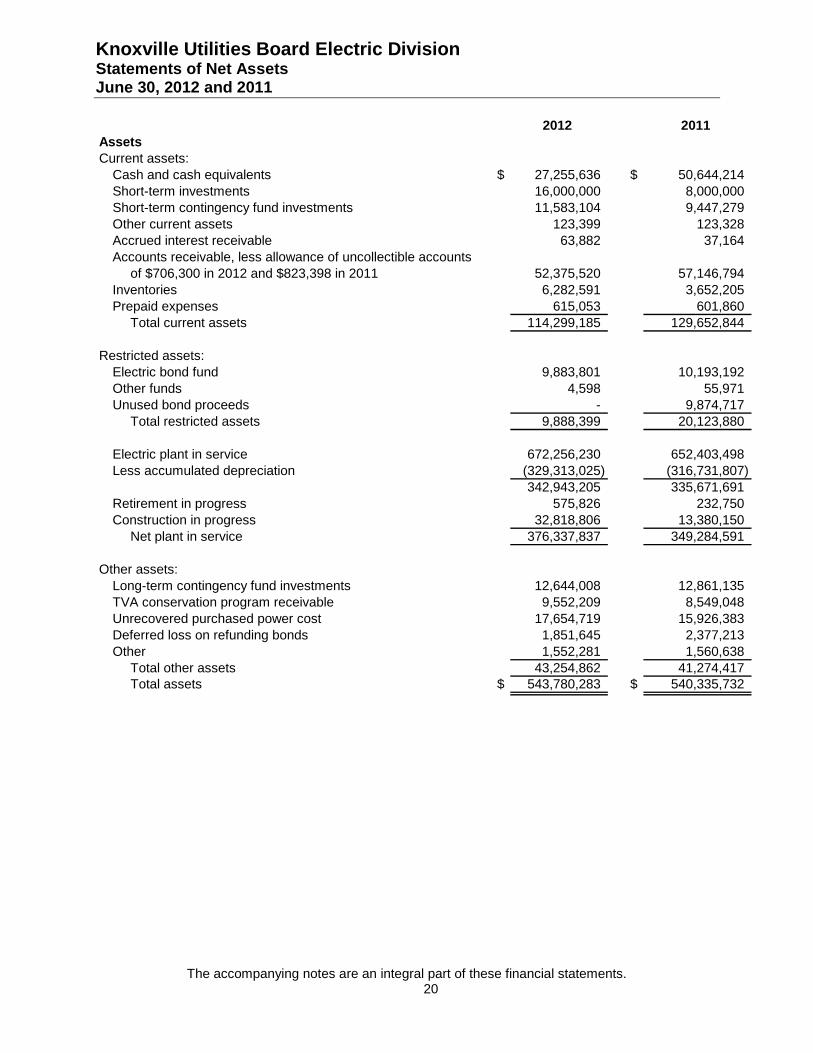
Knoxville Utilities Board Electric Division Statements of Net Assets June 30, 2012 and 2011
The accompanying notes are an integral part of these financial statements. 20
2012 2011AssetsCurrent assets:
Cash and cash equivalents $ 27,255,636 $ 50,644,214 Short-term investments 16,000,000 8,000,000 Short-term contingency fund investments 11,583,104 9,447,279 Other current assets 123,399 123,328 Accrued interest receivable 63,882 37,164 Accounts receivable, less allowance of uncollectible accounts
of $706,300 in 2012 and $823,398 in 2011 52,375,520 57,146,794 Inventories 6,282,591 3,652,205 Prepaid expenses 615,053 601,860
Total current assets 114,299,185 129,652,844
Restricted assets:Electric bond fund 9,883,801 10,193,192 Other funds 4,598 55,971 Unused bond proceeds - 9,874,717
Total restricted assets 9,888,399 20,123,880
Electric plant in service 672,256,230 652,403,498 Less accumulated depreciation (329,313,025) (316,731,807)
342,943,205 335,671,691 Retirement in progress 575,826 232,750 Construction in progress 32,818,806 13,380,150
Net plant in service 376,337,837 349,284,591
Other assets:Long-term contingency fund investments 12,644,008 12,861,135 TVA conservation program receivable 9,552,209 8,549,048 Unrecovered purchased power cost 17,654,719 15,926,383 Deferred loss on refunding bonds 1,851,645 2,377,213 Other 1,552,281 1,560,638
Total other assets 43,254,862 41,274,417 Total assets $ 543,780,283 $ 540,335,732
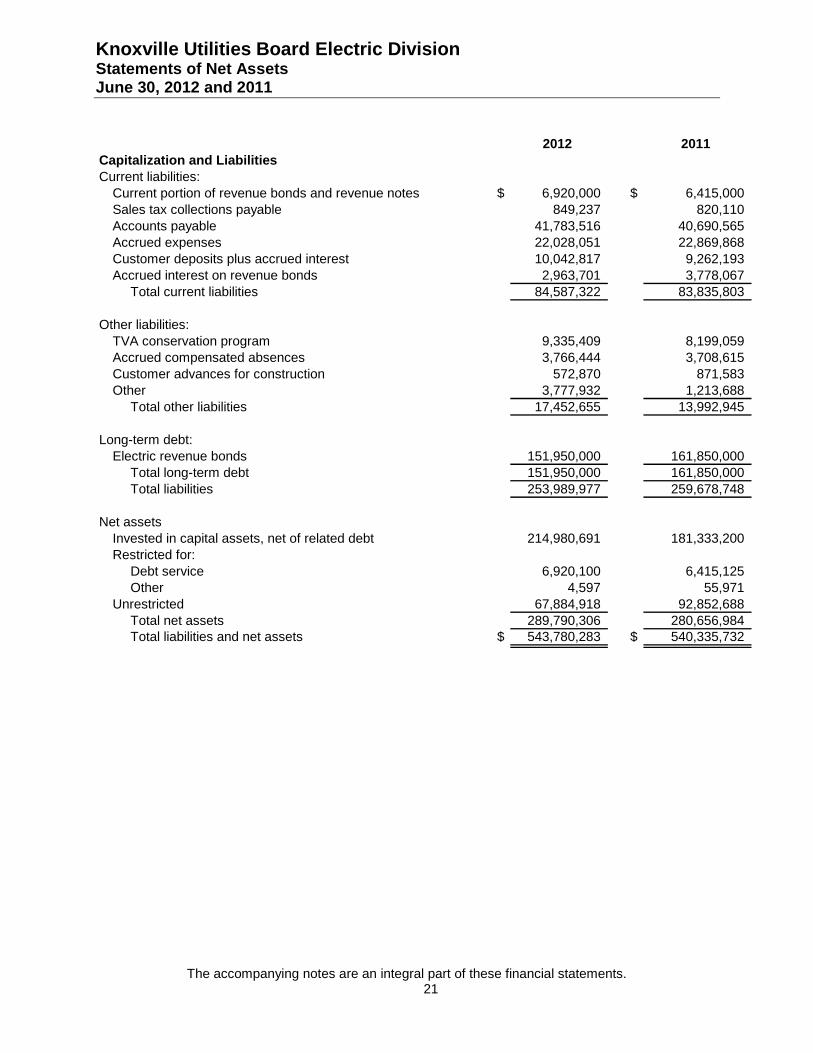
Knoxville Utilities Board Electric Division Statements of Net Assets June 30, 2012 and 2011
The accompanying notes are an integral part of these financial statements. 21
2012 2011
Capitalization and LiabilitiesCurrent liabilities:
Current portion of revenue bonds and revenue notes $ 6,920,000 $ 6,415,000 Sales tax collections payable 849,237 820,110 Accounts payable 41,783,516 40,690,565 Accrued expenses 22,028,051 22,869,868 Customer deposits plus accrued interest 10,042,817 9,262,193 Accrued interest on revenue bonds 2,963,701 3,778,067
Total current liabilities 84,587,322 83,835,803
Other liabilities:TVA conservation program 9,335,409 8,199,059 Accrued compensated absences 3,766,444 3,708,615 Customer advances for construction 572,870 871,583 Other 3,777,932 1,213,688
Total other liabilities 17,452,655 13,992,945
Long-term debt:Electric revenue bonds 151,950,000 161,850,000
Total long-term debt 151,950,000 161,850,000 Total liabilities 253,989,977 259,678,748
Net assetsInvested in capital assets, net of related debt 214,980,691 181,333,200 Restricted for:
Debt service 6,920,100 6,415,125 Other 4,597 55,971
Unrestricted 67,884,918 92,852,688 Total net assets 289,790,306 280,656,984 Total liabilities and net assets $ 543,780,283 $ 540,335,732
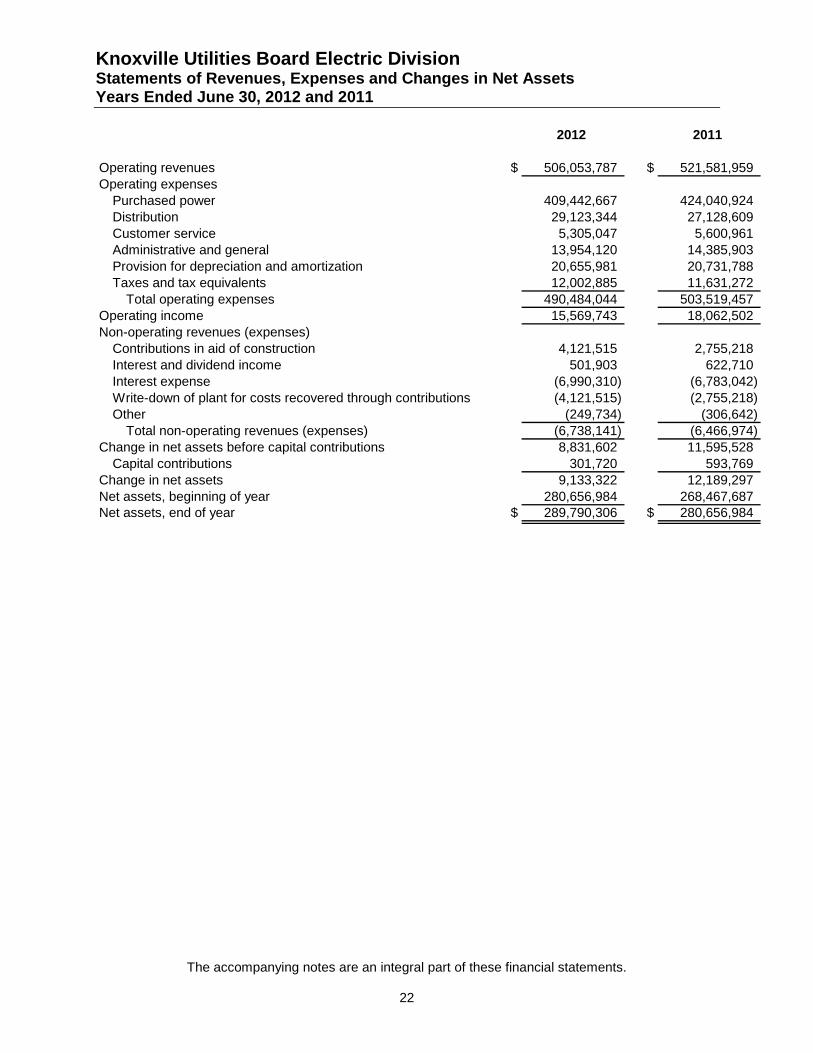
Knoxville Utilities Board Electric Division Statements of Revenues, Expenses and Changes in Net Assets Years Ended June 30, 2012 and 2011
The accompanying notes are an integral part of these financial statements.
22
2012 2011
Operating revenues $ 506,053,787 $ 521,581,959 Operating expenses
Purchased power 409,442,667 424,040,924 Distribution 29,123,344 27,128,609 Customer service 5,305,047 5,600,961 Administrative and general 13,954,120 14,385,903 Provision for depreciation and amortization 20,655,981 20,731,788 Taxes and tax equivalents 12,002,885 11,631,272
Total operating expenses 490,484,044 503,519,457 Operating income 15,569,743 18,062,502 Non-operating revenues (expenses)
Contributions in aid of construction 4,121,515 2,755,218 Interest and dividend income 501,903 622,710 Interest expense (6,990,310) (6,783,042) Write-down of plant for costs recovered through contributions (4,121,515) (2,755,218) Other (249,734) (306,642)
Total non-operating revenues (expenses) (6,738,141) (6,466,974) Change in net assets before capital contributions 8,831,602 11,595,528
Capital contributions 301,720 593,769 Change in net assets 9,133,322 12,189,297 Net assets, beginning of year 280,656,984 268,467,687 Net assets, end of year $ 289,790,306 $ 280,656,984
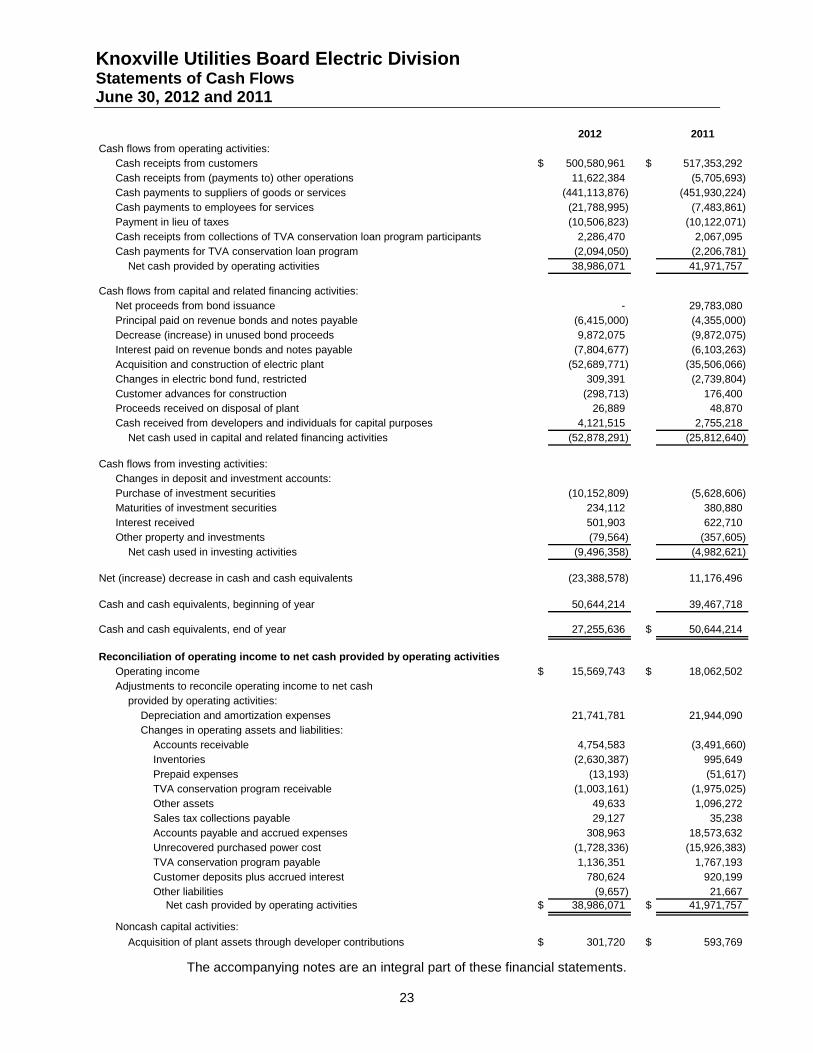
Knoxville Utilities Board Electric Division Statements of Cash Flows June 30, 2012 and 2011
The accompanying notes are an integral part of these financial statements.
23
2012 2011Cash flows from operating activities:
Cash receipts from customers $ 500,580,961 $ 517,353,292Cash receipts from (payments to) other operations 11,622,384 (5,705,693)Cash payments to suppliers of goods or services (441,113,876) (451,930,224)Cash payments to employees for services (21,788,995) (7,483,861)Payment in lieu of taxes (10,506,823) (10,122,071)Cash receipts from collections of TVA conservation loan program participants 2,286,470 2,067,095Cash payments for TVA conservation loan program (2,094,050) (2,206,781)
Net cash provided by operating activities 38,986,071 41,971,757
Cash flows from capital and related financing activities:Net proceeds from bond issuance - 29,783,080 Principal paid on revenue bonds and notes payable (6,415,000) (4,355,000)Decrease (increase) in unused bond proceeds 9,872,075 (9,872,075)Interest paid on revenue bonds and notes payable (7,804,677) (6,103,263)Acquisition and construction of electric plant (52,689,771) (35,506,066)Changes in electric bond fund, restricted 309,391 (2,739,804)Customer advances for construction (298,713) 176,400Proceeds received on disposal of plant 26,889 48,870Cash received from developers and individuals for capital purposes 4,121,515 2,755,218
Net cash used in capital and related financing activities (52,878,291) (25,812,640)
Cash flows from investing activities:Changes in deposit and investment accounts:Purchase of investment securities (10,152,809) (5,628,606)Maturities of investment securities 234,112 380,880Interest received 501,903 622,710Other property and investments (79,564) (357,605)
Net cash used in investing activities (9,496,358) (4,982,621)
Net (increase) decrease in cash and cash equivalents (23,388,578) 11,176,496
Cash and cash equivalents, beginning of year 50,644,214 39,467,718
Cash and cash equivalents, end of year 27,255,636 $ 50,644,214
Reconciliation of operating income to net cash provided by operating activitiesOperating income $ 15,569,743 $ 18,062,502Adjustments to reconcile operating income to net cash
provided by operating activities:Depreciation and amortization expenses 21,741,781 21,944,090Changes in operating assets and liabilities:
Accounts receivable 4,754,583 (3,491,660)Inventories (2,630,387) 995,649Prepaid expenses (13,193) (51,617)TVA conservation program receivable (1,003,161) (1,975,025)Other assets 49,633 1,096,272Sales tax collections payable 29,127 35,238Accounts payable and accrued expenses 308,963 18,573,632Unrecovered purchased power cost (1,728,336) (15,926,383) TVA conservation program payable 1,136,351 1,767,193Customer deposits plus accrued interest 780,624 920,199Other liabilities (9,657) 21,667
Net cash provided by operating activities $ 38,986,071 $ 41,971,757
Noncash capital activities:Acquisition of plant assets through developer contributions $ 301,720 $ 593,769
Knoxville Utilities Board Electric Division Notes to Financial Statements June 30, 2012 and 2011
24
1. Description of Business
Knoxville Utilities Board (KUB), comprised of the Electric Division, Water Division, Gas Division, and Wastewater Division (Divisions), is reported as a component unit enterprise fund in the financial statements of the City of Knoxville. KUB's responsibility is to oversee the purchase, production, distribution, and processing of electricity, water, gas, and wastewater services. A seven-member Board of Commissioners governs KUB. The Board has all powers to construct, acquire, expand, or operate the Divisions. It has full control and complete jurisdiction over the management and operation of the Divisions. The Electric Division (Division) provides services to certain customers in Knox County and in seven surrounding counties in East Tennessee. The Division's accounts are maintained in conformity with the Uniform System of Accounts of the Federal Energy Regulatory Commission (FERC) and the Governmental Accounting Standards Board (GASB), as applicable. The financial statements present only the Electric Division and do not purport to, and do not, present fairly the consolidated financial position of Knoxville Utilities Board at June 30, 2012 and 2011, and the changes in its financial position for the years then ended in conformity with accounting principles generally accepted in the United States of America.
2. Summary of Significant Accounting Policies
Basis of Accounting KUB follows the provisions of Statement No. 34 (Statement 34) of the Governmental Accounting Standards Board Basic Financial Statements − and Management’s Discussion and Analysis − for State and Local Governments. Statement 34 established standards for external financial reporting for all state and local governmental entities, which includes a statement of net assets; a statement of revenues, expenses and changes in net assets; and a statement of cash flows. It requires the classification of net assets into three components − invested in capital assets, net of related debt; restricted; and unrestricted. These classifications are defined as follows:
• Invested in capital assets, net of related debt − This component of net assets consists of capital assets, including restricted capital assets, net of accumulated depreciation and reduced by the outstanding balances of any bonds, mortgages, notes, or other borrowings that are attributable to the acquisition, construction, or improvement of those assets. If there are significant unspent related debt proceeds at year end, the portion of the debt attributable to the unspent proceeds is not included in the calculation of invested in capital assets, net of related debt. Rather, that portion of the debt is included in the same net assets component as the unspent proceeds.
• Restricted − This component of net assets consists of restrictions placed on net asset use through external constraints imposed by creditors (such as through debt covenants), grantors, contributors, or laws or regulations of other governments or restrictions imposed by law through constitutional provisions or enabling legislation.
• Unrestricted net assets − This component of net assets consist of net assets that do not meet the definition of “restricted” or “invested in capital assets, net of related debt.”
Knoxville Utilities Board Electric Division Notes to Financial Statements June 30, 2012 and 2011
25
The financial statements are prepared on the accrual basis of accounting, whereby revenues are recognized when earned and expenses are recognized when incurred. The accounting and financial reporting treatment applied to the Division is determined by measurement focus. The transactions of the Division are accounted for on a flow of economic resources measurement focus. With this measurement focus, all assets and all liabilities associated with the operations are included on the statement of net assets. Net assets (i.e., total assets net of total liabilities) are segregated into invested in capital assets, net of related debt; restricted for capital activity and debt service; and unrestricted components.
As allowed by the Governmental Accounting Standards Board (GASB) Statement No. 20, Accounting and Financial Reporting for Proprietary Funds and Other Governmental Entities That Use Proprietary Fund Accounting, KUB’s policy is to apply only those Financial Accounting Standards Board statements, related interpretations, Accounting Principles Board opinions and accounting research bulletins issued on or prior to November 30, 1989 that do not conflict with Governmental Accounting Standards.
Electric Plant Electric plant and other property are stated on the basis of original cost. The cost of current repairs and minor replacements is charged to operating expense. The cost of renewals and improvements is capitalized. The original cost of utility plant assets retired or otherwise disposed of and the cost of removal less salvage value is charged to accumulated depreciation. When other property is retired, the related asset and accumulated depreciation are removed from the accounts, and the gain or loss is included in the results of operations.
The provision for depreciation of electric plant in service is based on the estimated useful lives of the assets, which range from three to forty years, and is computed using the straight-line method. Pursuant to FERC, the caption "Provision for depreciation" in the statements of revenues, expenses and changes in net assets does not include depreciation for transportation equipment of $1,085,800 in 2012 and $1,212,302 in 2011. Interest costs are expensed as incurred.
Operating Revenue Operating revenue consists primarily of charges for services provided by the principal operations of the KUB Electric Division. Operating revenue is recorded when the service is rendered, on a cycle basis, and includes an estimate of unbilled revenue. Revenues are reported net of bad debt expense of $1,274,458 in 2012 and $2,365,451 in 2011.
Non-operating Revenue Non-operating revenue consists of revenues that are related to financing and investing types of activities and result from non-exchange transactions or ancillary activities.
Expense When an expense is incurred for purposes for which there are both restricted and unrestricted net assets available, it is KUB’s policy to apply those expenses to restricted net assets to the extent such are available and then to unrestricted net assets.
Knoxville Utilities Board Electric Division Notes to Financial Statements June 30, 2012 and 2011
26
Contributions in Aid of Construction and Capital Contributions Contributions in aid of construction are cash collections from customers or others for a particular purpose, generally the construction of new facilities to serve new customers in excess of the investment KUB is willing to make for a particular incremental revenue source. KUB reduces the plant account balances to which contributions relate by the actual amount of the contribution and recognizes the contributions as non operating revenue in accordance with FAS 71, “Accounting for the Effects of Certain Types of Regulation”.
Capital contributions represent contributions of utility plant infrastructure constructed by developers and others in industrial parks and other developments, and transferred to KUB upon completion of construction and the initiation of utility service. In accordance with GASB 33, “Accounting and Financial Reporting for Nonexchange Transactions”, such contributions are recognized as revenues and capital assets upon receipt.
Inventories Inventories, consisting of plant materials and operating supplies, are valued at the lower of average cost or replacement value. Pension Plan The Division’s employees are participants in the Knoxville Utilities Board Pension Plan as authorized by the Charter of the City of Knoxville §1107(J) (Note 10). The Division’s policy is to fund pension cost accrued. As required by GASB Statement No. 27, KUB measures and discloses the annual pension cost on the accrual basis of accounting. At the time the funding method is introduced, there is a liability, which represents the contributions that would have been accumulated if this method of funding had always been used. The excess, if any, of this liability over the actuarial value of the assets held in the fund is the unfunded actuarial accrued liability, which is typically funded over a chosen period in accordance with an amortization schedule.
Investments Investments are carried at fair value as determined by quoted market prices at the reporting date.
Self-Insurance KUB has established self-insurance programs covering portions of workers' compensation, employee health, environmental liability, general liability, property and casualty liability and automobile liability claims. A liability is accrued for claims as they are incurred. When applicable, claims in excess of the self-insured risk are covered by KUB's insurance carriers. Additionally, KUB provides certain lifetime health benefits to eligible retired employees under a self-insurance plan administered by a third party.
Estimates The preparation of financial statements in conformity with generally accepted accounting principles requires management to make estimates and assumptions that affect the reported amounts of assets and liabilities and disclosures of contingent assets and liabilities at the date of the financial statements and the reported amounts of revenues and expenses during the reporting period. These estimates are based on historical experience and various other assumptions that KUB believes are reasonable under the circumstances. However, future events are subject to change and the best estimates and judgments routinely require adjustment. Estimates are used for, but not limited to, inventory valuation, provision for doubtful accounts, depreciable lives of plant assets, unbilled revenue volumes, pension trust valuations, OPEB trust valuations, insurance liability reserves, and potential losses from contingencies and litigation. Actual results could differ from those estimates.
Knoxville Utilities Board Electric Division Notes to Financial Statements June 30, 2012 and 2011
27
Restricted and Designated Assets Certain assets are restricted by bond resolutions for the construction of utility plant and debt repayment. Certain additional assets are designated by management for contingency purposes and economic development.
Cash Equivalents For purposes of the statements of cash flows, KUB considers all unrestricted and undesignated highly liquid investments with an original maturity of three months or less when purchased to be cash equivalents.
Environmental Cleanup Matters KUB’s policy is to accrue environmental cleanup costs when those costs are believed to be probable and can be reasonably estimated. For certain matters, KUB expects to share costs with other parties. KUB does not include anticipated recoveries from insurance carriers in the estimated liability.
Compensated Absences KUB accrues a liability for earned but unpaid paid-time off (PTO) days.
Subsequent Events KUB has evaluated events and transactions through October 18, 2012, the date these financial statements were issued, for items that should potentially be recognized or disclosed.
Reclassifications Certain reclassifications have been made to the 2011 balances to conform to the 2012 presentation.
Purchased Power Adjustment In October 2002, the Board adopted a Purchased Power Adjustment (PPA) to address changes in wholesale power costs. The PPA was established in response to an amendment to KUB’s power supply contract under which, among other things, TVA relinquished its regulatory authority over KUB retail electric rates. The PPA allows KUB to promptly adjust retail electric rates in response to wholesale rate changes or adjustments, thus ensuring that KUB will recover the costs incurred for purchased power. These changes in electric costs are reflected as adjustments to the base electric rates established by KUB's Board of Commissioners. The rate-setting authority vested in the KUB Board by the City Charter meets the “self-regulated” provisions of SFAS No. 71, “Accounting for the Effects of Certain Types of Regulation,” and KUB meets the remaining criteria of SFAS No. 71.
TVA implemented a fuel cost adjustment in October 2006 applied on a quarterly basis to wholesale power rates. TVA’s quarterly fuel cost adjustment became a monthly fuel cost adjustment effective October 2009. KUB flows changes to wholesale power rates, from TVA’s fuel cost adjustment mechanism, directly through to its retail electric rates via the PPA. In April 2011, TVA modified its wholesale rate structure to demand & energy billing for its distributors. In response, KUB revised its PPA to include a deferred accounting component to ensure appropriate matching of revenue and expense and cost recovery. KUB will adjust its retail rates on an annual basis to flow any over or under recovery of wholesale power costs through to its customers via the PPA.
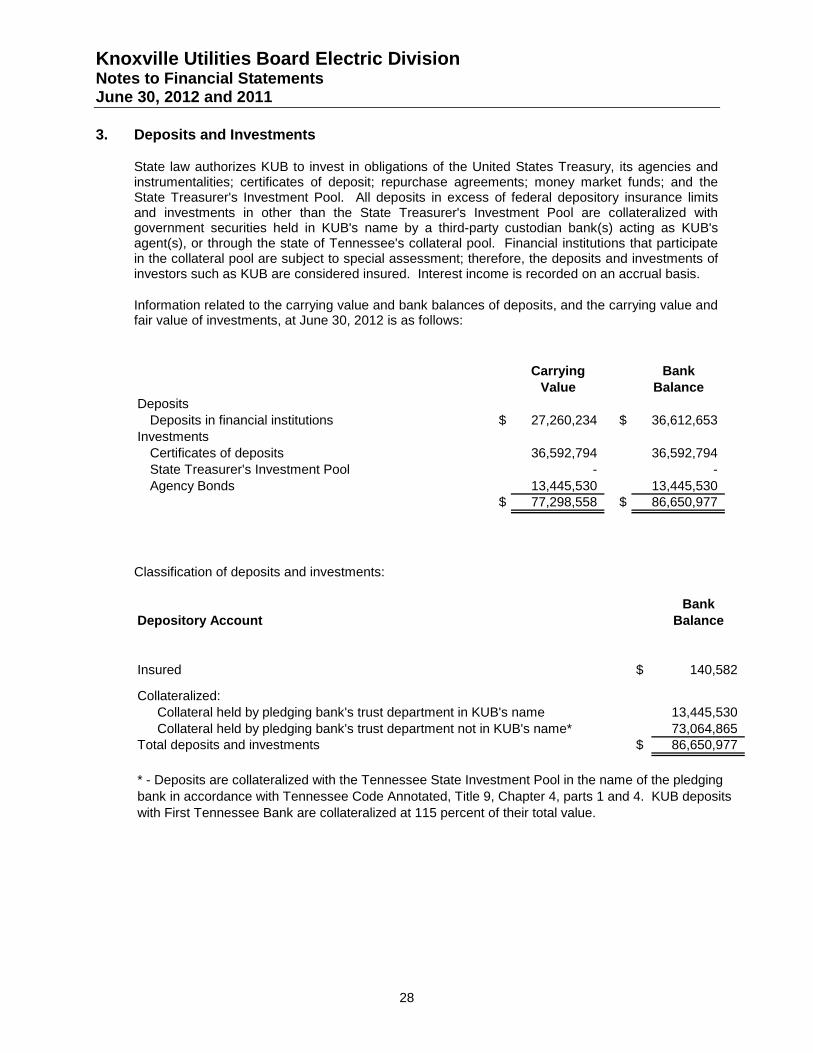
Knoxville Utilities Board Electric Division Notes to Financial Statements June 30, 2012 and 2011
28
3. Deposits and Investments
State law authorizes KUB to invest in obligations of the United States Treasury, its agencies and instrumentalities; certificates of deposit; repurchase agreements; money market funds; and the State Treasurer's Investment Pool. All deposits in excess of federal depository insurance limits and investments in other than the State Treasurer's Investment Pool are collateralized with government securities held in KUB's name by a third-party custodian bank(s) acting as KUB's agent(s), or through the state of Tennessee's collateral pool. Financial institutions that participate in the collateral pool are subject to special assessment; therefore, the deposits and investments of investors such as KUB are considered insured. Interest income is recorded on an accrual basis.
Information related to the carrying value and bank balances of deposits, and the carrying value and fair value of investments, at June 30, 2012 is as follows:
Carrying Bank
Value BalanceDeposits
Deposits in financial institutions $ 27,260,234 $ 36,612,653 Investments
Certificates of deposits 36,592,794 36,592,794 State Treasurer's Investment Pool - - Agency Bonds 13,445,530 13,445,530
$ 77,298,558 $ 86,650,977
Classification of deposits and investments:
BankDepository Account Balance
Insured $ 140,582
Collateralized:Collateral held by pledging bank's trust department in KUB's name 13,445,530 Collateral held by pledging bank's trust department not in KUB's name* 73,064,865
Total deposits and investments $ 86,650,977
* - Deposits are collateralized with the Tennessee State Investment Pool in the name of the pledging bank in accordance with Tennessee Code Annotated, Title 9, Chapter 4, parts 1 and 4. KUB deposits with First Tennessee Bank are collateralized at 115 percent of their total value.
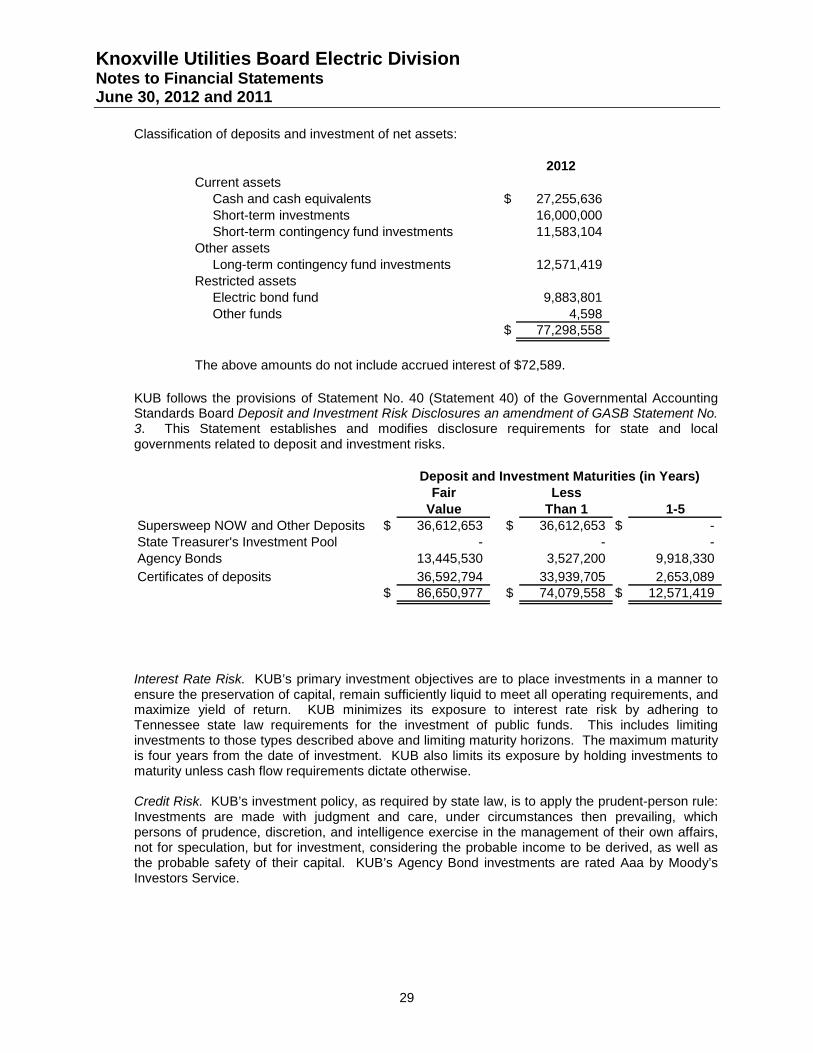
Knoxville Utilities Board Electric Division Notes to Financial Statements June 30, 2012 and 2011
29
Classification of deposits and investment of net assets:
2012Current assets
Cash and cash equivalents $ 27,255,636 Short-term investments 16,000,000 Short-term contingency fund investments 11,583,104
Other assetsLong-term contingency fund investments 12,571,419
Restricted assetsElectric bond fund 9,883,801 Other funds 4,598
$ 77,298,558
The above amounts do not include accrued interest of $72,589.
KUB follows the provisions of Statement No. 40 (Statement 40) of the Governmental Accounting Standards Board Deposit and Investment Risk Disclosures an amendment of GASB Statement No. 3. This Statement establishes and modifies disclosure requirements for state and local governments related to deposit and investment risks.
Fair LessValue Than 1 1-5
Supersweep NOW and Other Deposits $ 36,612,653 $ 36,612,653 $ -State Treasurer's Investment Pool - - -Agency Bonds 13,445,530 3,527,200 9,918,330Certificates of deposits 36,592,794 33,939,705 2,653,089
$ 86,650,977 $ 74,079,558 $ 12,571,419
Deposit and Investment Maturities (in Years)
Interest Rate Risk. KUB’s primary investment objectives are to place investments in a manner to ensure the preservation of capital, remain sufficiently liquid to meet all operating requirements, and maximize yield of return. KUB minimizes its exposure to interest rate risk by adhering to Tennessee state law requirements for the investment of public funds. This includes limiting investments to those types described above and limiting maturity horizons. The maximum maturity is four years from the date of investment. KUB also limits its exposure by holding investments to maturity unless cash flow requirements dictate otherwise.
Credit Risk. KUB’s investment policy, as required by state law, is to apply the prudent-person rule: Investments are made with judgment and care, under circumstances then prevailing, which persons of prudence, discretion, and intelligence exercise in the management of their own affairs, not for speculation, but for investment, considering the probable income to be derived, as well as the probable safety of their capital. KUB’s Agency Bond investments are rated Aaa by Moody’s Investors Service.
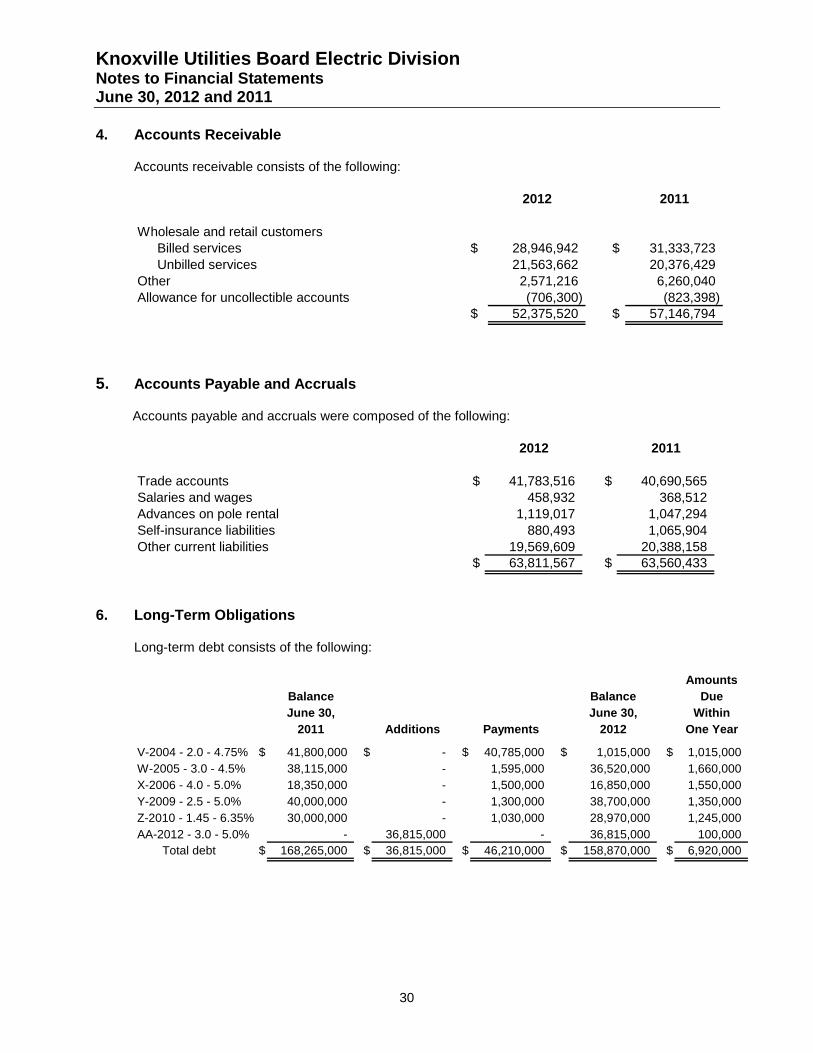
Knoxville Utilities Board Electric Division Notes to Financial Statements June 30, 2012 and 2011
30
4. Accounts Receivable
Accounts receivable consists of the following:
2012 2011
Wholesale and retail customers Billed services $ 28,946,942 $ 31,333,723 Unbilled services 21,563,662 20,376,429 Other 2,571,216 6,260,040 Allowance for uncollectible accounts (706,300) (823,398)
$ 52,375,520 $ 57,146,794
5. Accounts Payable and Accruals
Accounts payable and accruals were composed of the following:
2012 2011
Trade accounts $ 41,783,516 # $ 40,690,565 Salaries and wages 458,932 # 368,512 Advances on pole rental 1,119,017 # 1,047,294 Self-insurance liabilities 880,493 # 1,065,904 Other current liabilities 19,569,609 # 20,388,158
$ 63,811,567 $ 63,560,433
6. Long-Term Obligations
Long-term debt consists of the following:
AmountsBalance Balance DueJune 30, June 30, Within
2011 Additions Payments 2012 One Year
V-2004 - 2.0 - 4.75% $ 41,800,000 $ - $ 40,785,000 $ 1,015,000 $ 1,015,000 W-2005 - 3.0 - 4.5% 38,115,000 - 1,595,000 36,520,000 1,660,000 X-2006 - 4.0 - 5.0% 18,350,000 - 1,500,000 16,850,000 1,550,000 Y-2009 - 2.5 - 5.0% 40,000,000 - 1,300,000 38,700,000 1,350,000 Z-2010 - 1.45 - 6.35% 30,000,000 - 1,030,000 28,970,000 1,245,000 AA-2012 - 3.0 - 5.0% - 36,815,000 - 36,815,000 100,000
Total debt $ 168,265,000 $ 36,815,000 $ 46,210,000 $ 158,870,000 $ 6,920,000
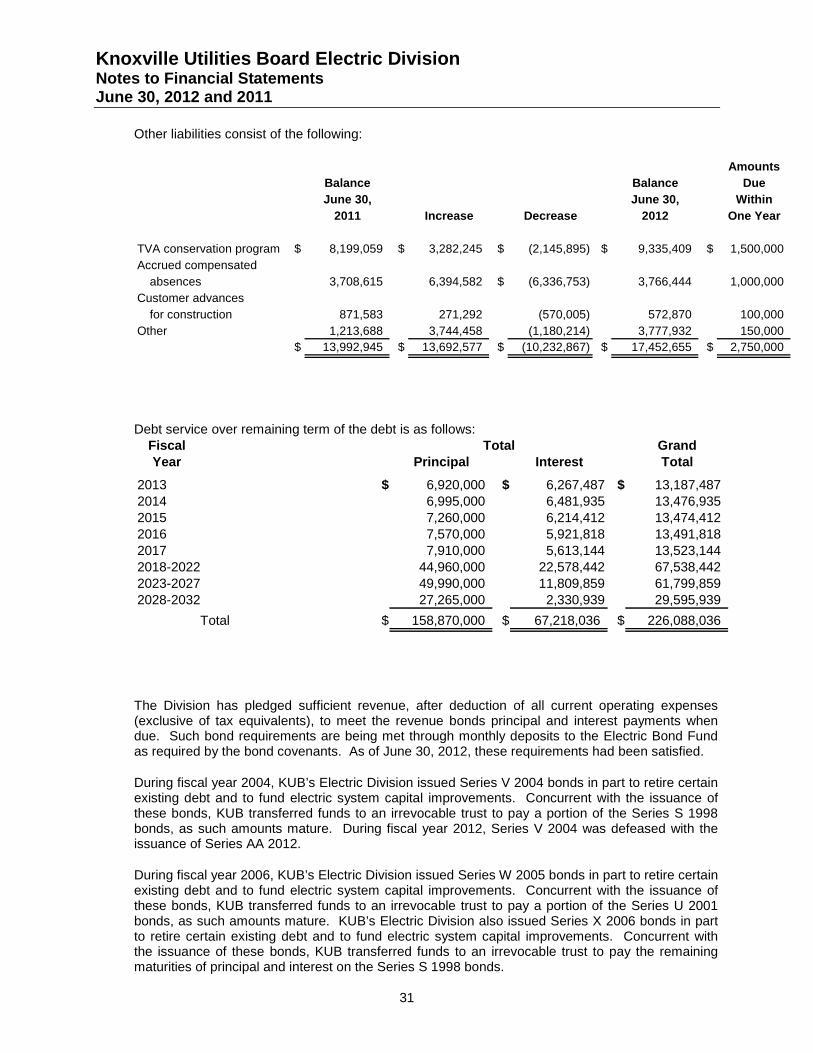
Knoxville Utilities Board Electric Division Notes to Financial Statements June 30, 2012 and 2011
31
Other liabilities consist of the following:
AmountsBalance Balance DueJune 30, June 30, Within
2011 Increase Decrease 2012 One Year
TVA conservation program $ 8,199,059 $ 3,282,245 $ (2,145,895) $ 9,335,409 $ 1,500,000 Accrued compensated
absences 3,708,615 6,394,582 $ (6,336,753) 3,766,444 1,000,000 Customer advances
for construction 871,583 271,292 (570,005) 572,870 100,000 Other 1,213,688 3,744,458 (1,180,214) 3,777,932 150,000
$ 13,992,945 $ 13,692,577 $ (10,232,867) $ 17,452,655 $ 2,750,000
Debt service over remaining term of the debt is as follows: Fiscal GrandYear Principal Interest Total
2013 $ 6,920,000 $ 6,267,487 $ 13,187,487 2014 6,995,000 6,481,935 13,476,935 2015 7,260,000 6,214,412 13,474,412 2016 7,570,000 5,921,818 13,491,818 2017 7,910,000 5,613,144 13,523,144 2018-2022 44,960,000 22,578,442 67,538,442 2023-2027 49,990,000 11,809,859 61,799,859 2028-2032 27,265,000 2,330,939 29,595,939
Total $ 158,870,000 $ 67,218,036 $ 226,088,036
Total
The Division has pledged sufficient revenue, after deduction of all current operating expenses (exclusive of tax equivalents), to meet the revenue bonds principal and interest payments when due. Such bond requirements are being met through monthly deposits to the Electric Bond Fund as required by the bond covenants. As of June 30, 2012, these requirements had been satisfied.
During fiscal year 2004, KUB’s Electric Division issued Series V 2004 bonds in part to retire certain existing debt and to fund electric system capital improvements. Concurrent with the issuance of these bonds, KUB transferred funds to an irrevocable trust to pay a portion of the Series S 1998 bonds, as such amounts mature. During fiscal year 2012, Series V 2004 was defeased with the issuance of Series AA 2012.
During fiscal year 2006, KUB’s Electric Division issued Series W 2005 bonds in part to retire certain existing debt and to fund electric system capital improvements. Concurrent with the issuance of these bonds, KUB transferred funds to an irrevocable trust to pay a portion of the Series U 2001 bonds, as such amounts mature. KUB’s Electric Division also issued Series X 2006 bonds in part to retire certain existing debt and to fund electric system capital improvements. Concurrent with the issuance of these bonds, KUB transferred funds to an irrevocable trust to pay the remaining maturities of principal and interest on the Series S 1998 bonds.
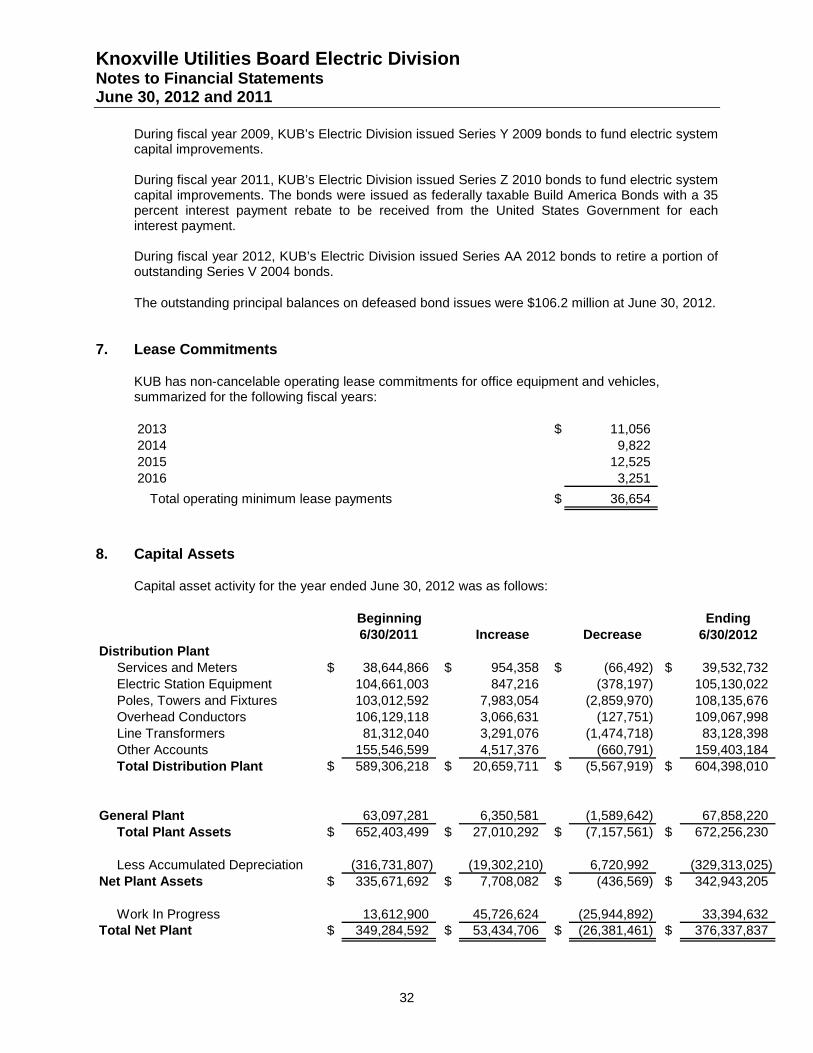
Knoxville Utilities Board Electric Division Notes to Financial Statements June 30, 2012 and 2011
32
During fiscal year 2009, KUB’s Electric Division issued Series Y 2009 bonds to fund electric system capital improvements. During fiscal year 2011, KUB’s Electric Division issued Series Z 2010 bonds to fund electric system capital improvements. The bonds were issued as federally taxable Build America Bonds with a 35 percent interest payment rebate to be received from the United States Government for each interest payment. During fiscal year 2012, KUB’s Electric Division issued Series AA 2012 bonds to retire a portion of outstanding Series V 2004 bonds.
The outstanding principal balances on defeased bond issues were $106.2 million at June 30, 2012.
7. Lease Commitments
KUB has non-cancelable operating lease commitments for office equipment and vehicles, summarized for the following fiscal years:
2013 $ 11,056 2014 9,822 2015 12,525 2016 3,251
Total operating minimum lease payments $ 36,654
8. Capital Assets
Capital asset activity for the year ended June 30, 2012 was as follows:
Beginning Ending6/30/2011 Increase Decrease 6/30/2012
Distribution PlantServices and Meters $ 38,644,866 $ 954,358 $ (66,492) $ 39,532,732 Electric Station Equipment 104,661,003 847,216 (378,197) 105,130,022 Poles, Towers and Fixtures 103,012,592 7,983,054 (2,859,970) 108,135,676 Overhead Conductors 106,129,118 3,066,631 (127,751) 109,067,998 Line Transformers 81,312,040 3,291,076 (1,474,718) 83,128,398 Other Accounts 155,546,599 4,517,376 (660,791) 159,403,184 Total Distribution Plant $ 589,306,218 $ 20,659,711 $ (5,567,919) $ 604,398,010
General Plant 63,097,281 6,350,581 (1,589,642) 67,858,220 Total Plant Assets $ 652,403,499 $ 27,010,292 $ (7,157,561) $ 672,256,230
Less Accumulated Depreciation (316,731,807) (19,302,210) 6,720,992 (329,313,025)
Net Plant Assets $ 335,671,692 $ 7,708,082 $ (436,569) $ 342,943,205
Work In Progress 13,612,900 45,726,624 (25,944,892) 33,394,632 Total Net Plant $ 349,284,592 $ 53,434,706 $ (26,381,461) $ 376,337,837
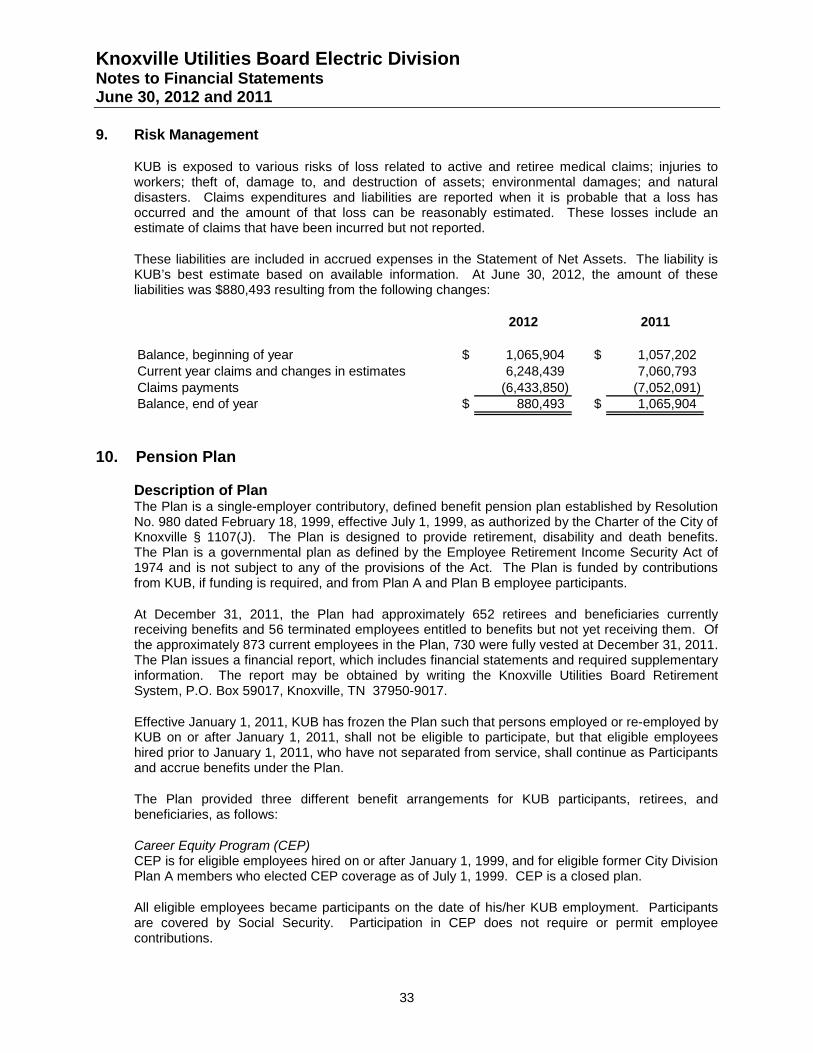
Knoxville Utilities Board Electric Division Notes to Financial Statements June 30, 2012 and 2011
33
9. Risk Management
KUB is exposed to various risks of loss related to active and retiree medical claims; injuries to workers; theft of, damage to, and destruction of assets; environmental damages; and natural disasters. Claims expenditures and liabilities are reported when it is probable that a loss has occurred and the amount of that loss can be reasonably estimated. These losses include an estimate of claims that have been incurred but not reported.
These liabilities are included in accrued expenses in the Statement of Net Assets. The liability is KUB’s best estimate based on available information. At June 30, 2012, the amount of these liabilities was $880,493 resulting from the following changes:
2012 2011
Balance, beginning of year $ 1,065,904 $ 1,057,202 Current year claims and changes in estimates 6,248,439 7,060,793 Claims payments (6,433,850) (7,052,091) Balance, end of year $ 880,493 $ 1,065,904
10. Pension Plan
Description of Plan The Plan is a single-employer contributory, defined benefit pension plan established by Resolution No. 980 dated February 18, 1999, effective July 1, 1999, as authorized by the Charter of the City of Knoxville § 1107(J). The Plan is designed to provide retirement, disability and death benefits. The Plan is a governmental plan as defined by the Employee Retirement Income Security Act of 1974 and is not subject to any of the provisions of the Act. The Plan is funded by contributions from KUB, if funding is required, and from Plan A and Plan B employee participants.
At December 31, 2011, the Plan had approximately 652 retirees and beneficiaries currently receiving benefits and 56 terminated employees entitled to benefits but not yet receiving them. Of the approximately 873 current employees in the Plan, 730 were fully vested at December 31, 2011. The Plan issues a financial report, which includes financial statements and required supplementary information. The report may be obtained by writing the Knoxville Utilities Board Retirement System, P.O. Box 59017, Knoxville, TN 37950-9017.
Effective January 1, 2011, KUB has frozen the Plan such that persons employed or re-employed by KUB on or after January 1, 2011, shall not be eligible to participate, but that eligible employees hired prior to January 1, 2011, who have not separated from service, shall continue as Participants and accrue benefits under the Plan.
The Plan provided three different benefit arrangements for KUB participants, retirees, and beneficiaries, as follows:
Career Equity Program (CEP) CEP is for eligible employees hired on or after January 1, 1999, and for eligible former City Division Plan A members who elected CEP coverage as of July 1, 1999. CEP is a closed plan.
All eligible employees became participants on the date of his/her KUB employment. Participants are covered by Social Security. Participation in CEP does not require or permit employee contributions.
Knoxville Utilities Board Electric Division Notes to Financial Statements June 30, 2012 and 2011
34
Plan A Plan A benefits are for former City Division Plan A active employees, vested terminated employees, retirees, and beneficiaries. Plan A is a closed plan.
All employees participating in the City Division Plan A as of June 30, 1999 were eligible to participate in KUB’s Plan A or the CEP program. Participants of Plan A are covered by Social Security. Plan A is a closed plan and is not available to KUB employees hired after July 1, 1999. Participation in Plan A requires employee contributions of 3 percent of the first $4,800 of annual earnings and 5 percent of annual earnings in excess of $4,800. Plan A provides for early retirement benefits with 25 years of service and normal retirement benefits at age 62 or older.
Plan B Plan B benefits are for former City Division Plan B active employees, vested terminated employees, retirees, and beneficiaries. Plan B is a closed plan.
All employees participating in the City Division Plan B as of June 30, 1999, are eligible to participate in KUB’s Plan B. Plan B is now a closed plan and no participants can be added. Participants of Plan B are not covered by Social Security. Participation in Plan B requires employee contributions of 4 percent of annual earnings. Plan B provides for retirement benefits after 25 years of service and the attainment of age 50.
Funding Policy For the Plan year ended December 31, 2011, a contribution of $3,593,282 is required to be made in the Plan sponsor’s fiscal year ending June 30, 2013. The Electric Division’s portion of this contribution is $1,688,843. The annual required contribution was determined as part of the January 1, 2011 valuation using the Individual Entry Age Normal funding method. The objective under this method is to fund each participant’s benefits under the Plan as payments which are level as a percentage of salary, starting on the original participation date (employment date) and continuing until the assumed retirement, termination, disability or death. For the Plan year ended December 31, 2011, the Plan’s actuarial funded ratio was 104.5 percent.
At the time the funding method is introduced, there is a liability, which represents the contributions that would have been accumulated if this method of funding had always been used. The excess, if any, of this liability over the actuarial value of the assets held in the fund, is the unfunded actuarial accrued liability, which is typically funded over a chosen period in accordance with an amortization schedule.
Significant actuarial assumptions used in the valuation include (a) rate of return of investments of 8 percent, (b) the RP2000 Mortality Table, (c) annual projected salary increases based on participants’ ages ranging from age 25 to age 65 with salary increases from 2.58 percent to 7.92 percent, and (d) cost of living adjustment of 2.8 percent annually. The actuarial value of assets was determined using techniques that smooth the effect of short-term volatility in the market value of equities over a five-year period.
As of the actuarial report for the Plan year ended December 31, 2011, contributions of $3,593,282 and $3,244,057 for 2011 and 2010, respectively, are required to be made during the Plan sponsor’s fiscal years ending June 30, 2013 and 2012, respectively. Of these amounts, $1,688,843 and $1,589,588 are attributable to the Electric Division. Subsequent to June 30, 2012, the actuarial report for the Plan year ending December 31, 2012 was completed.
Knoxville Utilities Board Electric Division Notes to Financial Statements June 30, 2012 and 2011
35
For the Plan year ending December 31, 2012, a contribution of $5,502,677 is required to be made in the Plan sponsor’s fiscal year ending June 30, 2014. The Electric Division’s portion of this contribution is $2,586,258. For the Plan year ending December 31, 2012, the Plan’s actuarial funded ratio was 94.1 percent.
11. Defined Contribution Plan
KUB has a defined contribution 401(k) employee retirement savings plan covering eligible KUB employees. Employees hired prior to January 1, 2011 may participate and receive a matching contribution of 50 percent of their own contribution up to a maximum match of 3 percent. Employees hired on or after January 1, 2011 have an enhanced 401(k) Plan due to the closure of the Defined Benefit Pension Plan. They may participate and receive a matching contribution of 50 percent of their own contribution up to a maximum match of 3 percent. They also receive a nonelective KUB contribution of from 3 percent to 6 percent, depending on years of service, whether they contribute or not.
Since July 1, 2000, 401(k) matching contributions for employees eligible to participate in the KUB Pension Plan have been funded by the Pension Plan. These funds are held by the Pension trustee until eligible for distribution. IRS rules permit the funding of 401(k) matching contributions from excess pension assets for employees covered under the Pension Plan. Given the current funding level of the Pension Plan, effective July 1, 2011, KUB began to reimburse the Pension Plan for the current matching contributions. The match and nonelective contributions for employees hired on or after January 1, 2011 are paid directly by KUB.
12. Other Post-Employment Benefits (OPEB)
The Governmental Accounting Standards Board (GASB) established new standards for the measurement, recognition, and reporting of other post-employment benefits (OPEB). OPEB includes post-employment benefits other than pension, which, for KUB, is presently limited to post-employment health care. GASB 45 requires the recognition of the accrued OPEB liability for the respective year, plus the disclosure of the total unfunded liability. GASB 45 was effective for KUB for the fiscal year beginning July 1, 2007.
KUB currently provides post-employment health care benefits to 633 former employees and 647 covered dependents. The cost of coverage is shared with retirees and beneficiaries. KUB recognizes its share of the cost of post-employment health care benefits as an expense as claims are paid. In anticipation of GASB 45, KUB amended its Group Health Plan in 1999, eliminating post-employment health care benefits for all employees hired on or after July 1, 1999. As of June 30, 2012, 450 active employees were eligible for individual and dependent coverage at separation if the employee meets the Rule of 80 (age plus years of service) with a minimum of 20 years of service.
In May 2006, the state of Tennessee adopted Tennessee Code Annotated, Title 8, Chapter 50, Part 12 authorizing governmental entities to establish Trusts for the purpose of pre-funding their respective OPEB liabilities.
Although GASB 45 does not require pre-funding of the liability, KUB has determined that it is in the long-term economic interest of KUB and its ratepayers to establish a Trust to pre-fund KUB’s OPEB liability.
In October 2007, the KUB Board authorized the establishment of an OPEB Trust. The applicable documentation was submitted to the State Funding Board and, in December 2007, the State
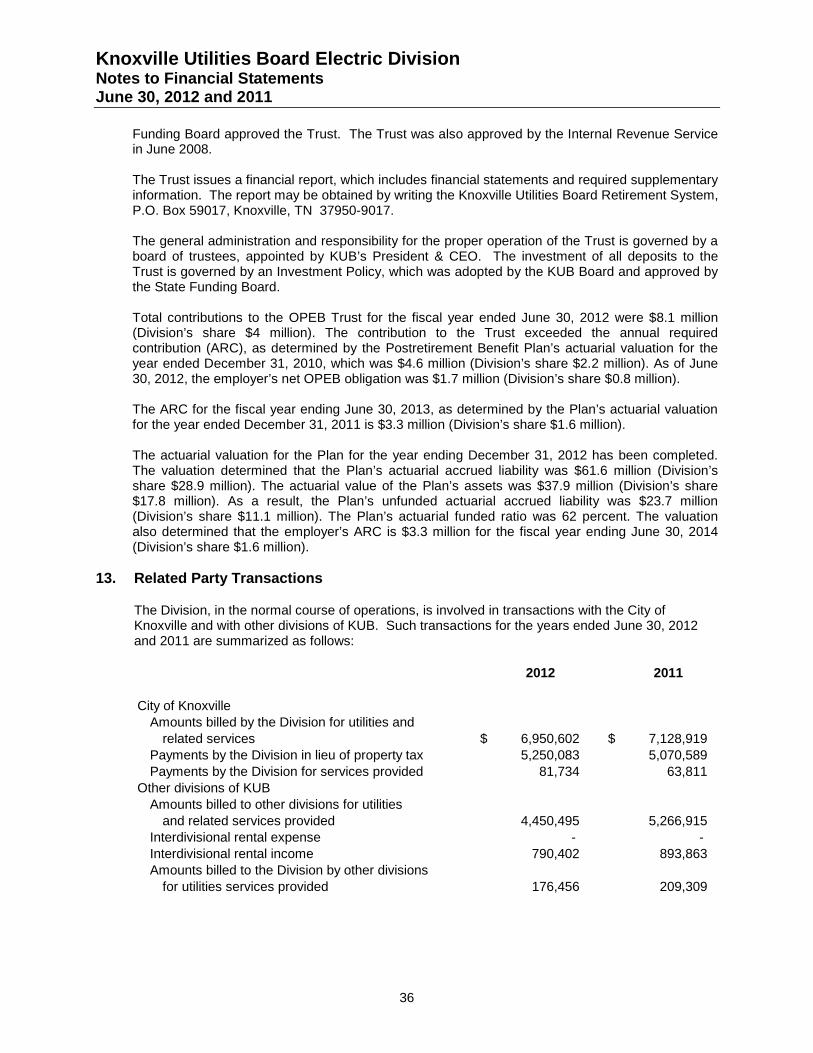
Knoxville Utilities Board Electric Division Notes to Financial Statements June 30, 2012 and 2011
36
Funding Board approved the Trust. The Trust was also approved by the Internal Revenue Service in June 2008. The Trust issues a financial report, which includes financial statements and required supplementary information. The report may be obtained by writing the Knoxville Utilities Board Retirement System, P.O. Box 59017, Knoxville, TN 37950-9017.
The general administration and responsibility for the proper operation of the Trust is governed by a board of trustees, appointed by KUB’s President & CEO. The investment of all deposits to the Trust is governed by an Investment Policy, which was adopted by the KUB Board and approved by the State Funding Board.
Total contributions to the OPEB Trust for the fiscal year ended June 30, 2012 were $8.1 million (Division’s share $4 million). The contribution to the Trust exceeded the annual required contribution (ARC), as determined by the Postretirement Benefit Plan’s actuarial valuation for the year ended December 31, 2010, which was $4.6 million (Division’s share $2.2 million). As of June 30, 2012, the employer’s net OPEB obligation was $1.7 million (Division’s share $0.8 million).
The ARC for the fiscal year ending June 30, 2013, as determined by the Plan’s actuarial valuation for the year ended December 31, 2011 is $3.3 million (Division’s share $1.6 million).
The actuarial valuation for the Plan for the year ending December 31, 2012 has been completed. The valuation determined that the Plan’s actuarial accrued liability was $61.6 million (Division’s share $28.9 million). The actuarial value of the Plan’s assets was $37.9 million (Division’s share $17.8 million). As a result, the Plan’s unfunded actuarial accrued liability was $23.7 million (Division’s share $11.1 million). The Plan’s actuarial funded ratio was 62 percent. The valuation also determined that the employer’s ARC is $3.3 million for the fiscal year ending June 30, 2014 (Division’s share $1.6 million).
13. Related Party Transactions
The Division, in the normal course of operations, is involved in transactions with the City of Knoxville and with other divisions of KUB. Such transactions for the years ended June 30, 2012 and 2011 are summarized as follows:
2012 2011
City of KnoxvilleAmounts billed by the Division for utilities and
related services $ 6,950,602 $ 7,128,919 Payments by the Division in lieu of property tax 5,250,083 5,070,589 Payments by the Division for services provided 81,734 63,811
Other divisions of KUBAmounts billed to other divisions for utilities
and related services provided 4,450,495 5,266,915 Interdivisional rental expense - - Interdivisional rental income 790,402 893,863 Amounts billed to the Division by other divisions
for utilities services provided 176,456 209,309
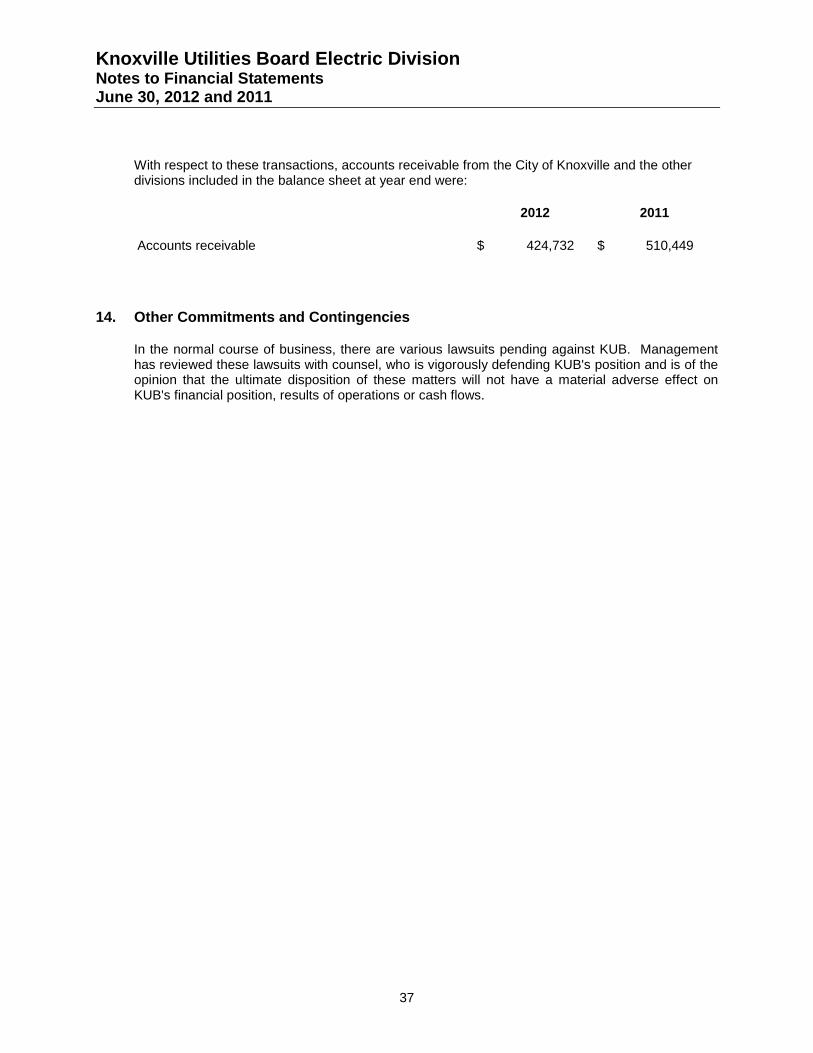
Knoxville Utilities Board Electric Division Notes to Financial Statements June 30, 2012 and 2011
37
With respect to these transactions, accounts receivable from the City of Knoxville and the other divisions included in the balance sheet at year end were:
2012 2011
Accounts receivable $ 424,732 $ 510,449
14. Other Commitments and Contingencies
In the normal course of business, there are various lawsuits pending against KUB. Management has reviewed these lawsuits with counsel, who is vigorously defending KUB's position and is of the opinion that the ultimate disposition of these matters will not have a material adverse effect on KUB's financial position, results of operations or cash flows.
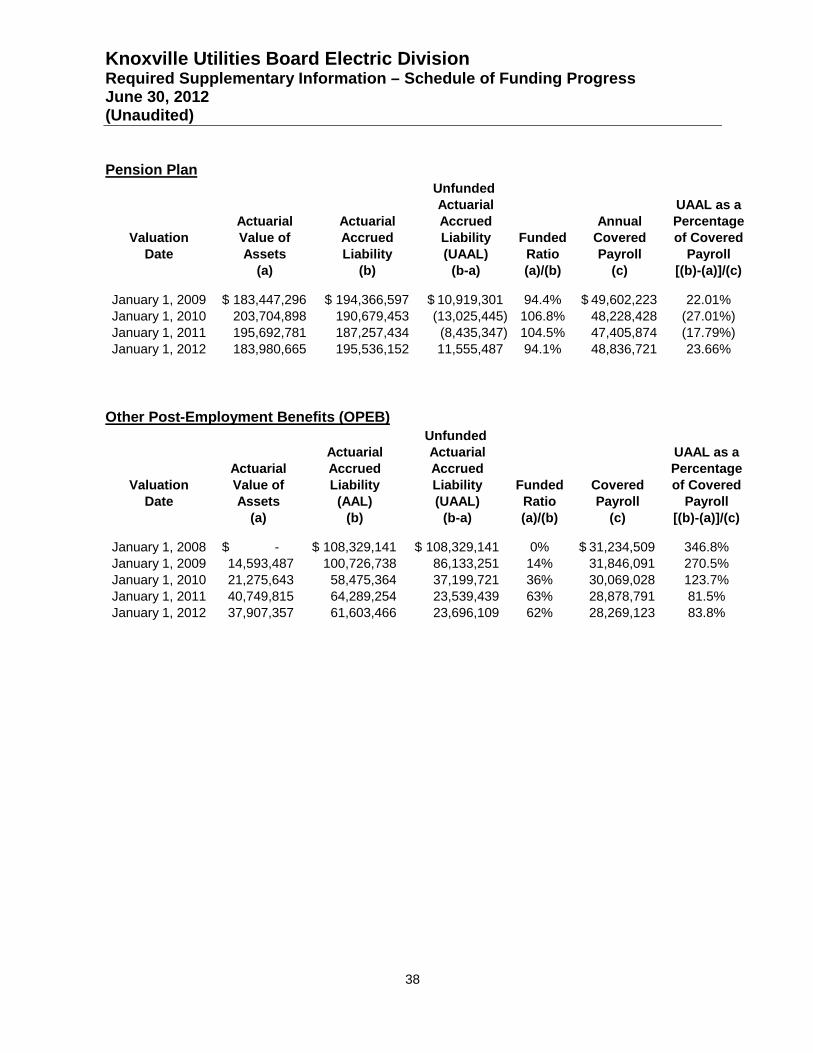
Knoxville Utilities Board Electric Division Required Supplementary Information – Schedule of Funding Progress June 30, 2012 (Unaudited)
38
Unfunded Actuarial UAAL as a
Actuarial Actuarial Accrued Annual PercentageValuation Value of Accrued Liability Funded Covered of Covered
Date Assets Liability (UAAL) Ratio Payroll Payroll(a) (b) (b-a) (a)/(b) (c) [(b)-(a)]/(c)
January 1, 2009 183,447,296$ 194,366,597$ 10,919,301$ 94.4% 49,602,223$ 22.01%January 1, 2010 203,704,898 190,679,453 (13,025,445) 106.8% 48,228,428 (27.01%)January 1, 2011 195,692,781 187,257,434 (8,435,347) 104.5% 47,405,874 (17.79%)January 1, 2012 183,980,665 195,536,152 11,555,487 94.1% 48,836,721 23.66%
Pension Plan
Unfunded Actuarial Actuarial UAAL as a
Actuarial Accrued Accrued PercentageValuation Value of Liability Liability Funded Covered of Covered
Date Assets (AAL) (UAAL) Ratio Payroll Payroll(a) (b) (b-a) (a)/(b) (c) [(b)-(a)]/(c)
January 1, 2008 -$ 108,329,141$ 108,329,141$ 0% 31,234,509$ 346.8%January 1, 2009 14,593,487 100,726,738 86,133,251 14% 31,846,091 270.5%January 1, 2010 21,275,643 58,475,364 37,199,721 36% 30,069,028 123.7%January 1, 2011 40,749,815 64,289,254 23,539,439 63% 28,878,791 81.5%January 1, 2012 37,907,357 61,603,466 23,696,109 62% 28,269,123 83.8%
Other Post-Employment Benefits (OPEB)
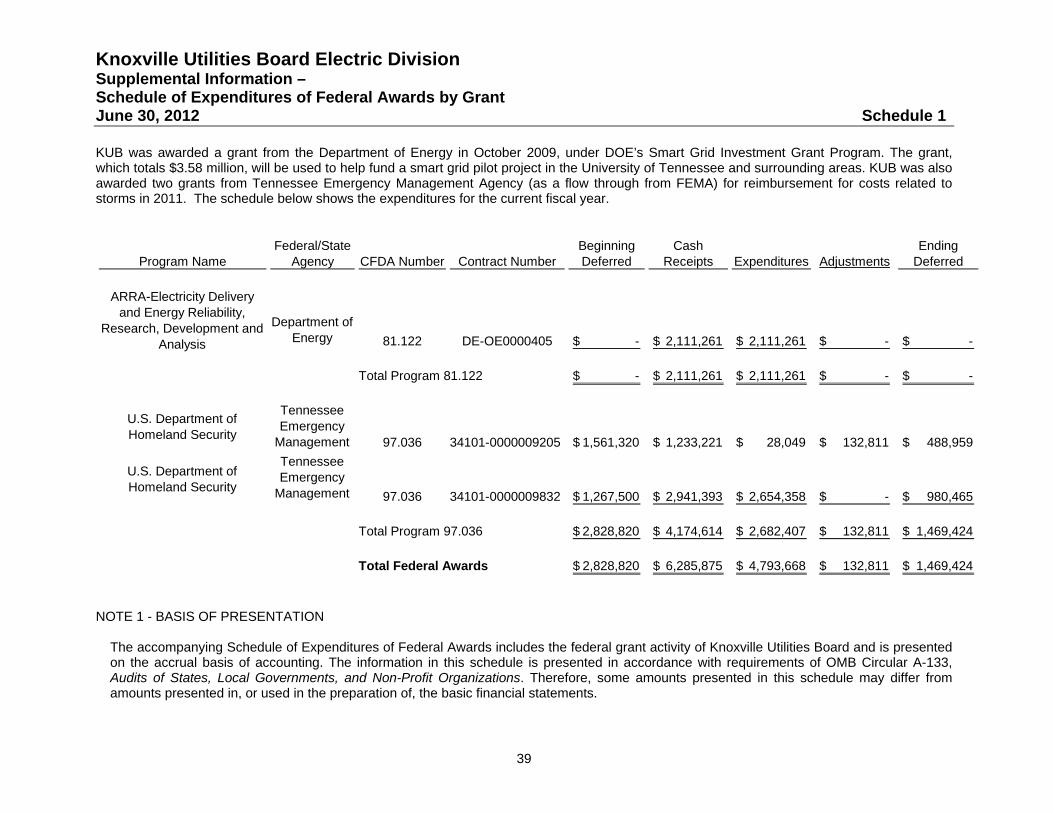
Knoxville Utilities Board Electric Division Supplemental Information – Schedule of Expenditures of Federal Awards by Grant June 30, 2012 Schedule 1
39
KUB was awarded a grant from the Department of Energy in October 2009, under DOE’s Smart Grid Investment Grant Program. The grant, which totals $3.58 million, will be used to help fund a smart grid pilot project in the University of Tennessee and surrounding areas. KUB was also awarded two grants from Tennessee Emergency Management Agency (as a flow through from FEMA) for reimbursement for costs related to storms in 2011. The schedule below shows the expenditures for the current fiscal year.
Federal/State Beginning Cash EndingProgram Name Agency CFDA Number Contract Number Deferred Receipts Expenditures Adjustments Deferred
ARRA-Electricity Delivery and Energy Reliability,
Research, Development and Analysis
Department of Energy 81.122 DE-OE0000405 -$ 2,111,261$ 2,111,261$ -$ -$
Total Program 81.122 -$ 2,111,261$ 2,111,261$ -$ -$
U.S. Department of Homeland Security
Tennessee Emergency
Management 97.036 34101-0000009205 1,561,320$ 1,233,221$ 28,049$ 132,811$ 488,959$
U.S. Department of Homeland Security
Tennessee Emergency
Management 97.036 34101-0000009832 1,267,500$ 2,941,393$ 2,654,358$ -$ 980,465$
Total Program 97.036 2,828,820$ 4,174,614$ 2,682,407$ 132,811$ 1,469,424$
Total Federal Awards 2,828,820$ 6,285,875$ 4,793,668$ 132,811$ 1,469,424$
NOTE 1 - BASIS OF PRESENTATION
The accompanying Schedule of Expenditures of Federal Awards includes the federal grant activity of Knoxville Utilities Board and is presented on the accrual basis of accounting. The information in this schedule is presented in accordance with requirements of OMB Circular A-133, Audits of States, Local Governments, and Non-Profit Organizations. Therefore, some amounts presented in this schedule may differ from amounts presented in, or used in the preparation of, the basic financial statements.
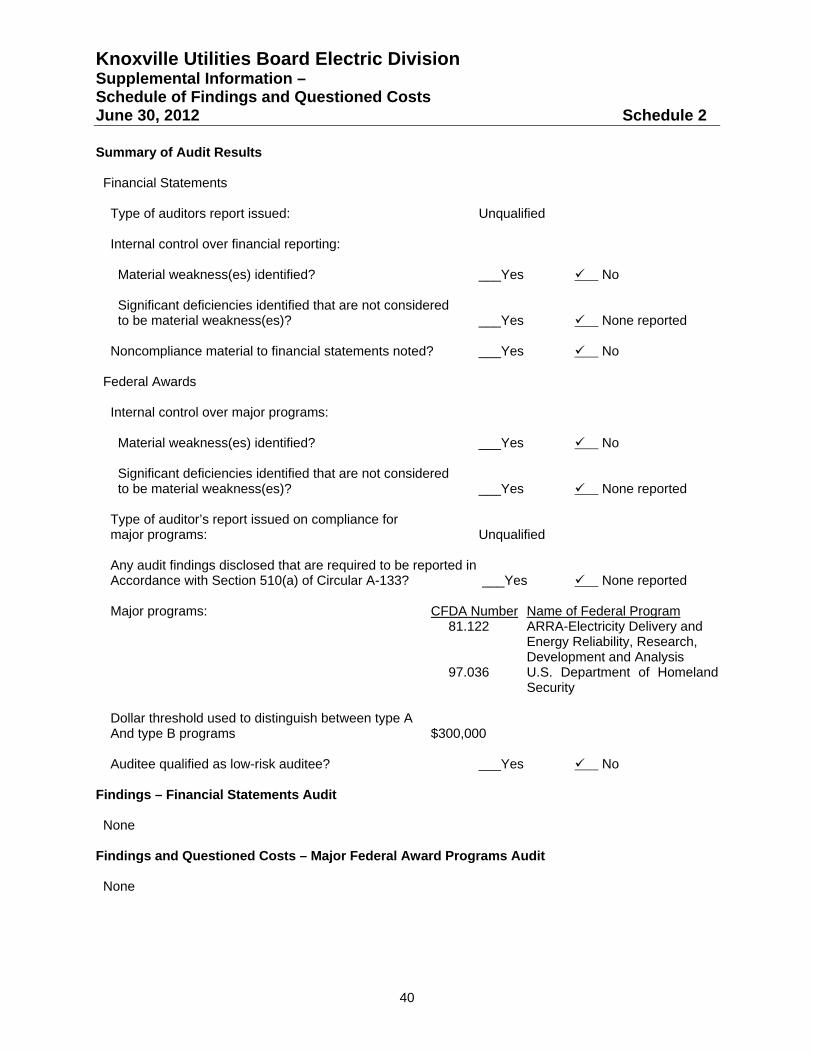
Knoxville Utilities Board Electric Division Supplemental Information – Schedule of Findings and Questioned Costs June 30, 2012 Schedule 2
40
Summary of Audit Results Financial Statements Type of auditors report issued: Unqualified Internal control over financial reporting: Material weakness(es) identified? ___Yes No Significant deficiencies identified that are not considered to be material weakness(es)? ___Yes None reported Noncompliance material to financial statements noted? ___Yes No Federal Awards Internal control over major programs: Material weakness(es) identified? ___Yes No Significant deficiencies identified that are not considered to be material weakness(es)? ___Yes None reported Type of auditor’s report issued on compliance for major programs: Unqualified Any audit findings disclosed that are required to be reported in Accordance with Section 510(a) of Circular A-133? ___Yes None reported Major programs: CFDA Number Name of Federal Program
81.122 ARRA-Electricity Delivery and Energy Reliability, Research, Development and Analysis
97.036 U.S. Department of Homeland Security
Dollar threshold used to distinguish between type A And type B programs $300,000 Auditee qualified as low-risk auditee? ___Yes No Findings – Financial Statements Audit None Findings and Questioned Costs – Major Federal Award Programs Audit None
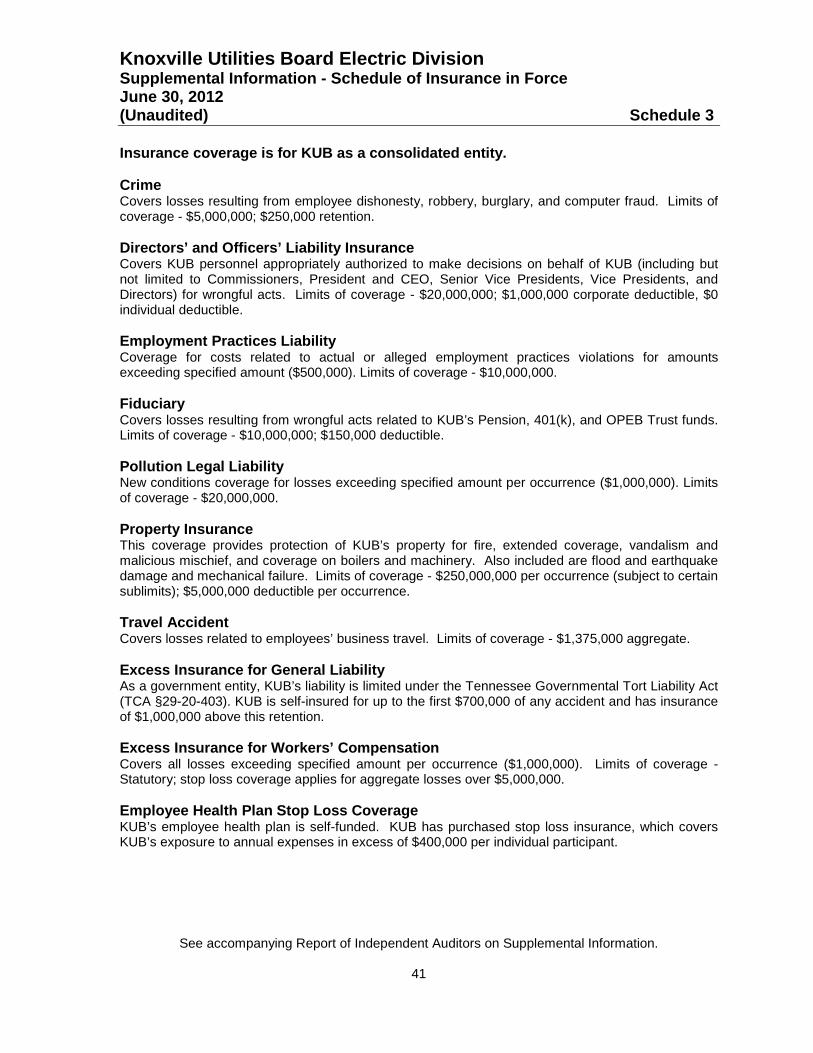
Knoxville Utilities Board Electric Division Supplemental Information - Schedule of Insurance in Force June 30, 2012 (Unaudited) Schedule 3
See accompanying Report of Independent Auditors on Supplemental Information.
41
Insurance coverage is for KUB as a consolidated entity. Crime Covers losses resulting from employee dishonesty, robbery, burglary, and computer fraud. Limits of coverage - $5,000,000; $250,000 retention. Directors’ and Officers’ Liability Insurance Covers KUB personnel appropriately authorized to make decisions on behalf of KUB (including but not limited to Commissioners, President and CEO, Senior Vice Presidents, Vice Presidents, and Directors) for wrongful acts. Limits of coverage - $20,000,000; $1,000,000 corporate deductible, $0 individual deductible. Employment Practices Liability Coverage for costs related to actual or alleged employment practices violations for amounts exceeding specified amount ($500,000). Limits of coverage - $10,000,000. Fiduciary Covers losses resulting from wrongful acts related to KUB’s Pension, 401(k), and OPEB Trust funds. Limits of coverage - $10,000,000; $150,000 deductible. Pollution Legal Liability New conditions coverage for losses exceeding specified amount per occurrence ($1,000,000). Limits of coverage - $20,000,000. Property Insurance This coverage provides protection of KUB’s property for fire, extended coverage, vandalism and malicious mischief, and coverage on boilers and machinery. Also included are flood and earthquake damage and mechanical failure. Limits of coverage - $250,000,000 per occurrence (subject to certain sublimits); $5,000,000 deductible per occurrence. Travel Accident Covers losses related to employees’ business travel. Limits of coverage - $1,375,000 aggregate. Excess Insurance for General Liability As a government entity, KUB’s liability is limited under the Tennessee Governmental Tort Liability Act (TCA §29-20-403). KUB is self-insured for up to the first $700,000 of any accident and has insurance of $1,000,000 above this retention. Excess Insurance for Workers’ Compensation Covers all losses exceeding specified amount per occurrence ($1,000,000). Limits of coverage - Statutory; stop loss coverage applies for aggregate losses over $5,000,000. Employee Health Plan Stop Loss Coverage KUB’s employee health plan is self-funded. KUB has purchased stop loss insurance, which covers KUB’s exposure to annual expenses in excess of $400,000 per individual participant.
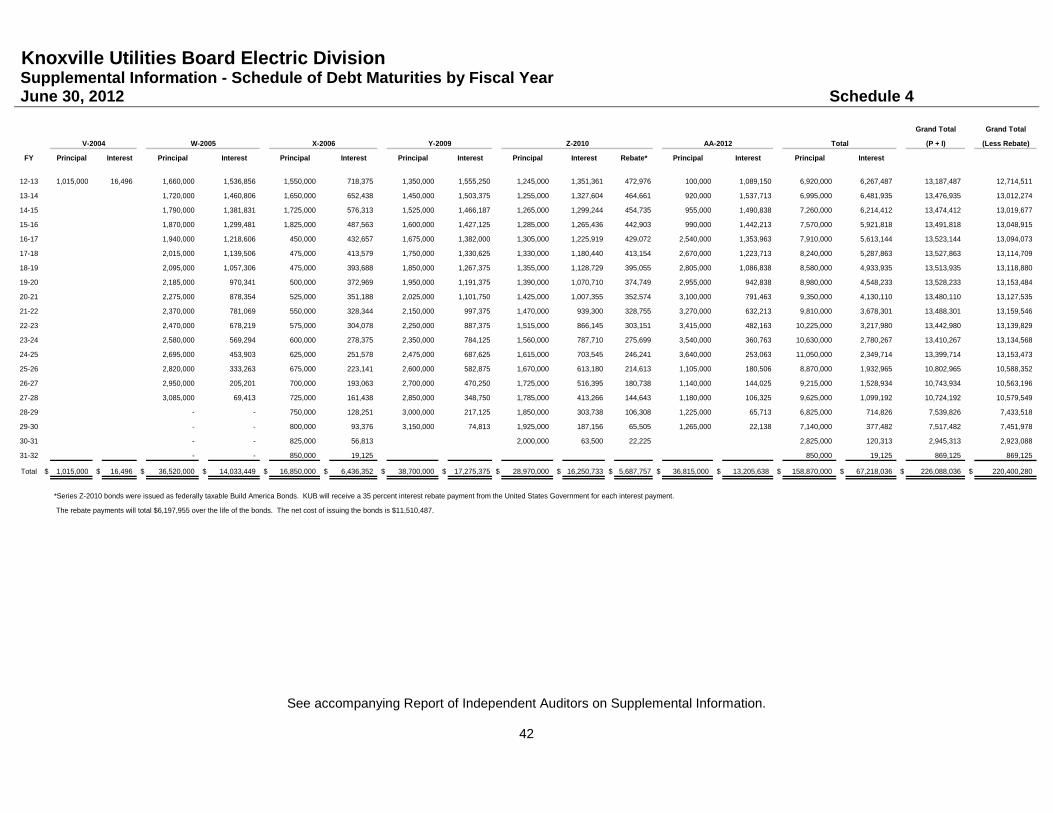
Knoxville Utilities Board Electric Division Supplemental Information - Schedule of Debt Maturities by Fiscal Year June 30, 2012 Schedule 4
See accompanying Report of Independent Auditors on Supplemental Information.
42
Grand Total Grand Total
(P + I) (Less Rebate)
FY Principal Interest Principal Interest Principal Interest Principal Interest Principal Interest Rebate* Principal Interest Principal Interest
12-13 1,015,000 16,496 1,660,000 1,536,856 1,550,000 718,375 1,350,000 1,555,250 1,245,000 1,351,361 472,976 100,000 1,089,150 6,920,000 6,267,487 13,187,487 12,714,511
13-14 1,720,000 1,460,806 1,650,000 652,438 1,450,000 1,503,375 1,255,000 1,327,604 464,661 920,000 1,537,713 6,995,000 6,481,935 13,476,935 13,012,274
14-15 1,790,000 1,381,831 1,725,000 576,313 1,525,000 1,466,187 1,265,000 1,299,244 454,735 955,000 1,490,838 7,260,000 6,214,412 13,474,412 13,019,677
15-16 1,870,000 1,299,481 1,825,000 487,563 1,600,000 1,427,125 1,285,000 1,265,436 442,903 990,000 1,442,213 7,570,000 5,921,818 13,491,818 13,048,915
16-17 1,940,000 1,218,606 450,000 432,657 1,675,000 1,382,000 1,305,000 1,225,919 429,072 2,540,000 1,353,963 7,910,000 5,613,144 13,523,144 13,094,073
17-18 2,015,000 1,139,506 475,000 413,579 1,750,000 1,330,625 1,330,000 1,180,440 413,154 2,670,000 1,223,713 8,240,000 5,287,863 13,527,863 13,114,709
18-19 2,095,000 1,057,306 475,000 393,688 1,850,000 1,267,375 1,355,000 1,128,729 395,055 2,805,000 1,086,838 8,580,000 4,933,935 13,513,935 13,118,880
19-20 2,185,000 970,341 500,000 372,969 1,950,000 1,191,375 1,390,000 1,070,710 374,749 2,955,000 942,838 8,980,000 4,548,233 13,528,233 13,153,484
20-21 2,275,000 878,354 525,000 351,188 2,025,000 1,101,750 1,425,000 1,007,355 352,574 3,100,000 791,463 9,350,000 4,130,110 13,480,110 13,127,535
21-22 2,370,000 781,069 550,000 328,344 2,150,000 997,375 1,470,000 939,300 328,755 3,270,000 632,213 9,810,000 3,678,301 13,488,301 13,159,546
22-23 2,470,000 678,219 575,000 304,078 2,250,000 887,375 1,515,000 866,145 303,151 3,415,000 482,163 10,225,000 3,217,980 13,442,980 13,139,829
23-24 2,580,000 569,294 600,000 278,375 2,350,000 784,125 1,560,000 787,710 275,699 3,540,000 360,763 10,630,000 2,780,267 13,410,267 13,134,568
24-25 2,695,000 453,903 625,000 251,578 2,475,000 687,625 1,615,000 703,545 246,241 3,640,000 253,063 11,050,000 2,349,714 13,399,714 13,153,473
25-26 2,820,000 333,263 675,000 223,141 2,600,000 582,875 1,670,000 613,180 214,613 1,105,000 180,506 8,870,000 1,932,965 10,802,965 10,588,352
26-27 2,950,000 205,201 700,000 193,063 2,700,000 470,250 1,725,000 516,395 180,738 1,140,000 144,025 9,215,000 1,528,934 10,743,934 10,563,196
27-28 3,085,000 69,413 725,000 161,438 2,850,000 348,750 1,785,000 413,266 144,643 1,180,000 106,325 9,625,000 1,099,192 10,724,192 10,579,549
28-29 - - 750,000 128,251 3,000,000 217,125 1,850,000 303,738 106,308 1,225,000 65,713 6,825,000 714,826 7,539,826 7,433,518
29-30 - - 800,000 93,376 3,150,000 74,813 1,925,000 187,156 65,505 1,265,000 22,138 7,140,000 377,482 7,517,482 7,451,978
30-31 - - 825,000 56,813 2,000,000 63,500 22,225 2,825,000 120,313 2,945,313 2,923,088
31-32 - - 850,000 19,125 850,000 19,125 869,125 869,125
Total $ 1,015,000 $ 16,496 $ 36,520,000 $ 14,033,449 $ 16,850,000 $ 6,436,352 $ 38,700,000 $ 17,275,375 $ 28,970,000 $ 16,250,733 $ 5,687,757 $ 36,815,000 $ 13,205,638 $ 158,870,000 $ 67,218,036 $ 226,088,036 $ 220,400,280
*Series Z-2010 bonds were issued as federally taxable Build America Bonds. KUB will receive a 35 percent interest rebate payment from the United States Government for each interest payment.
The rebate payments will total $6,197,955 over the life of the bonds. The net cost of issuing the bonds is $11,510,487.
X-2006 Y-2009 TotalV-2004 W-2005 Z-2010 AA-2012
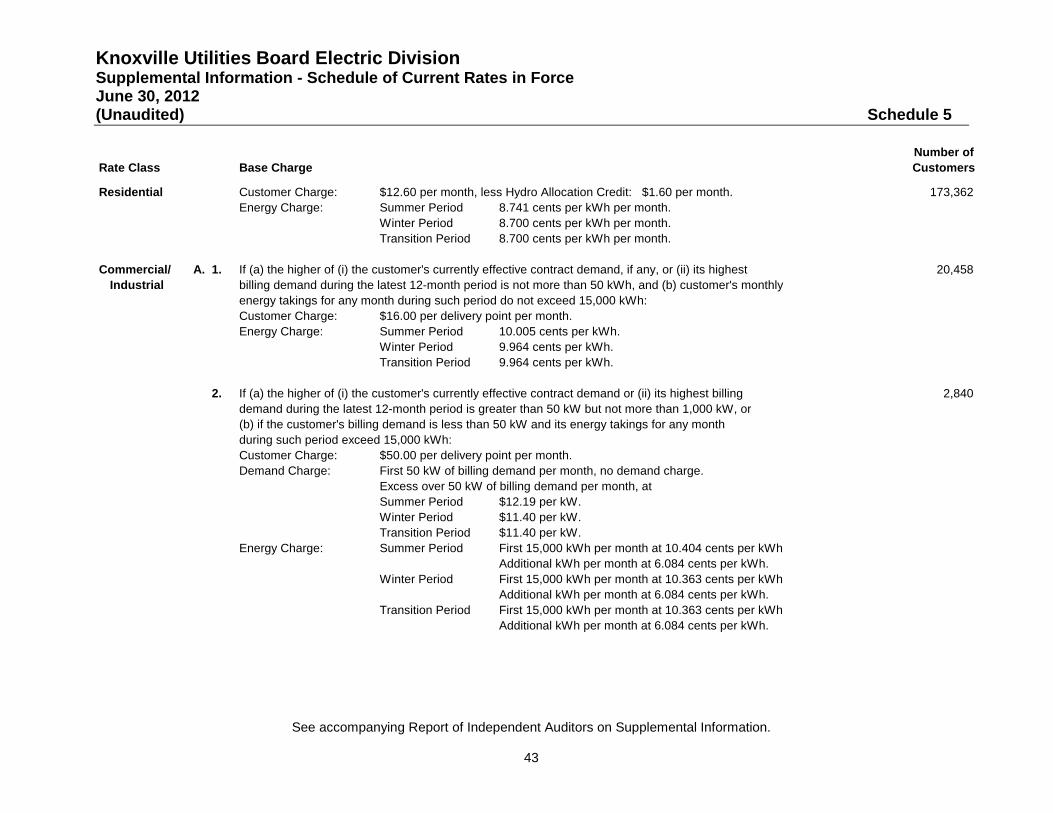
Knoxville Utilities Board Electric Division Supplemental Information - Schedule of Current Rates in Force June 30, 2012 (Unaudited) Schedule 5
See accompanying Report of Independent Auditors on Supplemental Information.
43
Number ofRate Class Base Charge Customers
Residential Customer Charge: $12.60 per month, less Hydro Allocation Credit: $1.60 per month. 173,362 Energy Charge: Summer Period 8.741 cents per kWh per month.
Winter Period 8.700 cents per kWh per month.Transition Period 8.700 cents per kWh per month.
Commercial/ A. 1. If (a) the higher of (i) the customer's currently effective contract demand, if any, or (ii) its highest 20,458 Industrial billing demand during the latest 12-month period is not more than 50 kWh, and (b) customer's monthly
energy takings for any month during such period do not exceed 15,000 kWh:Customer Charge: $16.00 per delivery point per month.Energy Charge: Summer Period 10.005 cents per kWh.
Winter Period 9.964 cents per kWh.Transition Period 9.964 cents per kWh.
2. If (a) the higher of (i) the customer's currently effective contract demand or (ii) its highest billing 2,840 demand during the latest 12-month period is greater than 50 kW but not more than 1,000 kW, or(b) if the customer's billing demand is less than 50 kW and its energy takings for any monthduring such period exceed 15,000 kWh:Customer Charge: $50.00 per delivery point per month.Demand Charge: First 50 kW of billing demand per month, no demand charge.
Excess over 50 kW of billing demand per month, at Summer Period $12.19 per kW.Winter Period $11.40 per kW.Transition Period $11.40 per kW.
Energy Charge: Summer Period First 15,000 kWh per month at 10.404 cents per kWh Additional kWh per month at 6.084 cents per kWh.
Winter Period First 15,000 kWh per month at 10.363 cents per kWh Additional kWh per month at 6.084 cents per kWh.
Transition Period First 15,000 kWh per month at 10.363 cents per kWh Additional kWh per month at 6.084 cents per kWh.
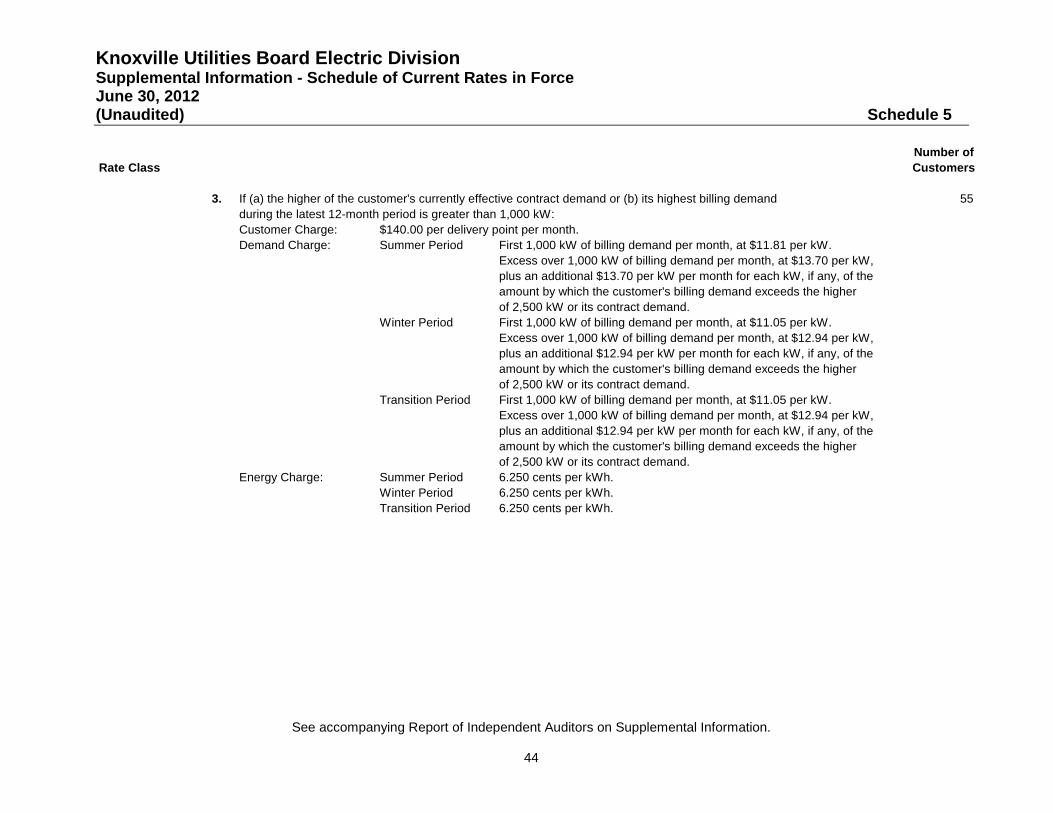
Knoxville Utilities Board Electric Division Supplemental Information - Schedule of Current Rates in Force June 30, 2012 (Unaudited) Schedule 5
See accompanying Report of Independent Auditors on Supplemental Information.
44
Number ofRate Class Customers
3. If (a) the higher of the customer's currently effective contract demand or (b) its highest billing demand 55 during the latest 12-month period is greater than 1,000 kW:Customer Charge: $140.00 per delivery point per month.Demand Charge: Summer Period First 1,000 kW of billing demand per month, at $11.81 per kW.
Excess over 1,000 kW of billing demand per month, at $13.70 per kW, plus an additional $13.70 per kW per month for each kW, if any, of the amount by which the customer's billing demand exceeds the higher of 2,500 kW or its contract demand.
Winter Period First 1,000 kW of billing demand per month, at $11.05 per kW. Excess over 1,000 kW of billing demand per month, at $12.94 per kW, plus an additional $12.94 per kW per month for each kW, if any, of the amount by which the customer's billing demand exceeds the higher of 2,500 kW or its contract demand.
Transition Period First 1,000 kW of billing demand per month, at $11.05 per kW. Excess over 1,000 kW of billing demand per month, at $12.94 per kW, plus an additional $12.94 per kW per month for each kW, if any, of the amount by which the customer's billing demand exceeds the higher of 2,500 kW or its contract demand.
Energy Charge: Summer Period 6.250 cents per kWh.Winter Period 6.250 cents per kWh.Transition Period 6.250 cents per kWh.
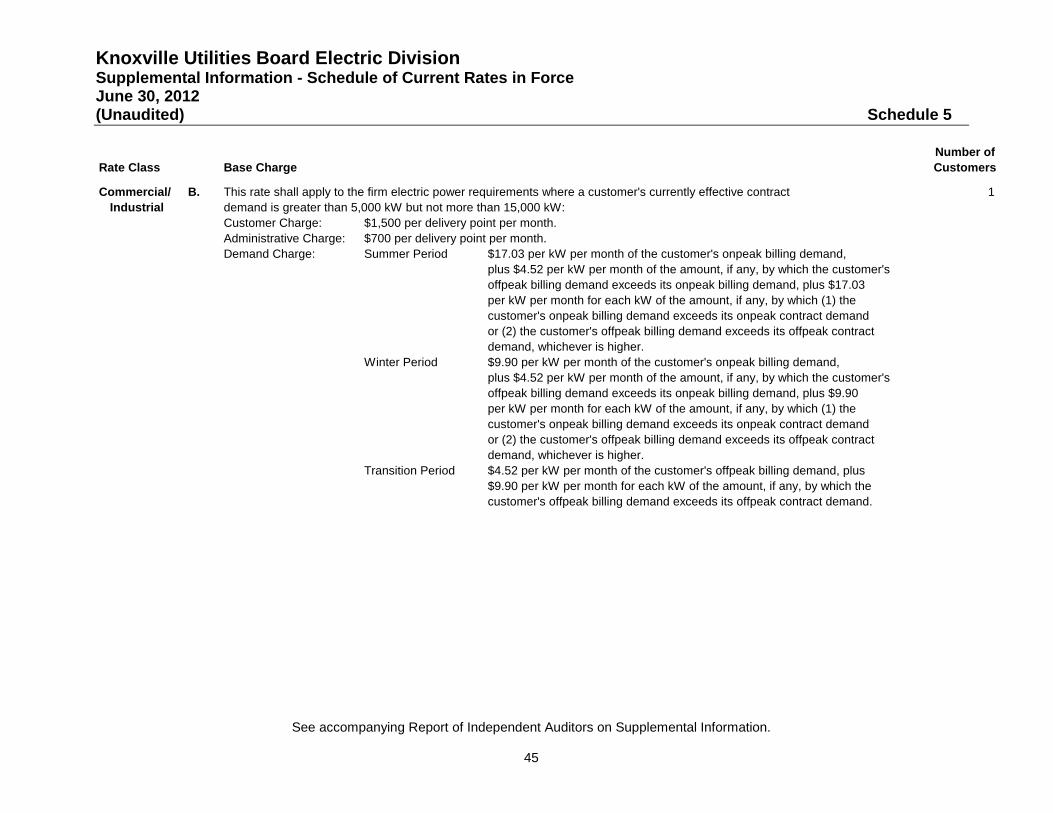
Knoxville Utilities Board Electric Division Supplemental Information - Schedule of Current Rates in Force June 30, 2012 (Unaudited) Schedule 5
See accompanying Report of Independent Auditors on Supplemental Information.
45
Number ofRate Class Base Charge Customers
Commercial/ B. This rate shall apply to the firm electric power requirements where a customer's currently effective contract 1 Industrial demand is greater than 5,000 kW but not more than 15,000 kW:
Customer Charge: $1,500 per delivery point per month.Administrative Charge: $700 per delivery point per month.Demand Charge: Summer Period $17.03 per kW per month of the customer's onpeak billing demand,
plus $4.52 per kW per month of the amount, if any, by which the customer's offpeak billing demand exceeds its onpeak billing demand, plus $17.03per kW per month for each kW of the amount, if any, by which (1) the customer's onpeak billing demand exceeds its onpeak contract demand or (2) the customer's offpeak billing demand exceeds its offpeak contract demand, whichever is higher.
Winter Period $9.90 per kW per month of the customer's onpeak billing demand, plus $4.52 per kW per month of the amount, if any, by which the customer's offpeak billing demand exceeds its onpeak billing demand, plus $9.90per kW per month for each kW of the amount, if any, by which (1) the customer's onpeak billing demand exceeds its onpeak contract demand or (2) the customer's offpeak billing demand exceeds its offpeak contract demand, whichever is higher.
Transition Period $4.52 per kW per month of the customer's offpeak billing demand, plus$9.90 per kW per month for each kW of the amount, if any, by which thecustomer's offpeak billing demand exceeds its offpeak contract demand.

Knoxville Utilities Board Electric Division Supplemental Information - Schedule of Current Rates in Force June 30, 2012 (Unaudited) Schedule 5
See accompanying Report of Independent Auditors on Supplemental Information.
46
Energy Charge: Summer Period 9.874 cents per kWh per month for all metered onpeak kWh, plus 6.390cents per kWh per month for the first 425 hours of maximum metered demand multiplied by the ratio of offpeak energy to total energy, plus 4.514cents per kWh per month for the next 195 hours use of maximum metered demand multiplied by the ratio of offpeak energy to total energy, plus 2.922cents per kWh per month for the hours use of maximum metered demand inexcess of 620 hours multiplied by the ratio of offpeak energy to total energy.
Winter Period 6.793 cents per kWh per month for all metered onpeak kWh, plus 6.390cents per kWh per month for the first 425 hours of maximum metered demand multiplied by the ratio of offpeak energy to total energy, plus 4.514cents per kWh per month for the next 195 hours use of maximum metered demand multiplied by the ratio of offpeak energy to total energy, plus 2.922cents per kWh per month for the hours use of maximum metered demand inexcess of 620 hours multiplied by the ratio of offpeak energy to total energy.
Transition Period 6.390 cents per kWh per month for the first 425 hours use of maximum metered demand, plus 4.514 cents per kWh per month for the next 195 hours use of maximum metered demand, plus 2.922 cents per kWh per monthfor the hours use of maximum metered demand in excess of 620 hours.

Knoxville Utilities Board Electric Division Supplemental Information - Schedule of Current Rates in Force June 30, 2012 (Unaudited) Schedule 5
See accompanying Report of Independent Auditors on Supplemental Information.
47
Number ofRate Class Base Charge Customers
Commercial/ C. This rate shall apply to the firm electric power requirements where a customer's currently effective contract - Industrial demand is greater than 15,000 kW but not more than 25,000 kW:
Customer Charge: $1,500 per delivery point per month.Administrative Charge: $700 per delivery point per month.Demand Charge: Summer Period $16.38 per kW per month of the customer's onpeak billing demand,
plus $3.87 per kW per month of the amount, if any, by which the customer's offpeak billing demand exceeds its onpeak billing demand, plus $16.38per kW per month for each kW of the amount, if any, by which (1) the customer's onpeak billing demand exceeds its onpeak contract demand or (2) the customer's offpeak billing demand exceeds its offpeak contract demand, whichever is higher.
Winter Period $9.25 per kW per month of the customer's onpeak billing demand, plus $3.87 per kW per month of the amount, if any, by which the customer's offpeak billing demand exceeds its onpeak billing demand, plus $9.25per kW per month for each kW of the amount, if any, by which (1) the customer's onpeak billing demand exceeds its onpeak contract demand or (2) the customer's offpeak billing demand exceeds its offpeak contract demand, whichever is higher.
Transition Period $3.87 per kW per month of the customer's offpeak billing demand, plus$9.25 per kW per month for each kW of the amount, if any, by which thecustomer's offpeak billing demand exceeds its offpeak contract demand.

Knoxville Utilities Board Electric Division Supplemental Information - Schedule of Current Rates in Force June 30, 2012 (Unaudited) Schedule 5
See accompanying Report of Independent Auditors on Supplemental Information.
48
Energy Charge: Summer Period 9.512 cents per kWh per month for all metered onpeak kWh, plus 6.126cents per kWh per month for the first 425 hours of maximum metered demand multiplied by the ratio of offpeak energy to total energy, plus 4.249cents per kWh per month for the next 195 hours use of maximum metered demand multiplied by the ratio of offpeak energy to total energy, plus 2.657cents per kWh per month for the hours use of maximum metered demand inexcess of 620 hours multiplied by the ratio of offpeak energy to total energy.
Winter Period 6.507 cents per kWh per month for all metered onpeak kWh, plus 6.126cents per kWh per month for the first 425 hours of maximum metered demand multiplied by the ratio of offpeak energy to total energy, plus 4.249cents per kWh per month for the next 195 hours use of maximum metered demand multiplied by the ratio of offpeak energy to total energy, plus 2.657cents per kWh per month for the hours use of maximum metered demand inexcess of 620 hours multiplied by the ratio of offpeak energy to total energy.
Transition Period 6.126 cents per kWh per month for the first 425 hours use of maximum metered demand, plus 4.249 cents per kWh per month for the next 195 hoursuse of maximum metered demand, plus 2.657 cents per kWh per monthfor the hours use of maximum metered demand in excess of 620 hours.
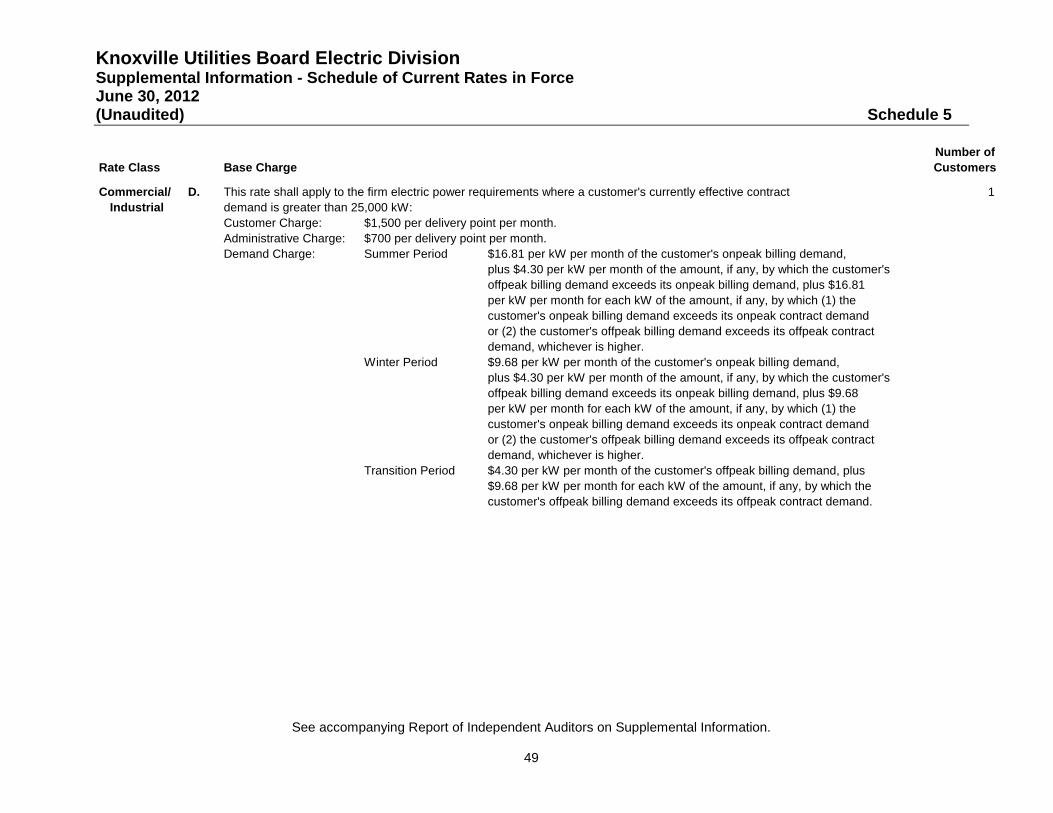
Knoxville Utilities Board Electric Division Supplemental Information - Schedule of Current Rates in Force June 30, 2012 (Unaudited) Schedule 5
See accompanying Report of Independent Auditors on Supplemental Information.
49
Number ofRate Class Base Charge Customers
Commercial/ D. This rate shall apply to the firm electric power requirements where a customer's currently effective contract 1 Industrial demand is greater than 25,000 kW:
Customer Charge: $1,500 per delivery point per month.Administrative Charge: $700 per delivery point per month.Demand Charge: Summer Period $16.81 per kW per month of the customer's onpeak billing demand,
plus $4.30 per kW per month of the amount, if any, by which the customer's offpeak billing demand exceeds its onpeak billing demand, plus $16.81per kW per month for each kW of the amount, if any, by which (1) the customer's onpeak billing demand exceeds its onpeak contract demand or (2) the customer's offpeak billing demand exceeds its offpeak contract demand, whichever is higher.
Winter Period $9.68 per kW per month of the customer's onpeak billing demand, plus $4.30 per kW per month of the amount, if any, by which the customer's offpeak billing demand exceeds its onpeak billing demand, plus $9.68per kW per month for each kW of the amount, if any, by which (1) the customer's onpeak billing demand exceeds its onpeak contract demand or (2) the customer's offpeak billing demand exceeds its offpeak contract demand, whichever is higher.
Transition Period $4.30 per kW per month of the customer's offpeak billing demand, plus$9.68 per kW per month for each kW of the amount, if any, by which thecustomer's offpeak billing demand exceeds its offpeak contract demand.

Knoxville Utilities Board Electric Division Supplemental Information - Schedule of Current Rates in Force June 30, 2012 (Unaudited) Schedule 5
See accompanying Report of Independent Auditors on Supplemental Information.
50
Energy Charge: Summer Period 9.400 cents per kWh per month for all metered onpeak kWh, plus 5.908cents per kWh per month for the first 425 hours of maximum metered demand multiplied by the ratio of offpeak energy to total energy, plus 4.033cents per kWh per month for the next 195 hours use of maximum metered demand multiplied by the ratio of offpeak energy to total energy, plus 2.440cents per kWh per month for the hours use of maximum metered demand inexcess of 620 hours multiplied by the ratio of offpeak energy to total energy.
Winter Period 6.307 cents per kWh per month for all metered onpeak kWh, plus 5.908cents per kWh per month for the first 425 hours of maximum metered demand multiplied by the ratio of offpeak energy to total energy, plus 4.033cents per kWh per month for the next 195 hours use of maximum metered demand multiplied by the ratio of offpeak energy to total energy, plus 2.440cents per kWh per month for the hours use of maximum metered demand inexcess of 620 hours multiplied by the ratio of offpeak energy to total energy.
Transition Period 5.908 cents per kWh per month for the first 425 hours use of maximum metered demand, plus 4.033 cents per kWh per month for the next 195 hoursuse of maximum metered demand, plus 2.440 cents per kWh per monthfor the hours use of maximum metered demand in excess of 620 hours.
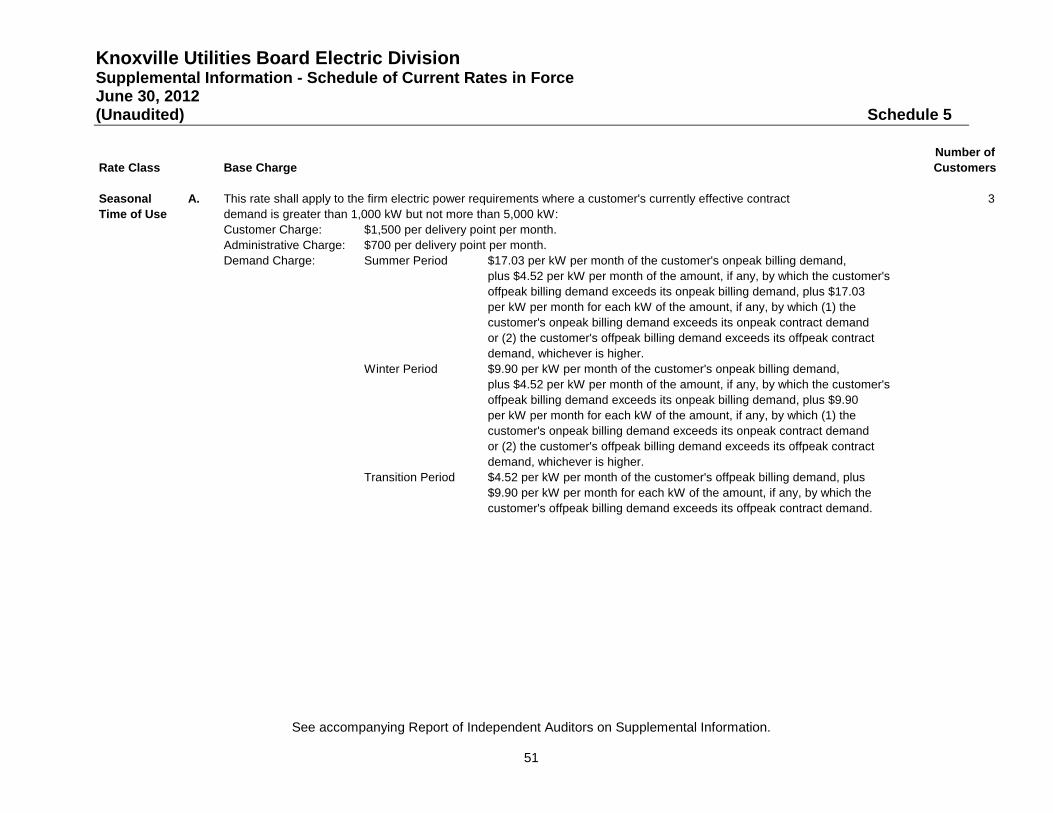
Knoxville Utilities Board Electric Division Supplemental Information - Schedule of Current Rates in Force June 30, 2012 (Unaudited) Schedule 5
See accompanying Report of Independent Auditors on Supplemental Information.
51
Number ofRate Class Base Charge Customers
Seasonal A. This rate shall apply to the firm electric power requirements where a customer's currently effective contract 3 Time of Use demand is greater than 1,000 kW but not more than 5,000 kW:
Customer Charge: $1,500 per delivery point per month.Administrative Charge: $700 per delivery point per month.Demand Charge: Summer Period $17.03 per kW per month of the customer's onpeak billing demand,
plus $4.52 per kW per month of the amount, if any, by which the customer's offpeak billing demand exceeds its onpeak billing demand, plus $17.03 per kW per month for each kW of the amount, if any, by which (1) the customer's onpeak billing demand exceeds its onpeak contract demand or (2) the customer's offpeak billing demand exceeds its offpeak contract demand, whichever is higher.
Winter Period $9.90 per kW per month of the customer's onpeak billing demand, plus $4.52 per kW per month of the amount, if any, by which the customer's offpeak billing demand exceeds its onpeak billing demand, plus $9.90per kW per month for each kW of the amount, if any, by which (1) the customer's onpeak billing demand exceeds its onpeak contract demand or (2) the customer's offpeak billing demand exceeds its offpeak contract demand, whichever is higher.
Transition Period $4.52 per kW per month of the customer's offpeak billing demand, plus$9.90 per kW per month for each kW of the amount, if any, by which thecustomer's offpeak billing demand exceeds its offpeak contract demand.
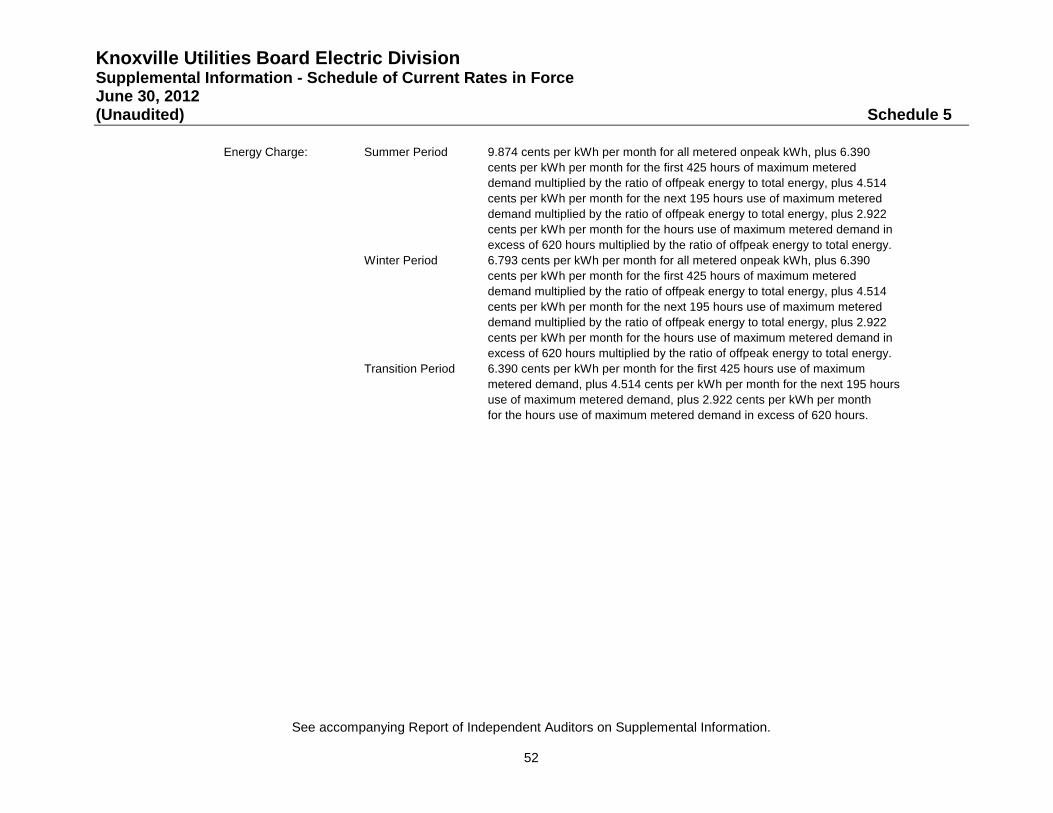
Knoxville Utilities Board Electric Division Supplemental Information - Schedule of Current Rates in Force June 30, 2012 (Unaudited) Schedule 5
See accompanying Report of Independent Auditors on Supplemental Information.
52
Energy Charge: Summer Period 9.874 cents per kWh per month for all metered onpeak kWh, plus 6.390cents per kWh per month for the first 425 hours of maximum metered demand multiplied by the ratio of offpeak energy to total energy, plus 4.514cents per kWh per month for the next 195 hours use of maximum metered demand multiplied by the ratio of offpeak energy to total energy, plus 2.922 cents per kWh per month for the hours use of maximum metered demand inexcess of 620 hours multiplied by the ratio of offpeak energy to total energy.
Winter Period 6.793 cents per kWh per month for all metered onpeak kWh, plus 6.390 cents per kWh per month for the first 425 hours of maximum metered demand multiplied by the ratio of offpeak energy to total energy, plus 4.514cents per kWh per month for the next 195 hours use of maximum metered demand multiplied by the ratio of offpeak energy to total energy, plus 2.922 cents per kWh per month for the hours use of maximum metered demand inexcess of 620 hours multiplied by the ratio of offpeak energy to total energy.
Transition Period 6.390 cents per kWh per month for the first 425 hours use of maximum metered demand, plus 4.514 cents per kWh per month for the next 195 hoursuse of maximum metered demand, plus 2.922 cents per kWh per monthfor the hours use of maximum metered demand in excess of 620 hours.
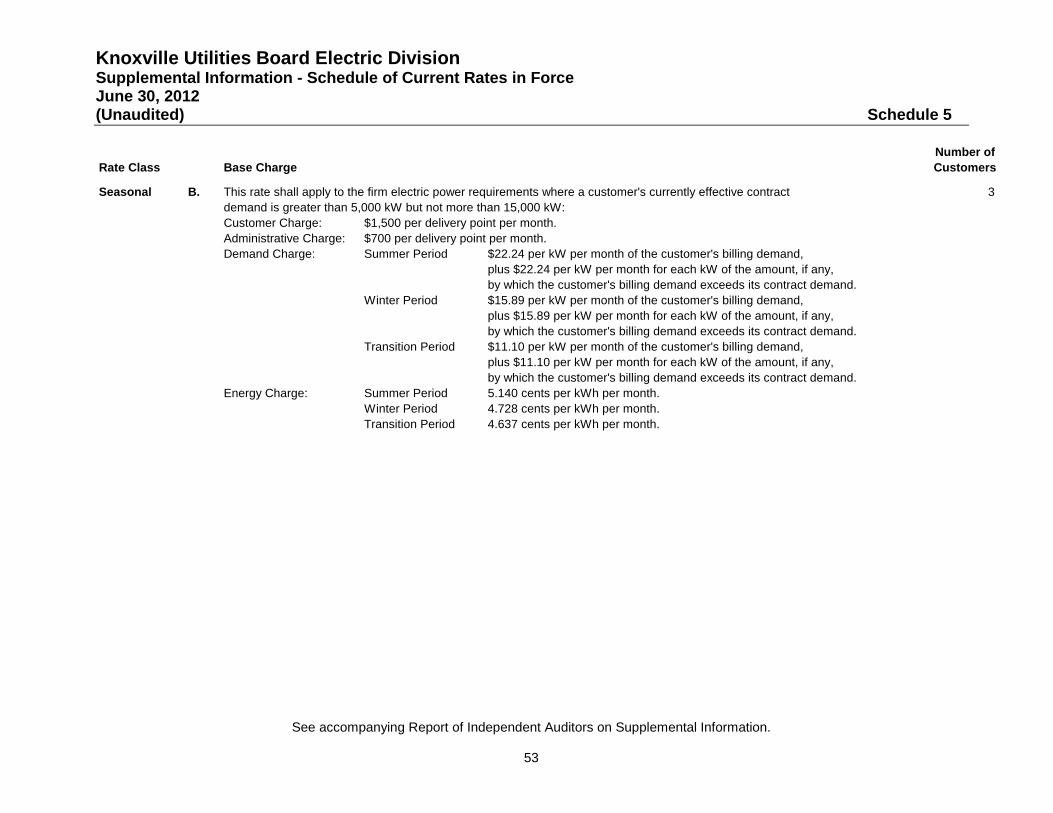
Knoxville Utilities Board Electric Division Supplemental Information - Schedule of Current Rates in Force June 30, 2012 (Unaudited) Schedule 5
See accompanying Report of Independent Auditors on Supplemental Information.
53
Number ofRate Class Base Charge Customers
Seasonal B. This rate shall apply to the firm electric power requirements where a customer's currently effective contract 3 demand is greater than 5,000 kW but not more than 15,000 kW:Customer Charge: $1,500 per delivery point per month.Administrative Charge: $700 per delivery point per month.Demand Charge: Summer Period $22.24 per kW per month of the customer's billing demand,
plus $22.24 per kW per month for each kW of the amount, if any,by which the customer's billing demand exceeds its contract demand.
Winter Period $15.89 per kW per month of the customer's billing demand, plus $15.89 per kW per month for each kW of the amount, if any,by which the customer's billing demand exceeds its contract demand.
Transition Period $11.10 per kW per month of the customer's billing demand, plus $11.10 per kW per month for each kW of the amount, if any,by which the customer's billing demand exceeds its contract demand.
Energy Charge: Summer Period 5.140 cents per kWh per month.Winter Period 4.728 cents per kWh per month.Transition Period 4.637 cents per kWh per month.
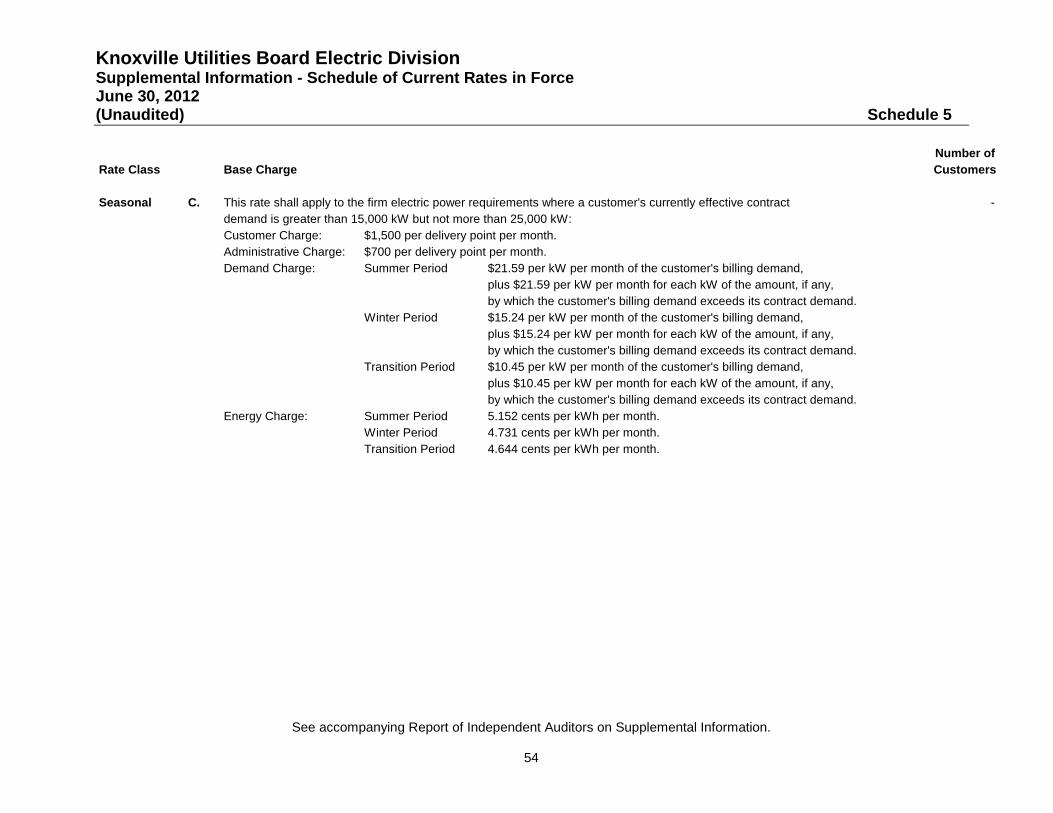
Knoxville Utilities Board Electric Division Supplemental Information - Schedule of Current Rates in Force June 30, 2012 (Unaudited) Schedule 5
See accompanying Report of Independent Auditors on Supplemental Information.
54
Number ofRate Class Base Charge Customers
Seasonal C. This rate shall apply to the firm electric power requirements where a customer's currently effective contract - demand is greater than 15,000 kW but not more than 25,000 kW:Customer Charge: $1,500 per delivery point per month.Administrative Charge: $700 per delivery point per month.Demand Charge: Summer Period $21.59 per kW per month of the customer's billing demand,
plus $21.59 per kW per month for each kW of the amount, if any,by which the customer's billing demand exceeds its contract demand.
Winter Period $15.24 per kW per month of the customer's billing demand, plus $15.24 per kW per month for each kW of the amount, if any,by which the customer's billing demand exceeds its contract demand.
Transition Period $10.45 per kW per month of the customer's billing demand, plus $10.45 per kW per month for each kW of the amount, if any,by which the customer's billing demand exceeds its contract demand.
Energy Charge: Summer Period 5.152 cents per kWh per month.Winter Period 4.731 cents per kWh per month.Transition Period 4.644 cents per kWh per month.
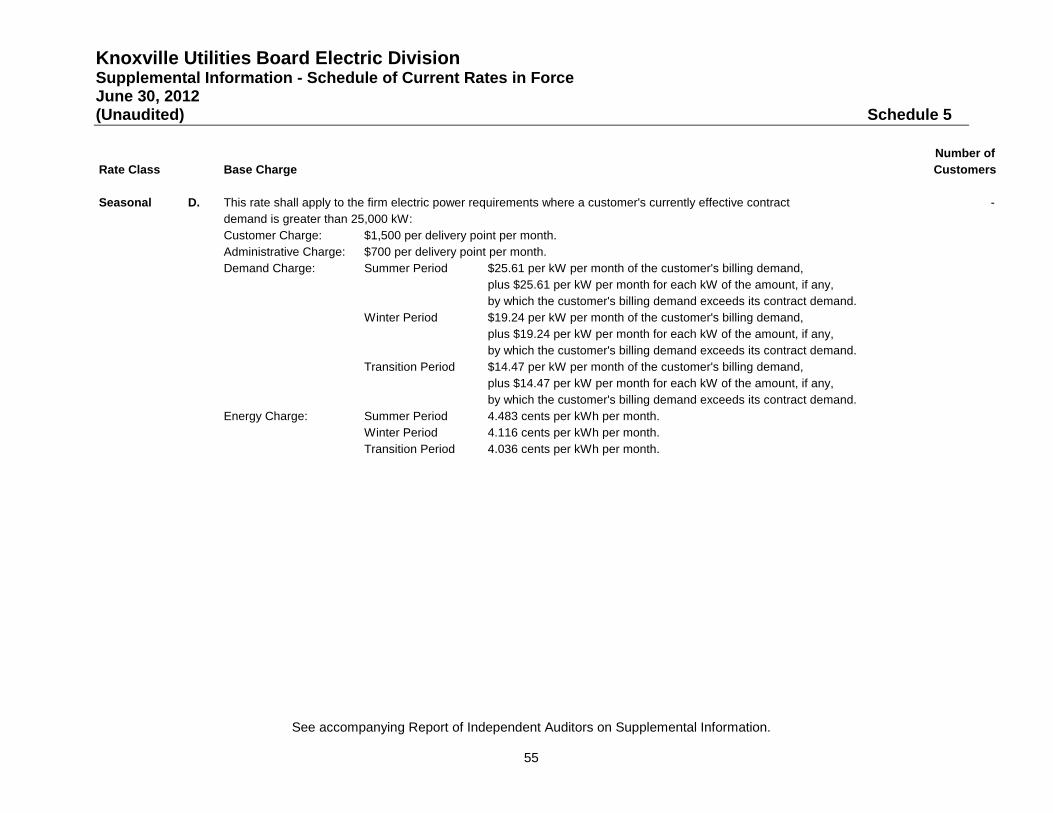
Knoxville Utilities Board Electric Division Supplemental Information - Schedule of Current Rates in Force June 30, 2012 (Unaudited) Schedule 5
See accompanying Report of Independent Auditors on Supplemental Information.
55
Number ofRate Class Base Charge Customers
Seasonal D. This rate shall apply to the firm electric power requirements where a customer's currently effective contract - demand is greater than 25,000 kW:Customer Charge: $1,500 per delivery point per month.Administrative Charge: $700 per delivery point per month.Demand Charge: Summer Period $25.61 per kW per month of the customer's billing demand,
plus $25.61 per kW per month for each kW of the amount, if any,by which the customer's billing demand exceeds its contract demand.
Winter Period $19.24 per kW per month of the customer's billing demand, plus $19.24 per kW per month for each kW of the amount, if any,by which the customer's billing demand exceeds its contract demand.
Transition Period $14.47 per kW per month of the customer's billing demand, plus $14.47 per kW per month for each kW of the amount, if any,by which the customer's billing demand exceeds its contract demand.
Energy Charge: Summer Period 4.483 cents per kWh per month.Winter Period 4.116 cents per kWh per month.Transition Period 4.036 cents per kWh per month.

Knoxville Utilities Board Electric Division Supplemental Information - Schedule of Current Rates in Force June 30, 2012 (Unaudited) Schedule 5
See accompanying Report of Independent Auditors on Supplemental Information.
56
Number ofRate Class Base Charge Customers
Manufacturing B. This rate shall apply to the firm electric power requirements where (a) a customer's currently effective contract - demand is greater than 5,000 kW but not more than 15,000 kW and (b) the major use of electricity is for activities conducted at the delivery point serving that customer which are classified with a 2-digit Standard IndustrialClassification Code between 20 and 39, inclusive. Customer Charge: $1,500 per delivery point per month.Administrative Charge: $700 per delivery point per month.Demand Charge: Summer Period $17.03 per kW per month of the customer's onpeak billing demand,
plus $4.52 per kW per month of the amount, if any, by which the customer's offpeak billing demand exceeds its onpeak billing demand, plus $17.03per kW per month for each kW of the amount, if any, by which (1) the customer's onpeak billing demand exceeds its onpeak contract demand or (2) the customer's offpeak billing demand exceeds its offpeak contract demand, whichever is higher.
Winter Period $9.90 per kW per month of the customer's onpeak billing demand, plus $4.52 per kW per month of the amount, if any, by which the customer's offpeak billing demand exceeds its onpeak billing demand, plus $9.90per kW per month for each kW of the amount, if any, by which (1) the customer's onpeak billing demand exceeds its onpeak contract demand or (2) the customer's offpeak billing demand exceeds its offpeak contract demand, whichever is higher.
Transition Period $4.52 per kW per month of the customer's offpeak billing demand, plus$9.90 per kW per month for each kW of the amount, if any, by which thecustomer's offpeak billing demand exceeds its offpeak contract demand.

Knoxville Utilities Board Electric Division Supplemental Information - Schedule of Current Rates in Force June 30, 2012 (Unaudited) Schedule 5
See accompanying Report of Independent Auditors on Supplemental Information.
57
Energy Charge: Summer Period 8.349 cents per kWh per month for all metered onpeak kWh, plus 4.902cents per kWh per month for the first 425 hours of maximum metered demand multiplied by the ratio of offpeak energy to total energy, plus 3.027cents per kWh per month for the next 195 hours use of maximum metered demand multiplied by the ratio of offpeak energy to total energy, plus 1.436cents per kWh per month for the hours use of maximum metered demand inexcess of 620 hours multiplied by the ratio of offpeak energy to total energy.
Winter Period 5.331 cents per kWh per month for all metered onpeak kWh, plus 4.902cents per kWh per month for the first 425 hours of maximum metered demand multiplied by the ratio of offpeak energy to total energy, plus 3.027cents per kWh per month for the next 195 hours use of maximum metered demand multiplied by the ratio of offpeak energy to total energy, plus 1.436cents per kWh per month for the hours use of maximum metered demand inexcess of 620 hours multiplied by the ratio of offpeak energy to total energy.
Transition Period 4.902 cents per kWh per month for the first 425 hours use of maximum metered demand, plus 3.027 cents per kWh per month for the next 195 hoursuse of maximum metered demand, plus 1.436 cents per kWh per monthfor the hours use of maximum metered demand in excess of 620 hours.
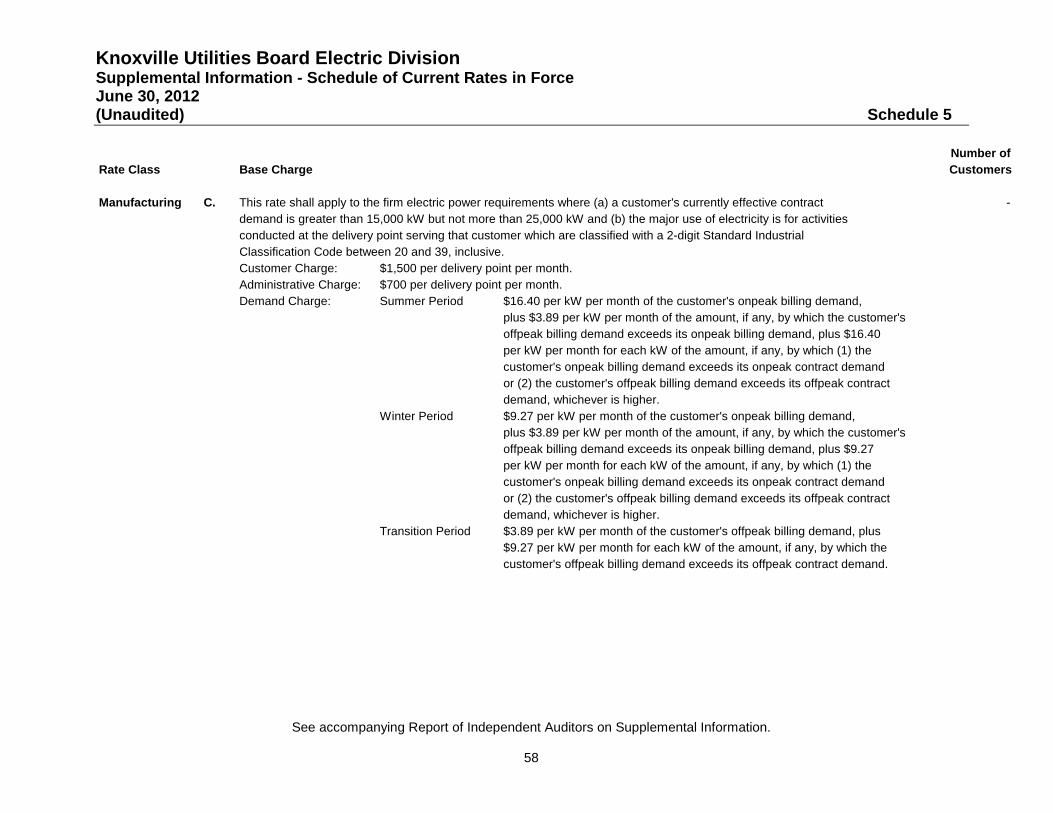
Knoxville Utilities Board Electric Division Supplemental Information - Schedule of Current Rates in Force June 30, 2012 (Unaudited) Schedule 5
See accompanying Report of Independent Auditors on Supplemental Information.
58
Number ofRate Class Base Charge Customers
Manufacturing C. This rate shall apply to the firm electric power requirements where (a) a customer's currently effective contract - demand is greater than 15,000 kW but not more than 25,000 kW and (b) the major use of electricity is for activities conducted at the delivery point serving that customer which are classified with a 2-digit Standard IndustrialClassification Code between 20 and 39, inclusive. Customer Charge: $1,500 per delivery point per month.Administrative Charge: $700 per delivery point per month.Demand Charge: Summer Period $16.40 per kW per month of the customer's onpeak billing demand,
plus $3.89 per kW per month of the amount, if any, by which the customer's offpeak billing demand exceeds its onpeak billing demand, plus $16.40per kW per month for each kW of the amount, if any, by which (1) the customer's onpeak billing demand exceeds its onpeak contract demand or (2) the customer's offpeak billing demand exceeds its offpeak contract demand, whichever is higher.
Winter Period $9.27 per kW per month of the customer's onpeak billing demand, plus $3.89 per kW per month of the amount, if any, by which the customer's offpeak billing demand exceeds its onpeak billing demand, plus $9.27per kW per month for each kW of the amount, if any, by which (1) the customer's onpeak billing demand exceeds its onpeak contract demand or (2) the customer's offpeak billing demand exceeds its offpeak contract demand, whichever is higher.
Transition Period $3.89 per kW per month of the customer's offpeak billing demand, plus$9.27 per kW per month for each kW of the amount, if any, by which thecustomer's offpeak billing demand exceeds its offpeak contract demand.
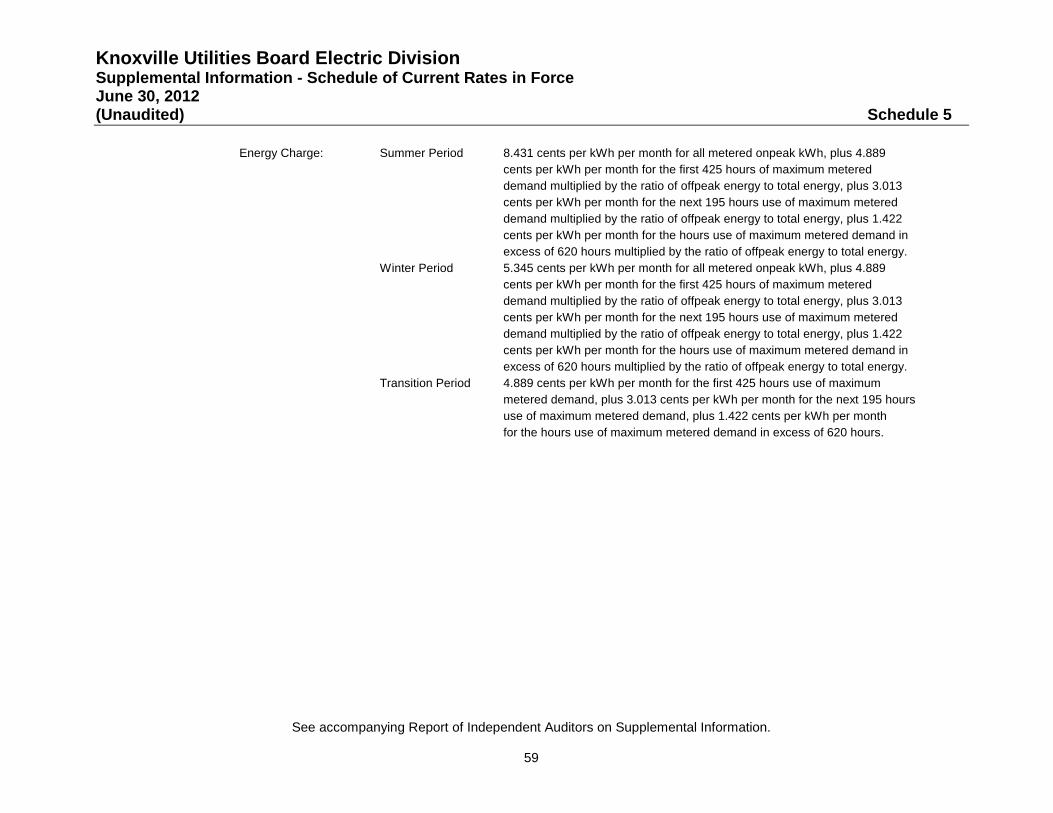
Knoxville Utilities Board Electric Division Supplemental Information - Schedule of Current Rates in Force June 30, 2012 (Unaudited) Schedule 5
See accompanying Report of Independent Auditors on Supplemental Information.
59
Energy Charge: Summer Period 8.431 cents per kWh per month for all metered onpeak kWh, plus 4.889cents per kWh per month for the first 425 hours of maximum metered demand multiplied by the ratio of offpeak energy to total energy, plus 3.013cents per kWh per month for the next 195 hours use of maximum metered demand multiplied by the ratio of offpeak energy to total energy, plus 1.422cents per kWh per month for the hours use of maximum metered demand inexcess of 620 hours multiplied by the ratio of offpeak energy to total energy.
Winter Period 5.345 cents per kWh per month for all metered onpeak kWh, plus 4.889cents per kWh per month for the first 425 hours of maximum metered demand multiplied by the ratio of offpeak energy to total energy, plus 3.013cents per kWh per month for the next 195 hours use of maximum metered demand multiplied by the ratio of offpeak energy to total energy, plus 1.422cents per kWh per month for the hours use of maximum metered demand inexcess of 620 hours multiplied by the ratio of offpeak energy to total energy.
Transition Period 4.889 cents per kWh per month for the first 425 hours use of maximum metered demand, plus 3.013 cents per kWh per month for the next 195 hoursuse of maximum metered demand, plus 1.422 cents per kWh per monthfor the hours use of maximum metered demand in excess of 620 hours.
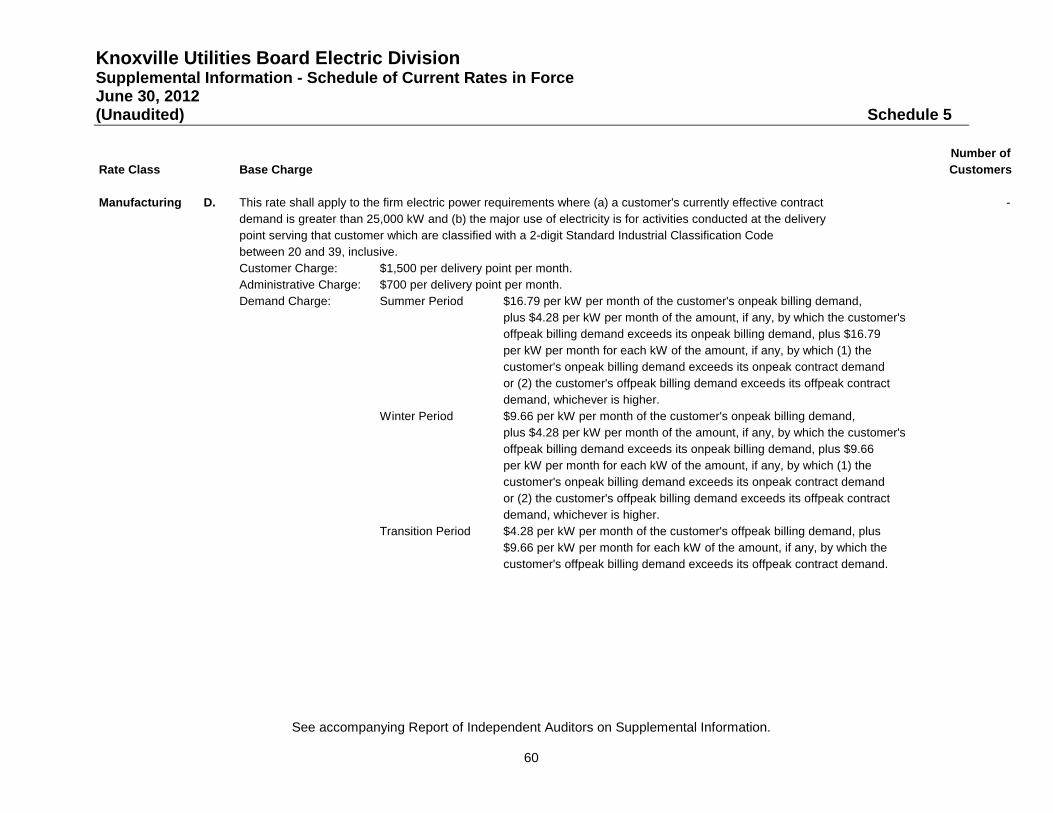
Knoxville Utilities Board Electric Division Supplemental Information - Schedule of Current Rates in Force June 30, 2012 (Unaudited) Schedule 5
See accompanying Report of Independent Auditors on Supplemental Information.
60
Number ofRate Class Base Charge Customers
Manufacturing D. This rate shall apply to the firm electric power requirements where (a) a customer's currently effective contract - demand is greater than 25,000 kW and (b) the major use of electricity is for activities conducted at the deliverypoint serving that customer which are classified with a 2-digit Standard Industrial Classification Code between 20 and 39, inclusive.Customer Charge: $1,500 per delivery point per month.Administrative Charge: $700 per delivery point per month.Demand Charge: Summer Period $16.79 per kW per month of the customer's onpeak billing demand,
plus $4.28 per kW per month of the amount, if any, by which the customer's offpeak billing demand exceeds its onpeak billing demand, plus $16.79per kW per month for each kW of the amount, if any, by which (1) the customer's onpeak billing demand exceeds its onpeak contract demand or (2) the customer's offpeak billing demand exceeds its offpeak contract demand, whichever is higher.
Winter Period $9.66 per kW per month of the customer's onpeak billing demand, plus $4.28 per kW per month of the amount, if any, by which the customer's offpeak billing demand exceeds its onpeak billing demand, plus $9.66per kW per month for each kW of the amount, if any, by which (1) the customer's onpeak billing demand exceeds its onpeak contract demand or (2) the customer's offpeak billing demand exceeds its offpeak contract demand, whichever is higher.
Transition Period $4.28 per kW per month of the customer's offpeak billing demand, plus$9.66 per kW per month for each kW of the amount, if any, by which thecustomer's offpeak billing demand exceeds its offpeak contract demand.
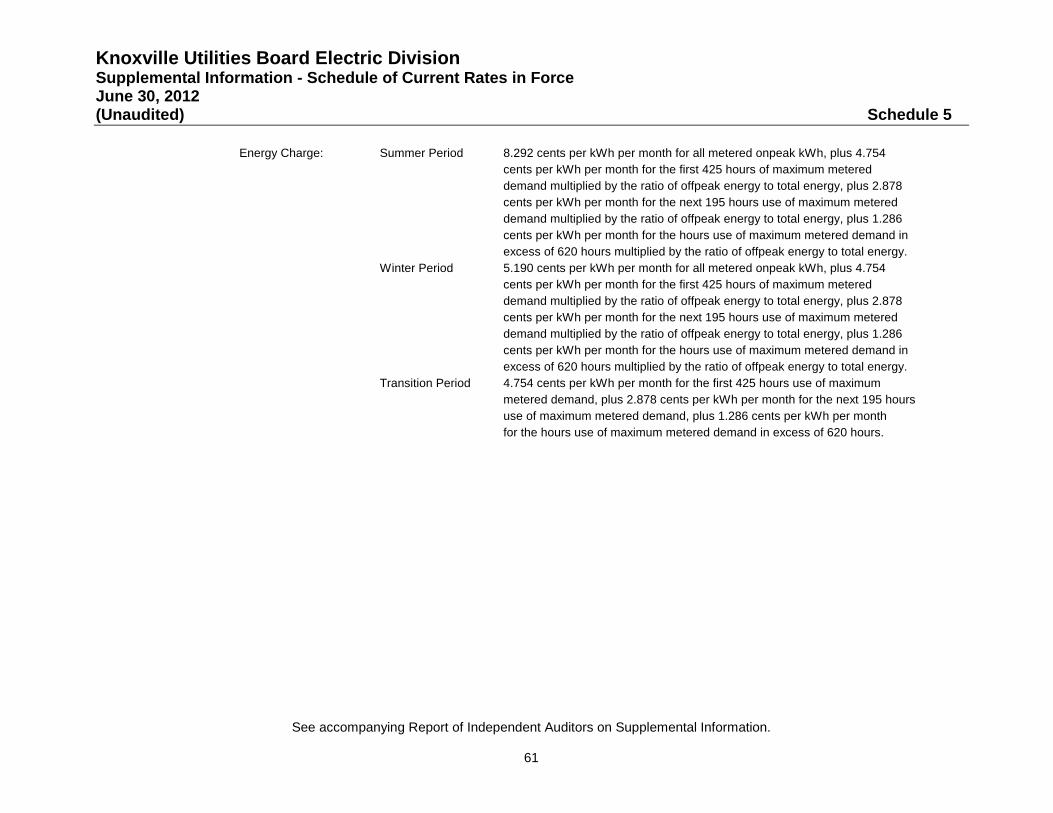
Knoxville Utilities Board Electric Division Supplemental Information - Schedule of Current Rates in Force June 30, 2012 (Unaudited) Schedule 5
See accompanying Report of Independent Auditors on Supplemental Information.
61
Energy Charge: Summer Period 8.292 cents per kWh per month for all metered onpeak kWh, plus 4.754cents per kWh per month for the first 425 hours of maximum metered demand multiplied by the ratio of offpeak energy to total energy, plus 2.878cents per kWh per month for the next 195 hours use of maximum metered demand multiplied by the ratio of offpeak energy to total energy, plus 1.286cents per kWh per month for the hours use of maximum metered demand inexcess of 620 hours multiplied by the ratio of offpeak energy to total energy.
Winter Period 5.190 cents per kWh per month for all metered onpeak kWh, plus 4.754cents per kWh per month for the first 425 hours of maximum metered demand multiplied by the ratio of offpeak energy to total energy, plus 2.878cents per kWh per month for the next 195 hours use of maximum metered demand multiplied by the ratio of offpeak energy to total energy, plus 1.286cents per kWh per month for the hours use of maximum metered demand inexcess of 620 hours multiplied by the ratio of offpeak energy to total energy.
Transition Period 4.754 cents per kWh per month for the first 425 hours use of maximum metered demand, plus 2.878 cents per kWh per month for the next 195 hoursuse of maximum metered demand, plus 1.286 cents per kWh per monthfor the hours use of maximum metered demand in excess of 620 hours.
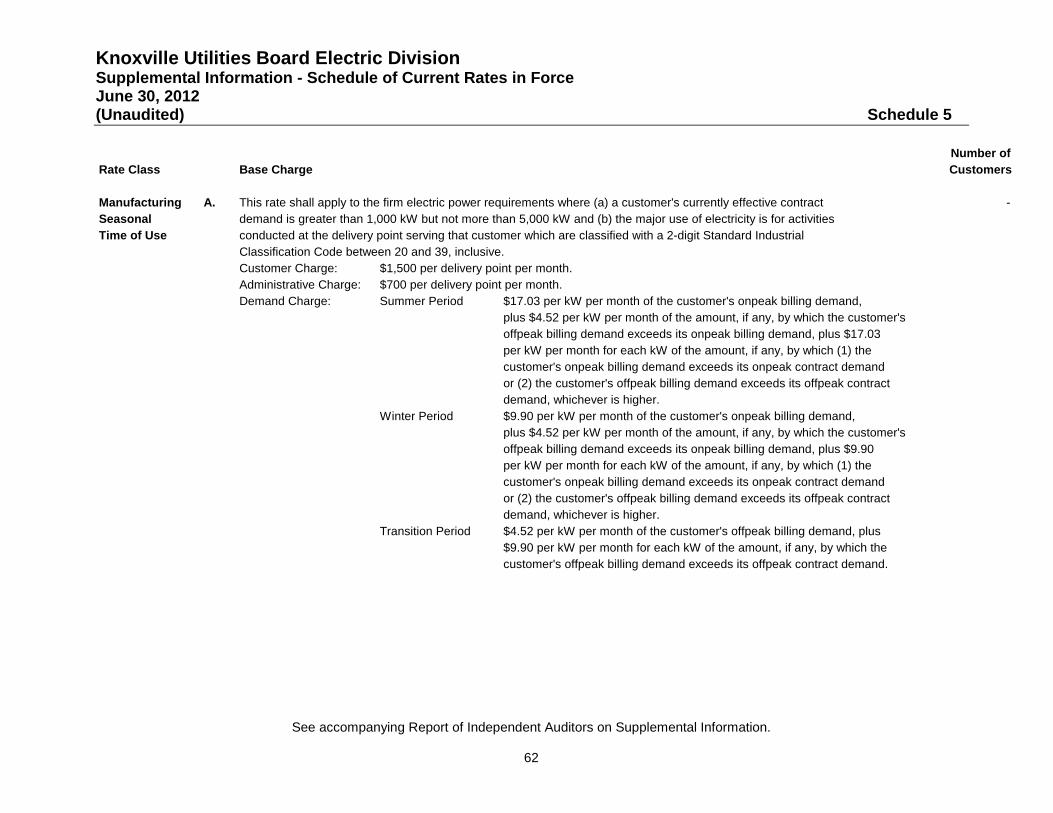
Knoxville Utilities Board Electric Division Supplemental Information - Schedule of Current Rates in Force June 30, 2012 (Unaudited) Schedule 5
See accompanying Report of Independent Auditors on Supplemental Information.
62
Number ofRate Class Base Charge Customers
Manufacturing A. This rate shall apply to the firm electric power requirements where (a) a customer's currently effective contract - Seasonal demand is greater than 1,000 kW but not more than 5,000 kW and (b) the major use of electricity is for activities Time of Use conducted at the delivery point serving that customer which are classified with a 2-digit Standard Industrial
Classification Code between 20 and 39, inclusive. Customer Charge: $1,500 per delivery point per month.Administrative Charge: $700 per delivery point per month.Demand Charge: Summer Period $17.03 per kW per month of the customer's onpeak billing demand,
plus $4.52 per kW per month of the amount, if any, by which the customer's offpeak billing demand exceeds its onpeak billing demand, plus $17.03per kW per month for each kW of the amount, if any, by which (1) the customer's onpeak billing demand exceeds its onpeak contract demand or (2) the customer's offpeak billing demand exceeds its offpeak contract demand, whichever is higher.
Winter Period $9.90 per kW per month of the customer's onpeak billing demand, plus $4.52 per kW per month of the amount, if any, by which the customer's offpeak billing demand exceeds its onpeak billing demand, plus $9.90per kW per month for each kW of the amount, if any, by which (1) the customer's onpeak billing demand exceeds its onpeak contract demand or (2) the customer's offpeak billing demand exceeds its offpeak contract demand, whichever is higher.
Transition Period $4.52 per kW per month of the customer's offpeak billing demand, plus$9.90 per kW per month for each kW of the amount, if any, by which thecustomer's offpeak billing demand exceeds its offpeak contract demand.

Knoxville Utilities Board Electric Division Supplemental Information - Schedule of Current Rates in Force June 30, 2012 (Unaudited) Schedule 5
See accompanying Report of Independent Auditors on Supplemental Information.
63
Energy Charge: Summer Period 8.349 cents per kWh per month for all metered onpeak kWh, plus 4.902cents per kWh per month for the first 425 hours of maximum metered demand multiplied by the ratio of offpeak energy to total energy, plus 3.027cents per kWh per month for the next 195 hours use of maximum metered demand multiplied by the ratio of offpeak energy to total energy, plus 1.436cents per kWh per month for the hours use of maximum metered demand inexcess of 620 hours multiplied by the ratio of offpeak energy to total energy.
Winter Period 5.331 cents per kWh per month for all metered onpeak kWh, plus 4.902cents per kWh per month for the first 425 hours of maximum metered demand multiplied by the ratio of offpeak energy to total energy, plus 3.027cents per kWh per month for the next 195 hours use of maximum metered demand multiplied by the ratio of offpeak energy to total energy, plus 1.436cents per kWh per month for the hours use of maximum metered demand inexcess of 620 hours multiplied by the ratio of offpeak energy to total energy.
Transition Period 4.902 cents per kWh per month for the first 425 hours use of maximum metered demand, plus 3.027 cents per kWh per month for the next 195 hoursuse of maximum metered demand, plus 1.436 cents per kWh per monthfor the hours use of maximum metered demand in excess of 620 hours.
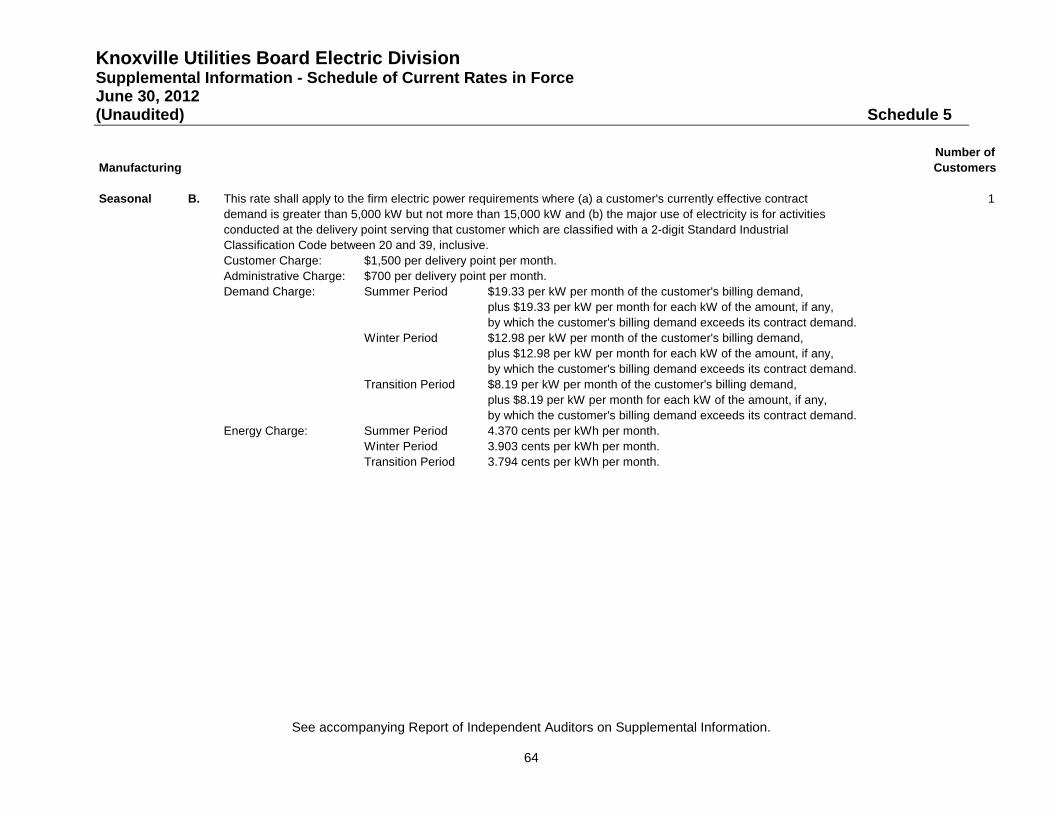
Knoxville Utilities Board Electric Division Supplemental Information - Schedule of Current Rates in Force June 30, 2012 (Unaudited) Schedule 5
See accompanying Report of Independent Auditors on Supplemental Information.
64
Number ofManufacturing Customers
Seasonal B. This rate shall apply to the firm electric power requirements where (a) a customer's currently effective contract 1 demand is greater than 5,000 kW but not more than 15,000 kW and (b) the major use of electricity is for activities conducted at the delivery point serving that customer which are classified with a 2-digit Standard IndustrialClassification Code between 20 and 39, inclusive. Customer Charge: $1,500 per delivery point per month.Administrative Charge: $700 per delivery point per month.Demand Charge: Summer Period $19.33 per kW per month of the customer's billing demand,
plus $19.33 per kW per month for each kW of the amount, if any,by which the customer's billing demand exceeds its contract demand.
Winter Period $12.98 per kW per month of the customer's billing demand, plus $12.98 per kW per month for each kW of the amount, if any,by which the customer's billing demand exceeds its contract demand.
Transition Period $8.19 per kW per month of the customer's billing demand, plus $8.19 per kW per month for each kW of the amount, if any,by which the customer's billing demand exceeds its contract demand.
Energy Charge: Summer Period 4.370 cents per kWh per month.Winter Period 3.903 cents per kWh per month.Transition Period 3.794 cents per kWh per month.
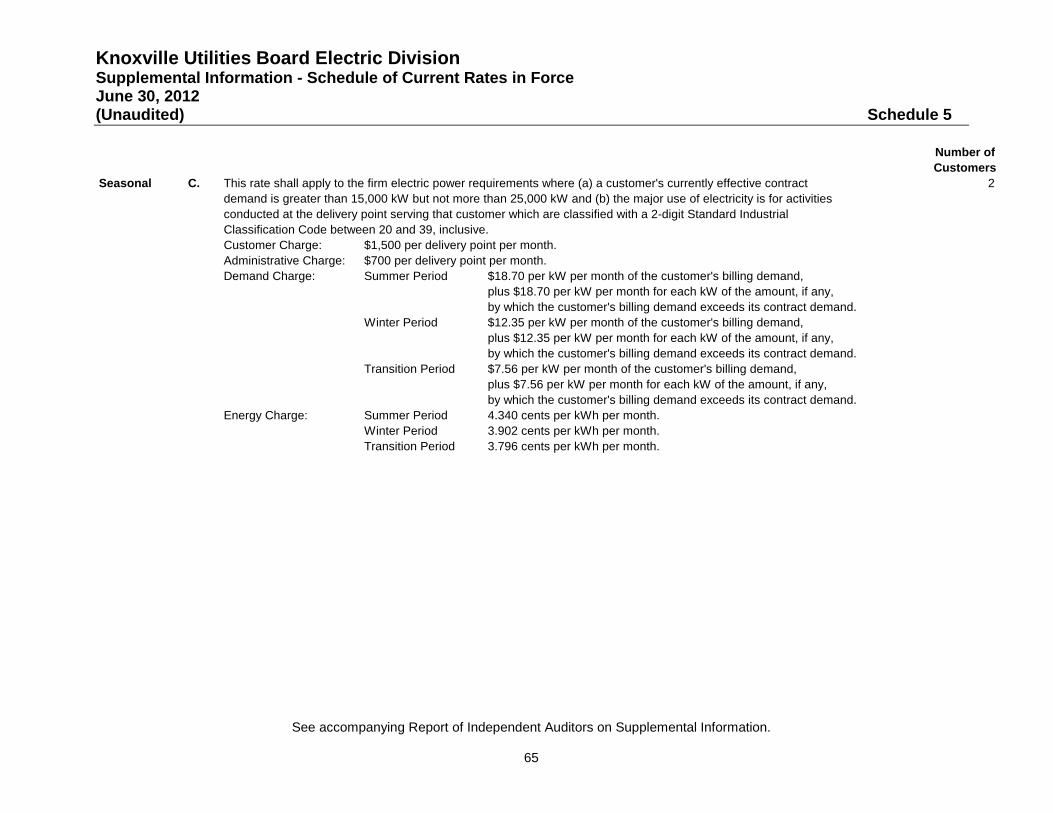
Knoxville Utilities Board Electric Division Supplemental Information - Schedule of Current Rates in Force June 30, 2012 (Unaudited) Schedule 5
See accompanying Report of Independent Auditors on Supplemental Information.
65
Number ofCustomers
Seasonal C. This rate shall apply to the firm electric power requirements where (a) a customer's currently effective contract 2 demand is greater than 15,000 kW but not more than 25,000 kW and (b) the major use of electricity is for activitiesconducted at the delivery point serving that customer which are classified with a 2-digit Standard IndustrialClassification Code between 20 and 39, inclusive. Customer Charge: $1,500 per delivery point per month.Administrative Charge: $700 per delivery point per month.Demand Charge: Summer Period $18.70 per kW per month of the customer's billing demand,
plus $18.70 per kW per month for each kW of the amount, if any,by which the customer's billing demand exceeds its contract demand.
Winter Period $12.35 per kW per month of the customer's billing demand, plus $12.35 per kW per month for each kW of the amount, if any,by which the customer's billing demand exceeds its contract demand.
Transition Period $7.56 per kW per month of the customer's billing demand, plus $7.56 per kW per month for each kW of the amount, if any,by which the customer's billing demand exceeds its contract demand.
Energy Charge: Summer Period 4.340 cents per kWh per month.Winter Period 3.902 cents per kWh per month.Transition Period 3.796 cents per kWh per month.

Knoxville Utilities Board Electric Division Supplemental Information - Schedule of Current Rates in Force June 30, 2012 (Unaudited) Schedule 5
See accompanying Report of Independent Auditors on Supplemental Information.
66
Number ofManufacturing Customers
Seasonal D. This rate shall apply to the firm electric power requirements where (a) a customer's currently effective contract 1 demand is greater than 25,000 kW; and (b) the major use of electricity is for activities conducted at the deliverypoint serving that customer which are classified with a 2-digit Standard Industrial Classification Code between 20 and 39, inclusive. Customer Charge: $1,500 per delivery point per month.Administrative Charge: $700 per delivery point per month.Demand Charge: Summer Period $22.00 per kW per month of the customer's billing demand,
plus $22.00 per kW per month for each kW of the amount, if any,by which the customer's billing demand exceeds its contract demand.
Winter Period $15.65 per kW per month of the customer's billing demand, plus $15.65 per kW per month for each kW of the amount, if any,by which the customer's billing demand exceeds its contract demand.
Transition Period $10.86 per kW per month of the customer's billing demand, plus $10.86 per kW per month for each kW of the amount, if any,by which the customer's billing demand exceeds its contract demand.
Energy Charge: Summer Period 3.652 cents per kWh per month.Winter Period 3.302 cents per kWh per month.Transition Period 3.219 cents per kWh per month.
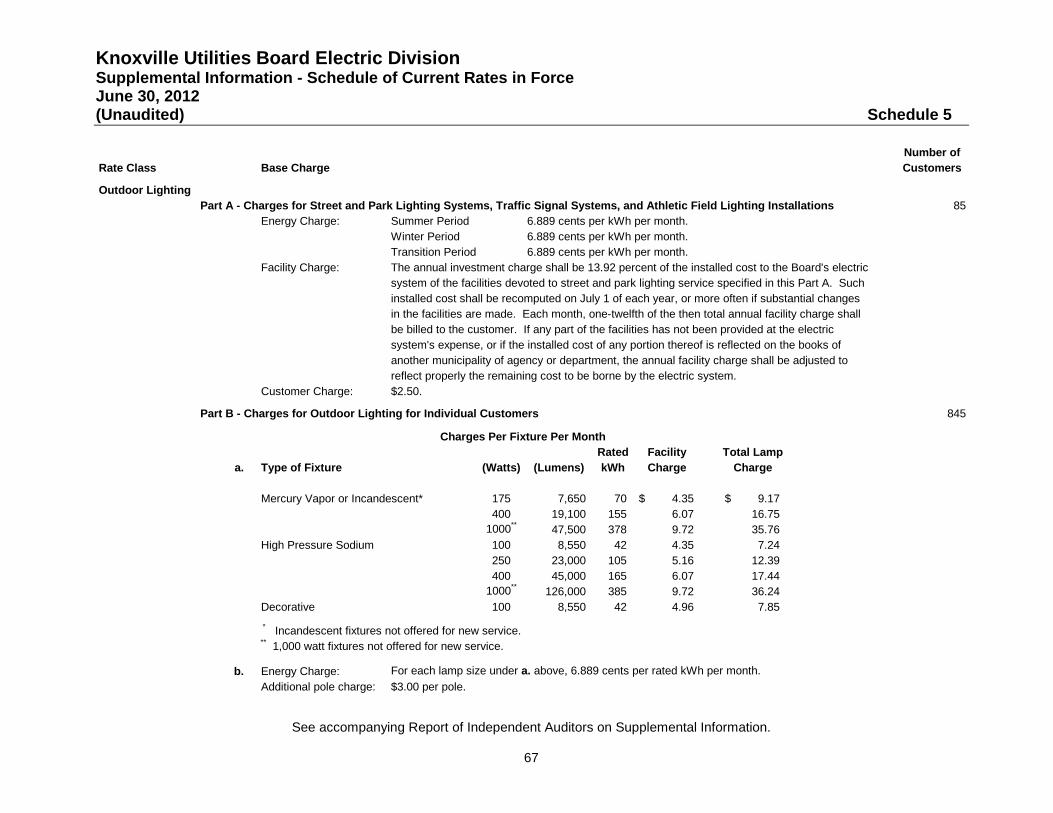
Knoxville Utilities Board Electric Division Supplemental Information - Schedule of Current Rates in Force June 30, 2012 (Unaudited) Schedule 5
See accompanying Report of Independent Auditors on Supplemental Information.
67
Number ofRate Class Base Charge Customers
Outdoor LightingPart A - Charges for Street and Park Lighting Systems, Traffic Signal Systems, and Athletic Field Lighting Installations 85
Energy Charge: Summer Period 6.889 cents per kWh per month.Winter Period 6.889 cents per kWh per month.Transition Period 6.889 cents per kWh per month.
Facility Charge: The annual investment charge shall be 13.92 percent of the installed cost to the Board's electric system of the facilities devoted to street and park lighting service specified in this Part A. Suchinstalled cost shall be recomputed on July 1 of each year, or more often if substantial changesin the facilities are made. Each month, one-twelfth of the then total annual facility charge shallbe billed to the customer. If any part of the facilities has not been provided at the electric system's expense, or if the installed cost of any portion thereof is reflected on the books of another municipality of agency or department, the annual facility charge shall be adjusted to reflect properly the remaining cost to be borne by the electric system.
Customer Charge: $2.50.
Part B - Charges for Outdoor Lighting for Individual Customers 845
Rated Facility Total Lampa. Type of Fixture (Watts) (Lumens) kWh Charge Charge
Mercury Vapor or Incandescent* 175 7,650 70 4.35$ 9.17$ 400 19,100 155 6.07 16.75
1000** 47,500 378 9.72 35.76 High Pressure Sodium 100 8,550 42 4.35 7.24
250 23,000 105 5.16 12.39 400 45,000 165 6.07 17.44
1000** 126,000 385 9.72 36.24 Decorative 100 8,550 42 4.96 7.85 * Incandescent fixtures not offered for new service.** 1,000 watt fixtures not offered for new service.
b. Energy Charge: For each lamp size under a. above, 6.889 cents per rated kWh per month.Additional pole charge: $3.00 per pole.
Charges Per Fixture Per Month


Knoxville Utilities Board Gas Division Financial Statements and Supplemental Information June 30, 2012 and 2011
Knoxville Utilities Board Gas Division Index June 30, 2012 and 2011
Page(s)
Independent Auditors’ Report ...............................................................................................1-2
Management’s Discussion and Analysis ................................................................................ 3-17
Basic Financial Statements
Statements of Net Assets ..................................................................................................... 18-19
Statements of Revenues, Expenses and Changes in Net Assets .............................................. 20
Statements of Cash Flows ........................................................................................................ 21
Notes to Financial Statements ............................................................................................. 22-35
Required Supplementary Information – Schedule of Funding Progress .................................... 36
Supplemental Information
Schedule 1 – Schedule of Insurance in Force ........................................................................... 37
Schedule 2 – Schedule of Debt Maturities by Fiscal Year .................................................... 38-39
Schedule 3 – Schedule of Current Rates in Force ................................................................ 40-44
Report of Independent Auditors on Internal Control over Financial Reporting and on Compliance and Other Matters Based on an Audit of Financial Statements Performed in Accordance with Government Auditing Standards .............................................................. 45
Knoxville Utilities Board Gas Division Management’s Discussion and Analysis June 30, 2012 and 2011
3
Knoxville Utilities Board (KUB), comprised of Electric Division, Water Division, Gas Division, and Wastewater Division (Divisions), is reported as a component unit enterprise fund in the financial statements of the City of Knoxville. KUB's responsibility is to oversee the purchase, production, distribution, and processing of electricity, water, natural gas, and wastewater services. A seven-member Board of Commissioners oversees KUB. The Board has all powers to construct, acquire, expand, or operate the Divisions. It has full control and complete jurisdiction over the management and operation of the Divisions. The Gas Division (Division) provides services to certain customers in Knox County. The Division's accounts are maintained in conformity with the Uniform System of Accounts of the Federal Energy Regulatory Commission and the Governmental Accounting Standards Board, as applicable. The financial statements present only the Gas Division and do not purport to, and do not, present fairly the consolidated financial position of Knoxville Utilities Board at June 30, 2012 and 2011, and the changes in its financial position for the years then ended in conformity with accounting principles generally accepted in the United States of America.
The Division’s discussion and analysis is designed to (a) assist the reader in focusing on significant financial issues, (b) provide an overview of the Division’s financial activity, (c) identify major changes in the Division’s financial position, and (d) identify any financial concerns.
The Division’s Management Discussion and Analysis (“MD&A”) focuses on the fiscal year ending June 30, 2012 activities, resulting changes and current known facts, and should be read in conjunction with the Division’s financial statements.
Gas Division Highlights System Highlights KUB’s gas system serves 97,650 customers, and its service territory covers 279 square miles. KUB maintains 2,330 miles of service mains to provide 10.4 million dekatherms of natural gas to its customers annually. Peak day capacity for the gas distribution system is 157,381 dekatherms. The actual peak day throughput for the gas system was 119,282 dekatherms in January 2010.
Financial Highlights The Division’s net assets increased $0.6 million or 0.3 percent, compared to a $2.4 million increase last fiscal year.
Operating revenue decreased $19.5 million or 18.4 percent, the combined result of the flow-through of lower wholesale gas costs via the Division’s Purchased Gas Adjustment and a 13.3 percent decline in sales volumes. Purchased gas expense was $13 million or 20.3 percent lower due to the decline in sales volumes and lower wholesale gas prices. Margin on gas sales (operating revenue less purchased gas expense) decreased $6.5 million or 15.5 percent, the result of a 13.3 percent decline in sales volumes due to milder winter weather.
Operating expenses (excluding purchased gas expense) decreased $4.7 million or 12.9 percent. Operating and maintenance (O&M) expenditures decreased $5.1 million or 22.9 percent. Depreciation expense was $0.4 million higher than the prior year. Taxes and tax equivalents were $0.1 million higher than the prior year.
Lower interest rates on longer-term investments resulted in a $0.1 million decrease in interest income. Interest expense decreased $0.1 million. These items combined to hold other income flat when compared to the prior year.
Total plant assets (net) increased $12.8 million or 6.6 percent over the end of the last fiscal year primarily due to the replacement and construction of gas mains.
Knoxville Utilities Board Gas Division Management’s Discussion and Analysis June 30, 2012 and 2011
4
Long-term debt represented 35.6 percent of the Division’s capital structure, compared to 37 percent last year. Capital structure equals long-term debt (which includes the current portion of revenue bonds and notes, as applicable, due to be retired next fiscal year) plus net assets.
The Division’s bond covenants require a debt service coverage ratio of at least 1.2 times the maximum principal and interest payments over the life of the Division’s outstanding bonds. Current year debt coverage for the fiscal year was 2.22. Maximum debt service coverage was 2.30.
Division Highlights
The Division added approximately 730 customers during fiscal year 2012. Last fiscal year, the Division experienced a net loss of 300 customers. System growth over the last three years has been limited due to the economic recession.
Natural gas sales were 13.3 percent lower than last year primarily due to a 23.4 percent decrease in residential sales from milder than normal winter temperatures. The winter of fiscal year 2012 was the mildest winter experienced in the KUB service territory over the last twenty-five years.
The Division sold $24.9 million in revenue refunding bonds in April 2012, which when combined with a reoffering premium of $2 million, refunded $26.1 million in outstanding bonds, and paid the underwriter’s discount and costs of issuance. This refunding will result in a savings of $4.6 million over the life of the bonds ($3.8 million in a net present value basis). The typical residential gas customer’s average monthly gas bill was $60.11 for the twelve months ending June 30, 2012, representing a decrease of $1.06 compared to last year based on the same volumes. The decrease was attributed to lower wholesale gas costs. The Division expended approximately 59 percent of its sales revenues on wholesale gas purchases for the year. Century II Infrastructure Program
In April 2011, management provided an updated assessment of the overall condition of each utility system’s infrastructure to the KUB Board. The assessment concluded that the gas distribution system is relatively new and that current funding levels are sufficient to support the gas infrastructure replacement program. For the fiscal year ended June 30, 2012, KUB exceeded its target replacement levels as 9.75 miles of cast iron/ductile iron main were replaced, exceeding the target of 8 miles.
(space left intentionally blank)
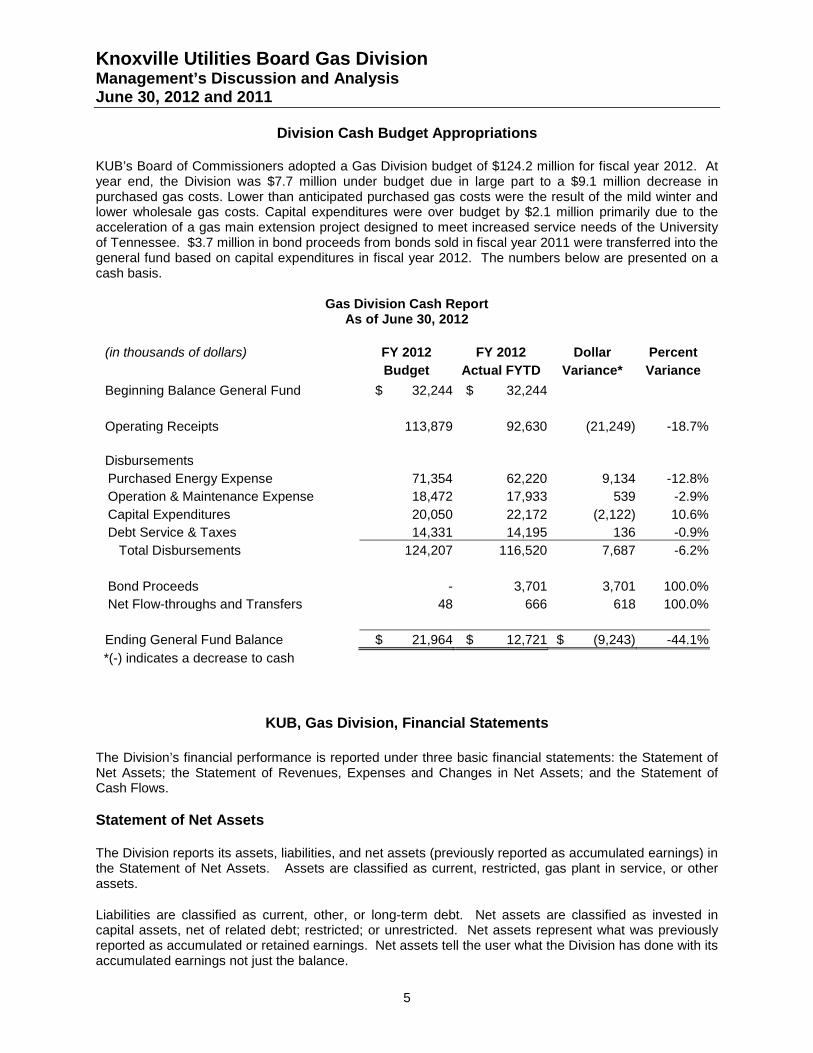
Knoxville Utilities Board Gas Division Management’s Discussion and Analysis June 30, 2012 and 2011
5
Division Cash Budget Appropriations KUB’s Board of Commissioners adopted a Gas Division budget of $124.2 million for fiscal year 2012. At year end, the Division was $7.7 million under budget due in large part to a $9.1 million decrease in purchased gas costs. Lower than anticipated purchased gas costs were the result of the mild winter and lower wholesale gas costs. Capital expenditures were over budget by $2.1 million primarily due to the acceleration of a gas main extension project designed to meet increased service needs of the University of Tennessee. $3.7 million in bond proceeds from bonds sold in fiscal year 2011 were transferred into the general fund based on capital expenditures in fiscal year 2012. The numbers below are presented on a cash basis.
Gas Division Cash Report
As of June 30, 2012
(in thousands of dollars) FY 2012 FY 2012 Dollar Percent Budget Actual FYTD Variance* Variance
Beginning Balance General Fund $ 32,244 $ 32,244 Operating Receipts 113,879 92,630 (21,249) -18.7% Disbursements Purchased Energy Expense 71,354 62,220 9,134 -12.8% Operation & Maintenance Expense 18,472 17,933 539 -2.9% Capital Expenditures 20,050 22,172 (2,122) 10.6% Debt Service & Taxes 14,331 14,195 136 -0.9% Total Disbursements 124,207 116,520 7,687 -6.2% Bond Proceeds - 3,701 3,701 100.0% Net Flow-throughs and Transfers 48 666 618 100.0% Ending General Fund Balance $ 21,964 $ 12,721 $ (9,243) -44.1% *(-) indicates a decrease to cash
KUB, Gas Division, Financial Statements
The Division’s financial performance is reported under three basic financial statements: the Statement of Net Assets; the Statement of Revenues, Expenses and Changes in Net Assets; and the Statement of Cash Flows.
Statement of Net Assets The Division reports its assets, liabilities, and net assets (previously reported as accumulated earnings) in the Statement of Net Assets. Assets are classified as current, restricted, gas plant in service, or other assets.
Liabilities are classified as current, other, or long-term debt. Net assets are classified as invested in capital assets, net of related debt; restricted; or unrestricted. Net assets represent what was previously reported as accumulated or retained earnings. Net assets tell the user what the Division has done with its accumulated earnings not just the balance.
Knoxville Utilities Board Gas Division Management’s Discussion and Analysis June 30, 2012 and 2011
6
Invested in capital assets, net of related debt, is the net book value of all capital assets less the outstanding balances of debt used to acquire, construct, or improve those assets.
Restricted net assets are assets that have been limited to specific uses by the Division’s bond covenants or through resolutions passed by the KUB Board of Commissioners. Unrestricted net assets are a residual classification; the amount remaining after reporting net assets as either invested in capital or restricted is reported there.
Statement of Revenues, Expenses and Changes in Net Assets The Division reports its revenues and expenses (both operating and non-operating) on the Statement of Revenues, Expenses and Changes in Net Assets. In addition, any contributions in aid of construction (funds received via grants, developers, etc. to fund capital projects) and associated write-downs of plant assets are reported on this statement.
Total revenue less total expense equals the change in net assets for the reporting. Net assets at the beginning of the period are increased or decreased, as applicable, by the change in net assets for the reporting period.
The change in net assets for the reporting period is added to the net assets segment of the Statement of Net Assets.
Statement of Cash Flows The Divisions reports its cash flows from operating activities, capital and related-financing activities, and investing activities on its Statement of Cash Flows. This statement tells the user the Division’s sources and uses of cash during the reporting period.
The statement indicates the Division’s beginning cash balance and ending cash balance and how it was either increased or decreased during the reporting period.
The statement also reconciles cash flow back to operating income as it appears on the Statement of Revenues, Expenses and Changes in Net Assets.
(space left intentionally blank)
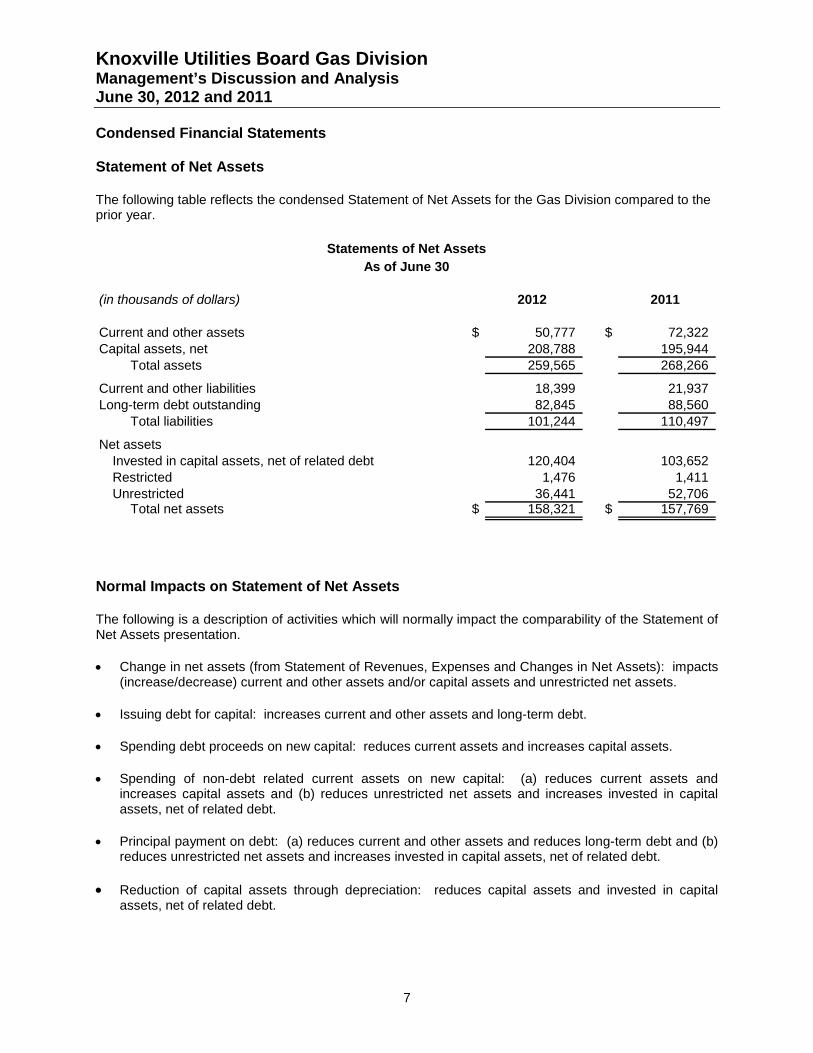
Knoxville Utilities Board Gas Division Management’s Discussion and Analysis June 30, 2012 and 2011
7
Condensed Financial Statements Statement of Net Assets The following table reflects the condensed Statement of Net Assets for the Gas Division compared to the prior year.
(in thousands of dollars) 2012 2011
Current and other assets $ 50,777 $ 72,322 Capital assets, net 208,788 195,944
Total assets 259,565 268,266
Current and other liabilities 18,399 21,937 Long-term debt outstanding 82,845 88,560
Total liabilities 101,244 110,497
Net assetsInvested in capital assets, net of related debt 120,404 103,652 Restricted 1,476 1,411 Unrestricted 36,441 52,706
Total net assets $ 158,321 $ 157,769
Statements of Net AssetsAs of June 30
Normal Impacts on Statement of Net Assets The following is a description of activities which will normally impact the comparability of the Statement of Net Assets presentation.
• Change in net assets (from Statement of Revenues, Expenses and Changes in Net Assets): impacts (increase/decrease) current and other assets and/or capital assets and unrestricted net assets.
• Issuing debt for capital: increases current and other assets and long-term debt.
• Spending debt proceeds on new capital: reduces current assets and increases capital assets.
• Spending of non-debt related current assets on new capital: (a) reduces current assets and increases capital assets and (b) reduces unrestricted net assets and increases invested in capital assets, net of related debt.
• Principal payment on debt: (a) reduces current and other assets and reduces long-term debt and (b) reduces unrestricted net assets and increases invested in capital assets, net of related debt.
• Reduction of capital assets through depreciation: reduces capital assets and invested in capital assets, net of related debt.
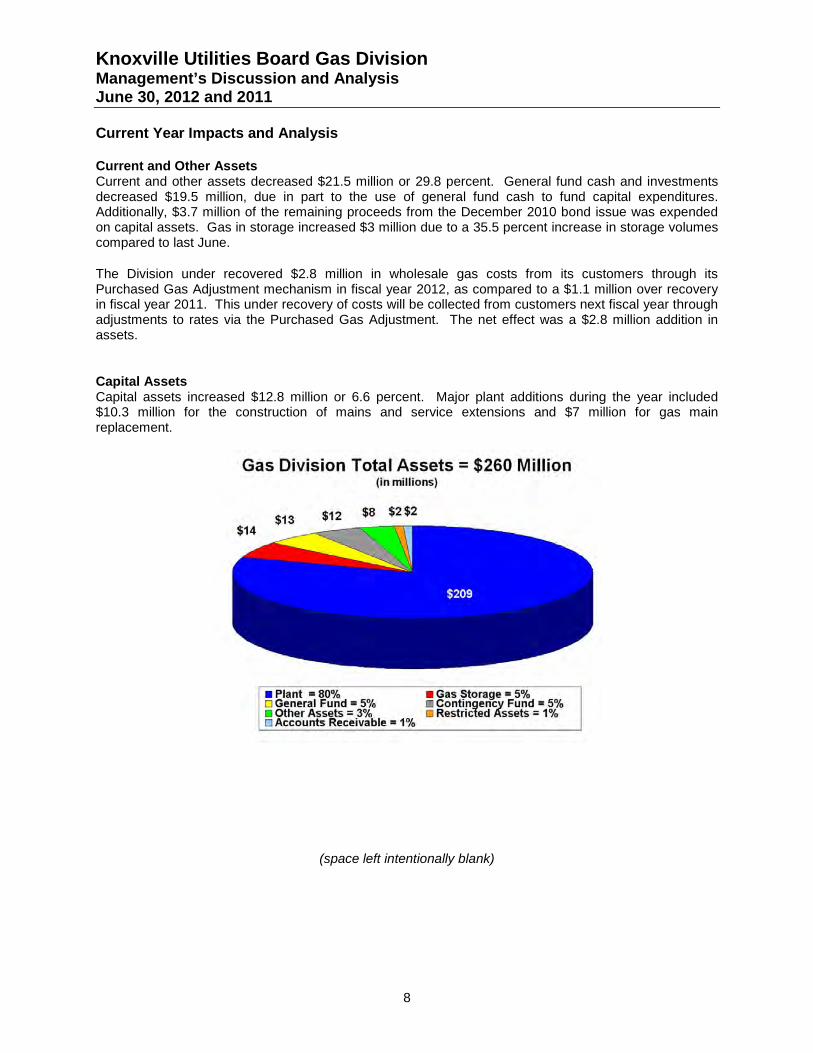
Knoxville Utilities Board Gas Division Management’s Discussion and Analysis June 30, 2012 and 2011
8
Current Year Impacts and Analysis
Current and Other Assets Current and other assets decreased $21.5 million or 29.8 percent. General fund cash and investments decreased $19.5 million, due in part to the use of general fund cash to fund capital expenditures. Additionally, $3.7 million of the remaining proceeds from the December 2010 bond issue was expended on capital assets. Gas in storage increased $3 million due to a 35.5 percent increase in storage volumes compared to last June.
The Division under recovered $2.8 million in wholesale gas costs from its customers through its Purchased Gas Adjustment mechanism in fiscal year 2012, as compared to a $1.1 million over recovery in fiscal year 2011. This under recovery of costs will be collected from customers next fiscal year through adjustments to rates via the Purchased Gas Adjustment. The net effect was a $2.8 million addition in assets.
Capital Assets Capital assets increased $12.8 million or 6.6 percent. Major plant additions during the year included $10.3 million for the construction of mains and service extensions and $7 million for gas main replacement.
(space left intentionally blank)

Knoxville Utilities Board Gas Division Management’s Discussion and Analysis June 30, 2012 and 2011
9
Current and Other Liabilities Current and other liabilities decreased $3.5 million or 16.1 percent. The Division under recovered $2.8 million in wholesale gas costs from its customers in fiscal year 2012, as compared to a $1.1 million over recovery in fiscal year 2011. The net effect was a $1.1 million reduction in liabilities. Accounts payable declined $2.9 million, due to lower purchased gas expenses, the result of fewer volumes purchased for injection into storage in June 2012 compared with last fiscal year. In addition, the Division’s share of KUB’s liability for other post-employment medical benefits was $0.7 million lower than the prior year. The net unamortized cost of debt increased $1 million reflecting the $2 million reoffering premium received from the underwriter in the refunding of outstanding gas system bonds.
Long-Term Debt Long-term debt fell $5.7 million or 6.5 percent, the result of the scheduled repayment of bond debt during the fiscal year and a $1.2 million reduction in principal as a result of the April 2012 debt refunding.
Net Assets Invested in capital assets, net of debt increased $16.8 million or 16.2 percent, primarily attributed to a $5.7 million decrease in long term debt, the expending of $3.7 million in remaining bond proceeds on capital infrastructure, and a $0.6 million increase in net assets (as reported on the Statement of Revenue, Expenses and Changes in Net Assets). Restricted net assets were up $0.1 million. Unrestricted net assets decreased $16.3 million primarily due to a $19.5 million reduction in general fund cash compared to June of the prior year.
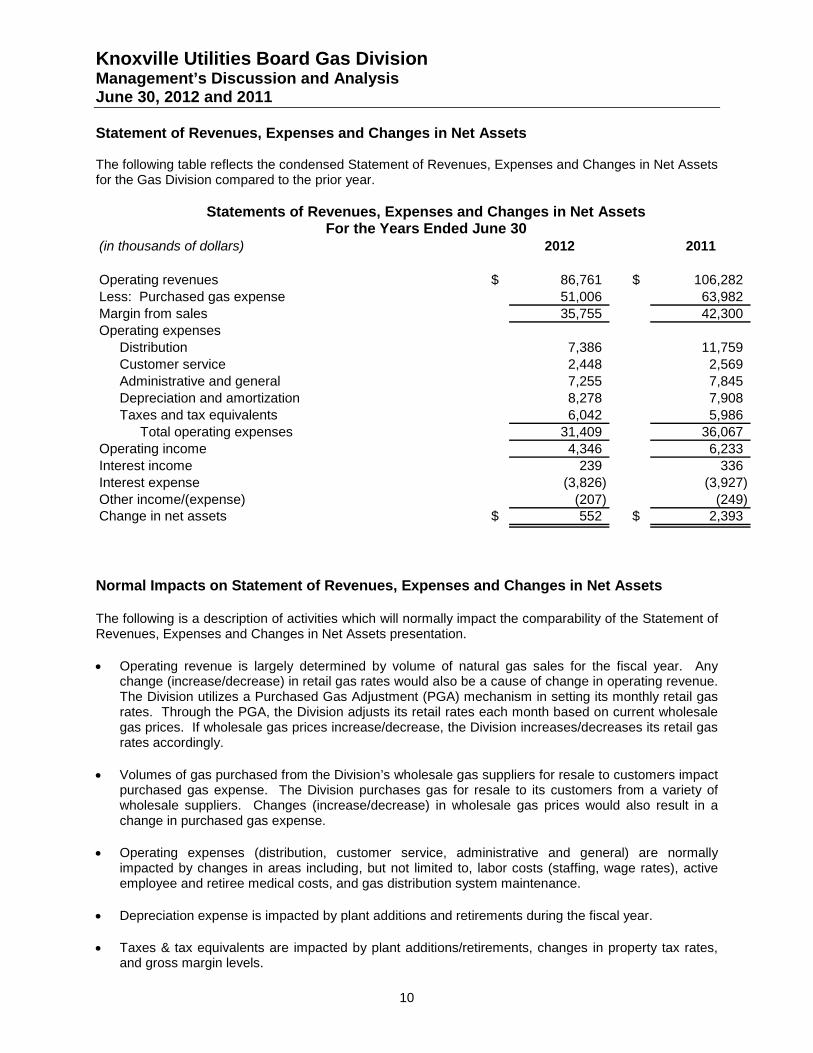
Knoxville Utilities Board Gas Division Management’s Discussion and Analysis June 30, 2012 and 2011
10
Statement of Revenues, Expenses and Changes in Net Assets
The following table reflects the condensed Statement of Revenues, Expenses and Changes in Net Assets for the Gas Division compared to the prior year.
Statements of Revenues, Expenses and Changes in Net Assets For the Years Ended June 30
Normal Impacts on Statement of Revenues, Expenses and Changes in Net Assets
The following is a description of activities which will normally impact the comparability of the Statement of Revenues, Expenses and Changes in Net Assets presentation.
• Operating revenue is largely determined by volume of natural gas sales for the fiscal year. Any change (increase/decrease) in retail gas rates would also be a cause of change in operating revenue. The Division utilizes a Purchased Gas Adjustment (PGA) mechanism in setting its monthly retail gas rates. Through the PGA, the Division adjusts its retail rates each month based on current wholesale gas prices. If wholesale gas prices increase/decrease, the Division increases/decreases its retail gas rates accordingly.
• Volumes of gas purchased from the Division’s wholesale gas suppliers for resale to customers impact purchased gas expense. The Division purchases gas for resale to its customers from a variety of wholesale suppliers. Changes (increase/decrease) in wholesale gas prices would also result in a change in purchased gas expense.
• Operating expenses (distribution, customer service, administrative and general) are normally impacted by changes in areas including, but not limited to, labor costs (staffing, wage rates), active employee and retiree medical costs, and gas distribution system maintenance.
• Depreciation expense is impacted by plant additions and retirements during the fiscal year.
• Taxes & tax equivalents are impacted by plant additions/retirements, changes in property tax rates, and gross margin levels.
(in thousands of dollars) 2012 2011
Operating revenues $ 86,761 $ 106,282 Less: Purchased gas expense 51,006 63,982 Margin from sales 35,755 42,300 Operating expenses
Distribution 7,386 11,759 Customer service 2,448 2,569 Administrative and general 7,255 7,845 Depreciation and amortization 8,278 7,908 Taxes and tax equivalents 6,042 5,986
Total operating expenses 31,409 36,067 Operating income 4,346 6,233 Interest income 239 336 Interest expense (3,826) (3,927) Other income/(expense) (207) (249) Change in net assets $ 552 $ 2,393
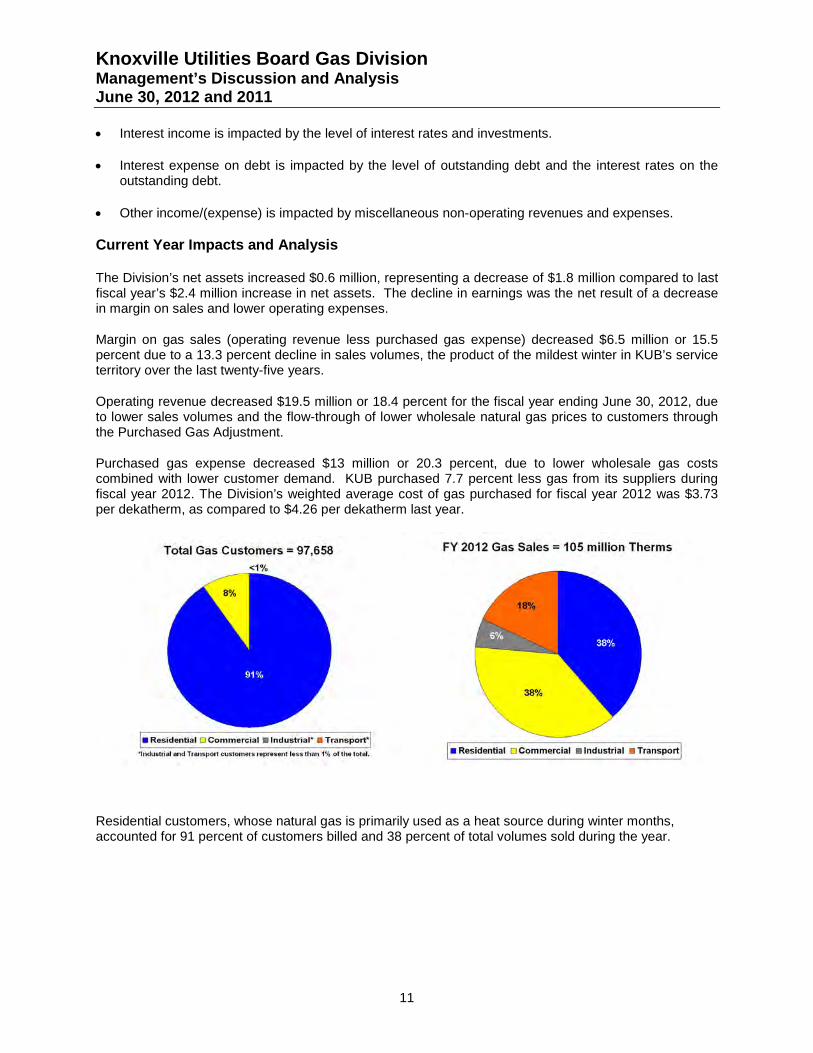
Knoxville Utilities Board Gas Division Management’s Discussion and Analysis June 30, 2012 and 2011
11
• Interest income is impacted by the level of interest rates and investments.
• Interest expense on debt is impacted by the level of outstanding debt and the interest rates on the outstanding debt.
• Other income/(expense) is impacted by miscellaneous non-operating revenues and expenses.
Current Year Impacts and Analysis
The Division’s net assets increased $0.6 million, representing a decrease of $1.8 million compared to last fiscal year’s $2.4 million increase in net assets. The decline in earnings was the net result of a decrease in margin on sales and lower operating expenses.
Margin on gas sales (operating revenue less purchased gas expense) decreased $6.5 million or 15.5 percent due to a 13.3 percent decline in sales volumes, the product of the mildest winter in KUB’s service territory over the last twenty-five years.
Operating revenue decreased $19.5 million or 18.4 percent for the fiscal year ending June 30, 2012, due to lower sales volumes and the flow-through of lower wholesale natural gas prices to customers through the Purchased Gas Adjustment.
Purchased gas expense decreased $13 million or 20.3 percent, due to lower wholesale gas costs combined with lower customer demand. KUB purchased 7.7 percent less gas from its suppliers during fiscal year 2012. The Division’s weighted average cost of gas purchased for fiscal year 2012 was $3.73 per dekatherm, as compared to $4.26 per dekatherm last year.
Residential customers, whose natural gas is primarily used as a heat source during winter months, accounted for 91 percent of customers billed and 38 percent of total volumes sold during the year.
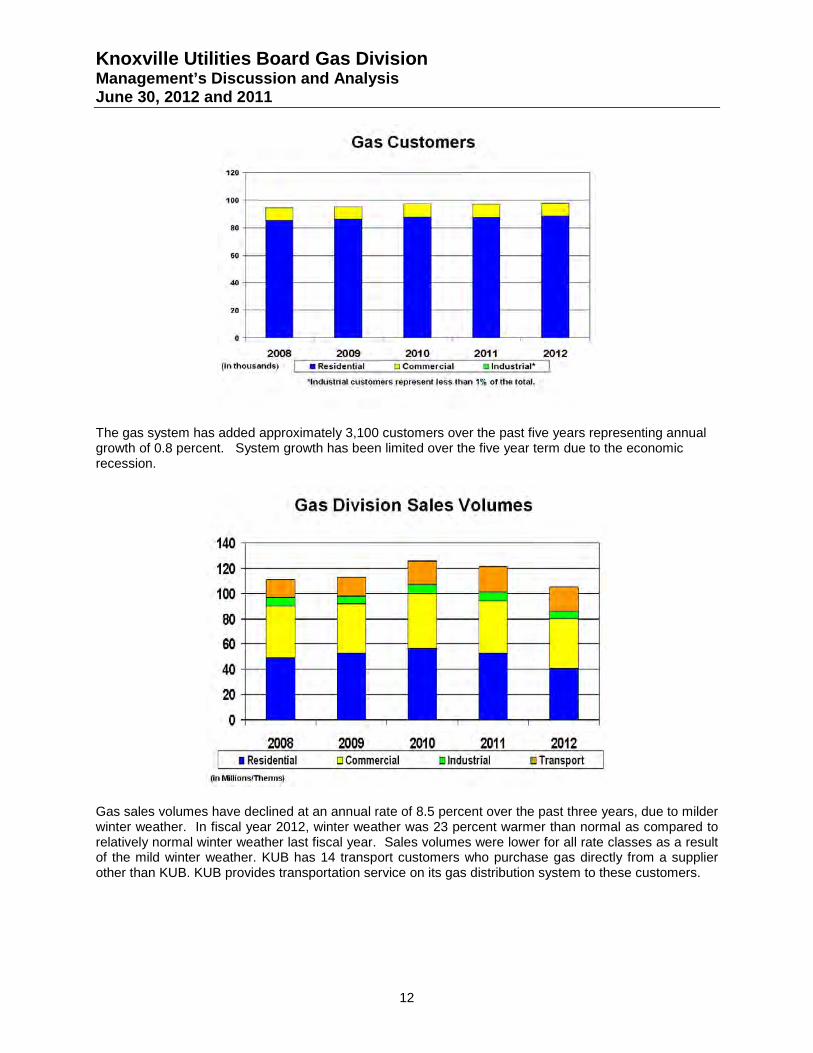
Knoxville Utilities Board Gas Division Management’s Discussion and Analysis June 30, 2012 and 2011
12
The gas system has added approximately 3,100 customers over the past five years representing annual growth of 0.8 percent. System growth has been limited over the five year term due to the economic recession.
Gas sales volumes have declined at an annual rate of 8.5 percent over the past three years, due to milder winter weather. In fiscal year 2012, winter weather was 23 percent warmer than normal as compared to relatively normal winter weather last fiscal year. Sales volumes were lower for all rate classes as a result of the mild winter weather. KUB has 14 transport customers who purchase gas directly from a supplier other than KUB. KUB provides transportation service on its gas distribution system to these customers.
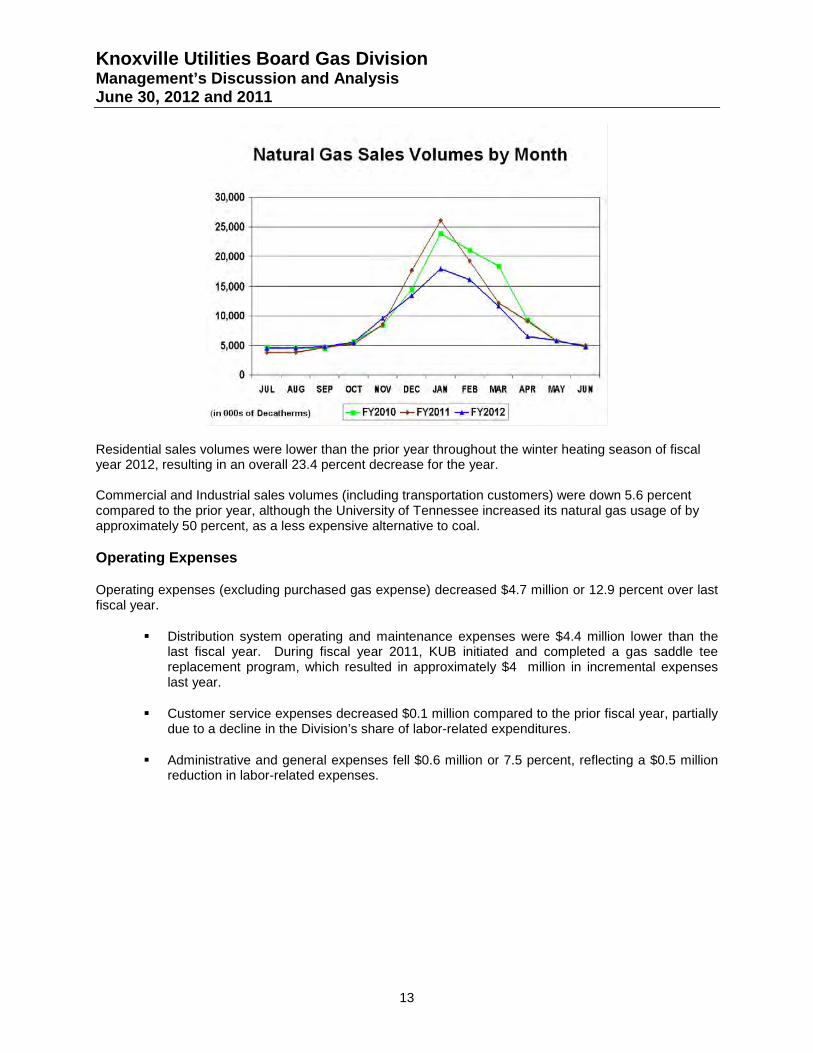
Knoxville Utilities Board Gas Division Management’s Discussion and Analysis June 30, 2012 and 2011
13
Residential sales volumes were lower than the prior year throughout the winter heating season of fiscal year 2012, resulting in an overall 23.4 percent decrease for the year. Commercial and Industrial sales volumes (including transportation customers) were down 5.6 percent compared to the prior year, although the University of Tennessee increased its natural gas usage of by approximately 50 percent, as a less expensive alternative to coal.
Operating Expenses
Operating expenses (excluding purchased gas expense) decreased $4.7 million or 12.9 percent over last fiscal year.
Distribution system operating and maintenance expenses were $4.4 million lower than the last fiscal year. During fiscal year 2011, KUB initiated and completed a gas saddle tee replacement program, which resulted in approximately $4 million in incremental expenses last year.
Customer service expenses decreased $0.1 million compared to the prior fiscal year, partially due to a decline in the Division’s share of labor-related expenditures.
Administrative and general expenses fell $0.6 million or 7.5 percent, reflecting a $0.5 million reduction in labor-related expenses.
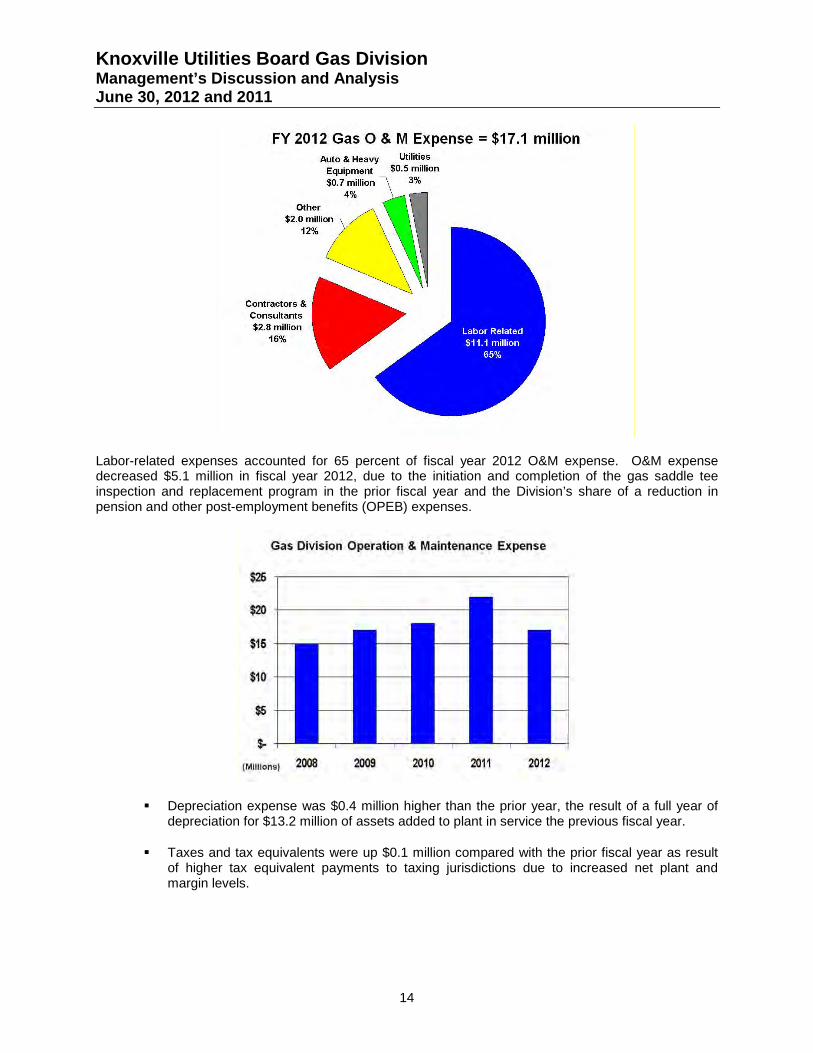
Knoxville Utilities Board Gas Division Management’s Discussion and Analysis June 30, 2012 and 2011
14
Labor-related expenses accounted for 65 percent of fiscal year 2012 O&M expense. O&M expense decreased $5.1 million in fiscal year 2012, due to the initiation and completion of the gas saddle tee inspection and replacement program in the prior fiscal year and the Division’s share of a reduction in pension and other post-employment benefits (OPEB) expenses.
Depreciation expense was $0.4 million higher than the prior year, the result of a full year of depreciation for $13.2 million of assets added to plant in service the previous fiscal year.
Taxes and tax equivalents were up $0.1 million compared with the prior fiscal year as result of higher tax equivalent payments to taxing jurisdictions due to increased net plant and margin levels.
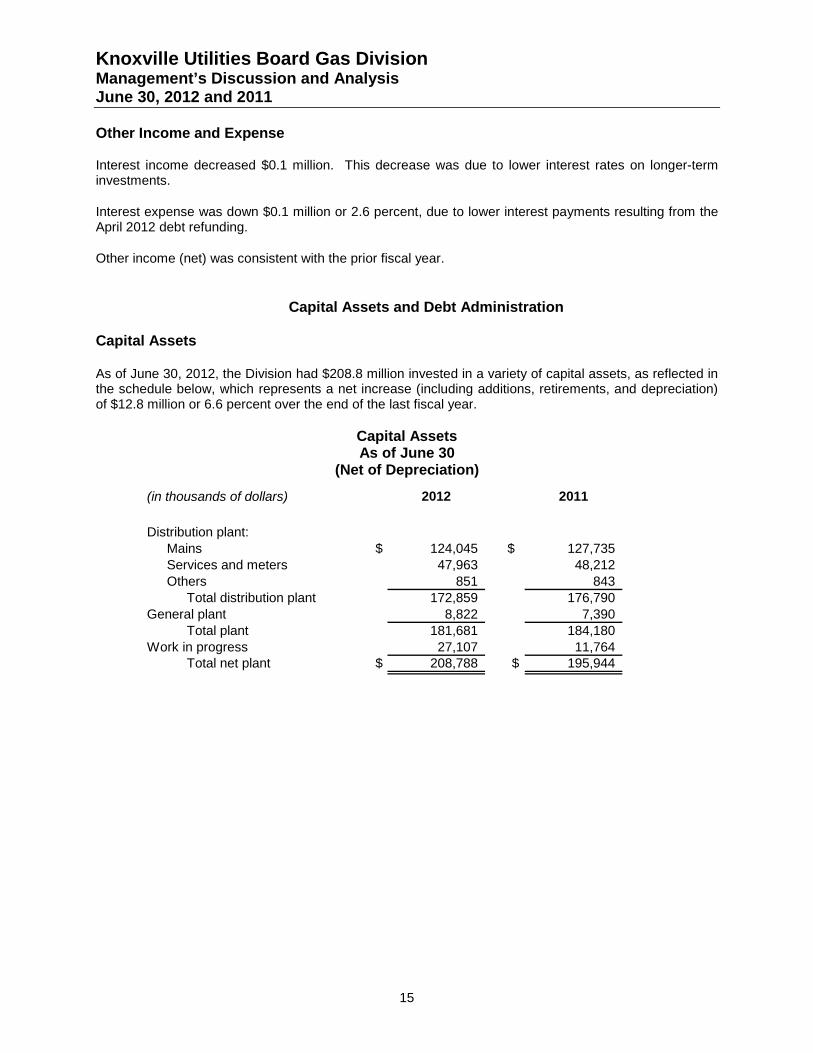
Knoxville Utilities Board Gas Division Management’s Discussion and Analysis June 30, 2012 and 2011
15
Other Income and Expense
Interest income decreased $0.1 million. This decrease was due to lower interest rates on longer-term investments.
Interest expense was down $0.1 million or 2.6 percent, due to lower interest payments resulting from the April 2012 debt refunding.
Other income (net) was consistent with the prior fiscal year.
Capital Assets and Debt Administration
Capital Assets
As of June 30, 2012, the Division had $208.8 million invested in a variety of capital assets, as reflected in the schedule below, which represents a net increase (including additions, retirements, and depreciation) of $12.8 million or 6.6 percent over the end of the last fiscal year.
Capital Assets As of June 30
(Net of Depreciation)
(in thousands of dollars) 2012 2011
Distribution plant:Mains $ 124,045 $ 127,735 Services and meters 47,963 48,212 Others 851 843
Total distribution plant 172,859 176,790 General plant 8,822 7,390
Total plant 181,681 184,180 Work in progress 27,107 11,764
Total net plant $ 208,788 $ 195,944
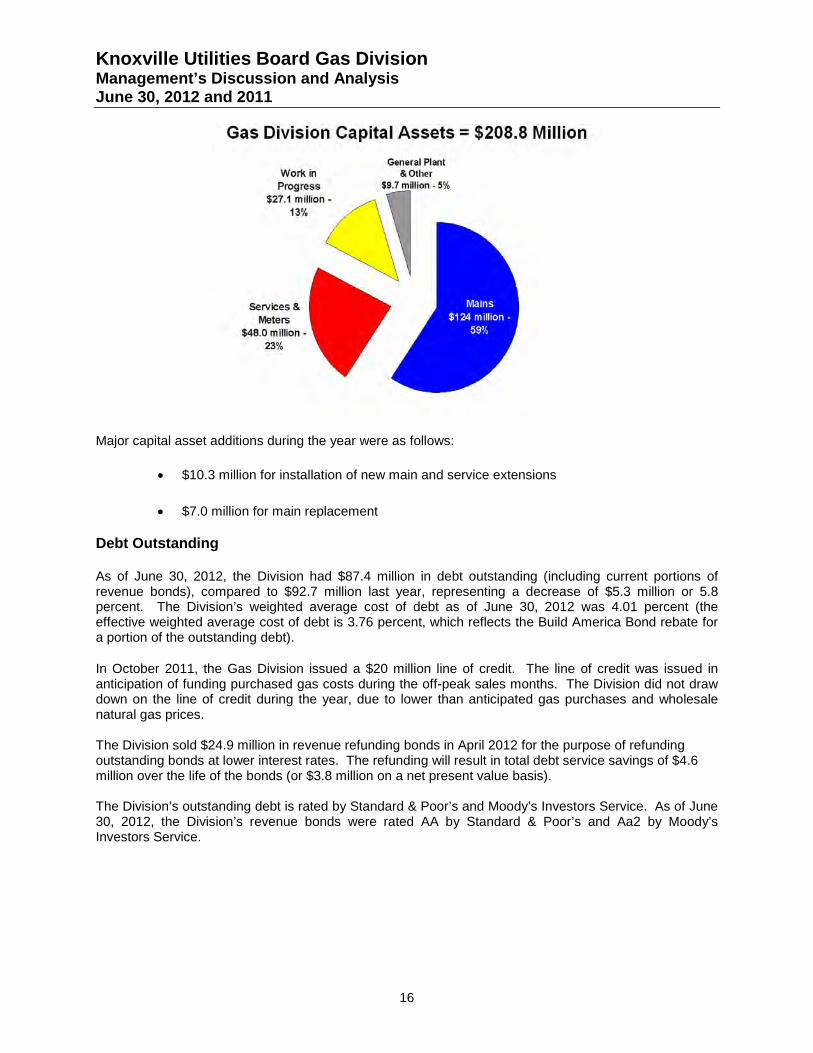
Knoxville Utilities Board Gas Division Management’s Discussion and Analysis June 30, 2012 and 2011
16
Major capital asset additions during the year were as follows:
• $10.3 million for installation of new main and service extensions
• $7.0 million for main replacement
Debt Outstanding
As of June 30, 2012, the Division had $87.4 million in debt outstanding (including current portions of revenue bonds), compared to $92.7 million last year, representing a decrease of $5.3 million or 5.8 percent. The Division’s weighted average cost of debt as of June 30, 2012 was 4.01 percent (the effective weighted average cost of debt is 3.76 percent, which reflects the Build America Bond rebate for a portion of the outstanding debt).
In October 2011, the Gas Division issued a $20 million line of credit. The line of credit was issued in anticipation of funding purchased gas costs during the off-peak sales months. The Division did not draw down on the line of credit during the year, due to lower than anticipated gas purchases and wholesale natural gas prices. The Division sold $24.9 million in revenue refunding bonds in April 2012 for the purpose of refunding outstanding bonds at lower interest rates. The refunding will result in total debt service savings of $4.6 million over the life of the bonds (or $3.8 million on a net present value basis). The Division’s outstanding debt is rated by Standard & Poor’s and Moody’s Investors Service. As of June 30, 2012, the Division’s revenue bonds were rated AA by Standard & Poor’s and Aa2 by Moody’s Investors Service.
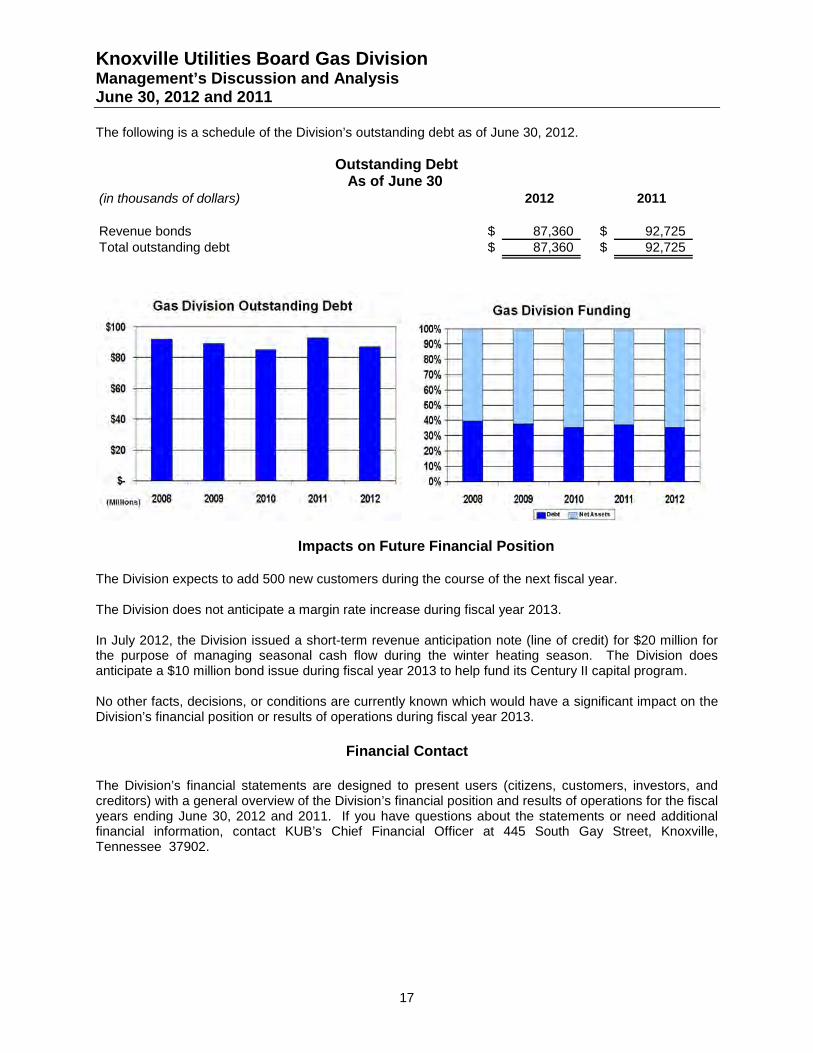
Knoxville Utilities Board Gas Division Management’s Discussion and Analysis June 30, 2012 and 2011
17
The following is a schedule of the Division’s outstanding debt as of June 30, 2012.
Outstanding Debt As of June 30
(in thousands of dollars) 2012 2011
Revenue bonds $ 87,360 $ 92,725 Total outstanding debt $ 87,360 $ 92,725
Impacts on Future Financial Position
The Division expects to add 500 new customers during the course of the next fiscal year. The Division does not anticipate a margin rate increase during fiscal year 2013. In July 2012, the Division issued a short-term revenue anticipation note (line of credit) for $20 million for the purpose of managing seasonal cash flow during the winter heating season. The Division does anticipate a $10 million bond issue during fiscal year 2013 to help fund its Century II capital program. No other facts, decisions, or conditions are currently known which would have a significant impact on the Division’s financial position or results of operations during fiscal year 2013.
Financial Contact
The Division’s financial statements are designed to present users (citizens, customers, investors, and creditors) with a general overview of the Division’s financial position and results of operations for the fiscal years ending June 30, 2012 and 2011. If you have questions about the statements or need additional financial information, contact KUB’s Chief Financial Officer at 445 South Gay Street, Knoxville, Tennessee 37902.

Knoxville Utilities Board Gas Division Statements of Net Assets June 30, 2012 and 2011
The accompanying notes are an integral part of these financial statements.
18
2012 2011AssetsCurrent assets:
Cash and cash equivalents $ 9,721,275 $ 30,244,231 Short-term investments 3,000,000 2,000,000 Short-term contingency fund investments 5,112,602 4,650,992 Other current assets 2,146,735 2,441,215 Accrued interest receivable 12,974 8,096 Accounts receivable, less allowance of uncollectible accounts
of $86,071 in 2012 and $79,107 in 2011 3,022,018 6,145,196 Inventories 347,735 382,575 Prepaid gas purchases (storage) 13,789,493 10,836,632 Prepaid expenses 53,619 60,959
Total current assets 37,206,451 56,769,896
Restricted assets:Gas bond fund 2,551,537 2,763,028 Other funds 1,623 23,641 Unused bond proceeds - 3,700,165
Total restricted assets 2,553,160 6,486,834
Gas plant in service 271,310,274 266,163,277 Less accumulated depreciation (89,629,690) (81,983,447)
181,680,584 184,179,830 Retirement in progress 340,492 22,831 Construction in progress 26,766,994 11,741,518
Net plant in service 208,788,070 195,944,179
Other assets:Long-term contingency fund investments 6,685,621 7,191,239 Deferred loss on refunding bonds 824,615 1,192,767 Under recovered purchased gas costs 2,825,163 - Other 681,848 681,137
Total other assets 11,017,247 9,065,143 Total assets $ 259,564,928 $ 268,266,052
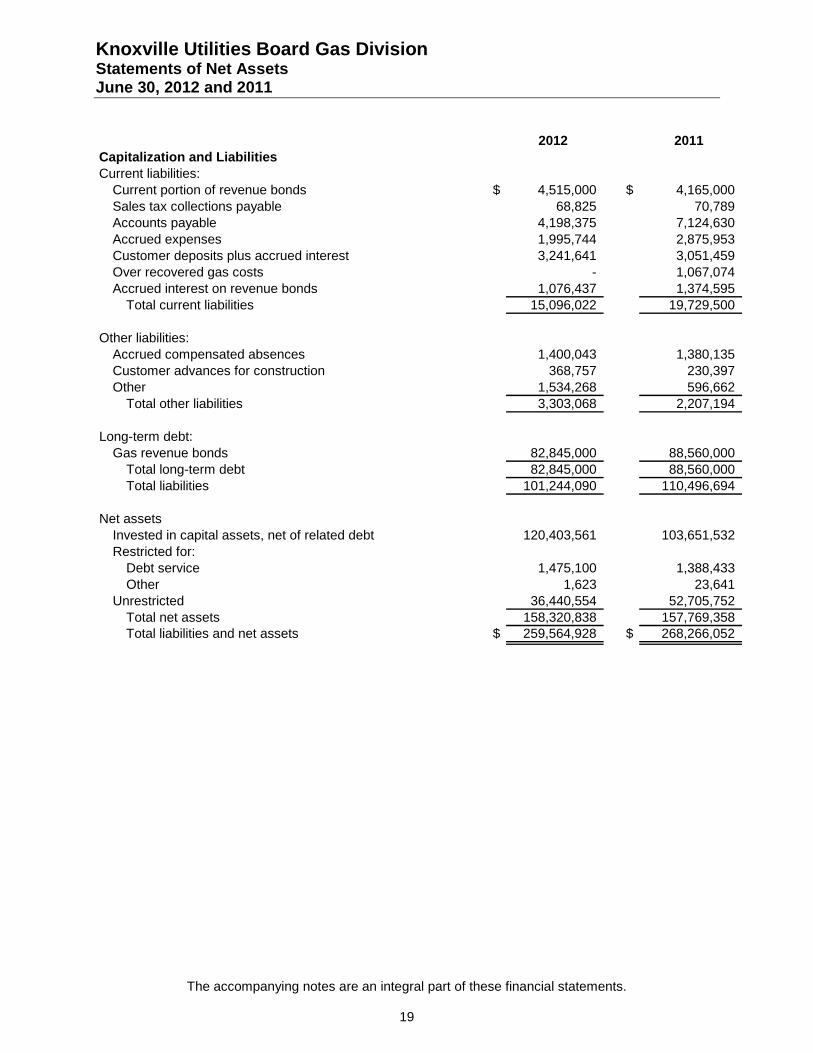
Knoxville Utilities Board Gas Division Statements of Net Assets June 30, 2012 and 2011
The accompanying notes are an integral part of these financial statements.
19
2012 2011
Capitalization and LiabilitiesCurrent liabilities:
Current portion of revenue bonds $ 4,515,000 $ 4,165,000 Sales tax collections payable 68,825 70,789 Accounts payable 4,198,375 7,124,630 Accrued expenses 1,995,744 2,875,953 Customer deposits plus accrued interest 3,241,641 3,051,459 Over recovered gas costs - 1,067,074 Accrued interest on revenue bonds 1,076,437 1,374,595
Total current liabilities 15,096,022 19,729,500
Other liabilities:Accrued compensated absences 1,400,043 1,380,135 Customer advances for construction 368,757 230,397 Other 1,534,268 596,662
Total other liabilities 3,303,068 2,207,194
Long-term debt:Gas revenue bonds 82,845,000 88,560,000
Total long-term debt 82,845,000 88,560,000 Total liabilities 101,244,090 110,496,694
Net assetsInvested in capital assets, net of related debt 120,403,561 103,651,532 Restricted for:
Debt service 1,475,100 1,388,433 Other 1,623 23,641
Unrestricted 36,440,554 52,705,752 Total net assets 158,320,838 157,769,358 Total liabilities and net assets $ 259,564,928 $ 268,266,052
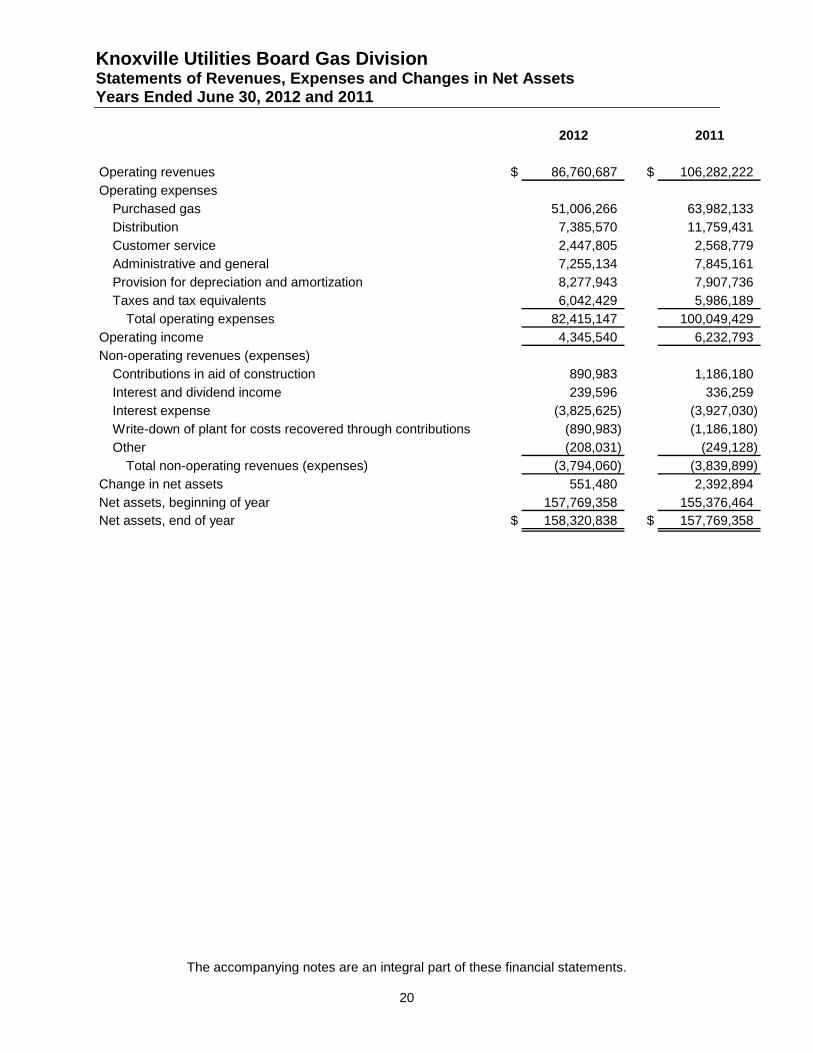
Knoxville Utilities Board Gas Division Statements of Revenues, Expenses and Changes in Net Assets Years Ended June 30, 2012 and 2011
The accompanying notes are an integral part of these financial statements.
20
2012 2011
Operating revenues $ 86,760,687 $ 106,282,222 Operating expenses
Purchased gas 51,006,266 63,982,133 Distribution 7,385,570 11,759,431 Customer service 2,447,805 2,568,779 Administrative and general 7,255,134 7,845,161 Provision for depreciation and amortization 8,277,943 7,907,736 Taxes and tax equivalents 6,042,429 5,986,189
Total operating expenses 82,415,147 100,049,429 Operating income 4,345,540 6,232,793 Non-operating revenues (expenses)
Contributions in aid of construction 890,983 1,186,180 Interest and dividend income 239,596 336,259 Interest expense (3,825,625) (3,927,030) Write-down of plant for costs recovered through contributions (890,983) (1,186,180) Other (208,031) (249,128)
Total non-operating revenues (expenses) (3,794,060) (3,839,899) Change in net assets 551,480 2,392,894 Net assets, beginning of year 157,769,358 155,376,464 Net assets, end of year $ 158,320,838 $ 157,769,358
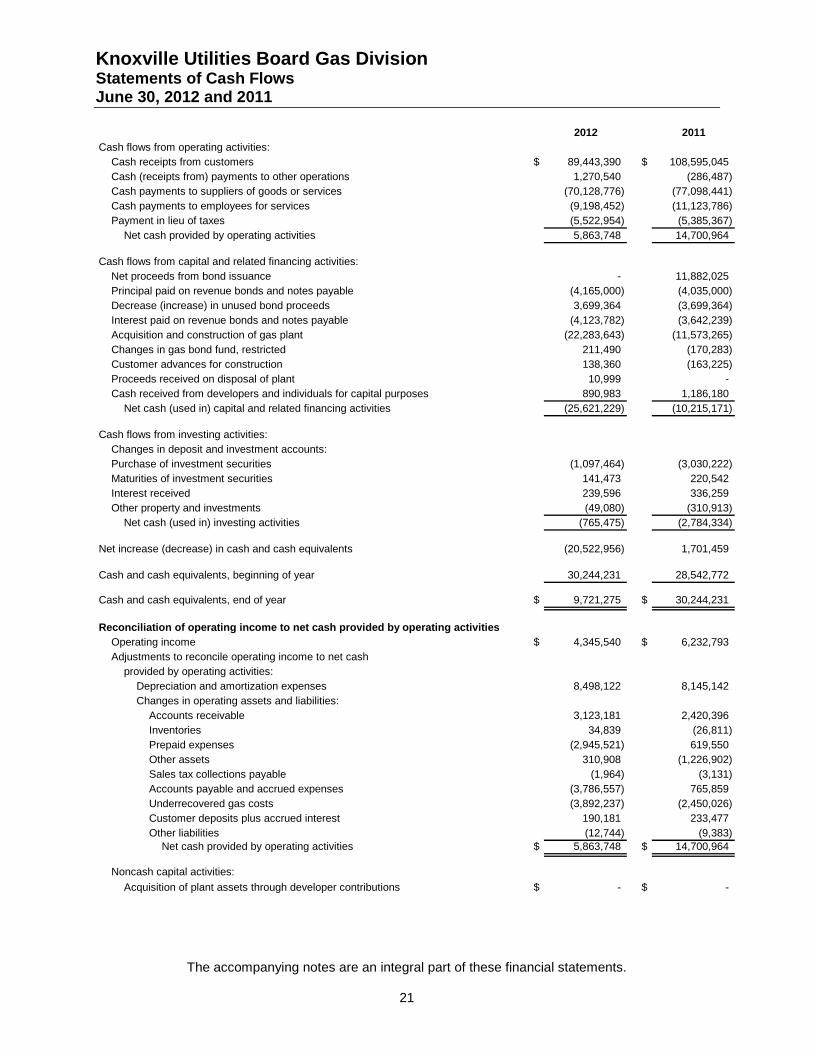
Knoxville Utilities Board Gas Division Statements of Cash Flows June 30, 2012 and 2011
The accompanying notes are an integral part of these financial statements.
21
2012 2011Cash flows from operating activities:
Cash receipts from customers $ 89,443,390 $ 108,595,045 Cash (receipts from) payments to other operations 1,270,540 (286,487) Cash payments to suppliers of goods or services (70,128,776) (77,098,441) Cash payments to employees for services (9,198,452) (11,123,786) Payment in lieu of taxes (5,522,954) (5,385,367)
Net cash provided by operating activities 5,863,748 14,700,964
Cash flows from capital and related financing activities:Net proceeds from bond issuance - 11,882,025 Principal paid on revenue bonds and notes payable (4,165,000) (4,035,000) Decrease (increase) in unused bond proceeds 3,699,364 (3,699,364) Interest paid on revenue bonds and notes payable (4,123,782) (3,642,239) Acquisition and construction of gas plant (22,283,643) (11,573,265) Changes in gas bond fund, restricted 211,490 (170,283) Customer advances for construction 138,360 (163,225) Proceeds received on disposal of plant 10,999 - Cash received from developers and individuals for capital purposes 890,983 1,186,180
Net cash (used in) capital and related financing activities (25,621,229) (10,215,171)
Cash flows from investing activities:Changes in deposit and investment accounts:Purchase of investment securities (1,097,464) (3,030,222) Maturities of investment securities 141,473 220,542 Interest received 239,596 336,259 Other property and investments (49,080) (310,913)
Net cash (used in) investing activities (765,475) (2,784,334)
Net increase (decrease) in cash and cash equivalents (20,522,956) 1,701,459
Cash and cash equivalents, beginning of year 30,244,231 28,542,772
Cash and cash equivalents, end of year $ 9,721,275 $ 30,244,231
Reconciliation of operating income to net cash provided by operating activitiesOperating income $ 4,345,540 $ 6,232,793 Adjustments to reconcile operating income to net cash
provided by operating activities:Depreciation and amortization expenses 8,498,122 8,145,142 Changes in operating assets and liabilities:
Accounts receivable 3,123,181 2,420,396 Inventories 34,839 (26,811) Prepaid expenses (2,945,521) 619,550 Other assets 310,908 (1,226,902) Sales tax collections payable (1,964) (3,131) Accounts payable and accrued expenses (3,786,557) 765,859 Underrecovered gas costs (3,892,237) (2,450,026) Customer deposits plus accrued interest 190,181 233,477 Other liabilities (12,744) (9,383)
Net cash provided by operating activities $ 5,863,748 $ 14,700,964
Noncash capital activities:Acquisition of plant assets through developer contributions $ - $ -
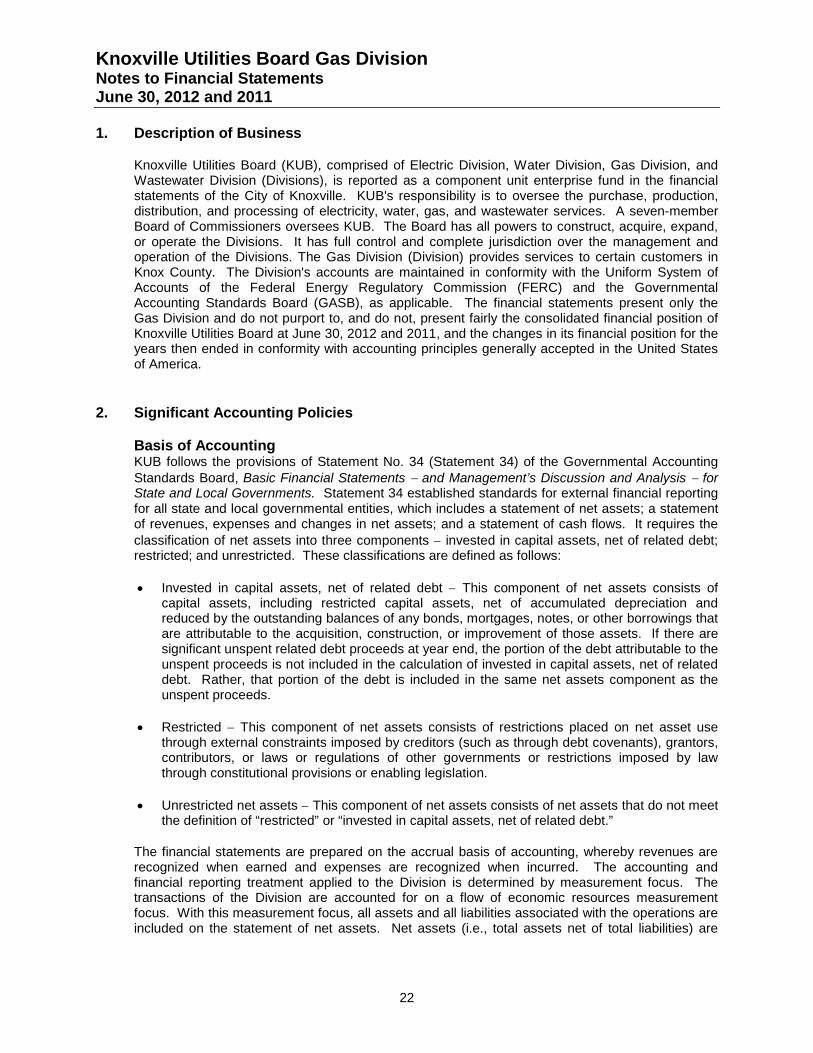
Knoxville Utilities Board Gas Division Notes to Financial Statements June 30, 2012 and 2011
22
1. Description of Business
Knoxville Utilities Board (KUB), comprised of Electric Division, Water Division, Gas Division, and Wastewater Division (Divisions), is reported as a component unit enterprise fund in the financial statements of the City of Knoxville. KUB's responsibility is to oversee the purchase, production, distribution, and processing of electricity, water, gas, and wastewater services. A seven-member Board of Commissioners oversees KUB. The Board has all powers to construct, acquire, expand, or operate the Divisions. It has full control and complete jurisdiction over the management and operation of the Divisions. The Gas Division (Division) provides services to certain customers in Knox County. The Division's accounts are maintained in conformity with the Uniform System of Accounts of the Federal Energy Regulatory Commission (FERC) and the Governmental Accounting Standards Board (GASB), as applicable. The financial statements present only the Gas Division and do not purport to, and do not, present fairly the consolidated financial position of Knoxville Utilities Board at June 30, 2012 and 2011, and the changes in its financial position for the years then ended in conformity with accounting principles generally accepted in the United States of America.
2. Significant Accounting Policies
Basis of Accounting KUB follows the provisions of Statement No. 34 (Statement 34) of the Governmental Accounting Standards Board, Basic Financial Statements − and Management’s Discussion and Analysis − for State and Local Governments. Statement 34 established standards for external financial reporting for all state and local governmental entities, which includes a statement of net assets; a statement of revenues, expenses and changes in net assets; and a statement of cash flows. It requires the classification of net assets into three components − invested in capital assets, net of related debt; restricted; and unrestricted. These classifications are defined as follows:
• Invested in capital assets, net of related debt − This component of net assets consists of capital assets, including restricted capital assets, net of accumulated depreciation and reduced by the outstanding balances of any bonds, mortgages, notes, or other borrowings that are attributable to the acquisition, construction, or improvement of those assets. If there are significant unspent related debt proceeds at year end, the portion of the debt attributable to the unspent proceeds is not included in the calculation of invested in capital assets, net of related debt. Rather, that portion of the debt is included in the same net assets component as the unspent proceeds.
• Restricted − This component of net assets consists of restrictions placed on net asset use through external constraints imposed by creditors (such as through debt covenants), grantors, contributors, or laws or regulations of other governments or restrictions imposed by law through constitutional provisions or enabling legislation.
• Unrestricted net assets − This component of net assets consists of net assets that do not meet the definition of “restricted” or “invested in capital assets, net of related debt.”
The financial statements are prepared on the accrual basis of accounting, whereby revenues are recognized when earned and expenses are recognized when incurred. The accounting and financial reporting treatment applied to the Division is determined by measurement focus. The transactions of the Division are accounted for on a flow of economic resources measurement focus. With this measurement focus, all assets and all liabilities associated with the operations are included on the statement of net assets. Net assets (i.e., total assets net of total liabilities) are
Knoxville Utilities Board Gas Division Notes to Financial Statements June 30, 2012 and 2011
23
segregated into invested in capital assets, net of related debt; restricted for capital activity and debt service; and unrestricted components.
As allowed by the Governmental Accounting Standards Board (GASB) Statement No. 20, Accounting and Financial Reporting for Proprietary Funds and Other Governmental Entities That Use Proprietary Fund Accounting, KUB’s policy is to apply only those Financial Accounting Standards Board statements, related interpretations, Accounting Principles Board opinions and accounting research bulletins issued on or prior to November 30, 1989 that do not conflict with Governmental Accounting Standards.
Gas Plant Gas plant and other property are stated on the basis of original cost. The cost of current repairs and minor replacements is charged to operating expense. The cost of renewals and improvements is capitalized. The original cost of utility plant assets retired or otherwise disposed of and the cost of removal less salvage value is charged to accumulated depreciation. When other property is retired, the related asset and accumulated depreciation are removed from the accounts, and the gain or loss is included in the results of operations.
The provision for depreciation of gas plant in service is based on the estimated useful lives of the assets, which range from three to thirty-three years, and is computed using the straight-line method. Pursuant to FERC, the caption "Provision for depreciation" in the statements of revenues, expenses and changes in net assets does not include depreciation for transportation equipment of $220,179 in 2012 and $237,406 in 2011. Interest costs are expensed as incurred.
Operating Revenue Operating revenue consists primarily of charges for services provided by the principal operations of the KUB Gas Division. Operating revenue is recorded when the service is rendered, on a cycle basis, and includes an estimate of unbilled revenue. Revenues are reported net of bad debt expense of $10,597 in 2012 and $138,442 in 2011.
Non-operating Revenue Non-operating revenue consists of revenues that are related to financing and investing types of activities and result from non-exchange transactions or ancillary activities.
Expense When an expense is incurred for purposes for which there are both restricted and unrestricted net assets available, it is KUB’s policy to apply those expenses to restricted net assets to the extent such are available and then to unrestricted net assets.
Purchased Gas Adjustment In November 1990, the Division implemented a deferred Purchased Gas (Cost) Adjustment (PGA) mechanism, which allows the Division to flow changes in purchased gas costs through to its customers. These changes in gas costs are reflected as adjustments to the base gas rates established by KUB's Board of Commissioners. The rate-setting authority vested in the KUB Board by the City Charter meets the “self-regulated” provisions of SFAS No. 71, “Accounting for the Effects of Certain Types of Regulation,” and KUB meets the remaining criteria of SFAS No. 71.
The PGA is intended to assure that KUB recovers the total cost of natural gas purchased, transported and/or reserved for delivery to its sales and transportation customers on an equitable basis. The PGA is also intended to assure that no excess or deficient cost recovery from KUB’s customers occurs.
Knoxville Utilities Board Gas Division Notes to Financial Statements June 30, 2012 and 2011
24
Under the PGA mechanism, the Division tracks the actual over/under recovered amount in the Over/Under recovered Purchased Gas Costs accounts. These accounts are rolled into the PGA rate adjustment on June 30 of each year thereby assuring that any (under)/over recovered amounts are passed on to the Division's customers. The amount of (under)/over recovered cost was ($2,825,163) at June 30, 2012 and $1,067,074 at June 30, 2011.
Contributions in Aid of Construction Contributions in aid of construction are cash collections from customers or others for a particular purpose, generally the construction of new facilities to serve new customers in excess of the investment KUB is willing to make for a particular incremental revenue source. KUB reduces the plant account balances to which contributions relate by the actual amount of the contribution and recognizes the contributions as non operating revenue in accordance with FAS 71, “Accounting for the Effects of Certain Types of Regulation”.
Estimates The preparation of financial statements in conformity with generally accepted accounting principles requires management to make estimates and assumptions that affect the reported amounts of assets and liabilities and disclosures of contingent assets and liabilities at the date of the financial statements and the reported amounts of revenues and expenses during the reporting period. These estimates are based on historical experience and various other assumptions that KUB believes are reasonable under the circumstances. However, future events are subject to change and the best estimates and judgments routinely require adjustment. Estimates are used for, but not limited to, inventory valuation, provision for doubtful accounts, depreciable lives of plant assets, unbilled revenue volumes, pension trust valuations, OPEB trust valuations, insurance liability reserves, and potential losses from contingencies and litigation. Actual results could differ from those estimates.
Inventories Inventories consist of plant materials and operating supplies and fuel stock, and are valued at the lower of average cost or replacement value.
Pension Plan The Division’s employees are participants in the Knoxville Utilities Board Pension Plan as authorized by the Charter of the City of Knoxville §1107(J) (Note 10). The Division’s policy is to fund pension cost accrued. As required by GASB Statement No. 27, KUB measures and discloses the annual pension cost on the accrual basis of accounting. At the time the funding method is introduced, there is a liability, which represents the contributions that would have been accumulated if this method of funding had always been used. The excess, if any, of this liability over the actuarial value of the assets held in the fund is the unfunded actuarial accrued liability, which is typically funded over a chosen period in accordance with an amortization schedule.
Investments Investments are carried at fair values as determined by quoted market prices at the reporting date.
Self-Insurance KUB has established self-insurance programs covering portions of workers' compensation, employee health, environmental liability, general liability, property and casualty liability, and automobile liability claims. A liability is accrued for claims as they are incurred. When applicable, claims in excess of the self-insured risk are covered by KUB's insurance carrier. Additionally, KUB provides certain lifetime health benefits to eligible retired employees under a self-insured health plan administered by a third party.
Knoxville Utilities Board Gas Division Notes to Financial Statements June 30, 2012 and 2011
25
Cash Equivalents For purposes of the statements of cash flows, KUB considers all unrestricted and undesignated highly liquid investments with an original maturity of three months or less when purchased to be cash equivalents.
Restricted and Designated Assets Certain assets are restricted by bond resolutions for the construction of utility plant and debt repayment. Certain additional assets are designated by management for contingency purposes and economic development.
Compensated Absences KUB accrues a liability for earned but unpaid paid-time off (PTO) days.
Subsequent Events KUB has evaluated events and transactions through October 18, 2012, the date these financial statements were issued, for items that should potentially be recognized or disclosed.
Reclassifications Certain reclassifications have been made to the 2011 balances to conform to the 2012 presentation.
3. Deposits and Investments
State law authorizes KUB to invest in obligations of the United States Treasury, its agencies and instrumentalities; certificates of deposit; repurchase agreements; money market funds; and the State Treasurer's Investment Pool. All deposits in excess of federal depository insurance limits and investments in other than the State Treasurer's Investment Pool are collateralized with government securities held in KUB's name by a third-party custodian bank(s) acting as KUB's agent(s) or through the state of Tennessee's collateral pool. Financial institutions that participate in the collateral pool are subject to special assessment; therefore, the deposits and investments of investors such as KUB are considered insured. Interest income is recorded on an accrual basis.
Information related to the carrying value and bank balances of deposits (except as noted below) and the carrying value and fair value of investments at June 30, 2012, is as follows:
Carrying BankValue Balance
DepositsDeposits in financial institutions $ 9,722,897 $ 13,066,900
InvestmentsCertificates of Deposits 9,807,828 9,807,828 State Treasurer's Investment Pool - - Agency Bonds 7,499,532 7,499,532
$ 27,030,257 $ 30,374,260
Knoxville Utilities Board Gas Division Notes to Financial Statements June 30, 2012 and 2011
26
Classification of deposits and investments:
BankDepository Account Balance
Insured $ 60,250
Collateralized:Collateral held by pledging bank's trust department in KUB's name 7,499,532 Collateral held by pledging bank's trust department not in KUB's name* 22,814,478
Total deposits and investments $ 30,374,260
* - Deposits are collaterlized with the Tenneesse State Investment Pool in the name of the pledging bank in accordance with Tennessee Code Annotated, Title 9, Chapter 4, parts 1 and 4. KUB deposits with First Tennessee Bank are collateralized at 115 percent of their total value.
Classification of deposits and investments per statement of net assets:
2012Current assets
Cash and cash equivalents $ 9,721,275 Short-term investments 3,000,000 Short-term contingency fund investments 5,112,602
Other assetsLong-term contingency fund investments 6,643,220
Restricted assetsGas bond fund 2,551,537 Other funds 1,623
$ 27,030,257
The above amounts do not include accrued interest of $42,401
KUB follows the provisions of Statement No. 40 (Statement 40) of the Governmental Accounting Standards Board Deposit and Investment Risk Disclosures an amendment of GASB Statement No. 3. This Statement establishes and modifies disclosure requirements for state and local governments related to deposit and investment risks.
Fair LessValue Than 1 1-5
Supersweep NOW and Other Deposits $ 13,066,900 $ 13,066,900 $ -State Treasurer's Investment Pool - - -Agency Bonds 7,499,532 1,403,431 6,096,101Certificates of deposits 9,807,828 9,260,708 547,120
$ 30,374,260 $ 23,731,039 $ 6,643,221
Deposit and Investment Maturities (in Years)
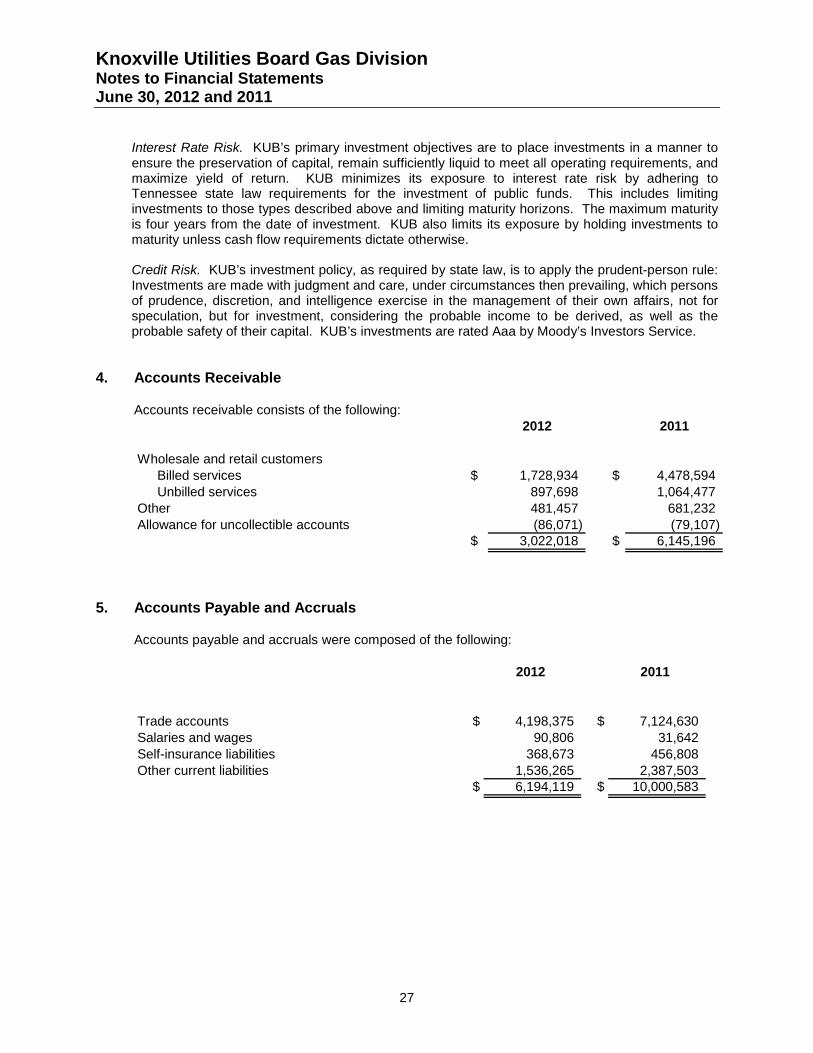
Knoxville Utilities Board Gas Division Notes to Financial Statements June 30, 2012 and 2011
27
Interest Rate Risk. KUB’s primary investment objectives are to place investments in a manner to ensure the preservation of capital, remain sufficiently liquid to meet all operating requirements, and maximize yield of return. KUB minimizes its exposure to interest rate risk by adhering to Tennessee state law requirements for the investment of public funds. This includes limiting investments to those types described above and limiting maturity horizons. The maximum maturity is four years from the date of investment. KUB also limits its exposure by holding investments to maturity unless cash flow requirements dictate otherwise.
Credit Risk. KUB’s investment policy, as required by state law, is to apply the prudent-person rule: Investments are made with judgment and care, under circumstances then prevailing, which persons of prudence, discretion, and intelligence exercise in the management of their own affairs, not for speculation, but for investment, considering the probable income to be derived, as well as the probable safety of their capital. KUB’s investments are rated Aaa by Moody’s Investors Service.
4. Accounts Receivable
Accounts receivable consists of the following: 2012 2011
Wholesale and retail customers Billed services $ 1,728,934 $ 4,478,594 Unbilled services 897,698 1,064,477 Other 481,457 681,232 Allowance for uncollectible accounts (86,071) (79,107)
$ 3,022,018 $ 6,145,196
5. Accounts Payable and Accruals
Accounts payable and accruals were composed of the following:
2012 2011
Trade accounts $ 4,198,375 $ 7,124,630 Salaries and wages 90,806 31,642 Self-insurance liabilities 368,673 456,808 Other current liabilities 1,536,265 2,387,503
$ 6,194,119 $ 10,000,583
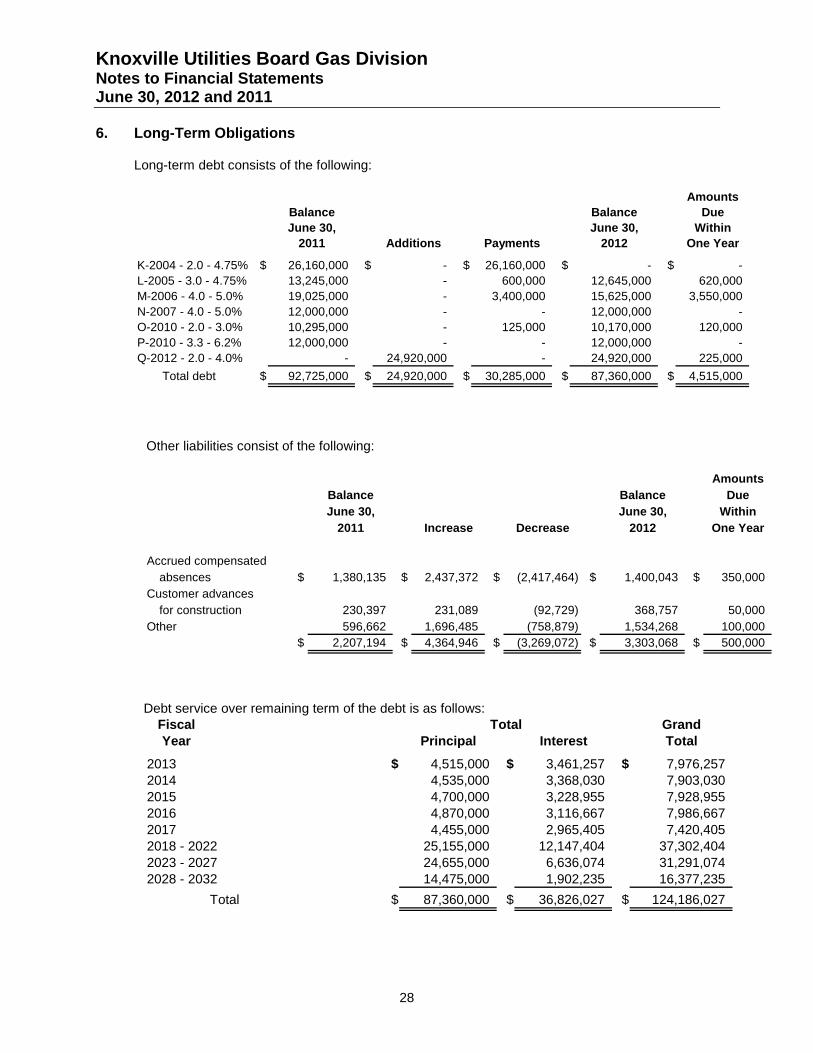
Knoxville Utilities Board Gas Division Notes to Financial Statements June 30, 2012 and 2011
28
6. Long-Term Obligations
Long-term debt consists of the following:
AmountsBalance Balance DueJune 30, June 30, Within
2011 Additions Payments 2012 One Year
K-2004 - 2.0 - 4.75% $ 26,160,000 $ - $ 26,160,000 $ - $ - L-2005 - 3.0 - 4.75% 13,245,000 - 600,000 12,645,000 620,000 M-2006 - 4.0 - 5.0% 19,025,000 - 3,400,000 15,625,000 3,550,000 N-2007 - 4.0 - 5.0% 12,000,000 - - 12,000,000 - O-2010 - 2.0 - 3.0% 10,295,000 - 125,000 10,170,000 120,000 P-2010 - 3.3 - 6.2% 12,000,000 - - 12,000,000 - Q-2012 - 2.0 - 4.0% - 24,920,000 - 24,920,000 225,000
Total debt $ 92,725,000 $ 24,920,000 $ 30,285,000 $ 87,360,000 $ 4,515,000
Other liabilities consist of the following:
AmountsBalance Balance DueJune 30, June 30, Within
2011 Increase Decrease 2012 One Year
Accrued compensatedabsences $ 1,380,135 $ 2,437,372 $ (2,417,464) $ 1,400,043 $ 350,000
Customer advancesfor construction 230,397 231,089 (92,729) 368,757 50,000
Other 596,662 1,696,485 (758,879) 1,534,268 100,000 $ 2,207,194 $ 4,364,946 $ (3,269,072) $ 3,303,068 $ 500,000
Debt service over remaining term of the debt is as follows:
Fiscal GrandYear Principal Interest Total
2013 $ 4,515,000 $ 3,461,257 $ 7,976,257 2014 4,535,000 3,368,030 7,903,030 2015 4,700,000 3,228,955 7,928,955 2016 4,870,000 3,116,667 7,986,667 2017 4,455,000 2,965,405 7,420,405 2018 - 2022 25,155,000 12,147,404 37,302,404 2023 - 2027 24,655,000 6,636,074 31,291,074 2028 - 2032 14,475,000 1,902,235 16,377,235
Total $ 87,360,000 $ 36,826,027 $ 124,186,027
Total

Knoxville Utilities Board Gas Division Notes to Financial Statements June 30, 2012 and 2011
29
The Division has pledged sufficient revenue, after deduction of all current operating expenses (exclusive of tax equivalents), to meet bond principal and interest payments when due. The requirements for the bonds are being met through monthly deposits to the Gas Bond Fund, as required by the bond covenants. As of June 30, 2012, these bond covenant requirements had been satisfied. During fiscal year 2004, KUB’s Gas Division issued Series K 2004 bonds to retire certain existing debt and fund gas system capital improvements. Concurrent with the issuance of these bonds, KUB transferred funds to an irrevocable trust to pay a portion of the Series H 1998 bonds, as such amounts mature. During fiscal year 2012, Series K 2004 was defeased with the issuance of Series Q 2012.
During fiscal year 2006, KUB’s Gas Division issued Series L 2005 bonds to retire certain existing debt and fund gas system capital improvements. Concurrent with the issuance of these bonds, KUB transferred funds to an irrevocable trust to pay a portion of the Series J 2001 bonds, as such amounts mature. KUB’s Gas Division also issued Series M 2006 bonds in part to retire certain existing debt and to fund gas system capital improvements. Concurrent with the issuance of these bonds, KUB transferred funds to an irrevocable trust to pay the remaining maturities of principal and interest on the Series H 1998 revenue bonds. During fiscal year 2008, KUB’s Gas Division issued Series N 2007 bonds to fund gas system capital improvements. During fiscal year 2010, KUB’s Gas Division issued Series O 2010 bonds to retire Series I 2001 bonds. During fiscal year 2011, KUB’s Gas Division issued Series P 2010 bonds to fund gas system capital improvements. These bonds were issued as federally taxable Build America Bonds with a 35 percent interest payment rebate to be received from the United States Government for each interest payment. During fiscal year 2012, KUB’s Gas Division issued Series Q 2012 bonds to retire Series K 2004 bonds. The outstanding principal balances on defeased bond issues were $76.1 million at June 30, 2012.
7. Lease Commitments
KUB has non-cancelable operating lease commitments for office equipment and vehicles, summarized for the following fiscal years: 2013 $ 4,470 2014 3,971 2015 5,063 2016 1,314
Total operating minimum lease payments $ 14,818
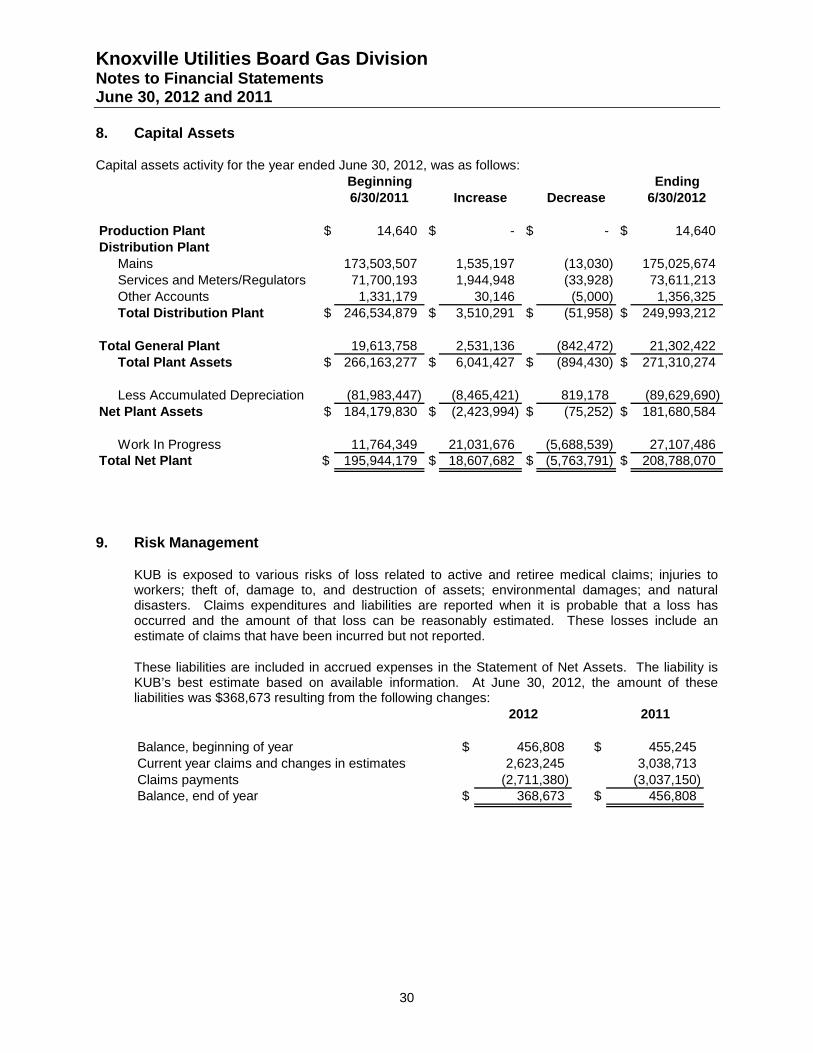
Knoxville Utilities Board Gas Division Notes to Financial Statements June 30, 2012 and 2011
30
8. Capital Assets
Capital assets activity for the year ended June 30, 2012, was as follows: Beginning Ending6/30/2011 Increase Decrease 6/30/2012
Production Plant $ 14,640 $ - $ - $ 14,640 Distribution Plant
Mains 173,503,507 1,535,197 (13,030) 175,025,674 Services and Meters/Regulators 71,700,193 1,944,948 (33,928) 73,611,213 Other Accounts 1,331,179 30,146 (5,000) 1,356,325 Total Distribution Plant $ 246,534,879 $ 3,510,291 $ (51,958) $ 249,993,212
Total General Plant 19,613,758 2,531,136 (842,472) 21,302,422
Total Plant Assets $ 266,163,277 $ 6,041,427 $ (894,430) $ 271,310,274
Less Accumulated Depreciation (81,983,447) (8,465,421) 819,178 (89,629,690) Net Plant Assets $ 184,179,830 $ (2,423,994) $ (75,252) $ 181,680,584
Work In Progress 11,764,349 21,031,676 (5,688,539) 27,107,486 Total Net Plant $ 195,944,179 $ 18,607,682 $ (5,763,791) $ 208,788,070
9. Risk Management
KUB is exposed to various risks of loss related to active and retiree medical claims; injuries to workers; theft of, damage to, and destruction of assets; environmental damages; and natural disasters. Claims expenditures and liabilities are reported when it is probable that a loss has occurred and the amount of that loss can be reasonably estimated. These losses include an estimate of claims that have been incurred but not reported.
These liabilities are included in accrued expenses in the Statement of Net Assets. The liability is KUB’s best estimate based on available information. At June 30, 2012, the amount of these liabilities was $368,673 resulting from the following changes:
2012 2011
Balance, beginning of year $ 456,808 $ 455,245 Current year claims and changes in estimates 2,623,245 3,038,713 Claims payments (2,711,380) (3,037,150) Balance, end of year $ 368,673 $ 456,808
Knoxville Utilities Board Gas Division Notes to Financial Statements June 30, 2012 and 2011
31
10. Pension Plan
Description of Plan The Plan is a single-employer contributory, defined benefit pension plan established by Resolution No. 980 dated February 18, 1999, effective July 1, 1999, as authorized by the Charter of the City of Knoxville § 1107(J). The Plan is designed to provide retirement, disability and death benefits. The Plan is a governmental plan as defined by the Employee Retirement Income Security Act of 1974 and is not subject to any of the provisions of the Act. The Plan is funded by contributions from KUB, if funding is required, and from Plan A and Plan B employee participants.
At December 31, 2011, the Plan had approximately 652 retirees and beneficiaries currently receiving benefits and 56 terminated employees entitled to benefits but not yet receiving them. Of the approximately 873 current employees in the Plan, 730 were fully vested at December 31, 2011. The Plan issues a financial report, which includes financial statements and required supplementary information. The report may be obtained by writing the Knoxville Utilities Board Pension Division, P.O. Box 59017, Knoxville, TN 37950-9017.
Effective January 1, 2011, KUB has frozen the Plan such that persons employed or re-employed by KUB on or after January 1, 2011, shall not be eligible to participate, but that eligible employees hired prior to January 1, 2011, who have not separated from service, shall continue as Participants and accrue benefits under the Plan.
The Plan provided three different benefit arrangements for KUB participants, retirees, and beneficiaries, as follows:
Career Equity Program (CEP)
CEP is for eligible employees hired on or after January 1, 1999, and for eligible former City Division Plan A members who elected CEP coverage as of July 1, 1999. CEP is a closed plan.
All eligible employees became participants on the date of his/her KUB employment. Participants are covered by Social Security. Participation in CEP does not require or permit employee contributions. Plan A Plan A benefits are for former City Division Plan A active employees, vested terminated employees, retirees, and beneficiaries. Plan A is a closed plan.
All employees participating in the City Division Plan A as of June 30, 1999, were eligible to participate in KUB’s Plan A or the CEP program. Participants of Plan A are covered by Social Security. Plan A is a closed plan and is not available to KUB employees hired after July 1, 1999. Participation in Plan A requires employee contributions of 3 percent of the first $4,800 of annual earnings and 4 percent of annual earnings in excess of $4,800. Plan A provides for early retirement benefits with 25 years of service and normal retirement benefits at age 62 or older.
Plan B Plan B benefits are for former City Division Plan B active employees, vested terminated employees, retirees, and beneficiaries. Plan B is a closed plan.
Knoxville Utilities Board Gas Division Notes to Financial Statements June 30, 2012 and 2011
32
All employees participating in the City Division Plan B as of June 30, 1999 are eligible to participate in KUB’s Plan B. Plan B is now a closed plan and no participants can be added. Participants of Plan B are not covered by Social Security. Participation in Plan B requires employee contributions of 4 percent of annual earnings. Plan B provides for retirement benefits after 25 years of service and the attainment of age 50.
Funding Policy For the Plan year ended December 31, 2011, a contribution of $3,593,282 is required to be made in the Plan sponsor’s fiscal year ending June 30, 2013. The Gas Division’s portion of this contribution is $682,724. The annual required contribution was determined as part of the January 1, 2011 valuation using the Individual Entry Age Normal funding method. The objective under this method is to fund each participant’s benefits under the Plan as payments which are level as a percentage of salary, starting on the original participation date (employment date) and continuing until the assumed retirement, termination, disability or death. For the Plan year ended December 31, 2011, the Plan’s actuarial funded ratio was 104.5 percent.
At the time the funding method is introduced, there is a liability, which represents the contributions that would have been accumulated if this method of funding had always been used. The excess, if any, of this liability over the actuarial value of the assets held in the fund, is the unfunded actuarial accrued liability, which is typically funded over a chosen period in accordance with an amortization schedule.
Significant actuarial assumptions used in the valuation include (a) rate of return of investments of 8 percent, (b) the RP2000 Mortality Table, (c) annual projected salary increases based on participants’ ages ranging from age 25 to age 65 with salary increases from 2.58 percent to 7.92 percent, and (d) cost of living adjustment of 2.8 percent annually. The actuarial value of assets was determined using techniques that smooth the effect of short-term volatility in the market value of equities over a five-year period.
As of the actuarial report for the Plan year ended December 31, 2011, contributions of $3,593,282 and $3,244,057 for 2011 and 2010, respectively, are required to be made during the Plan sponsor’s fiscal years ending June 30, 2013 and 2012, respectively. Of these amounts, $682,724 and $682,252 are attributable to the Gas Division. Subsequent to June 30, 2012, the actuarial report for the Plan year ending December 31, 2012 was completed. For the Plan year ending December 31, 2012, a contribution of $5,502,677 is required to be made in the Plan sponsor’s fiscal year ending June 30, 2014. The Gas Division’s portion of this contribution is $1,045,509. For the Plan year ending December 31, 2012, the Plan’s actuarial funded ratio was 94.1 percent.
11. Defined Contribution Plan
KUB has a defined contribution 401(k) employee retirement savings plan covering eligible KUB employees. Employees hired prior to January 1, 2011 may participate and receive a matching contribution of 50 percent of their own contribution up to a maximum match of 3 percent. Employees hired on or after January 1, 2011 have an enhanced 401(k) Plan due to the closure of the Defined Benefit Pension Plan. They may participate and receive a matching contribution of 50 percent of their own contribution up to a maximum match of 3 percent. They also receive a nonelective KUB contribution of from 3 percent to 6 percent, depending on years of service, whether they contribute or not.
Knoxville Utilities Board Gas Division Notes to Financial Statements June 30, 2012 and 2011
33
Since July 1, 2000, 401(k) matching contributions for employees eligible to participate in the KUB Pension Plan have been funded by the Pension Plan. These funds are held by the Pension trustee until eligible for distribution. IRS rules permit the funding of 401(k) matching contributions from excess pension assets for employees covered under the Pension Plan. Given the current funding level of the Pension Plan, effective July 1, 2011, KUB began to reimburse the Pension Plan for the current matching contributions. The match and nonelective contributions for employees hired on or after January 1, 2011 are paid directly by KUB.
12. Other Post-Employment Benefits (OPEB)
The Governmental Accounting Standards Board (GASB) established new standards for the measurement, recognition, and reporting of other post-employment benefits (OPEB). OPEB includes post-employment benefits other than pension, which, for KUB, is presently limited to post-employment health care. GASB 45 requires the recognition of the accrued OPEB liability for the respective year, plus the disclosure of the total unfunded liability. GASB 45 was effective for KUB for the fiscal year beginning July 1, 2007.
KUB currently provides post-employment health care benefits to 633 former employees and 647 covered dependents. The cost of coverage is shared with retirees and beneficiaries. KUB recognizes its share of the cost of post-employment health care benefits as an expense as claims are paid.
In anticipation of GASB 45, KUB amended its Group Health Plan in 1999, eliminating post-employment health care benefits for all employees hired on or after July 1, 1999. As of June 30, 2012, 450 active employees were eligible for individual and dependent coverage at separation if the employee meets the Rule of 80 (age plus years of service) with a minimum of 20 years of service.
In May 2006, the state of Tennessee adopted Tennessee Code Annotated, Title 8, Chapter 50, Part 12 authorizing governmental entities to establish Trusts for the purpose of pre-funding their respective OPEB liabilities.
Although GASB 45 does not require pre-funding of the liability, KUB has determined that it is in the long-term economic interest of KUB and its ratepayers to establish a Trust to pre-fund KUB’s OPEB liability.
In October 2007, the KUB Board authorized the establishment of an OPEB Trust. The applicable documentation was submitted to the State Funding Board and, in December 2007, the State Funding Board approved the Trust. The Trust was also approved by the Internal Revenue Service in June 2008. The Trust issues a financial report, which includes financial statements and required supplementary information. The report may be obtained by writing the Knoxville Utilities Board Retirement System, P.O. Box 59017, Knoxville, TN 37950-9017.
The general administration and responsibility for the proper operation of the Trust is governed by a board of trustees, appointed by KUB’s President & CEO. The investment of all deposits to the Trust is governed by an Investment Policy, which was adopted by the KUB Board and approved by the State Funding Board.
Knoxville Utilities Board Gas Division Notes to Financial Statements June 30, 2012 and 2011
34
Total contributions to the OPEB Trust for the fiscal year ended June 30, 2012 were $8.1 million (Division’s share $1.7 million). The contribution to the Trust exceeded the annual required contribution (ARC), as determined by the Postretirement Benefit Plan’s actuarial valuation for the year ended December 31, 2010, which was $4.6 million (Division’s share $1 million). As of June 30, 2012, the employer’s net OPEB obligation was $1.7 million (Division’s share $0.4 million).
The ARC for the fiscal year ending June 30, 2013, as determined by the Plan’s actuarial valuation for the year ended December 31, 2011 is $3.3 million (Division’s share $0.6 million).
The actuarial valuation for the Plan for the year ending December 31, 2012 has been completed. The valuation determined that the Plan’s actuarial accrued liability was $61.6 million (Division’s share $11.7 million). The actuarial value of the Plan’s assets was $37.9 million (Division’s share $7.2 million). As a result, the Plan’s unfunded actuarial accrued liability was $23.7 million (Division’s share $4.5 million). The Plan’s actuarial funded ratio was 62 percent. The valuation also determined that the employer’s ARC is $3.3 million for the fiscal year ending June 30, 2014 (Division’s share $0.6 million).
13. Related Party Transactions
The Division, in the normal course of operations, is involved in transactions with the City of Knoxville and with other systems of KUB. Such transactions for the years ended June 30, 2012 and 2011 are summarized as follows:
2012 2011
City of KnoxvilleAmounts billed by the Division for utilities and
related services $ 440,968 $ 596,295 Payments by the Division in lieu of property tax 2,980,679 2,866,580 Payments by the Division for services provided 139,257 124,021
Other divisions of KUBAmounts billed to other divisions for utilities
and related services provided 1,234,140 661,188 Interdivisional rental expense 464,288 544,369 Amounts billed to the Division by other divisions
for utilities services provided 272,278 266,898 With respect to these transactions, accounts receivable from and accounts payable to the City of Knoxville and the other divisions included in the balance sheet at year end were:
2012 2011
Accounts receivable $ 9,969 $ 19,289
Knoxville Utilities Board Gas Division Notes to Financial Statements June 30, 2012 and 2011
35
14. Natural Gas Supply Contract Commitments
For fiscal year 2012 the Gas Division hedged 67 percent of its total gas purchases via gas supply contracts. As of June 30, 2012, the Gas Division had hedged the price on approximately 10 percent of its anticipated gas purchases for fiscal year 2013.
The Gas Division contracts separately for the purchase, transportation and storage of natural gas. Purchase commitments for the next five years are as follows:
Firm obligations related to purchased gas – demand
2013 2014 2015 2016 2017
TransportationTennessee Gas Pipeline $ 7,325,892 $ 9,211,524 $ 9,211,524 $ 3,070,508 $ - East Tennessee Natural Gas 10,066,388 10,066,388 10,066,388 3,355,463 -
StorageTennessee Gas Pipeline 2,076,288 2,076,288 2,076,288 692,096 - East Tennessee Natural Gas 757,460 757,460 757,460 252,487 - Saltville Natural Gas 1,545,960 981,900 981,900 981,900 981,900
Demand Total $ 21,771,988 $ 23,093,560 $ 23,093,560 $ 8,352,454 $ 981,900
Firm obligations related to purchased gas - commodity
2013 2014 2015 2016 2017
BaseloadConoco $ 1,251,400 $ - $ - $ - $ - Equitable - - - - - Shell Energy 2,423,970 CNX 2,286,518 2,286,518 - - - Commodity Total $ 5,961,888 $ 2,286,518 $ - $ - $ -
The total commodity values presented here are based upon firm supply obligations with each individual natural gas supplier. The firm obligations value for Conoco, and Shell Energy are based upon firm supply obligations at locked prices with those suppliers. The firm obligations value for the CNX contract is based upon firm supply obligations and the applicable four month NYMEX strip prices on July 31, 2012.
15. Other Commitments and Contingencies
In the normal course of business, there are various lawsuits pending against KUB. Management has reviewed these lawsuits with counsel, who is vigorously defending KUB's position and is of the opinion that the ultimate disposition of these matters will not have a material adverse effect on KUB's financial position, results of operations or cash flows.
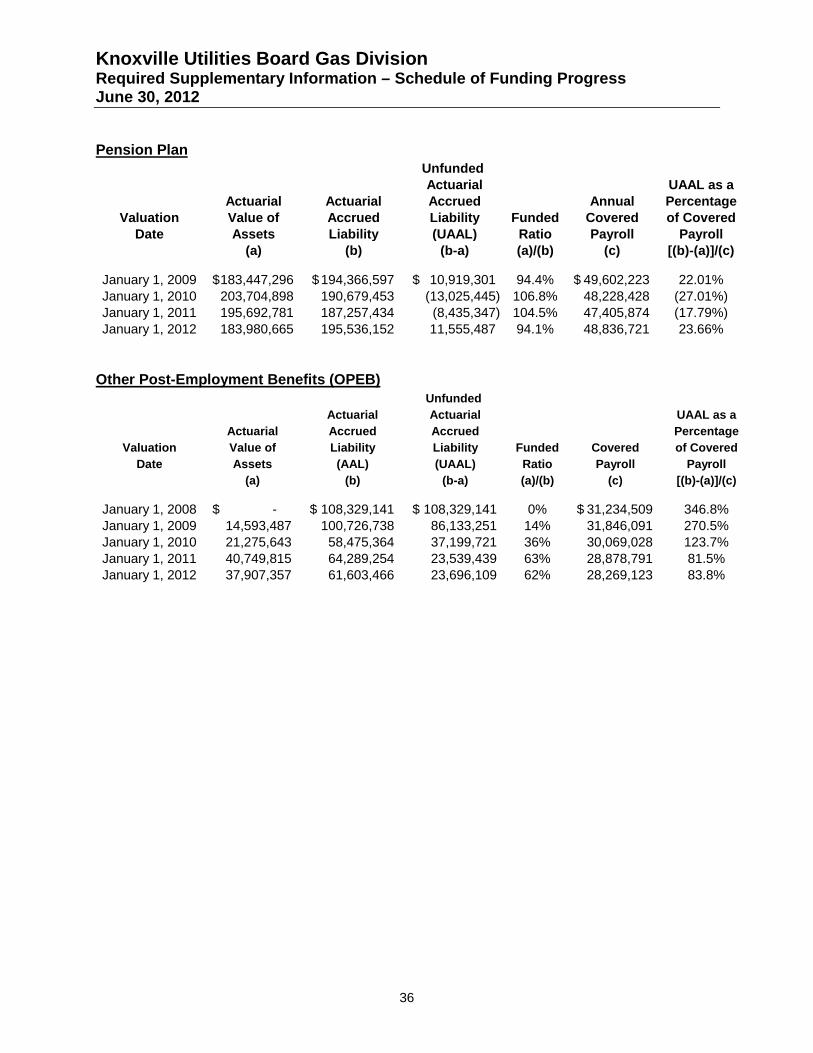
Knoxville Utilities Board Gas Division Required Supplementary Information – Schedule of Funding Progress June 30, 2012
36
Unfunded Actuarial UAAL as a
Actuarial Actuarial Accrued Annual PercentageValuation Value of Accrued Liability Funded Covered of Covered
Date Assets Liability (UAAL) Ratio Payroll Payroll(a) (b) (b-a) (a)/(b) (c) [(b)-(a)]/(c)
January 1, 2009 183,447,296$ 194,366,597$ 10,919,301$ 94.4% 49,602,223$ 22.01%January 1, 2010 203,704,898 190,679,453 (13,025,445) 106.8% 48,228,428 (27.01%)January 1, 2011 195,692,781 187,257,434 (8,435,347) 104.5% 47,405,874 (17.79%)January 1, 2012 183,980,665 195,536,152 11,555,487 94.1% 48,836,721 23.66%
Pension Plan
Unfunded Actuarial Actuarial UAAL as a
Actuarial Accrued Accrued PercentageValuation Value of Liability Liability Funded Covered of Covered
Date Assets (AAL) (UAAL) Ratio Payroll Payroll(a) (b) (b-a) (a)/(b) (c) [(b)-(a)]/(c)
January 1, 2008 -$ 108,329,141$ 108,329,141$ 0% 31,234,509$ 346.8%January 1, 2009 14,593,487 100,726,738 86,133,251 14% 31,846,091 270.5%January 1, 2010 21,275,643 58,475,364 37,199,721 36% 30,069,028 123.7%January 1, 2011 40,749,815 64,289,254 23,539,439 63% 28,878,791 81.5%January 1, 2012 37,907,357 61,603,466 23,696,109 62% 28,269,123 83.8%
Other Post-Employment Benefits (OPEB)
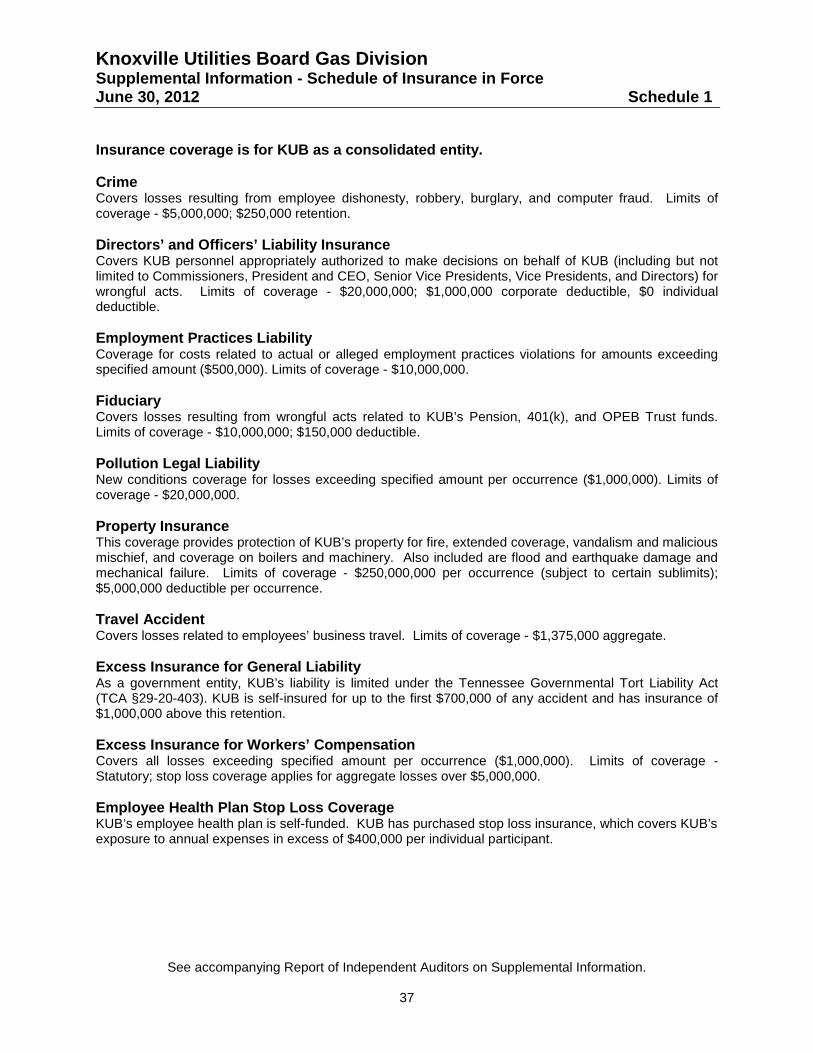
Knoxville Utilities Board Gas Division Supplemental Information - Schedule of Insurance in Force June 30, 2012 Schedule 1
See accompanying Report of Independent Auditors on Supplemental Information.
37
Insurance coverage is for KUB as a consolidated entity. Crime Covers losses resulting from employee dishonesty, robbery, burglary, and computer fraud. Limits of coverage - $5,000,000; $250,000 retention. Directors’ and Officers’ Liability Insurance Covers KUB personnel appropriately authorized to make decisions on behalf of KUB (including but not limited to Commissioners, President and CEO, Senior Vice Presidents, Vice Presidents, and Directors) for wrongful acts. Limits of coverage - $20,000,000; $1,000,000 corporate deductible, $0 individual deductible. Employment Practices Liability Coverage for costs related to actual or alleged employment practices violations for amounts exceeding specified amount ($500,000). Limits of coverage - $10,000,000. Fiduciary Covers losses resulting from wrongful acts related to KUB’s Pension, 401(k), and OPEB Trust funds. Limits of coverage - $10,000,000; $150,000 deductible. Pollution Legal Liability New conditions coverage for losses exceeding specified amount per occurrence ($1,000,000). Limits of coverage - $20,000,000. Property Insurance This coverage provides protection of KUB’s property for fire, extended coverage, vandalism and malicious mischief, and coverage on boilers and machinery. Also included are flood and earthquake damage and mechanical failure. Limits of coverage - $250,000,000 per occurrence (subject to certain sublimits); $5,000,000 deductible per occurrence. Travel Accident Covers losses related to employees’ business travel. Limits of coverage - $1,375,000 aggregate. Excess Insurance for General Liability As a government entity, KUB’s liability is limited under the Tennessee Governmental Tort Liability Act (TCA §29-20-403). KUB is self-insured for up to the first $700,000 of any accident and has insurance of $1,000,000 above this retention. Excess Insurance for Workers’ Compensation Covers all losses exceeding specified amount per occurrence ($1,000,000). Limits of coverage - Statutory; stop loss coverage applies for aggregate losses over $5,000,000. Employee Health Plan Stop Loss Coverage KUB’s employee health plan is self-funded. KUB has purchased stop loss insurance, which covers KUB’s exposure to annual expenses in excess of $400,000 per individual participant.
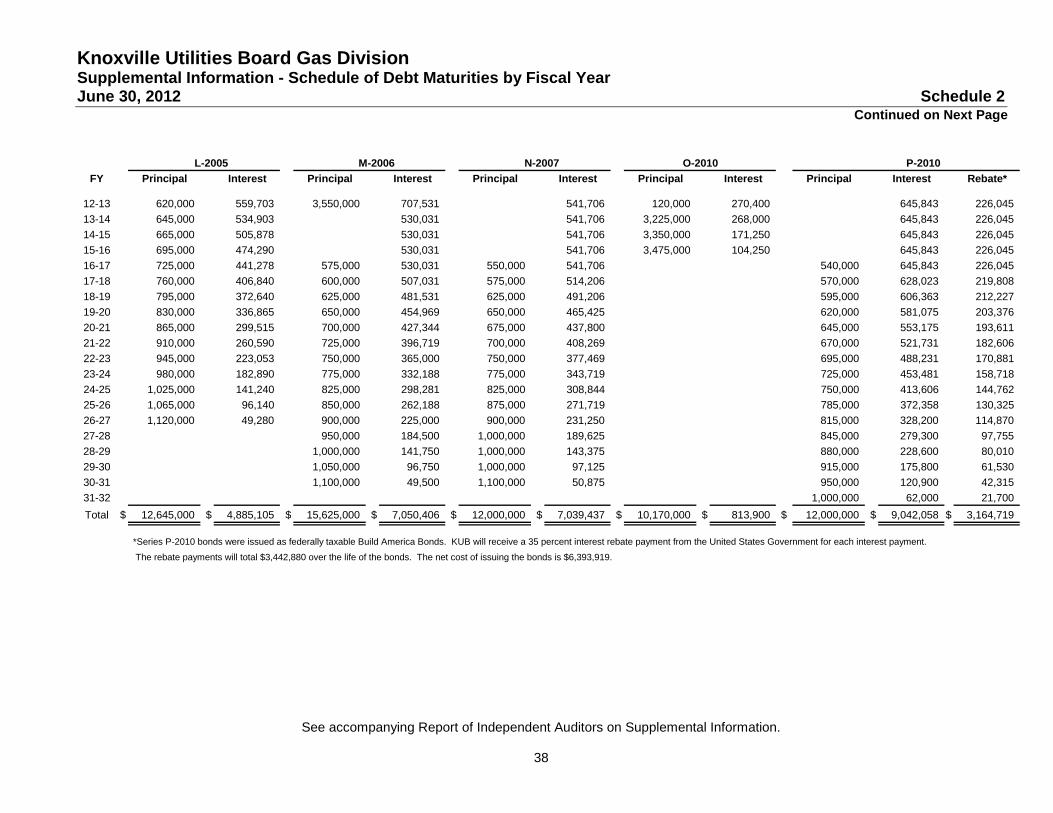
Knoxville Utilities Board Gas Division Supplemental Information - Schedule of Debt Maturities by Fiscal Year June 30, 2012 Schedule 2
See accompanying Report of Independent Auditors on Supplemental Information.
38
Continued on Next Page
L-2005 M-2006 N-2007 P-2010FY Principal Interest Principal Interest Principal Interest Principal Interest Principal Interest Rebate*
12-13 620,000 559,703 3,550,000 707,531 541,706 120,000 270,400 645,843 226,045 13-14 645,000 534,903 530,031 541,706 3,225,000 268,000 645,843 226,045 14-15 665,000 505,878 530,031 541,706 3,350,000 171,250 645,843 226,045 15-16 695,000 474,290 530,031 541,706 3,475,000 104,250 645,843 226,045 16-17 725,000 441,278 575,000 530,031 550,000 541,706 540,000 645,843 226,045 17-18 760,000 406,840 600,000 507,031 575,000 514,206 570,000 628,023 219,808 18-19 795,000 372,640 625,000 481,531 625,000 491,206 595,000 606,363 212,227 19-20 830,000 336,865 650,000 454,969 650,000 465,425 620,000 581,075 203,376 20-21 865,000 299,515 700,000 427,344 675,000 437,800 645,000 553,175 193,611 21-22 910,000 260,590 725,000 396,719 700,000 408,269 670,000 521,731 182,606 22-23 945,000 223,053 750,000 365,000 750,000 377,469 695,000 488,231 170,881 23-24 980,000 182,890 775,000 332,188 775,000 343,719 725,000 453,481 158,718 24-25 1,025,000 141,240 825,000 298,281 825,000 308,844 750,000 413,606 144,762 25-26 1,065,000 96,140 850,000 262,188 875,000 271,719 785,000 372,358 130,325 26-27 1,120,000 49,280 900,000 225,000 900,000 231,250 815,000 328,200 114,870 27-28 950,000 184,500 1,000,000 189,625 845,000 279,300 97,755 28-29 1,000,000 141,750 1,000,000 143,375 880,000 228,600 80,010 29-30 1,050,000 96,750 1,000,000 97,125 915,000 175,800 61,530 30-31 1,100,000 49,500 1,100,000 50,875 950,000 120,900 42,315 31-32 1,000,000 62,000 21,700 Total $ 12,645,000 $ 4,885,105 $ 15,625,000 $ 7,050,406 $ 12,000,000 $ 7,039,437 $ 10,170,000 $ 813,900 $ 12,000,000 $ 9,042,058 $ 3,164,719
*Series P-2010 bonds were issued as federally taxable Build America Bonds. KUB will receive a 35 percent interest rebate payment from the United States Government for each interest payment.
The rebate payments will total $3,442,880 over the life of the bonds. The net cost of issuing the bonds is $6,393,919.
O-2010
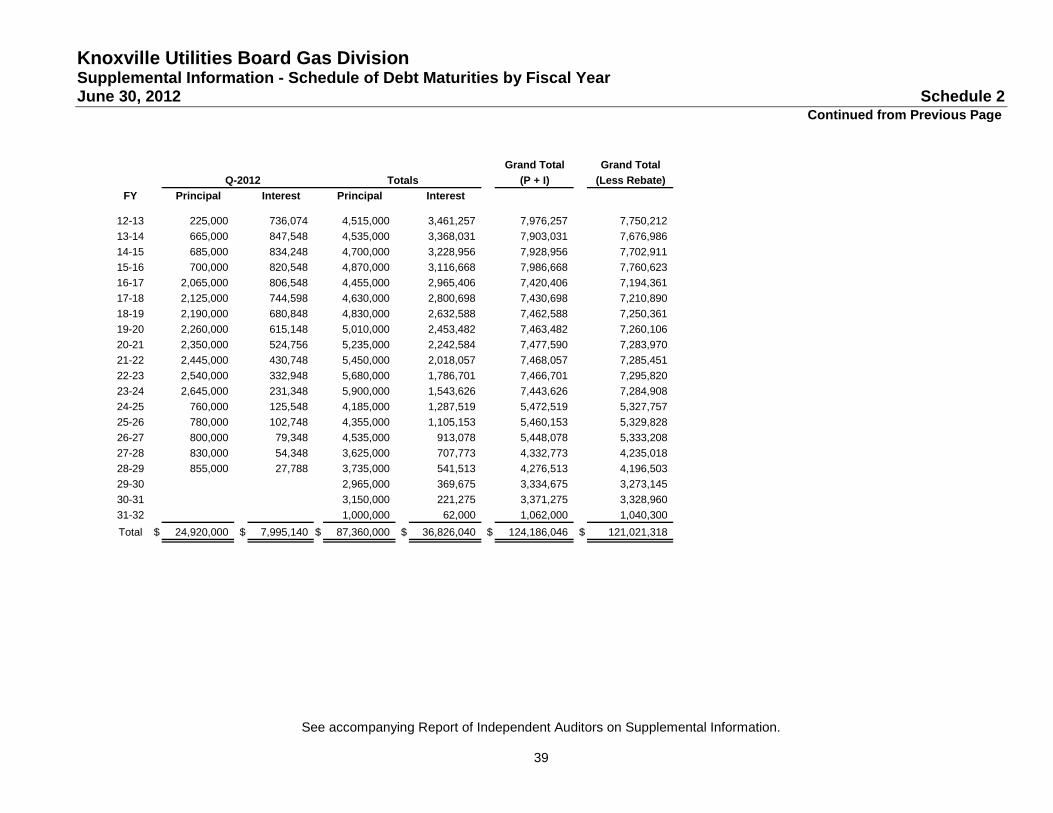
Knoxville Utilities Board Gas Division Supplemental Information - Schedule of Debt Maturities by Fiscal Year June 30, 2012 Schedule 2
See accompanying Report of Independent Auditors on Supplemental Information.
39
Continued from Previous Page
Grand Total Grand TotalQ-2012 (P + I) (Less Rebate)
FY Principal Interest Principal Interest
12-13 225,000 736,074 4,515,000 3,461,257 7,976,257 7,750,21213-14 665,000 847,548 4,535,000 3,368,031 7,903,031 7,676,98614-15 685,000 834,248 4,700,000 3,228,956 7,928,956 7,702,91115-16 700,000 820,548 4,870,000 3,116,668 7,986,668 7,760,62316-17 2,065,000 806,548 4,455,000 2,965,406 7,420,406 7,194,36117-18 2,125,000 744,598 4,630,000 2,800,698 7,430,698 7,210,89018-19 2,190,000 680,848 4,830,000 2,632,588 7,462,588 7,250,36119-20 2,260,000 615,148 5,010,000 2,453,482 7,463,482 7,260,10620-21 2,350,000 524,756 5,235,000 2,242,584 7,477,590 7,283,97021-22 2,445,000 430,748 5,450,000 2,018,057 7,468,057 7,285,45122-23 2,540,000 332,948 5,680,000 1,786,701 7,466,701 7,295,82023-24 2,645,000 231,348 5,900,000 1,543,626 7,443,626 7,284,90824-25 760,000 125,548 4,185,000 1,287,519 5,472,519 5,327,75725-26 780,000 102,748 4,355,000 1,105,153 5,460,153 5,329,82826-27 800,000 79,348 4,535,000 913,078 5,448,078 5,333,20827-28 830,000 54,348 3,625,000 707,773 4,332,773 4,235,01828-29 855,000 27,788 3,735,000 541,513 4,276,513 4,196,50329-30 2,965,000 369,675 3,334,675 3,273,14530-31 3,150,000 221,275 3,371,275 3,328,96031-32 1,000,000 62,000 1,062,000 1,040,300Total $ 24,920,000 $ 7,995,140 $ 87,360,000 $ 36,826,040 $ 124,186,046 $ 121,021,318
Totals
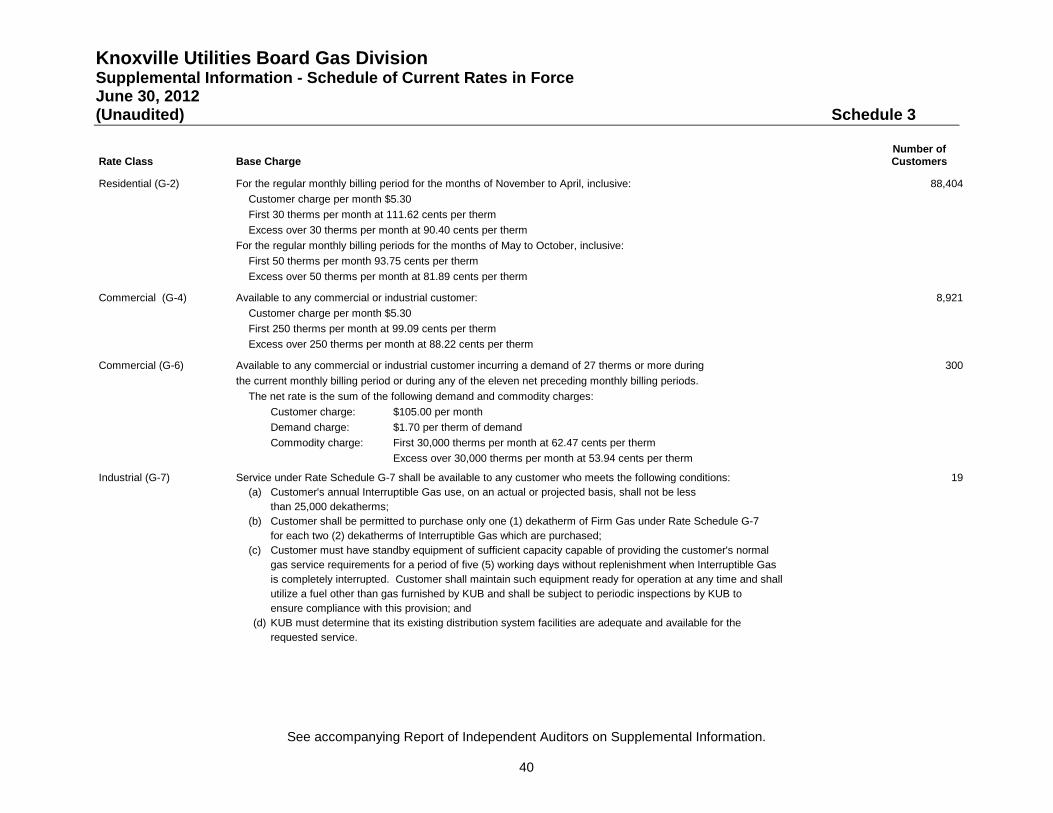
Knoxville Utilities Board Gas Division Supplemental Information - Schedule of Current Rates in Force June 30, 2012 (Unaudited) Schedule 3
See accompanying Report of Independent Auditors on Supplemental Information.
40
Number ofRate Class Base Charge Customers
Residential (G-2) For the regular monthly billing period for the months of November to April, inclusive: 88,404Customer charge per month $5.30First 30 therms per month at 111.62 cents per thermExcess over 30 therms per month at 90.40 cents per therm
For the regular monthly billing periods for the months of May to October, inclusive:First 50 therms per month 93.75 cents per thermExcess over 50 therms per month at 81.89 cents per therm
Commercial (G-4) Available to any commercial or industrial customer: 8,921Customer charge per month $5.30First 250 therms per month at 99.09 cents per thermExcess over 250 therms per month at 88.22 cents per therm
Commercial (G-6) Available to any commercial or industrial customer incurring a demand of 27 therms or more during 300the current monthly billing period or during any of the eleven net preceding monthly billing periods.
The net rate is the sum of the following demand and commodity charges:Customer charge: $105.00 per monthDemand charge: $1.70 per therm of demandCommodity charge: First 30,000 therms per month at 62.47 cents per therm
Excess over 30,000 therms per month at 53.94 cents per therm
Industrial (G-7) Service under Rate Schedule G-7 shall be available to any customer who meets the following conditions: 19 (a) Customer's annual Interruptible Gas use, on an actual or projected basis, shall not be less
than 25,000 dekatherms;(b) Customer shall be permitted to purchase only one (1) dekatherm of Firm Gas under Rate Schedule G-7
for each two (2) dekatherms of Interruptible Gas which are purchased;(c) Customer must have standby equipment of sufficient capacity capable of providing the customer's normal
gas service requirements for a period of five (5) working days without replenishment when Interruptible Gas is completely interrupted. Customer shall maintain such equipment ready for operation at any time and shall utilize a fuel other than gas furnished by KUB and shall be subject to periodic inspections by KUB to ensure compliance with this provision; and
(d) KUB must determine that its existing distribution system facilities are adequate and available for the requested service.
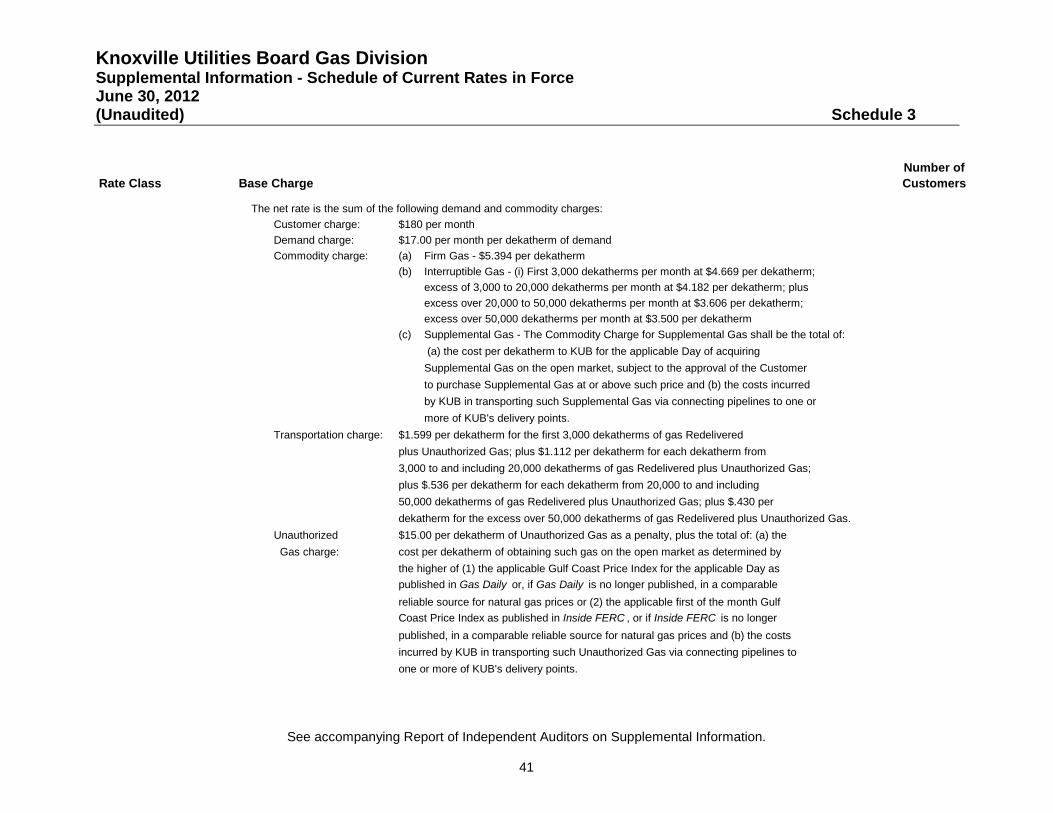
Knoxville Utilities Board Gas Division Supplemental Information - Schedule of Current Rates in Force June 30, 2012 (Unaudited) Schedule 3
See accompanying Report of Independent Auditors on Supplemental Information.
41
Number ofRate Class Base Charge Customers
The net rate is the sum of the following demand and commodity charges:Customer charge: $180 per monthDemand charge: $17.00 per month per dekatherm of demandCommodity charge: (a) Firm Gas - $5.394 per dekatherm
(b) Interruptible Gas - (i) First 3,000 dekatherms per month at $4.669 per dekatherm;excess of 3,000 to 20,000 dekatherms per month at $4.182 per dekatherm; plusexcess over 20,000 to 50,000 dekatherms per month at $3.606 per dekatherm;excess over 50,000 dekatherms per month at $3.500 per dekatherm
(c) Supplemental Gas - The Commodity Charge for Supplemental Gas shall be the total of: (a) the cost per dekatherm to KUB for the applicable Day of acquiringSupplemental Gas on the open market, subject to the approval of the Customerto purchase Supplemental Gas at or above such price and (b) the costs incurredby KUB in transporting such Supplemental Gas via connecting pipelines to one ormore of KUB's delivery points.
Transportation charge: $1.599 per dekatherm for the first 3,000 dekatherms of gas Redelivered plus Unauthorized Gas; plus $1.112 per dekatherm for each dekatherm from 3,000 to and including 20,000 dekatherms of gas Redelivered plus Unauthorized Gas;plus $.536 per dekatherm for each dekatherm from 20,000 to and including 50,000 dekatherms of gas Redelivered plus Unauthorized Gas; plus $.430 per dekatherm for the excess over 50,000 dekatherms of gas Redelivered plus Unauthorized Gas.
Unauthorized $15.00 per dekatherm of Unauthorized Gas as a penalty, plus the total of: (a) the Gas charge: cost per dekatherm of obtaining such gas on the open market as determined by
the higher of (1) the applicable Gulf Coast Price Index for the applicable Day as published in Gas Daily or, if Gas Daily is no longer published, in a comparable reliable source for natural gas prices or (2) the applicable first of the month Gulf Coast Price Index as published in Inside FERC , or if Inside FERC is no longer published, in a comparable reliable source for natural gas prices and (b) the costs incurred by KUB in transporting such Unauthorized Gas via connecting pipelines to one or more of KUB's delivery points.
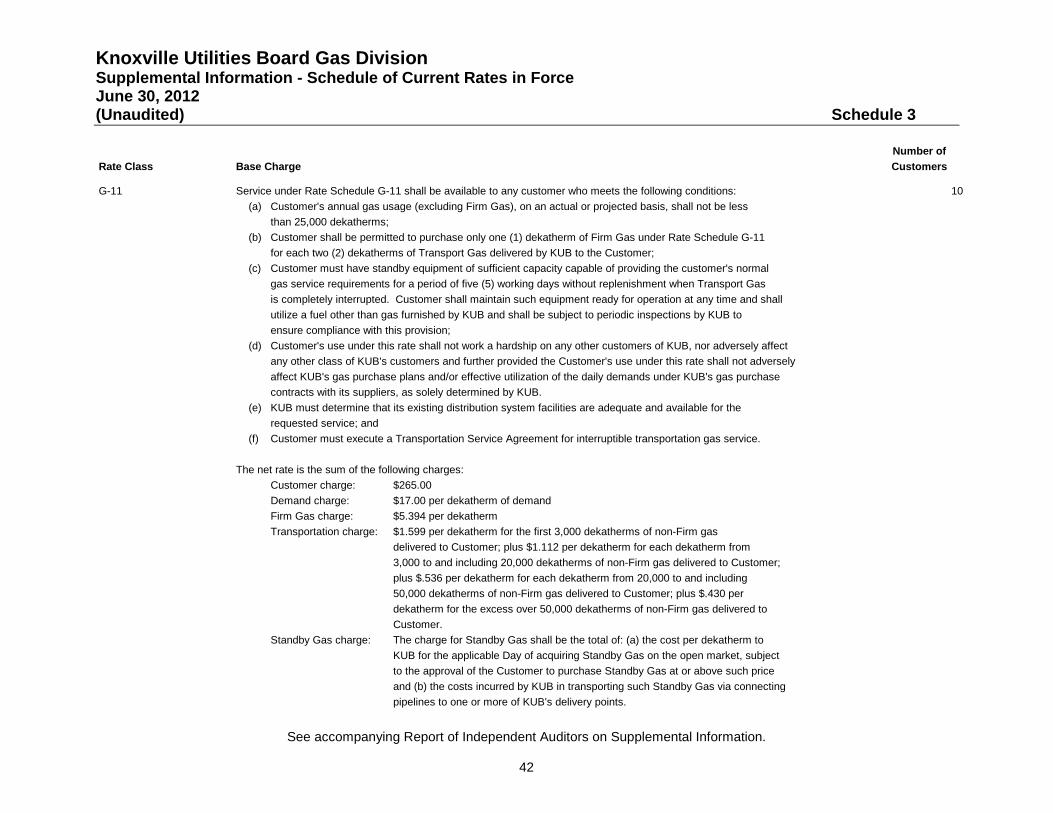
Knoxville Utilities Board Gas Division Supplemental Information - Schedule of Current Rates in Force June 30, 2012 (Unaudited) Schedule 3
See accompanying Report of Independent Auditors on Supplemental Information.
42
Number ofRate Class Base Charge Customers
G-11 Service under Rate Schedule G-11 shall be available to any customer who meets the following conditions: 10 (a) Customer's annual gas usage (excluding Firm Gas), on an actual or projected basis, shall not be less
than 25,000 dekatherms;(b) Customer shall be permitted to purchase only one (1) dekatherm of Firm Gas under Rate Schedule G-11
for each two (2) dekatherms of Transport Gas delivered by KUB to the Customer;(c) Customer must have standby equipment of sufficient capacity capable of providing the customer's normal
gas service requirements for a period of five (5) working days without replenishment when Transport Gas is completely interrupted. Customer shall maintain such equipment ready for operation at any time and shall utilize a fuel other than gas furnished by KUB and shall be subject to periodic inspections by KUB to ensure compliance with this provision;
(d) Customer's use under this rate shall not work a hardship on any other customers of KUB, nor adversely affectany other class of KUB's customers and further provided the Customer's use under this rate shall not adverselyaffect KUB's gas purchase plans and/or effective utilization of the daily demands under KUB's gas purchasecontracts with its suppliers, as solely determined by KUB.
(e) KUB must determine that its existing distribution system facilities are adequate and available for the requested service; and
(f) Customer must execute a Transportation Service Agreement for interruptible transportation gas service.
The net rate is the sum of the following charges:Customer charge: $265.00Demand charge: $17.00 per dekatherm of demandFirm Gas charge: $5.394 per dekathermTransportation charge: $1.599 per dekatherm for the first 3,000 dekatherms of non-Firm gas
delivered to Customer; plus $1.112 per dekatherm for each dekatherm from 3,000 to and including 20,000 dekatherms of non-Firm gas delivered to Customer;plus $.536 per dekatherm for each dekatherm from 20,000 to and including 50,000 dekatherms of non-Firm gas delivered to Customer; plus $.430 per dekatherm for the excess over 50,000 dekatherms of non-Firm gas delivered to Customer.
Standby Gas charge: The charge for Standby Gas shall be the total of: (a) the cost per dekatherm to KUB for the applicable Day of acquiring Standby Gas on the open market, subject to the approval of the Customer to purchase Standby Gas at or above such price and (b) the costs incurred by KUB in transporting such Standby Gas via connecting pipelines to one or more of KUB's delivery points.
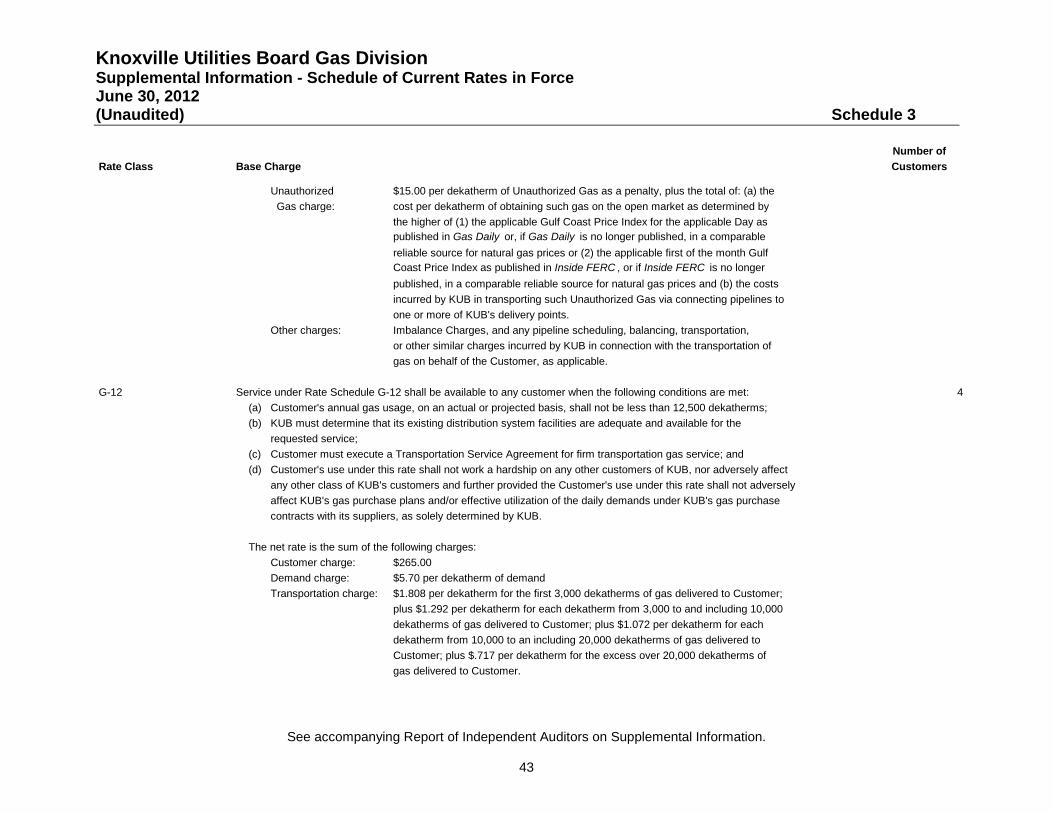
Knoxville Utilities Board Gas Division Supplemental Information - Schedule of Current Rates in Force June 30, 2012 (Unaudited) Schedule 3
See accompanying Report of Independent Auditors on Supplemental Information.
43
Number ofRate Class Base Charge Customers
Unauthorized $15.00 per dekatherm of Unauthorized Gas as a penalty, plus the total of: (a) the Gas charge: cost per dekatherm of obtaining such gas on the open market as determined by
the higher of (1) the applicable Gulf Coast Price Index for the applicable Day as published in Gas Daily or, if Gas Daily is no longer published, in a comparable reliable source for natural gas prices or (2) the applicable first of the month Gulf Coast Price Index as published in Inside FERC , or if Inside FERC is no longer published, in a comparable reliable source for natural gas prices and (b) the costs incurred by KUB in transporting such Unauthorized Gas via connecting pipelines to one or more of KUB's delivery points.
Other charges: Imbalance Charges, and any pipeline scheduling, balancing, transportation, or other similar charges incurred by KUB in connection with the transportation of gas on behalf of the Customer, as applicable.
G-12 Service under Rate Schedule G-12 shall be available to any customer when the following conditions are met: 4(a) Customer's annual gas usage, on an actual or projected basis, shall not be less than 12,500 dekatherms;(b) KUB must determine that its existing distribution system facilities are adequate and available for the
requested service;(c) Customer must execute a Transportation Service Agreement for firm transportation gas service; and(d) Customer's use under this rate shall not work a hardship on any other customers of KUB, nor adversely affect
any other class of KUB's customers and further provided the Customer's use under this rate shall not adverselyaffect KUB's gas purchase plans and/or effective utilization of the daily demands under KUB's gas purchasecontracts with its suppliers, as solely determined by KUB.
The net rate is the sum of the following charges:Customer charge: $265.00Demand charge: $5.70 per dekatherm of demandTransportation charge: $1.808 per dekatherm for the first 3,000 dekatherms of gas delivered to Customer;
plus $1.292 per dekatherm for each dekatherm from 3,000 to and including 10,000dekatherms of gas delivered to Customer; plus $1.072 per dekatherm for eachdekatherm from 10,000 to an including 20,000 dekatherms of gas delivered toCustomer; plus $.717 per dekatherm for the excess over 20,000 dekatherms ofgas delivered to Customer.
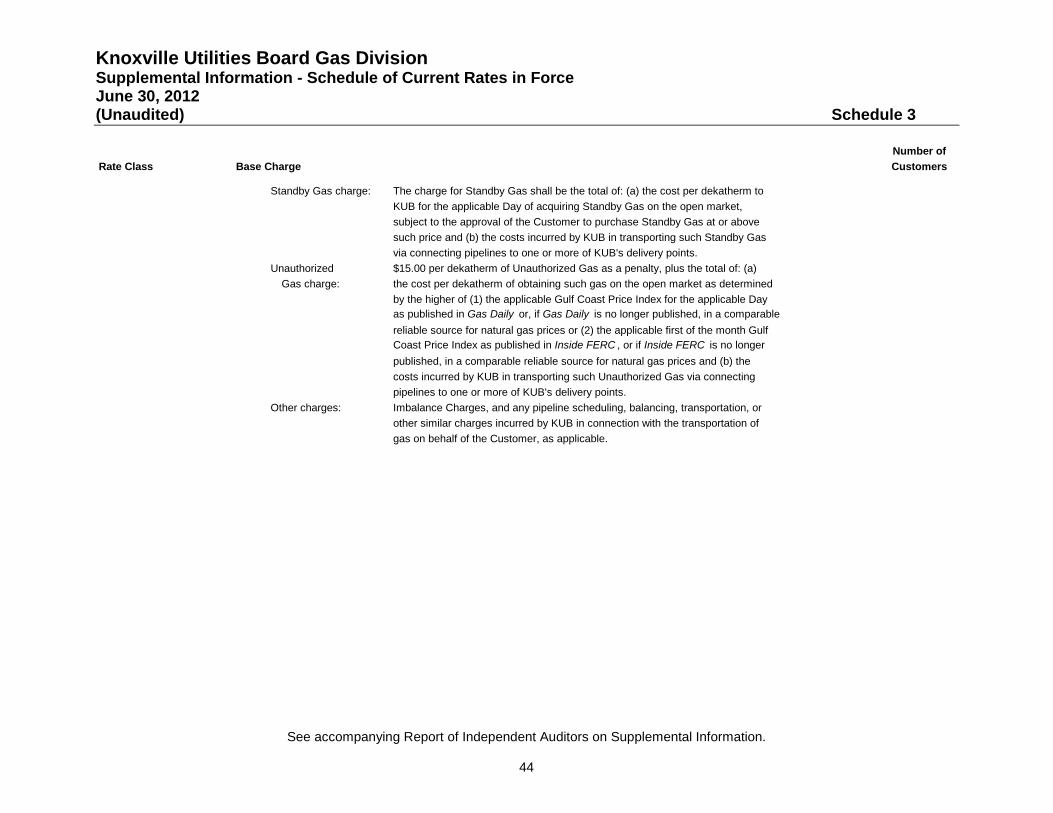
Knoxville Utilities Board Gas Division Supplemental Information - Schedule of Current Rates in Force June 30, 2012 (Unaudited) Schedule 3
See accompanying Report of Independent Auditors on Supplemental Information.
44
Number ofRate Class Base Charge Customers
Standby Gas charge: The charge for Standby Gas shall be the total of: (a) the cost per dekatherm toKUB for the applicable Day of acquiring Standby Gas on the open market,subject to the approval of the Customer to purchase Standby Gas at or abovesuch price and (b) the costs incurred by KUB in transporting such Standby Gasvia connecting pipelines to one or more of KUB's delivery points.
Unauthorized $15.00 per dekatherm of Unauthorized Gas as a penalty, plus the total of: (a)Gas charge: the cost per dekatherm of obtaining such gas on the open market as determined
by the higher of (1) the applicable Gulf Coast Price Index for the applicable Dayas published in Gas Daily or, if Gas Daily is no longer published, in a comparablereliable source for natural gas prices or (2) the applicable first of the month GulfCoast Price Index as published in Inside FERC , or if Inside FERC is no longerpublished, in a comparable reliable source for natural gas prices and (b) thecosts incurred by KUB in transporting such Unauthorized Gas via connectingpipelines to one or more of KUB's delivery points.
Other charges: Imbalance Charges, and any pipeline scheduling, balancing, transportation, orother similar charges incurred by KUB in connection with the transportation ofgas on behalf of the Customer, as applicable.
Knoxville Utilities Board Water Division Financial Statements and Supplemental Information June 30, 2012 and 2011
Knoxville Utilities Board Water Division Index June 30, 2012 and 2011 Page(s)
Independent Auditors’ Report ................................................................................................ 1-2
Management’s Discussion and Analysis .................................................................................. 3-18
Financial Statements
Statements of Net Assets ...................................................................................................... 19-20
Statements of Revenues, Expenses and Changes in Net Assets .............................................. 21
Statements of Cash Flows .......................................................................................................... 22
Notes to Financial Statements ............................................................................................... 23-36
Required Supplementary Information – Schedule of Funding Progress ..................................... 37
Supplemental Information
Schedule 1 – Schedule of Insurance in Force ............................................................................ 38
Schedule 2 – Schedule of Debt Maturities by Fiscal Year ..................................................... 39-40
Schedule 3 – Schedule of Current Rates in Force ................................................................. 41-42
Schedule 4 – Schedule of Unaccounted for Water ..................................................................... 43
Schedule 5 – Schedule of Expenditures of Federal Awards ...................................................... 44
Schedule 6 – Schedule of Findings and Questioned Costs ........................................................ 45
Report on Compliance and on Internal Control Over Financial Reporting Based on an Audit of Financial Statements Performed in Accordance With Government Auditing Standards ........................................................................................ 46-47
Report of Independent Auditors Report on Compliance with Requirements that could have a Direct Material Effect on each Major Program and on Internal Control over Compliance in Accordance with OMB Circular A-133 ...................................................... 48-49
Knoxville Utilities Board Water Division Management’s Discussion and Analysis June 30, 2012 and 2011
3
Knoxville Utilities Board (KUB), comprised of the Electric Division, Water Division, Gas Division, and Wastewater Division (Divisions), is reported as a component unit enterprise fund in the financial statements of the City of Knoxville. KUB's responsibility is to oversee the purchase, production, distribution, and processing of electricity, water, natural gas, and wastewater services. A seven-member Board of Commissioners governs KUB. The Board has all powers to construct, acquire, expand, or operate the Divisions. It has full control and complete jurisdiction over the management and operation of the Divisions. The Water Division (Division) provides services to certain customers in Knox County and in two surrounding counties in East Tennessee. The Division's accounts are maintained in conformity with the Uniform System of Accounts of the National Association of Regulatory Utility Commissioners (NARUC) and the Governmental Accounting Standards Board (GASB), as applicable. The financial statements present only the Water Division and do not purport to, and do not, present fairly the consolidated financial position of Knoxville Utilities Board at June 30, 2012 and 2011, and the changes in its financial position for the years then ended in conformity with accounting principles generally accepted in the United States of America. The Division’s discussion and analysis is designed to (a) assist the reader in focusing on significant financial issues, (b) provide an overview of the Division’s financial activity, (c) identify major changes in the Division’s financial position, and (d) identify any financial concerns. The Division’s Management Discussion and Analysis (“MD&A”) focuses on the fiscal year ending June 30, 2012 activities, resulting changes and current known facts, and should be read in conjunction with the Division’s financial statements.
Water Division Highlights System Highlights KUB serves 78,000 water system customers over a 187 square mile service area. KUB maintains 1,325 miles of service mains, 30 storage facilities, 28 booster pump stations, and 1 treatment plant, which provided 12.2 billion gallons of water to KUB’s water customers in fiscal year 2012. Peak day capacity is 61.2 MGD (millions of gallons per day). The average daily flow for fiscal year 2012 was 33.5 million gallons.
Financial Highlights The Division’s net assets increased $4.7 million or 3.3 percent, compared to a $3.7 million increase last fiscal year.
Operating revenue increased $1.1 million or 2.9 percent, the net result of a half year of revenue from a five percent rate increase, which was effective January 2012, and a 0.8 percent decrease in water sales volumes.
Operating expenses increased $0.3 million or 1 percent. Operating and maintenance expenses (“O&M”) were consistent with the prior year. Depreciation expense increased $0.2 million or 4.1 percent. Taxes and tax equivalents were $0.1 million higher than the prior year.
Higher levels of investments, due to proceeds from a $25 million bond issue in December 2011, combined with lower interest rates, resulted in a modest decline in interest income. Interest expense increased $0.4 million, reflecting interest cost on the bonds issued in December 2011.
Capital contributions increased $0.6 million, the result of growth in contributed assets from developers due to new construction in the service area.
Total plant assets (net) increased $9.9 million or 5 percent over the end of the last fiscal year.
Knoxville Utilities Board Water Division Management’s Discussion and Analysis June 30, 2012 and 2011
4
Long-term debt represented 41.6 percent of the Division’s capital structure as of June 30, 2012, as compared to 36.8 percent last year. Capital structure equals long-term debt (which includes the current portion of revenue bonds and notes, as applicable, due to be retired the next fiscal year) plus net assets.
The Division’s bond covenants require a debt service coverage ratio of at least 1.2 times the maximum principal and interest payments over the life of the division’s outstanding bonds. Current year debt coverage for the fiscal year was 2.56. Maximum debt service coverage was 2.13.
Division Highlights KUB added approximately 400 customers to its water system during the fiscal year. System growth over the last three years has been limited in large part due to the economic recession.
The Board of Commissions adopted a five percent rate increase, effective on January 1, 2012 customer bills, to help fund the Century II water program. The Division generated $1 million of additional revenue during the fiscal year as a result of the rate increase. In December 2011, the Division issued $25 million in water system revenue bonds to fund capital system improvements. The Division refunded $10.7 million in outstanding water system revenue bonds at lower interest rates in April 2012. This refunding will provide debt service savings of $1.3 million over the life of the bonds. The typical residential water customer’s average monthly bill was $17.45 for the twelve months ending June 30, 2012. Water sales volumes have been impacted by the use of more efficient appliances and the conservation efforts of customers. As a result, water sales volumes have declined at an annual rate of 0.5 percent over the past decade. Lost and unaccounted for water represented 29.2 percent of total water treated and purchased by KUB for fiscal year 2012. The lost and unaccounted for calculation is reflected on Schedule 4 of Supplemental Information. For fiscal year 2011, the lost and unaccounted for ratio was 30.2 percent. Century II Infrastructure Program
KUB initially launched Century II for the water distribution system in 2007, beginning a phased-in increase in the level of water main replacement that would occur over the next several years. In early 2009, due to the impact of the economic recession on the community and KUB’s customers, KUB temporarily deferred the Century II water program, but maintained its historical level of capital investment in the water system. In April 2011, management provided an updated assessment of the overall condition of each utility system’s infrastructure to the KUB Board, including a recommendation to resume the Century II program for the water system. The water distribution system is an aging system, with approximately 50 percent of the water system consisting of old pipe, including galvanized, cast iron, and cement-lined water main. Although it represents less than half of the water system, older pipe, particularly galvanized main, accounts for approximately 90 percent of water main breaks. As a result of the aging pipe system, the water system’s water loss ratio has increased steadily over the past 20 years to the point where the water system loses approximately 30 percent of the water input into its system from the water plant.
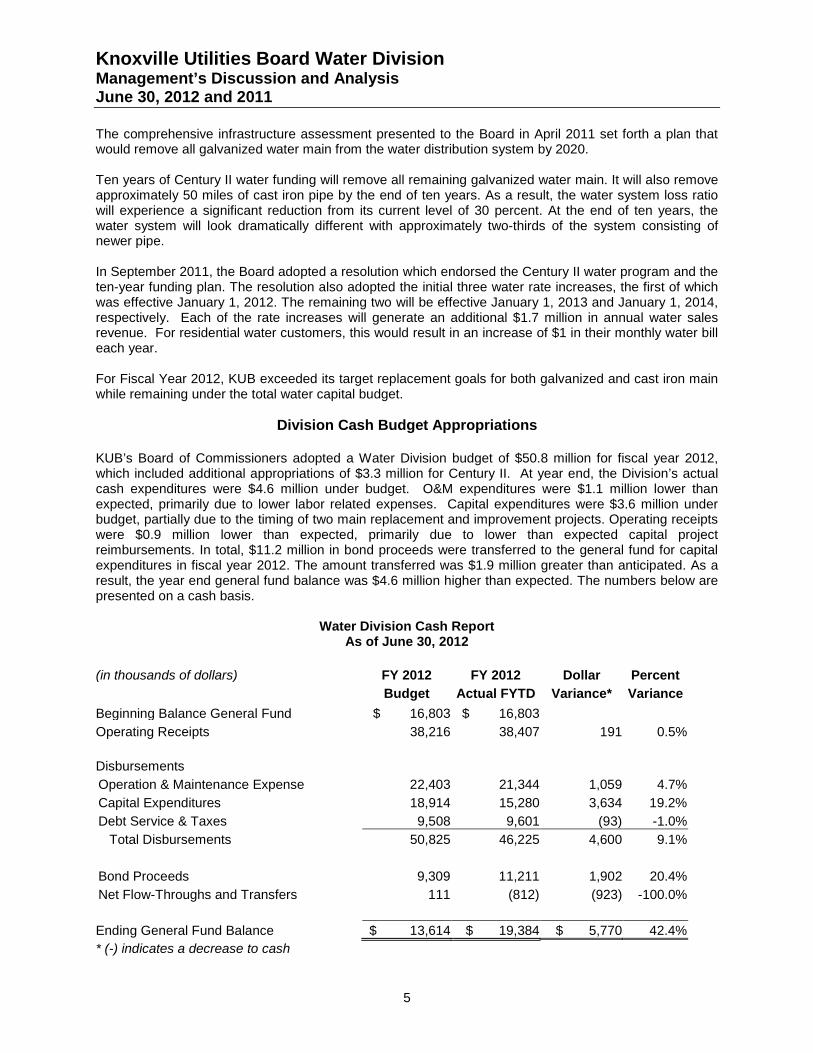
Knoxville Utilities Board Water Division Management’s Discussion and Analysis June 30, 2012 and 2011
5
The comprehensive infrastructure assessment presented to the Board in April 2011 set forth a plan that would remove all galvanized water main from the water distribution system by 2020. Ten years of Century II water funding will remove all remaining galvanized water main. It will also remove approximately 50 miles of cast iron pipe by the end of ten years. As a result, the water system loss ratio will experience a significant reduction from its current level of 30 percent. At the end of ten years, the water system will look dramatically different with approximately two-thirds of the system consisting of newer pipe. In September 2011, the Board adopted a resolution which endorsed the Century II water program and the ten-year funding plan. The resolution also adopted the initial three water rate increases, the first of which was effective January 1, 2012. The remaining two will be effective January 1, 2013 and January 1, 2014, respectively. Each of the rate increases will generate an additional $1.7 million in annual water sales revenue. For residential water customers, this would result in an increase of $1 in their monthly water bill each year. For Fiscal Year 2012, KUB exceeded its target replacement goals for both galvanized and cast iron main while remaining under the total water capital budget.
Division Cash Budget Appropriations KUB’s Board of Commissioners adopted a Water Division budget of $50.8 million for fiscal year 2012, which included additional appropriations of $3.3 million for Century II. At year end, the Division’s actual cash expenditures were $4.6 million under budget. O&M expenditures were $1.1 million lower than expected, primarily due to lower labor related expenses. Capital expenditures were $3.6 million under budget, partially due to the timing of two main replacement and improvement projects. Operating receipts were $0.9 million lower than expected, primarily due to lower than expected capital project reimbursements. In total, $11.2 million in bond proceeds were transferred to the general fund for capital expenditures in fiscal year 2012. The amount transferred was $1.9 million greater than anticipated. As a result, the year end general fund balance was $4.6 million higher than expected. The numbers below are presented on a cash basis.
Water Division Cash Report As of June 30, 2012
(in thousands of dollars) FY 2012 FY 2012 Dollar Percent
Budget Actual FYTD Variance* Variance Beginning Balance General Fund $ 16,803 $ 16,803 Operating Receipts 38,216 38,407 191 0.5% Disbursements Operation & Maintenance Expense 22,403 21,344 1,059 4.7% Capital Expenditures 18,914 15,280 3,634 19.2% Debt Service & Taxes 9,508 9,601 (93) -1.0% Total Disbursements 50,825 46,225 4,600 9.1% Bond Proceeds 9,309 11,211 1,902 20.4% Net Flow-Throughs and Transfers 111 (812) (923) -100.0% Ending General Fund Balance $ 13,614 $ 19,384 $ 5,770 42.4% * (-) indicates a decrease to cash
Knoxville Utilities Board Water Division Management’s Discussion and Analysis June 30, 2012 and 2011
6
KUB, Water Division, Financial Statements The Division’s financial performance is reported under three basic financial statements: the Statement of Net Assets; the Statement of Revenues, Expenses, and Changes in Net Assets; and the Statement of Cash Flows. Statement of Net Assets The Division reports its assets, liabilities, and net assets in the Statement of Net Assets. Assets are classified as current, restricted, water plant in service, or other assets. Liabilities are classified as current, other, or long-term debt. Net assets are classified as invested in capital assets, net of related debt; restricted; or unrestricted. Net assets tell the user what the Division has done with its accumulated earnings, not just the balance. Invested in capital assets, net of related debt, reflects the book value of all capital assets less the outstanding balances of debt used to acquire, construct, or improve those assets. Restricted net assets are assets that have been limited to specific uses by the Division’s bond covenants or through resolutions passed by the KUB Board of Commissioners. Unrestricted net assets are a residual classification; the amount remaining after reporting net assets as either invested in capital or restricted is reported there. Statement of Revenues, Expenses, and Changes in Net Assets The Division reports its revenues and expenses (both operating and non-operating) on the Statement of Revenues, Expenses, and Changes in Net Assets. In addition, any capital contributions or assets donated by developers are reported on this statement. Total revenue less total expense equals the change in net assets for the reporting period. Net assets at the beginning of the period are increased or decreased, as applicable, by the change in net assets for the reporting period. The change in net assets for the reporting period is added to the net assets segment of the Statement of Net Assets. Statement of Cash Flows The Division reports cash flows from operating activities, capital and related-financing activities, and investing activities on the Statement of Cash Flows. This statement tells the user the Division’s sources and uses of cash during the reporting period. The statement indicates the Division’s beginning cash balance and ending cash balance and the means by which it was either increased or decreased during the reporting period. The statement also reconciles cash flow to operating income as it appears on the Statement of Revenues, Expenses, and Changes in Net Assets.
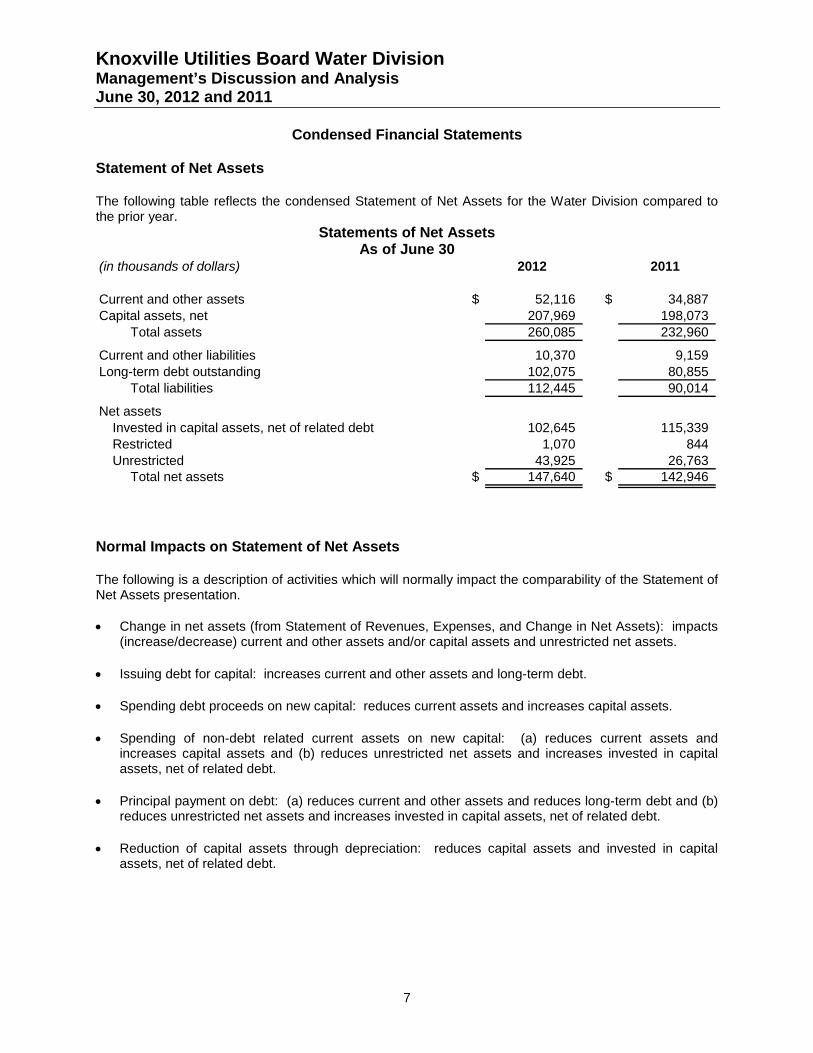
Knoxville Utilities Board Water Division Management’s Discussion and Analysis June 30, 2012 and 2011
7
Condensed Financial Statements Statement of Net Assets The following table reflects the condensed Statement of Net Assets for the Water Division compared to the prior year.
Statements of Net Assets As of June 30
(in thousands of dollars) 2012 2011
Current and other assets $ 52,116 $ 34,887 Capital assets, net 207,969 198,073
Total assets 260,085 232,960
Current and other liabilities 10,370 9,159 Long-term debt outstanding 102,075 80,855
Total liabilities 112,445 90,014
Net assetsInvested in capital assets, net of related debt 102,645 115,339 Restricted 1,070 844 Unrestricted 43,925 26,763
Total net assets $ 147,640 $ 142,946
Normal Impacts on Statement of Net Assets The following is a description of activities which will normally impact the comparability of the Statement of Net Assets presentation. • Change in net assets (from Statement of Revenues, Expenses, and Change in Net Assets): impacts
(increase/decrease) current and other assets and/or capital assets and unrestricted net assets.
• Issuing debt for capital: increases current and other assets and long-term debt.
• Spending debt proceeds on new capital: reduces current assets and increases capital assets.
• Spending of non-debt related current assets on new capital: (a) reduces current assets and increases capital assets and (b) reduces unrestricted net assets and increases invested in capital assets, net of related debt.
• Principal payment on debt: (a) reduces current and other assets and reduces long-term debt and (b) reduces unrestricted net assets and increases invested in capital assets, net of related debt.
• Reduction of capital assets through depreciation: reduces capital assets and invested in capital assets, net of related debt.
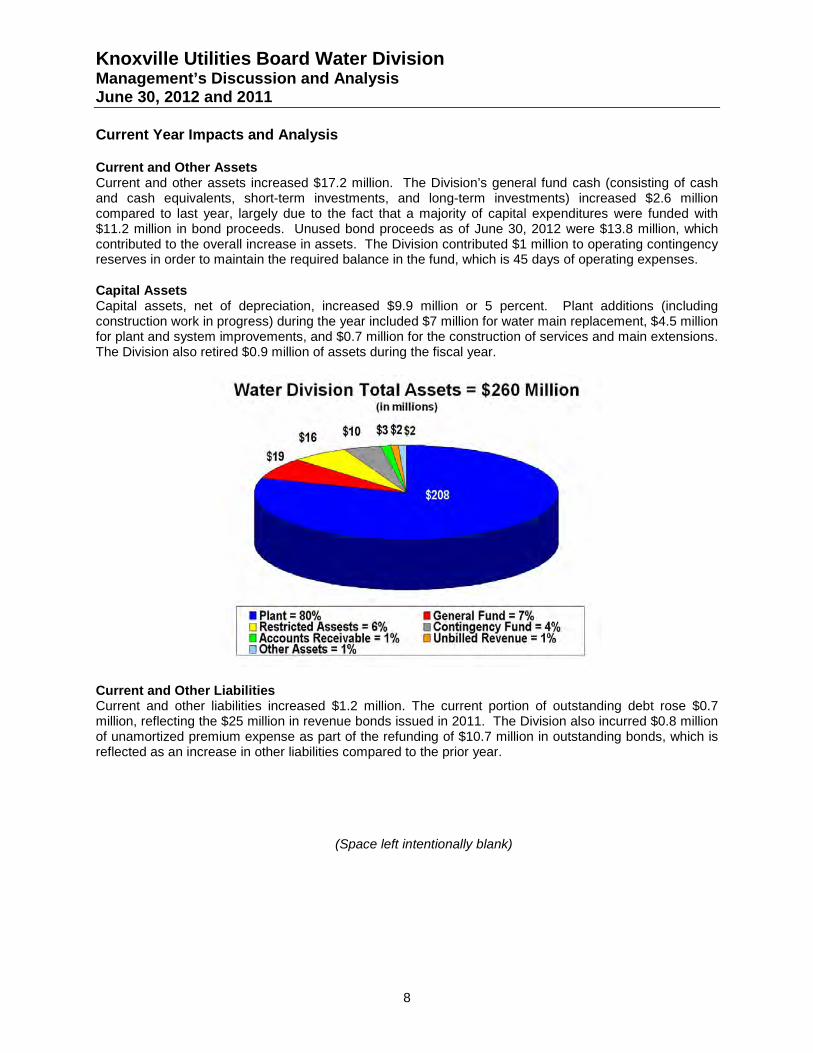
Knoxville Utilities Board Water Division Management’s Discussion and Analysis June 30, 2012 and 2011
8
Current Year Impacts and Analysis Current and Other Assets Current and other assets increased $17.2 million. The Division’s general fund cash (consisting of cash and cash equivalents, short-term investments, and long-term investments) increased $2.6 million compared to last year, largely due to the fact that a majority of capital expenditures were funded with $11.2 million in bond proceeds. Unused bond proceeds as of June 30, 2012 were $13.8 million, which contributed to the overall increase in assets. The Division contributed $1 million to operating contingency reserves in order to maintain the required balance in the fund, which is 45 days of operating expenses.
Capital Assets Capital assets, net of depreciation, increased $9.9 million or 5 percent. Plant additions (including construction work in progress) during the year included $7 million for water main replacement, $4.5 million for plant and system improvements, and $0.7 million for the construction of services and main extensions. The Division also retired $0.9 million of assets during the fiscal year.
Current and Other Liabilities Current and other liabilities increased $1.2 million. The current portion of outstanding debt rose $0.7 million, reflecting the $25 million in revenue bonds issued in 2011. The Division also incurred $0.8 million of unamortized premium expense as part of the refunding of $10.7 million in outstanding bonds, which is reflected as an increase in other liabilities compared to the prior year.
(Space left intentionally blank)
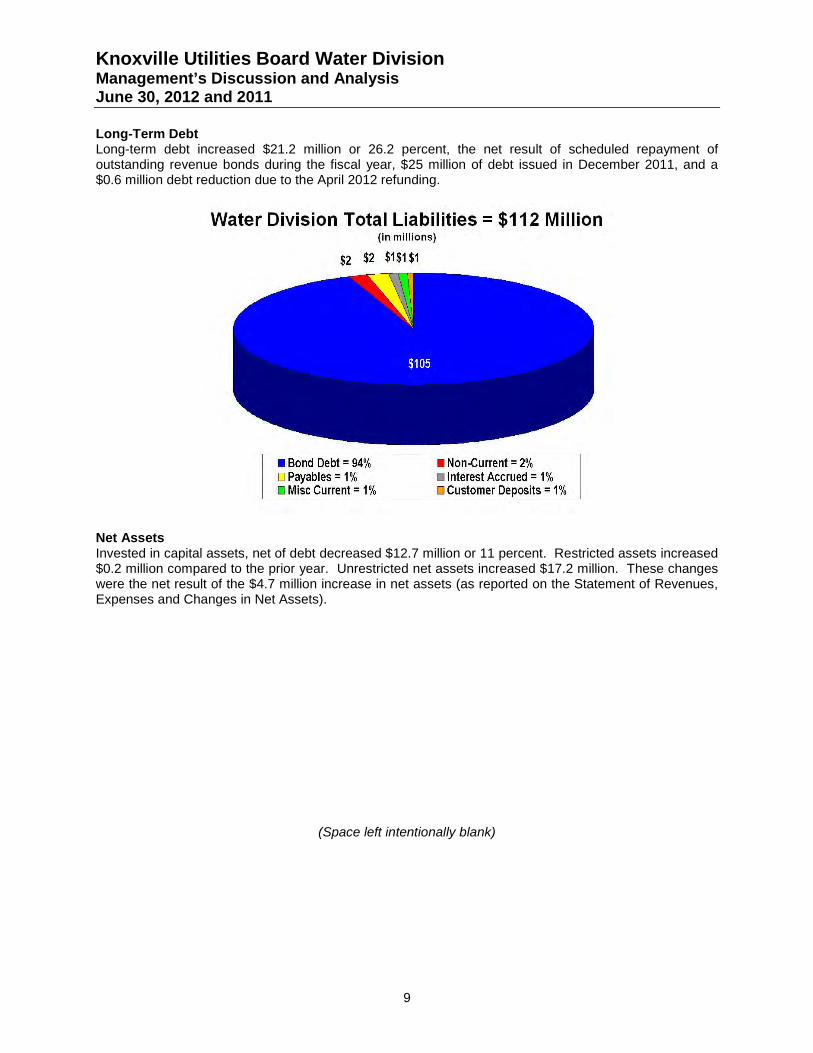
Knoxville Utilities Board Water Division Management’s Discussion and Analysis June 30, 2012 and 2011
9
Long-Term Debt Long-term debt increased $21.2 million or 26.2 percent, the net result of scheduled repayment of outstanding revenue bonds during the fiscal year, $25 million of debt issued in December 2011, and a $0.6 million debt reduction due to the April 2012 refunding.
Net Assets Invested in capital assets, net of debt decreased $12.7 million or 11 percent. Restricted assets increased $0.2 million compared to the prior year. Unrestricted net assets increased $17.2 million. These changes were the net result of the $4.7 million increase in net assets (as reported on the Statement of Revenues, Expenses and Changes in Net Assets).
(Space left intentionally blank)
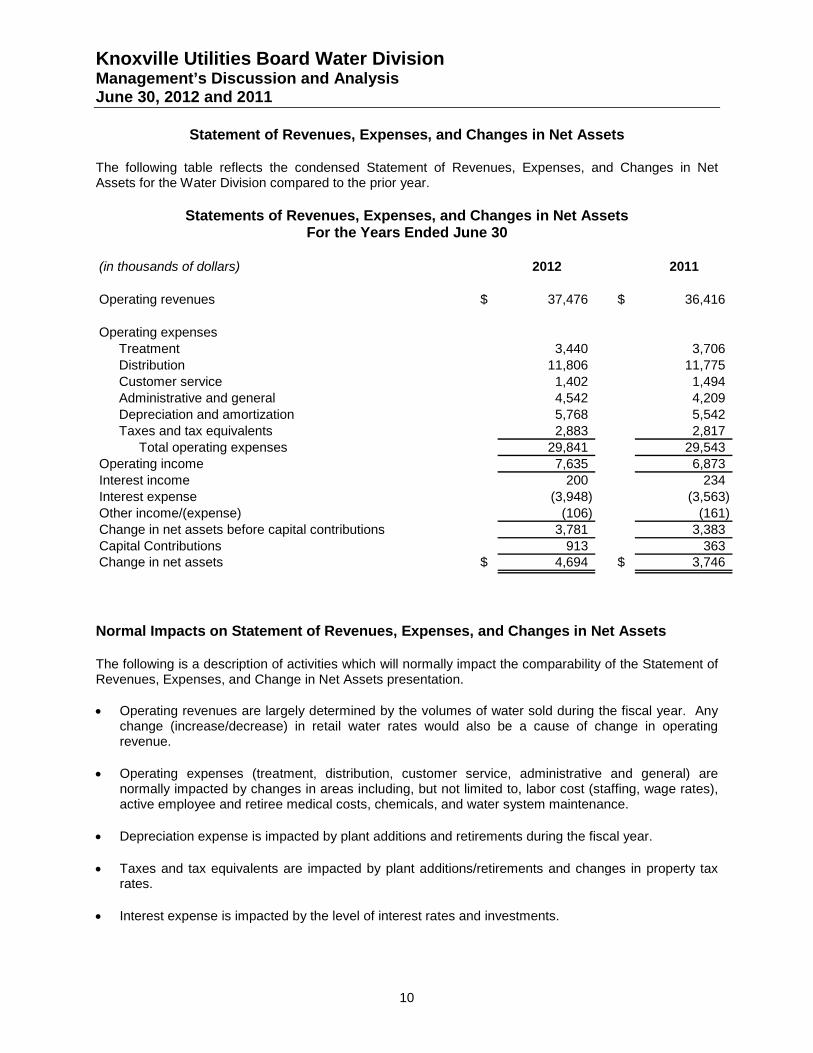
Knoxville Utilities Board Water Division Management’s Discussion and Analysis June 30, 2012 and 2011
10
Statement of Revenues, Expenses, and Changes in Net Assets The following table reflects the condensed Statement of Revenues, Expenses, and Changes in Net Assets for the Water Division compared to the prior year.
Statements of Revenues, Expenses, and Changes in Net Assets For the Years Ended June 30
(in thousands of dollars) 2012 2011
Operating revenues $ 37,476 $ 36,416
Operating expensesTreatment 3,440 3,706 Distribution 11,806 11,775 Customer service 1,402 1,494 Administrative and general 4,542 4,209 Depreciation and amortization 5,768 5,542 Taxes and tax equivalents 2,883 2,817
Total operating expenses 29,841 29,543 Operating income 7,635 6,873 Interest income 200 234 Interest expense (3,948) (3,563) Other income/(expense) (106) (161) Change in net assets before capital contributions 3,781 3,383 Capital Contributions 913 363 Change in net assets $ 4,694 $ 3,746
Normal Impacts on Statement of Revenues, Expenses, and Changes in Net Assets The following is a description of activities which will normally impact the comparability of the Statement of Revenues, Expenses, and Change in Net Assets presentation. • Operating revenues are largely determined by the volumes of water sold during the fiscal year. Any
change (increase/decrease) in retail water rates would also be a cause of change in operating revenue.
• Operating expenses (treatment, distribution, customer service, administrative and general) are normally impacted by changes in areas including, but not limited to, labor cost (staffing, wage rates), active employee and retiree medical costs, chemicals, and water system maintenance.
• Depreciation expense is impacted by plant additions and retirements during the fiscal year.
• Taxes and tax equivalents are impacted by plant additions/retirements and changes in property tax rates.
• Interest expense is impacted by the level of interest rates and investments.
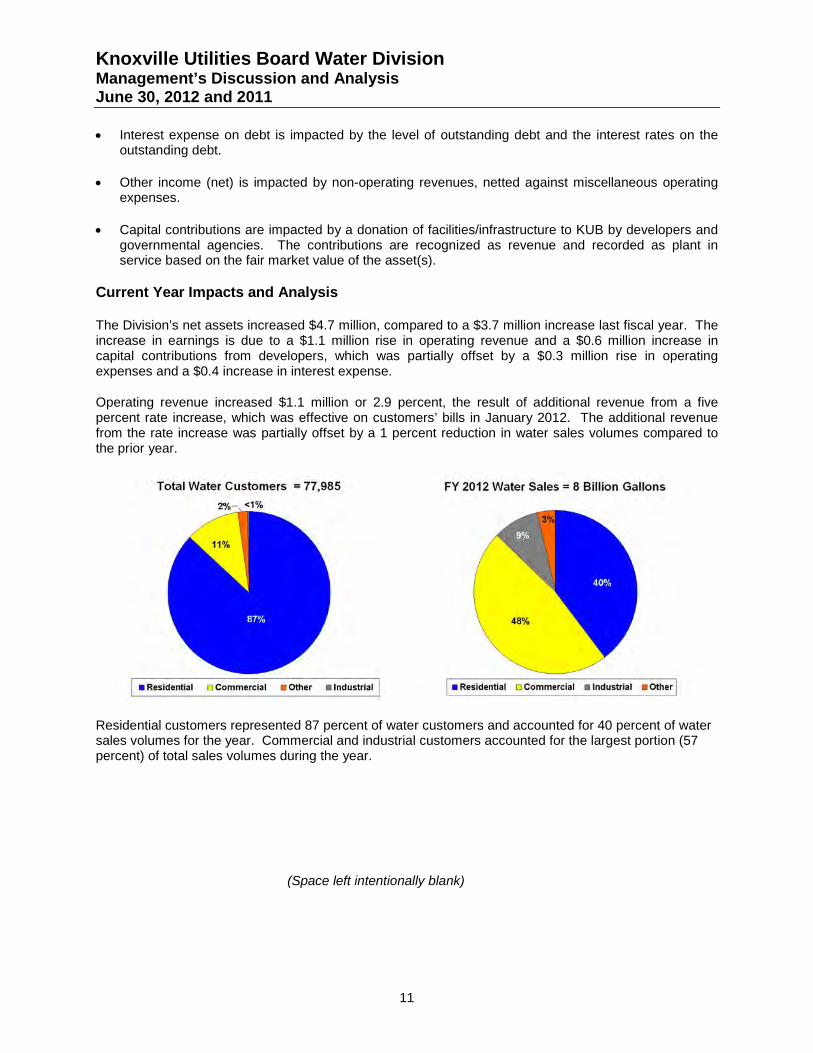
Knoxville Utilities Board Water Division Management’s Discussion and Analysis June 30, 2012 and 2011
11
• Interest expense on debt is impacted by the level of outstanding debt and the interest rates on the outstanding debt.
• Other income (net) is impacted by non-operating revenues, netted against miscellaneous operating expenses.
• Capital contributions are impacted by a donation of facilities/infrastructure to KUB by developers and governmental agencies. The contributions are recognized as revenue and recorded as plant in service based on the fair market value of the asset(s).
Current Year Impacts and Analysis The Division’s net assets increased $4.7 million, compared to a $3.7 million increase last fiscal year. The increase in earnings is due to a $1.1 million rise in operating revenue and a $0.6 million increase in capital contributions from developers, which was partially offset by a $0.3 million rise in operating expenses and a $0.4 increase in interest expense.
Operating revenue increased $1.1 million or 2.9 percent, the result of additional revenue from a five percent rate increase, which was effective on customers’ bills in January 2012. The additional revenue from the rate increase was partially offset by a 1 percent reduction in water sales volumes compared to the prior year.
Residential customers represented 87 percent of water customers and accounted for 40 percent of water sales volumes for the year. Commercial and industrial customers accounted for the largest portion (57 percent) of total sales volumes during the year.
(Space left intentionally blank)
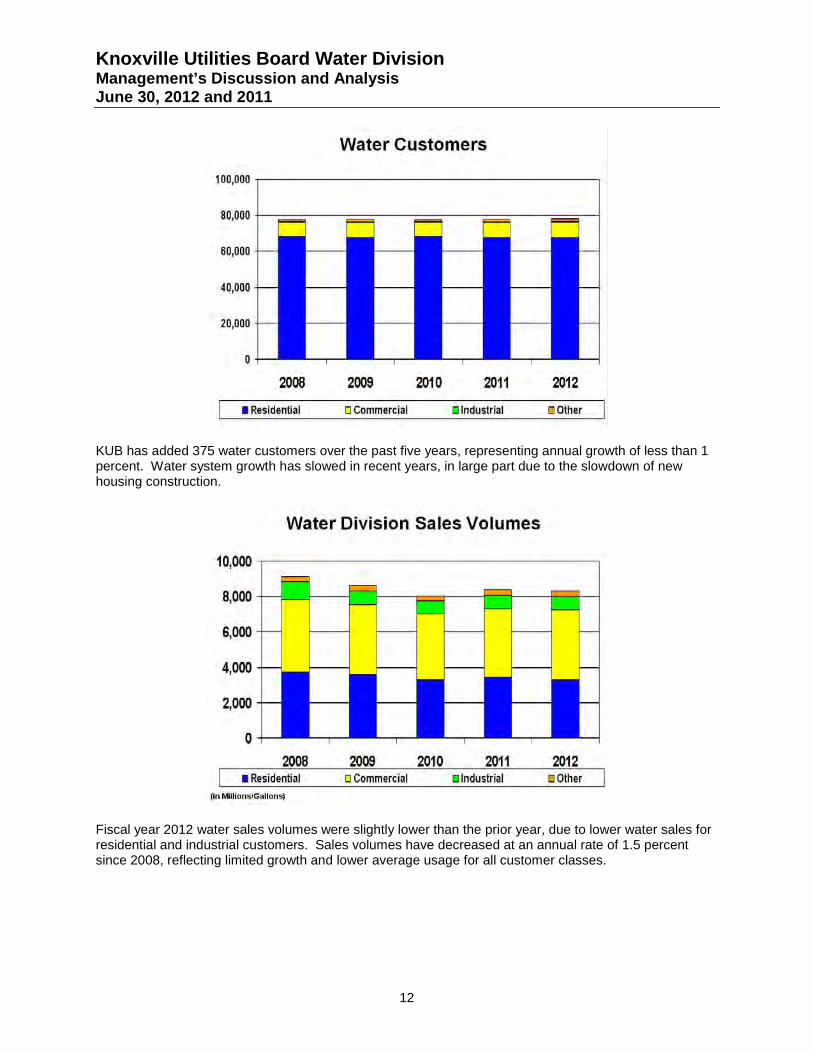
Knoxville Utilities Board Water Division Management’s Discussion and Analysis June 30, 2012 and 2011
12
KUB has added 375 water customers over the past five years, representing annual growth of less than 1 percent. Water system growth has slowed in recent years, in large part due to the slowdown of new housing construction.
Fiscal year 2012 water sales volumes were slightly lower than the prior year, due to lower water sales for residential and industrial customers. Sales volumes have decreased at an annual rate of 1.5 percent since 2008, reflecting limited growth and lower average usage for all customer classes.
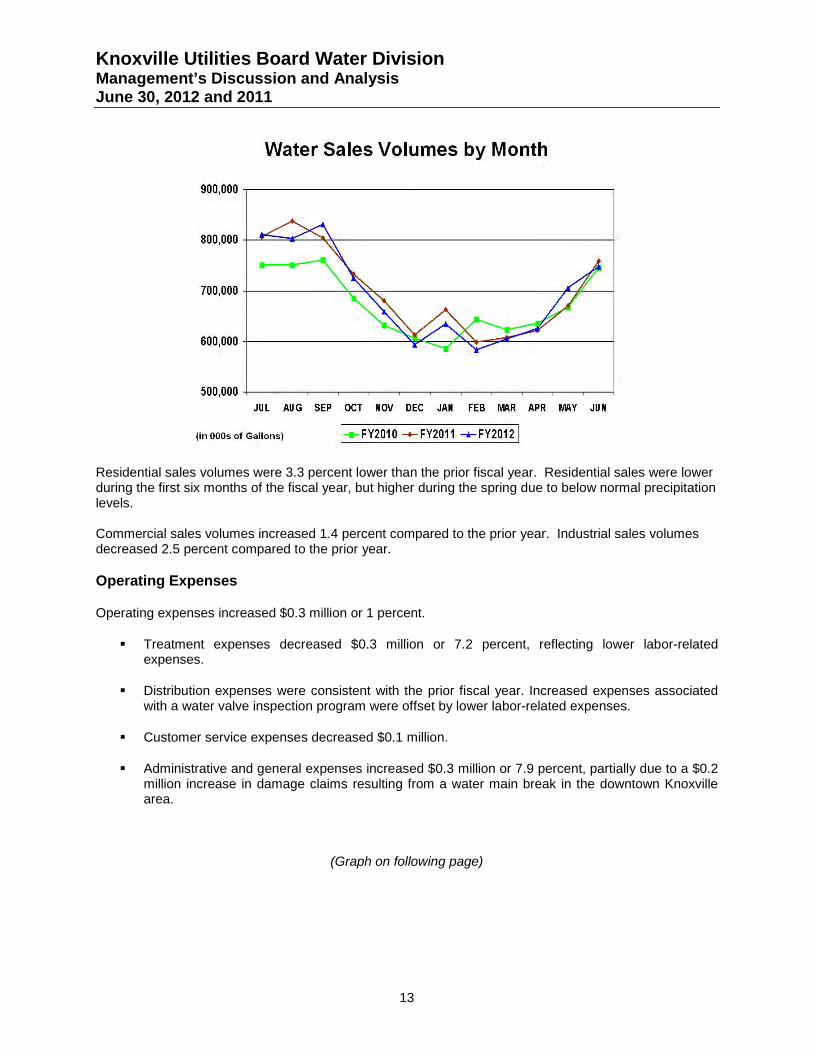
Knoxville Utilities Board Water Division Management’s Discussion and Analysis June 30, 2012 and 2011
13
Residential sales volumes were 3.3 percent lower than the prior fiscal year. Residential sales were lower during the first six months of the fiscal year, but higher during the spring due to below normal precipitation levels. Commercial sales volumes increased 1.4 percent compared to the prior year. Industrial sales volumes decreased 2.5 percent compared to the prior year.
Operating Expenses
Operating expenses increased $0.3 million or 1 percent.
Treatment expenses decreased $0.3 million or 7.2 percent, reflecting lower labor-related expenses.
Distribution expenses were consistent with the prior fiscal year. Increased expenses associated with a water valve inspection program were offset by lower labor-related expenses.
Customer service expenses decreased $0.1 million.
Administrative and general expenses increased $0.3 million or 7.9 percent, partially due to a $0.2 million increase in damage claims resulting from a water main break in the downtown Knoxville area.
(Graph on following page)
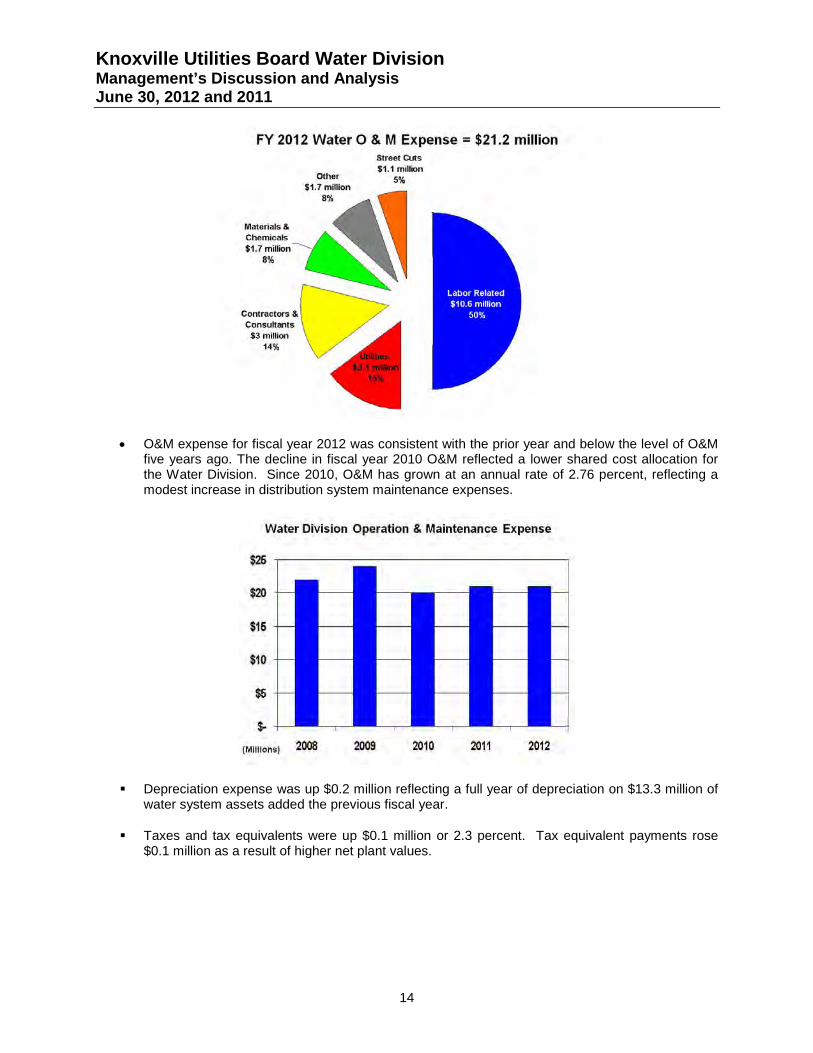
Knoxville Utilities Board Water Division Management’s Discussion and Analysis June 30, 2012 and 2011
14
• O&M expense for fiscal year 2012 was consistent with the prior year and below the level of O&M five years ago. The decline in fiscal year 2010 O&M reflected a lower shared cost allocation for the Water Division. Since 2010, O&M has grown at an annual rate of 2.76 percent, reflecting a modest increase in distribution system maintenance expenses.
Depreciation expense was up $0.2 million reflecting a full year of depreciation on $13.3 million of water system assets added the previous fiscal year.
Taxes and tax equivalents were up $0.1 million or 2.3 percent. Tax equivalent payments rose $0.1 million as a result of higher net plant values.
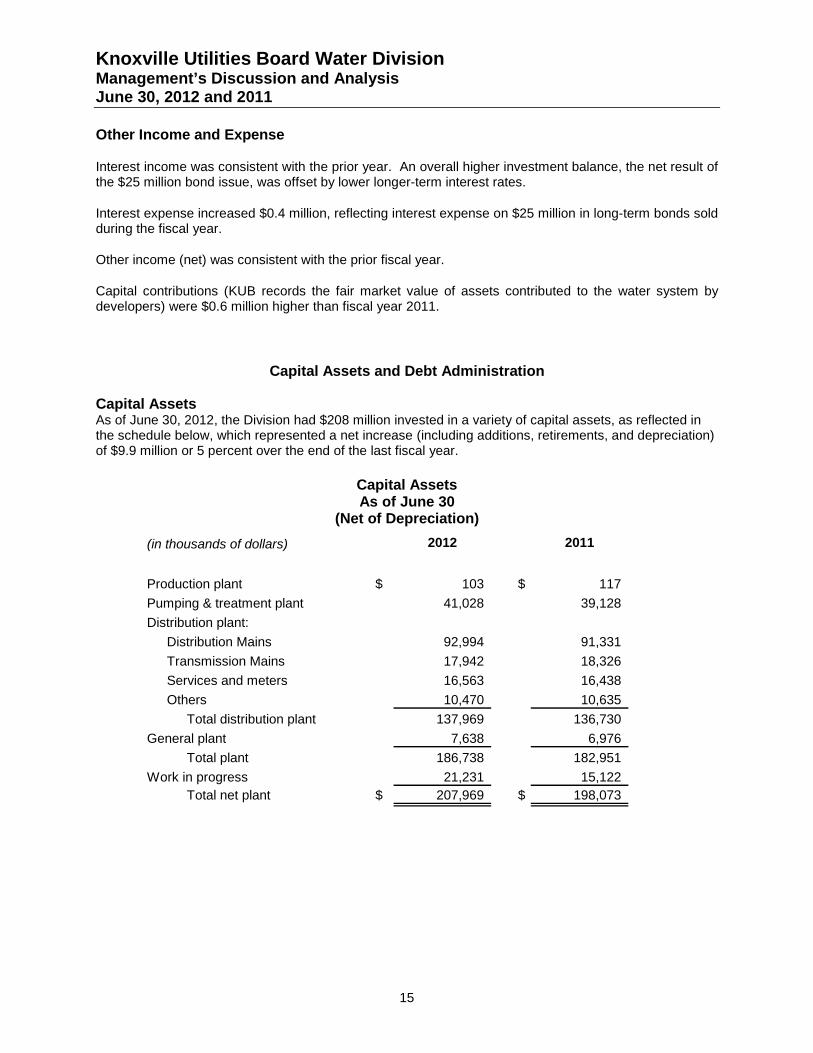
Knoxville Utilities Board Water Division Management’s Discussion and Analysis June 30, 2012 and 2011
15
Other Income and Expense
Interest income was consistent with the prior year. An overall higher investment balance, the net result of the $25 million bond issue, was offset by lower longer-term interest rates.
Interest expense increased $0.4 million, reflecting interest expense on $25 million in long-term bonds sold during the fiscal year.
Other income (net) was consistent with the prior fiscal year.
Capital contributions (KUB records the fair market value of assets contributed to the water system by developers) were $0.6 million higher than fiscal year 2011.
Capital Assets and Debt Administration
Capital Assets As of June 30, 2012, the Division had $208 million invested in a variety of capital assets, as reflected in the schedule below, which represented a net increase (including additions, retirements, and depreciation) of $9.9 million or 5 percent over the end of the last fiscal year.
Capital Assets As of June 30
(Net of Depreciation) (in thousands of dollars) 2012 2011
Production plant $ 103 $ 117 Pumping & treatment plant 41,028 39,128 Distribution plant:
Distribution Mains 92,994 91,331 Transmission Mains 17,942 18,326 Services and meters 16,563 16,438 Others 10,470 10,635
Total distribution plant 137,969 136,730 General plant 7,638 6,976
Total plant 186,738 182,951 Work in progress 21,231 15,122
Total net plant $ 207,969 $ 198,073
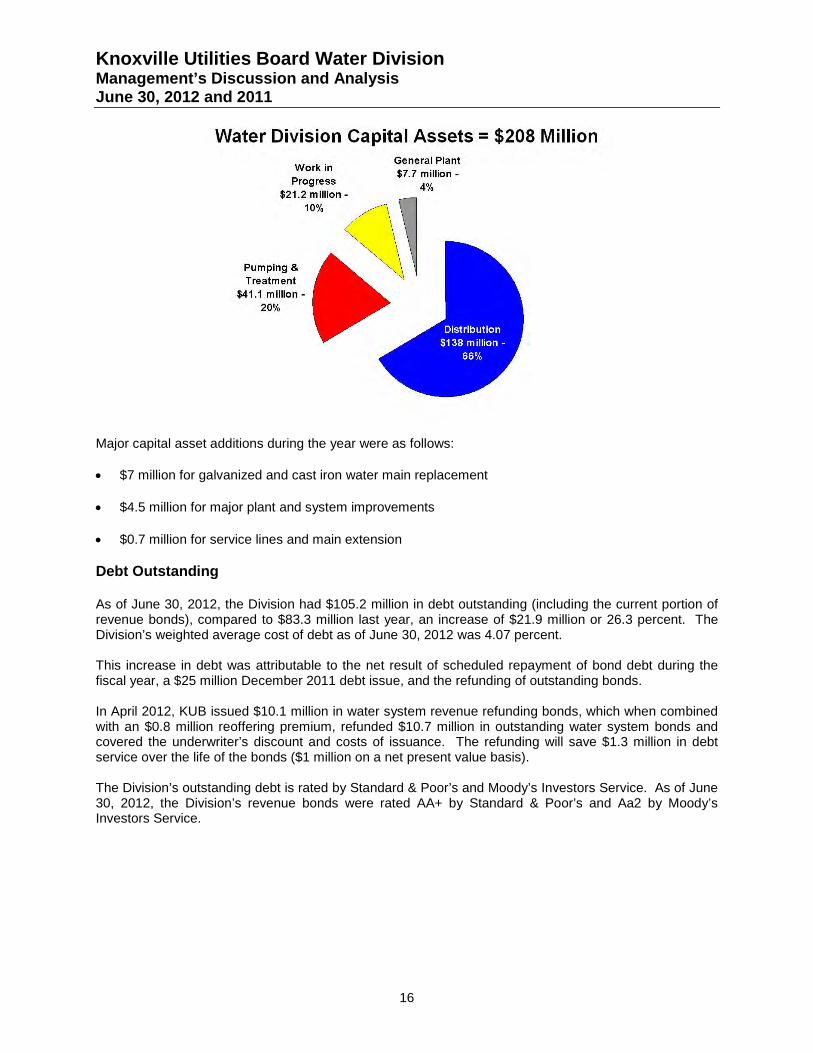
Knoxville Utilities Board Water Division Management’s Discussion and Analysis June 30, 2012 and 2011
16
Major capital asset additions during the year were as follows: • $7 million for galvanized and cast iron water main replacement
• $4.5 million for major plant and system improvements
• $0.7 million for service lines and main extension
Debt Outstanding As of June 30, 2012, the Division had $105.2 million in debt outstanding (including the current portion of revenue bonds), compared to $83.3 million last year, an increase of $21.9 million or 26.3 percent. The Division’s weighted average cost of debt as of June 30, 2012 was 4.07 percent. This increase in debt was attributable to the net result of scheduled repayment of bond debt during the fiscal year, a $25 million December 2011 debt issue, and the refunding of outstanding bonds. In April 2012, KUB issued $10.1 million in water system revenue refunding bonds, which when combined with an $0.8 million reoffering premium, refunded $10.7 million in outstanding water system bonds and covered the underwriter’s discount and costs of issuance. The refunding will save $1.3 million in debt service over the life of the bonds ($1 million on a net present value basis). The Division’s outstanding debt is rated by Standard & Poor’s and Moody’s Investors Service. As of June 30, 2012, the Division’s revenue bonds were rated AA+ by Standard & Poor’s and Aa2 by Moody’s Investors Service.
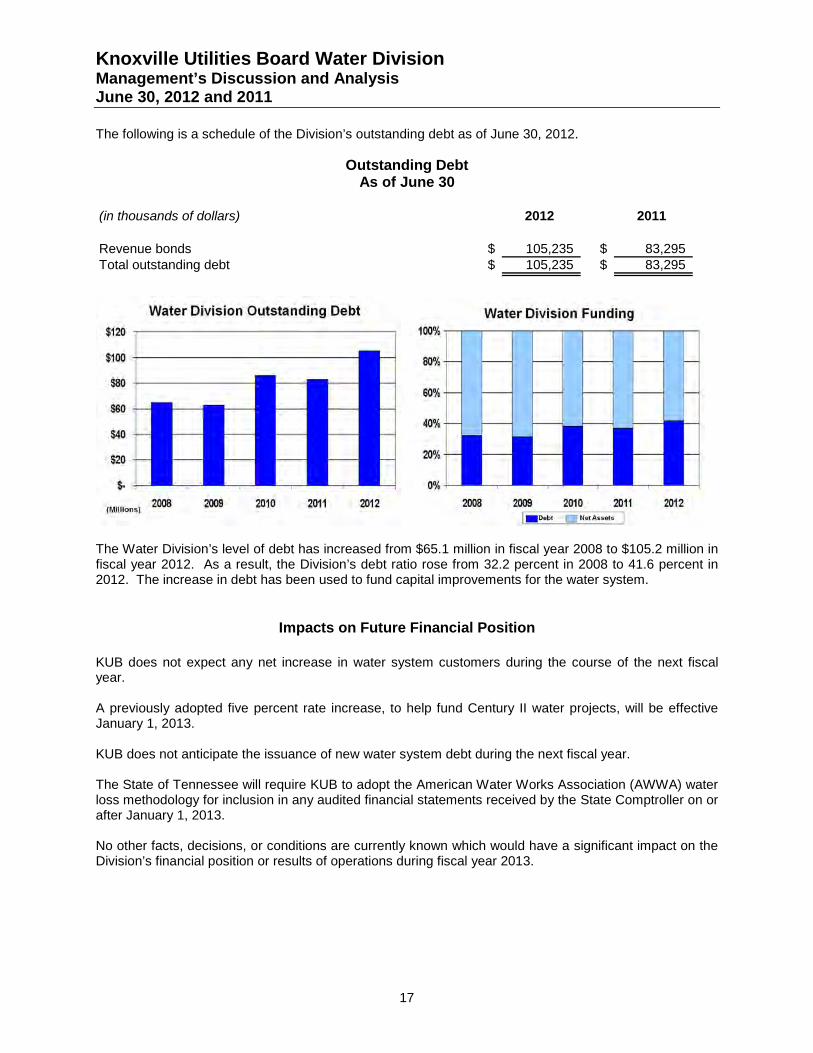
Knoxville Utilities Board Water Division Management’s Discussion and Analysis June 30, 2012 and 2011
17
The following is a schedule of the Division’s outstanding debt as of June 30, 2012.
Outstanding Debt As of June 30
(in thousands of dollars) 2012 2011
Revenue bonds $ 105,235 $ 83,295 Total outstanding debt $ 105,235 $ 83,295
The Water Division’s level of debt has increased from $65.1 million in fiscal year 2008 to $105.2 million in fiscal year 2012. As a result, the Division’s debt ratio rose from 32.2 percent in 2008 to 41.6 percent in 2012. The increase in debt has been used to fund capital improvements for the water system.
Impacts on Future Financial Position
KUB does not expect any net increase in water system customers during the course of the next fiscal year. A previously adopted five percent rate increase, to help fund Century II water projects, will be effective January 1, 2013. KUB does not anticipate the issuance of new water system debt during the next fiscal year. The State of Tennessee will require KUB to adopt the American Water Works Association (AWWA) water loss methodology for inclusion in any audited financial statements received by the State Comptroller on or after January 1, 2013. No other facts, decisions, or conditions are currently known which would have a significant impact on the Division’s financial position or results of operations during fiscal year 2013.
Knoxville Utilities Board Water Division Management’s Discussion and Analysis June 30, 2012 and 2011
18
Financial Contact The Division’s financial statements are designed to present users (citizens, customers, investors, and creditors) with a general overview of the Division’s financial position and results of operations for the fiscal years ending June 30, 2012 and 2011. If you have questions about the statements or need additional financial information, contact KUB’s Chief Financial Officer at 445 South Gay Street, Knoxville, Tennessee 37902.
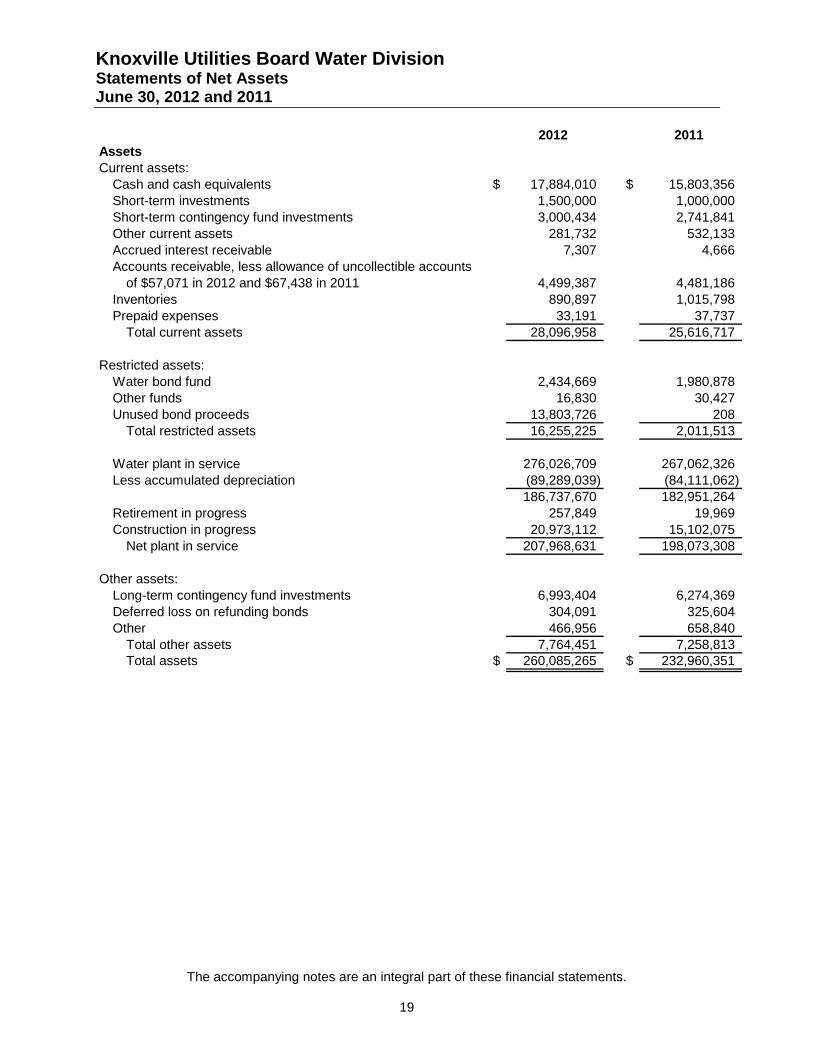
Knoxville Utilities Board Water Division Statements of Net Assets June 30, 2012 and 2011
The accompanying notes are an integral part of these financial statements.
19
2012 2011AssetsCurrent assets:
Cash and cash equivalents $ 17,884,010 $ 15,803,356 Short-term investments 1,500,000 1,000,000 Short-term contingency fund investments 3,000,434 2,741,841 Other current assets 281,732 532,133 Accrued interest receivable 7,307 4,666 Accounts receivable, less allowance of uncollectible accounts
of $57,071 in 2012 and $67,438 in 2011 4,499,387 4,481,186 Inventories 890,897 1,015,798 Prepaid expenses 33,191 37,737
Total current assets 28,096,958 25,616,717
Restricted assets:Water bond fund 2,434,669 1,980,878 Other funds 16,830 30,427 Unused bond proceeds 13,803,726 208
Total restricted assets 16,255,225 2,011,513
Water plant in service 276,026,709 267,062,326 Less accumulated depreciation (89,289,039) (84,111,062)
186,737,670 182,951,264 Retirement in progress 257,849 19,969 Construction in progress 20,973,112 15,102,075
Net plant in service 207,968,631 198,073,308
Other assets:Long-term contingency fund investments 6,993,404 6,274,369 Deferred loss on refunding bonds 304,091 325,604 Other 466,956 658,840
Total other assets 7,764,451 7,258,813 Total assets $ 260,085,265 $ 232,960,351
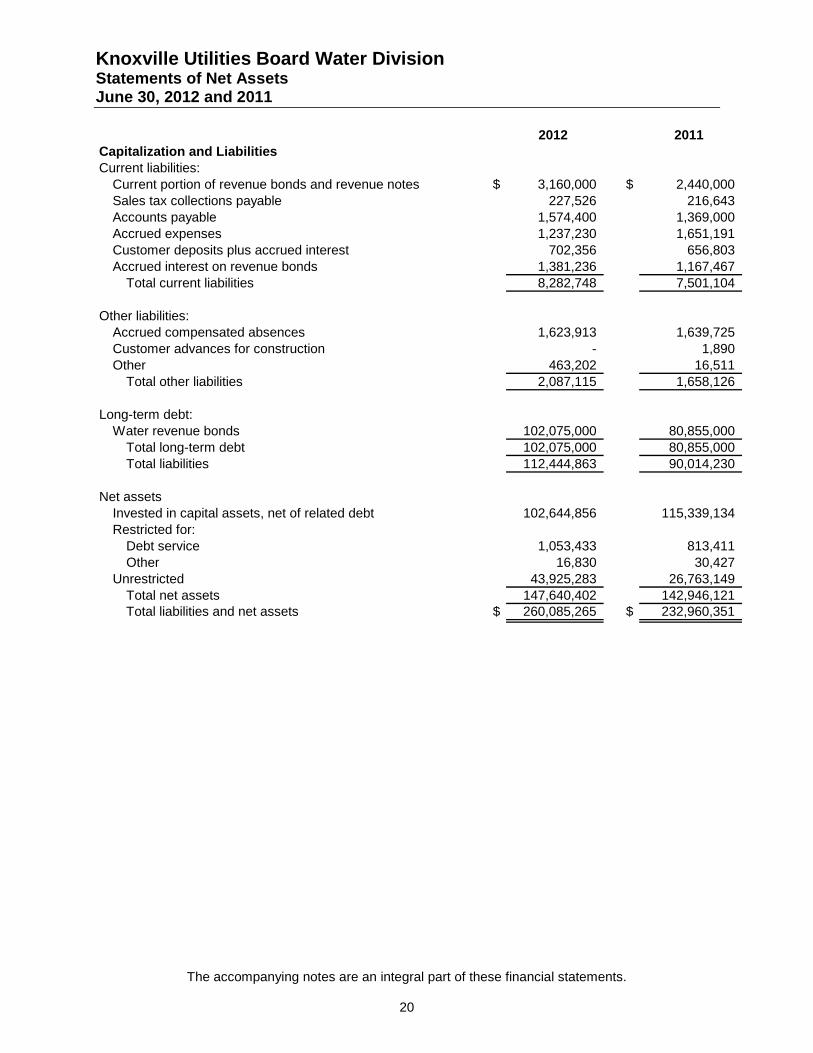
Knoxville Utilities Board Water Division Statements of Net Assets June 30, 2012 and 2011
The accompanying notes are an integral part of these financial statements.
20
2012 2011Capitalization and LiabilitiesCurrent liabilities:
Current portion of revenue bonds and revenue notes $ 3,160,000 $ 2,440,000 Sales tax collections payable 227,526 216,643 Accounts payable 1,574,400 1,369,000 Accrued expenses 1,237,230 1,651,191 Customer deposits plus accrued interest 702,356 656,803 Accrued interest on revenue bonds 1,381,236 1,167,467
Total current liabilities 8,282,748 7,501,104
Other liabilities:Accrued compensated absences 1,623,913 1,639,725 Customer advances for construction - 1,890 Other 463,202 16,511
Total other liabilities 2,087,115 1,658,126
Long-term debt:Water revenue bonds 102,075,000 80,855,000
Total long-term debt 102,075,000 80,855,000 Total liabilities 112,444,863 90,014,230
Net assetsInvested in capital assets, net of related debt 102,644,856 115,339,134 Restricted for:
Debt service 1,053,433 813,411 Other 16,830 30,427
Unrestricted 43,925,283 26,763,149 Total net assets 147,640,402 142,946,121 Total liabilities and net assets $ 260,085,265 $ 232,960,351
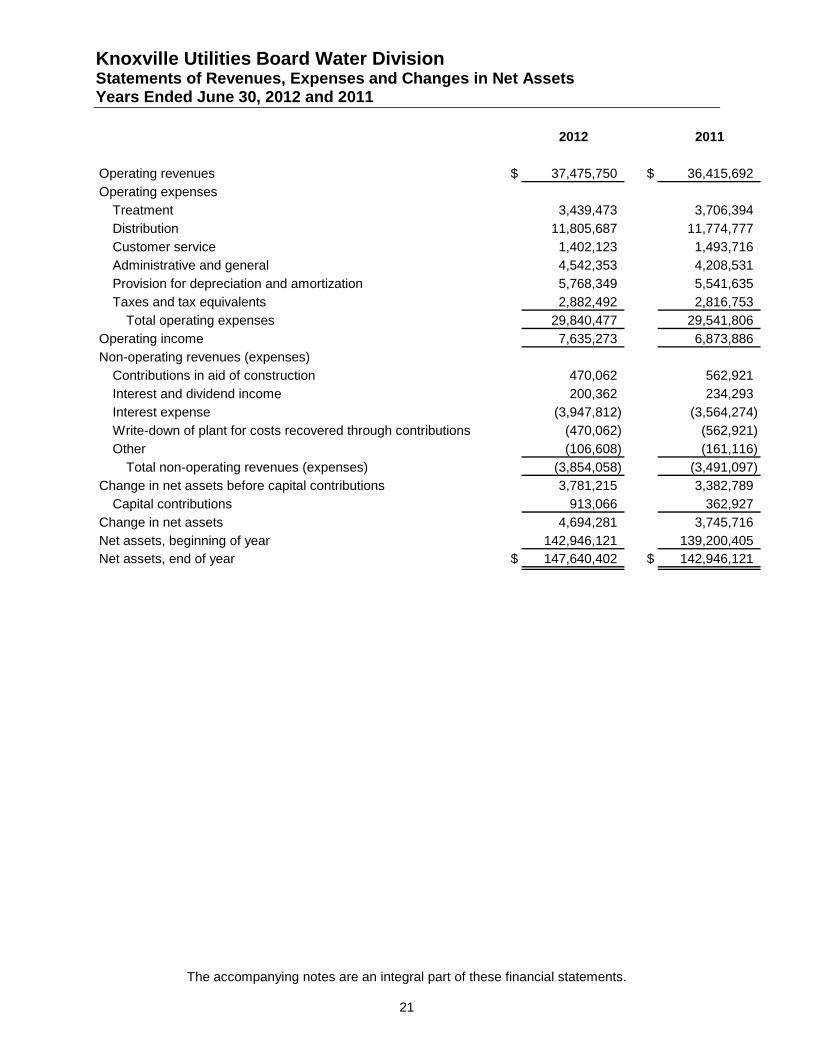
Knoxville Utilities Board Water Division Statements of Revenues, Expenses and Changes in Net Assets Years Ended June 30, 2012 and 2011
The accompanying notes are an integral part of these financial statements.
21
2012 2011
Operating revenues $ 37,475,750 $ 36,415,692 Operating expenses
Treatment 3,439,473 3,706,394 Distribution 11,805,687 11,774,777 Customer service 1,402,123 1,493,716 Administrative and general 4,542,353 4,208,531 Provision for depreciation and amortization 5,768,349 5,541,635 Taxes and tax equivalents 2,882,492 2,816,753
Total operating expenses 29,840,477 29,541,806 Operating income 7,635,273 6,873,886 Non-operating revenues (expenses)
Contributions in aid of construction 470,062 562,921 Interest and dividend income 200,362 234,293 Interest expense (3,947,812) (3,564,274) Write-down of plant for costs recovered through contributions (470,062) (562,921) Other (106,608) (161,116)
Total non-operating revenues (expenses) (3,854,058) (3,491,097) Change in net assets before capital contributions 3,781,215 3,382,789
Capital contributions 913,066 362,927 Change in net assets 4,694,281 3,745,716 Net assets, beginning of year 142,946,121 139,200,405 Net assets, end of year $ 147,640,402 $ 142,946,121
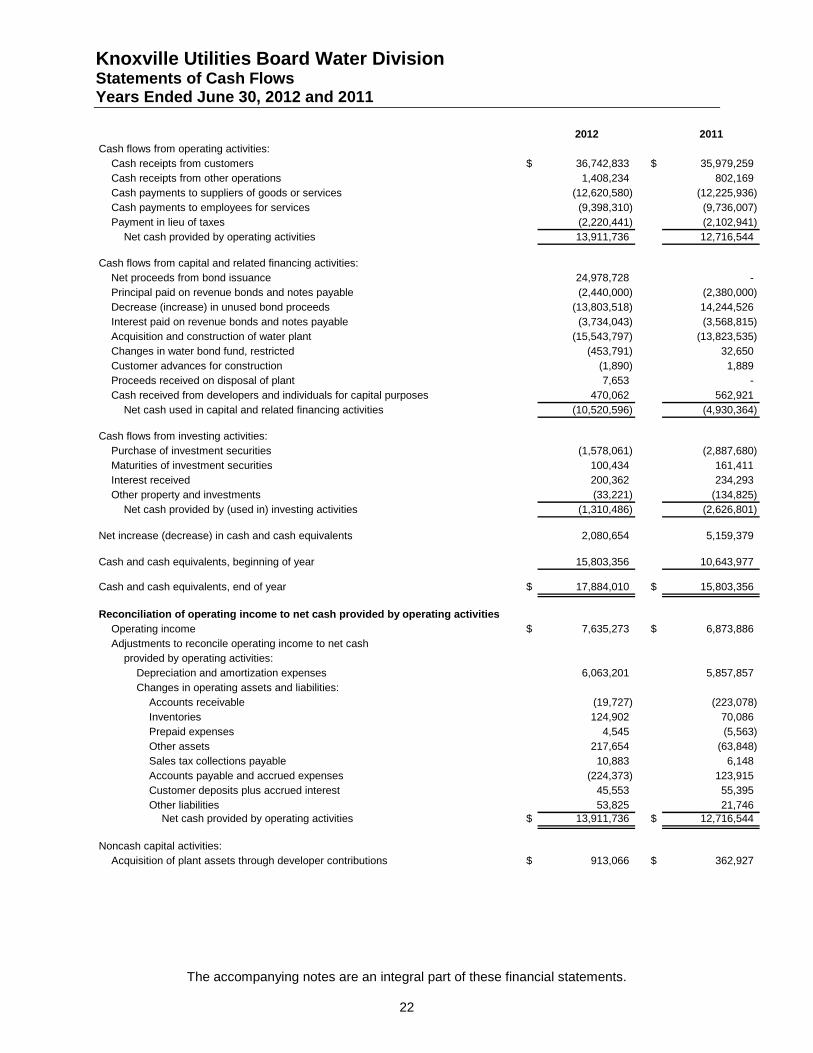
Knoxville Utilities Board Water Division Statements of Cash Flows Years Ended June 30, 2012 and 2011
The accompanying notes are an integral part of these financial statements.
22
2012 2011Cash flows from operating activities:
Cash receipts from customers $ 36,742,833 $ 35,979,259 Cash receipts from other operations 1,408,234 802,169 Cash payments to suppliers of goods or services (12,620,580) (12,225,936) Cash payments to employees for services (9,398,310) (9,736,007) Payment in lieu of taxes (2,220,441) (2,102,941)
Net cash provided by operating activities 13,911,736 12,716,544
Cash flows from capital and related financing activities:Net proceeds from bond issuance 24,978,728 - Principal paid on revenue bonds and notes payable (2,440,000) (2,380,000) Decrease (increase) in unused bond proceeds (13,803,518) 14,244,526 Interest paid on revenue bonds and notes payable (3,734,043) (3,568,815) Acquisition and construction of water plant (15,543,797) (13,823,535) Changes in water bond fund, restricted (453,791) 32,650 Customer advances for construction (1,890) 1,889 Proceeds received on disposal of plant 7,653 - Cash received from developers and individuals for capital purposes 470,062 562,921
Net cash used in capital and related financing activities (10,520,596) (4,930,364)
Cash flows from investing activities:Purchase of investment securities (1,578,061) (2,887,680) Maturities of investment securities 100,434 161,411 Interest received 200,362 234,293 Other property and investments (33,221) (134,825)
Net cash provided by (used in) investing activities (1,310,486) (2,626,801)
Net increase (decrease) in cash and cash equivalents 2,080,654 5,159,379
Cash and cash equivalents, beginning of year 15,803,356 10,643,977
Cash and cash equivalents, end of year $ 17,884,010 $ 15,803,356
Reconciliation of operating income to net cash provided by operating activitiesOperating income $ 7,635,273 $ 6,873,886 Adjustments to reconcile operating income to net cash
provided by operating activities:Depreciation and amortization expenses 6,063,201 5,857,857 Changes in operating assets and liabilities:
Accounts receivable (19,727) (223,078) Inventories 124,902 70,086 Prepaid expenses 4,545 (5,563) Other assets 217,654 (63,848) Sales tax collections payable 10,883 6,148 Accounts payable and accrued expenses (224,373) 123,915 Customer deposits plus accrued interest 45,553 55,395 Other liabilities 53,825 21,746
Net cash provided by operating activities $ 13,911,736 $ 12,716,544
Noncash capital activities:Acquisition of plant assets through developer contributions $ 913,066 $ 362,927
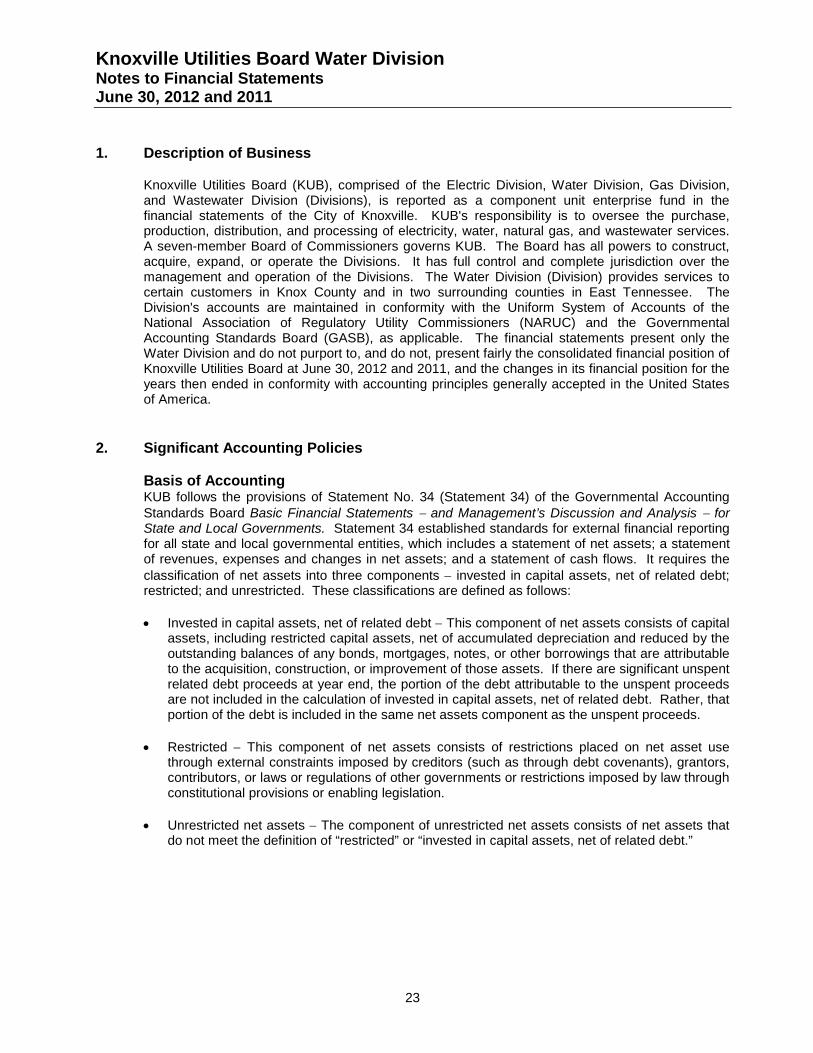
Knoxville Utilities Board Water Division Notes to Financial Statements June 30, 2012 and 2011
23
1. Description of Business
Knoxville Utilities Board (KUB), comprised of the Electric Division, Water Division, Gas Division, and Wastewater Division (Divisions), is reported as a component unit enterprise fund in the financial statements of the City of Knoxville. KUB's responsibility is to oversee the purchase, production, distribution, and processing of electricity, water, natural gas, and wastewater services. A seven-member Board of Commissioners governs KUB. The Board has all powers to construct, acquire, expand, or operate the Divisions. It has full control and complete jurisdiction over the management and operation of the Divisions. The Water Division (Division) provides services to certain customers in Knox County and in two surrounding counties in East Tennessee. The Division's accounts are maintained in conformity with the Uniform System of Accounts of the National Association of Regulatory Utility Commissioners (NARUC) and the Governmental Accounting Standards Board (GASB), as applicable. The financial statements present only the Water Division and do not purport to, and do not, present fairly the consolidated financial position of Knoxville Utilities Board at June 30, 2012 and 2011, and the changes in its financial position for the years then ended in conformity with accounting principles generally accepted in the United States of America.
2. Significant Accounting Policies
Basis of Accounting KUB follows the provisions of Statement No. 34 (Statement 34) of the Governmental Accounting Standards Board Basic Financial Statements − and Management’s Discussion and Analysis − for State and Local Governments. Statement 34 established standards for external financial reporting for all state and local governmental entities, which includes a statement of net assets; a statement of revenues, expenses and changes in net assets; and a statement of cash flows. It requires the classification of net assets into three components − invested in capital assets, net of related debt; restricted; and unrestricted. These classifications are defined as follows:
• Invested in capital assets, net of related debt − This component of net assets consists of capital assets, including restricted capital assets, net of accumulated depreciation and reduced by the outstanding balances of any bonds, mortgages, notes, or other borrowings that are attributable to the acquisition, construction, or improvement of those assets. If there are significant unspent related debt proceeds at year end, the portion of the debt attributable to the unspent proceeds are not included in the calculation of invested in capital assets, net of related debt. Rather, that portion of the debt is included in the same net assets component as the unspent proceeds.
• Restricted − This component of net assets consists of restrictions placed on net asset use through external constraints imposed by creditors (such as through debt covenants), grantors, contributors, or laws or regulations of other governments or restrictions imposed by law through constitutional provisions or enabling legislation.
• Unrestricted net assets − The component of unrestricted net assets consists of net assets that do not meet the definition of “restricted” or “invested in capital assets, net of related debt.”
Knoxville Utilities Board Water Division Notes to Financial Statements June 30, 2012 and 2011
24
The financial statements are prepared on the accrual basis of accounting, whereby revenues are recognized when earned and expenses are recognized when incurred. The accounting and financial reporting treatment applied to the Division is determined by measurement focus. The transactions of the Division are accounted for on a flow of economic resources measurement focus. With this measurement focus, all assets and all liabilities associated with the operations are included on the statement of net assets. Net assets (i.e., total assets net of total liabilities) are segregated into invested in capital assets, net of related debt; restricted for capital activity and debt service; and unrestricted components.
As allowed by the Governmental Accounting Standards Board (GASB) Statement No. 20, Accounting and Financial Reporting for Proprietary Funds and Other Governmental Entities That Use Proprietary Fund Accounting, KUB’s policy is to apply only those Financial Accounting Standards Board statements, related interpretations, Accounting Principles Board opinions and accounting research bulletins issued on or prior to November 30, 1989 that do not conflict with Governmental Accounting Standards.
Water Plant Water plant and other property are stated on the basis of original cost. The cost of current repairs and minor replacements is charged to operating expense. The cost of renewals and improvements is capitalized. The original cost of utility plant assets retired or otherwise disposed of and the cost of removal less salvage value is charged to accumulated depreciation. When other property is retired, the related asset and accumulated depreciation are removed from the accounts, and the gain or loss is included in the results of operations.
The provision for depreciation of water plant in service is based on the estimated useful lives of the assets, which range from three to sixty-seven years, and is computed using the straight-line method. Pursuant to NARUC, the caption "Provision for depreciation" in the statements of revenues, expenses and changes in net assets does not include depreciation for transportation equipment of $294,852 in 2012 and $316,222 in 2011. Interest costs are expensed as incurred.
Operating Revenue Operating revenue consists primarily of charges for services provided by the principal operations of the KUB Water Division. Operating revenue is recorded when the service is rendered, on a cycle basis, and includes an estimate of unbilled revenue. Revenues are reported net of bad debt expense of $98,393 in 2012 and $150,456 in 2011.
Non-operating Revenue Non-operating revenue consists of revenues that are related to financing and investing types of activities and result from non-exchange transactions or ancillary activities.
Expense When an expense is incurred for purposes for which there are both restricted and unrestricted net assets available, it is KUB’s policy to apply those expenses to restricted net assets to the extent such are available and then to unrestricted net assets.
Knoxville Utilities Board Water Division Notes to Financial Statements June 30, 2012 and 2011
25
Contributions in Aid of Construction and Capital Contributions Contributions in aid of construction are cash collections from customers or others for a particular purpose, generally the construction of new facilities to serve new customers in excess of the investment KUB is willing to make for a particular incremental revenue source. KUB reduces the plant account balances to which contributions relate by the actual amount of the contribution and recognizes the contributions as non operating revenue in accordance with FAS 71, “Accounting for the Effects of Certain Types of Regulation”.
Capital contributions represent contributions of utility plant infrastructure constructed by developers and others in industrial parks and other developments, and transferred to KUB upon completion of construction and the initiation of utility service. In accordance with GASB 33, “Accounting and Financial Reporting for Nonexchange Transactions”, such contributions are recognized as revenues and capital assets upon receipt.
Inventories Inventories, consisting of plant materials and operating supplies, are valued at the lower of average cost or replacement value.
Pension Plan The Division’s employees are participants in the Knoxville Utilities Board Pension Plan as authorized by the Charter of the City of Knoxville §1107(J) (Note 10). The Division's policy is to fund pension cost accrued. As required by GASB Statement No. 27, KUB measures and discloses the annual pension cost on the accrual basis of accounting. At the time the funding method is introduced, there is a liability, which represents the contributions that would have been accumulated if this method of funding had always been used. The excess, if any, of this liability over the actuarial value of the assets held in the fund is the unfunded actuarial accrued liability, which is typically funded over a chosen period in accordance with an amortization schedule.
Investments Investments are carried at fair value as determined by quoted market prices at the reporting date.
Self-Insurance KUB has established self-insurance programs covering portions of workers' compensation, employee health, environmental liability, general liability, property and casualty liability, and automobile liability claims. A liability is accrued for claims as they are incurred. When applicable, claims in excess of the self-insured risk are covered by KUB's insurance carrier. Additionally, KUB provides certain lifetime health benefits to eligible retired employees under a self-insurance plan administered by a third party.
Estimates The preparation of financial statements in conformity with generally accepted accounting principles requires management to make estimates and assumptions that affect the reported amounts of assets and liabilities and disclosures of contingent assets and liabilities at the date of the financial statements and the reported amounts of revenues and expenses during the reporting period. These estimates are based on historical experience and various other assumptions that KUB believes are reasonable under the circumstances. However, future events are subject to change and the best estimates and judgments routinely require adjustment. Estimates are used for, but not limited to, inventory valuation, provision for doubtful accounts, depreciable lives of plant assets, unbilled revenue volumes, pension trust valuations, OPEB trust valuations, insurance liability reserves, and potential losses from contingencies and litigation. Actual results could differ from those estimates.
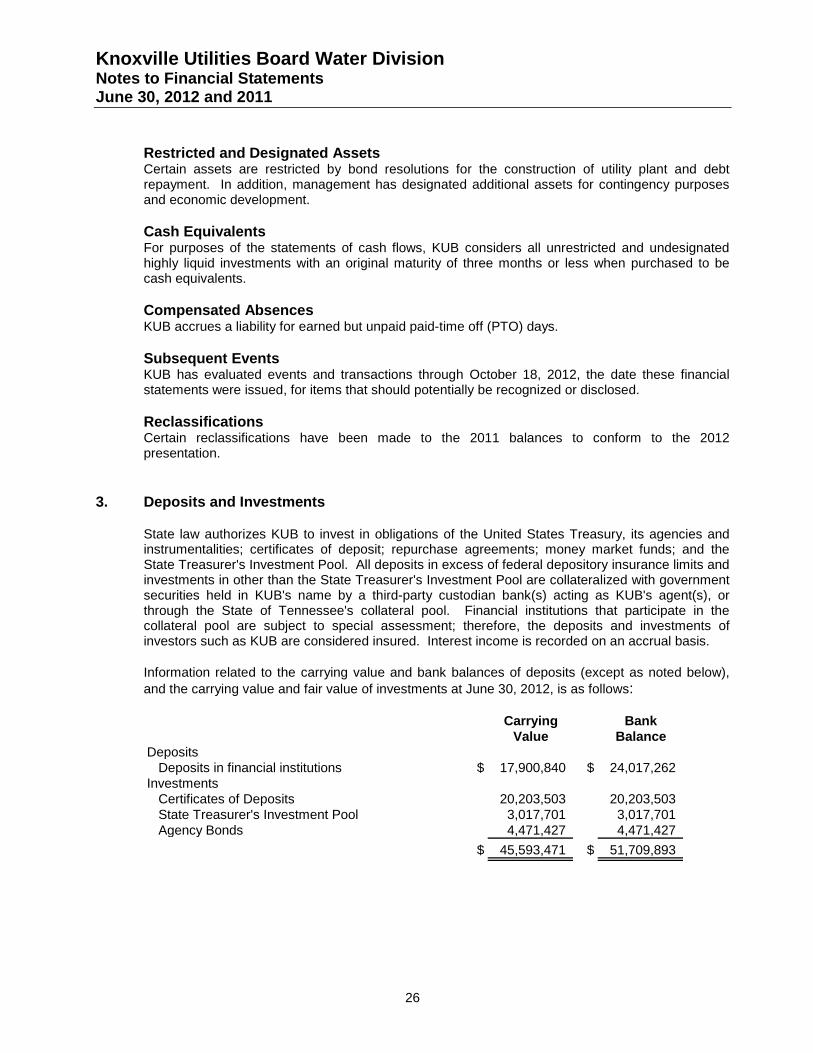
Knoxville Utilities Board Water Division Notes to Financial Statements June 30, 2012 and 2011
26
Restricted and Designated Assets Certain assets are restricted by bond resolutions for the construction of utility plant and debt repayment. In addition, management has designated additional assets for contingency purposes and economic development.
Cash Equivalents For purposes of the statements of cash flows, KUB considers all unrestricted and undesignated highly liquid investments with an original maturity of three months or less when purchased to be cash equivalents.
Compensated Absences KUB accrues a liability for earned but unpaid paid-time off (PTO) days.
Subsequent Events KUB has evaluated events and transactions through October 18, 2012, the date these financial statements were issued, for items that should potentially be recognized or disclosed.
Reclassifications Certain reclassifications have been made to the 2011 balances to conform to the 2012 presentation.
3. Deposits and Investments
State law authorizes KUB to invest in obligations of the United States Treasury, its agencies and instrumentalities; certificates of deposit; repurchase agreements; money market funds; and the State Treasurer's Investment Pool. All deposits in excess of federal depository insurance limits and investments in other than the State Treasurer's Investment Pool are collateralized with government securities held in KUB's name by a third-party custodian bank(s) acting as KUB's agent(s), or through the State of Tennessee's collateral pool. Financial institutions that participate in the collateral pool are subject to special assessment; therefore, the deposits and investments of investors such as KUB are considered insured. Interest income is recorded on an accrual basis.
Information related to the carrying value and bank balances of deposits (except as noted below), and the carrying value and fair value of investments at June 30, 2012, is as follows:
Carrying BankValue Balance
DepositsDeposits in financial institutions $ 17,900,840 $ 24,017,262
InvestmentsCertificates of Deposits 20,203,503 20,203,503 State Treasurer's Investment Pool 3,017,701 3,017,701 Agency Bonds 4,471,427 4,471,427
$ 45,593,471 $ 51,709,893
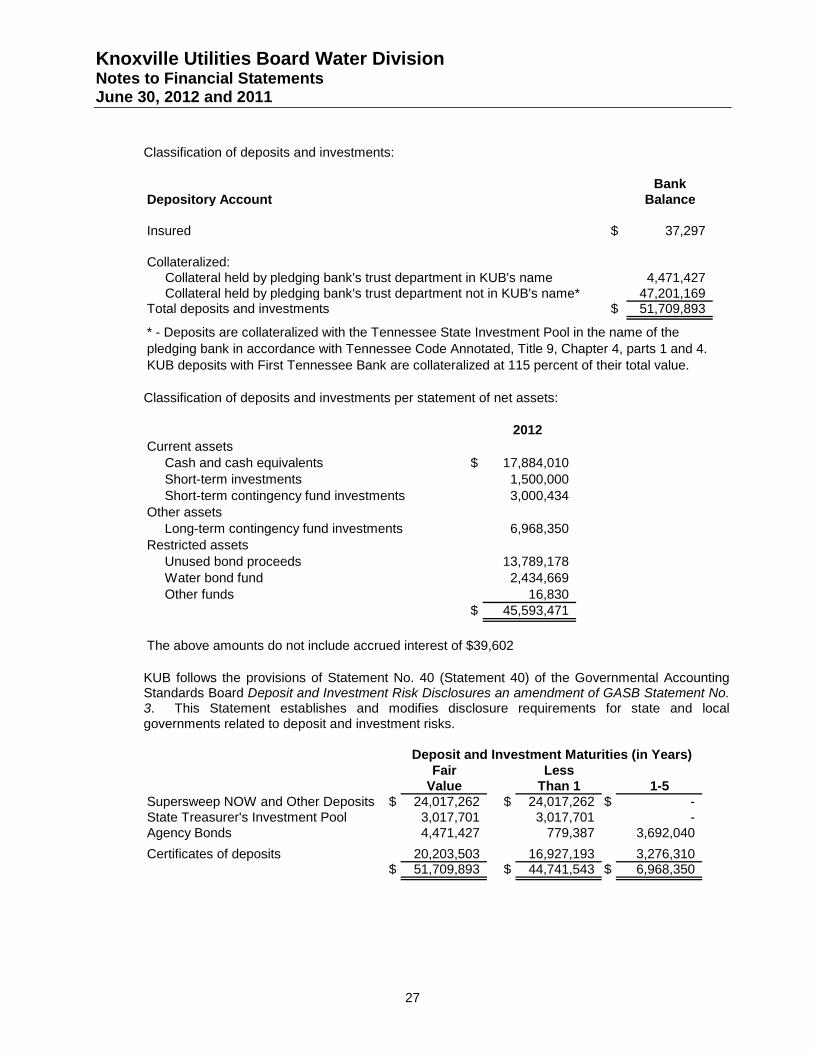
Knoxville Utilities Board Water Division Notes to Financial Statements June 30, 2012 and 2011
27
Classification of deposits and investments:
BankDepository Account Balance
Insured $ 37,297
Collateralized:Collateral held by pledging bank's trust department in KUB's name 4,471,427 Collateral held by pledging bank's trust department not in KUB's name* 47,201,169
Total deposits and investments $ 51,709,893
* - Deposits are collateralized with the Tennessee State Investment Pool in the name of the pledging bank in accordance with Tennessee Code Annotated, Title 9, Chapter 4, parts 1 and 4. KUB deposits with First Tennessee Bank are collateralized at 115 percent of their total value.
Classification of deposits and investments per statement of net assets:
2012Current assets
Cash and cash equivalents $ 17,884,010 Short-term investments 1,500,000 Short-term contingency fund investments 3,000,434
Other assetsLong-term contingency fund investments 6,968,350
Restricted assetsUnused bond proceeds 13,789,178 Water bond fund 2,434,669 Other funds 16,830
$ 45,593,471
The above amounts do not include accrued interest of $39,602 KUB follows the provisions of Statement No. 40 (Statement 40) of the Governmental Accounting Standards Board Deposit and Investment Risk Disclosures an amendment of GASB Statement No. 3. This Statement establishes and modifies disclosure requirements for state and local governments related to deposit and investment risks.
Fair LessValue Than 1 1-5
Supersweep NOW and Other Deposits $ 24,017,262 $ 24,017,262 $ -State Treasurer's Investment Pool 3,017,701 3,017,701 -Agency Bonds 4,471,427 779,387 3,692,040Certificates of deposits 20,203,503 16,927,193 3,276,310
$ 51,709,893 $ 44,741,543 $ 6,968,350
Deposit and Investment Maturities (in Years)
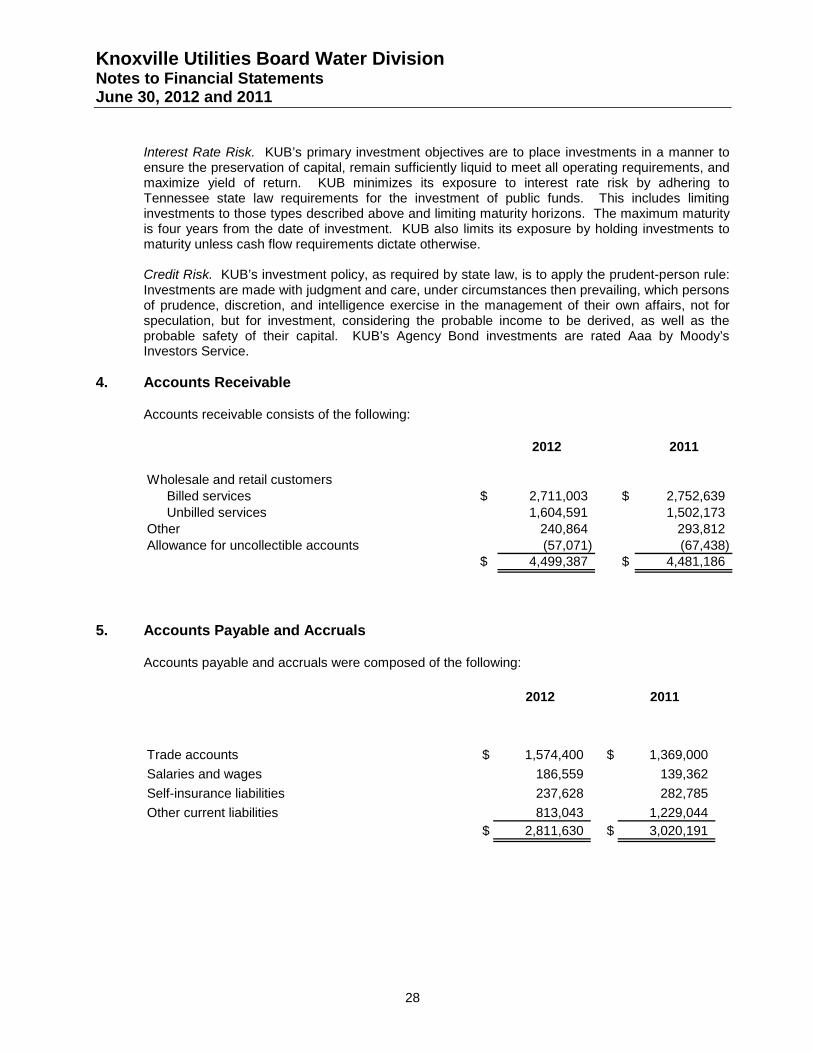
Knoxville Utilities Board Water Division Notes to Financial Statements June 30, 2012 and 2011
28
Interest Rate Risk. KUB’s primary investment objectives are to place investments in a manner to ensure the preservation of capital, remain sufficiently liquid to meet all operating requirements, and maximize yield of return. KUB minimizes its exposure to interest rate risk by adhering to Tennessee state law requirements for the investment of public funds. This includes limiting investments to those types described above and limiting maturity horizons. The maximum maturity is four years from the date of investment. KUB also limits its exposure by holding investments to maturity unless cash flow requirements dictate otherwise.
Credit Risk. KUB’s investment policy, as required by state law, is to apply the prudent-person rule: Investments are made with judgment and care, under circumstances then prevailing, which persons of prudence, discretion, and intelligence exercise in the management of their own affairs, not for speculation, but for investment, considering the probable income to be derived, as well as the probable safety of their capital. KUB’s Agency Bond investments are rated Aaa by Moody’s Investors Service.
4. Accounts Receivable
Accounts receivable consists of the following:
2012 2011
Wholesale and retail customers Billed services $ 2,711,003 $ 2,752,639 Unbilled services 1,604,591 1,502,173 Other 240,864 293,812 Allowance for uncollectible accounts (57,071) (67,438)
$ 4,499,387 $ 4,481,186
5. Accounts Payable and Accruals
Accounts payable and accruals were composed of the following:
2012 2011
Trade accounts $ 1,574,400 $ 1,369,000 Salaries and wages 186,559 139,362 Self-insurance liabilities 237,628 282,785 Other current liabilities 813,043 1,229,044
$ 2,811,630 $ 3,020,191
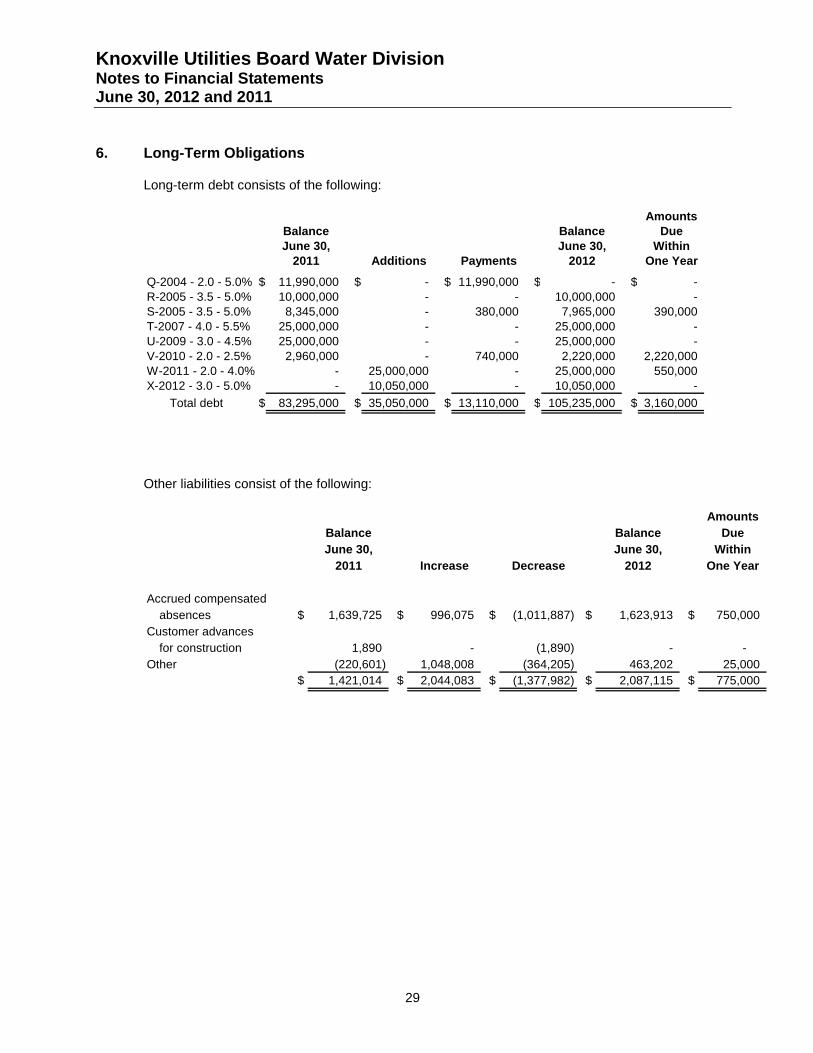
Knoxville Utilities Board Water Division Notes to Financial Statements June 30, 2012 and 2011
29
6. Long-Term Obligations
Long-term debt consists of the following:
AmountsBalance Balance DueJune 30, June 30, Within
2011 Additions Payments 2012 One Year
Q-2004 - 2.0 - 5.0% $ 11,990,000 $ - $ 11,990,000 $ - $ - R-2005 - 3.5 - 5.0% 10,000,000 - - 10,000,000 - S-2005 - 3.5 - 5.0% 8,345,000 - 380,000 7,965,000 390,000 T-2007 - 4.0 - 5.5% 25,000,000 - - 25,000,000 - U-2009 - 3.0 - 4.5% 25,000,000 - - 25,000,000 - V-2010 - 2.0 - 2.5% 2,960,000 - 740,000 2,220,000 2,220,000 W-2011 - 2.0 - 4.0% - 25,000,000 - 25,000,000 550,000 X-2012 - 3.0 - 5.0% - 10,050,000 - 10,050,000 -
Total debt $ 83,295,000 $ 35,050,000 $ 13,110,000 $ 105,235,000 $ 3,160,000
Other liabilities consist of the following:
AmountsBalance Balance DueJune 30, June 30, Within
2011 Increase Decrease 2012 One Year
Accrued compensatedabsences $ 1,639,725 $ 996,075 $ (1,011,887) $ 1,623,913 $ 750,000
Customer advances for construction 1,890 - (1,890) - -
Other (220,601) 1,048,008 (364,205) 463,202 25,000 $ 1,421,014 $ 2,044,083 $ (1,377,982) $ 2,087,115 $ 775,000
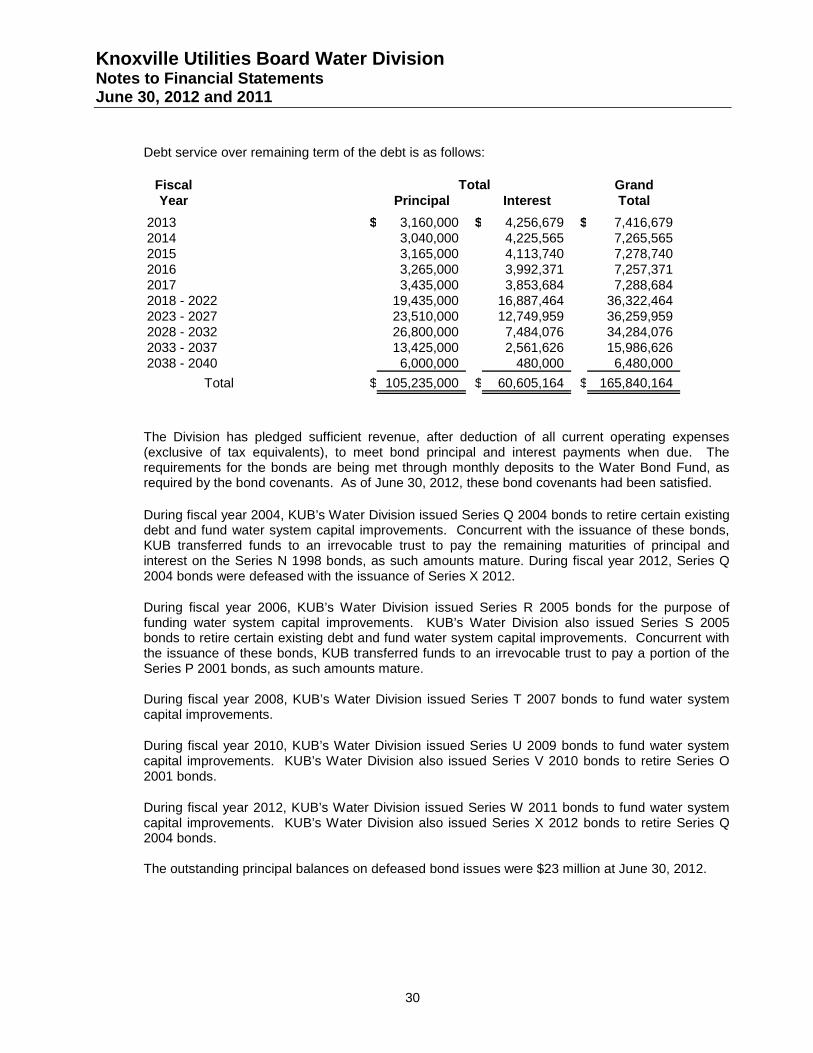
Knoxville Utilities Board Water Division Notes to Financial Statements June 30, 2012 and 2011
30
Debt service over remaining term of the debt is as follows:
Fiscal GrandYear Principal Interest Total
2013 $ 3,160,000 $ 4,256,679 $ 7,416,679 2014 3,040,000 4,225,565 7,265,565 2015 3,165,000 4,113,740 7,278,740 2016 3,265,000 3,992,371 7,257,371 2017 3,435,000 3,853,684 7,288,684 2018 - 2022 19,435,000 16,887,464 36,322,464 2023 - 2027 23,510,000 12,749,959 36,259,959 2028 - 2032 26,800,000 7,484,076 34,284,076 2033 - 2037 13,425,000 2,561,626 15,986,626 2038 - 2040 6,000,000 480,000 6,480,000
Total $ 105,235,000 $ 60,605,164 $ 165,840,164
Total
The Division has pledged sufficient revenue, after deduction of all current operating expenses (exclusive of tax equivalents), to meet bond principal and interest payments when due. The requirements for the bonds are being met through monthly deposits to the Water Bond Fund, as required by the bond covenants. As of June 30, 2012, these bond covenants had been satisfied. During fiscal year 2004, KUB’s Water Division issued Series Q 2004 bonds to retire certain existing debt and fund water system capital improvements. Concurrent with the issuance of these bonds, KUB transferred funds to an irrevocable trust to pay the remaining maturities of principal and interest on the Series N 1998 bonds, as such amounts mature. During fiscal year 2012, Series Q 2004 bonds were defeased with the issuance of Series X 2012.
During fiscal year 2006, KUB’s Water Division issued Series R 2005 bonds for the purpose of funding water system capital improvements. KUB’s Water Division also issued Series S 2005 bonds to retire certain existing debt and fund water system capital improvements. Concurrent with the issuance of these bonds, KUB transferred funds to an irrevocable trust to pay a portion of the Series P 2001 bonds, as such amounts mature. During fiscal year 2008, KUB’s Water Division issued Series T 2007 bonds to fund water system capital improvements.
During fiscal year 2010, KUB’s Water Division issued Series U 2009 bonds to fund water system capital improvements. KUB’s Water Division also issued Series V 2010 bonds to retire Series O 2001 bonds.
During fiscal year 2012, KUB’s Water Division issued Series W 2011 bonds to fund water system capital improvements. KUB’s Water Division also issued Series X 2012 bonds to retire Series Q 2004 bonds.
The outstanding principal balances on defeased bond issues were $23 million at June 30, 2012.
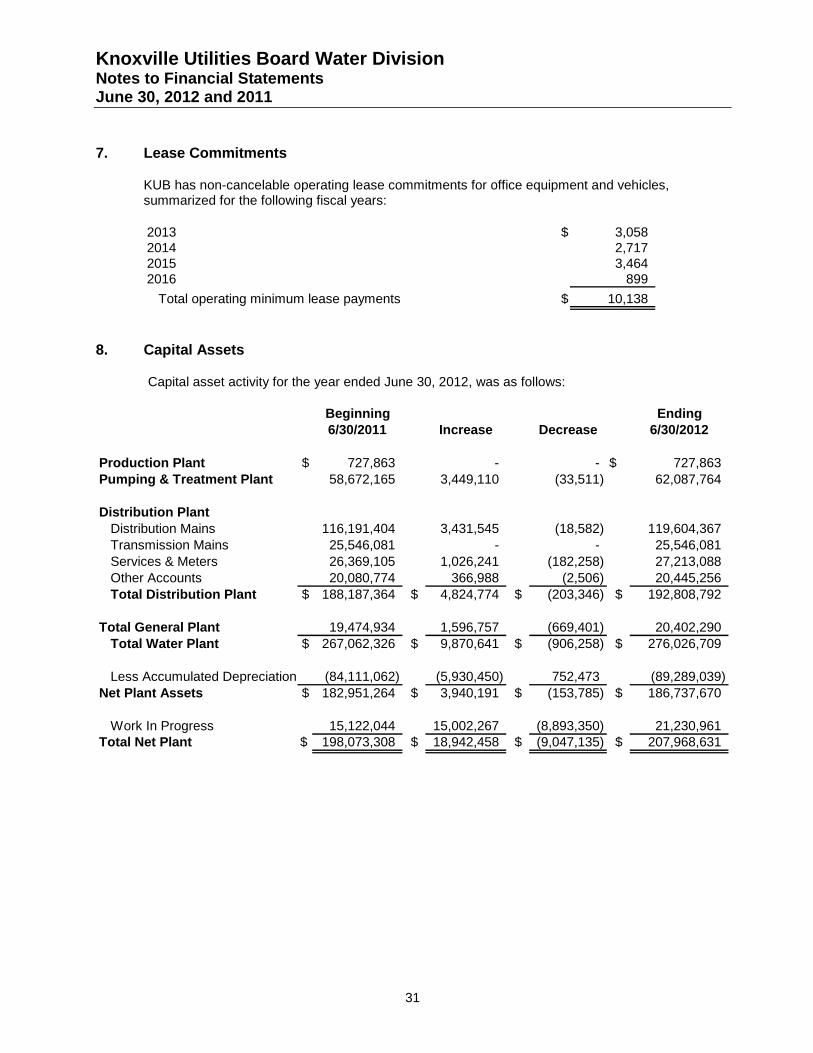
Knoxville Utilities Board Water Division Notes to Financial Statements June 30, 2012 and 2011
31
7. Lease Commitments
KUB has non-cancelable operating lease commitments for office equipment and vehicles, summarized for the following fiscal years:
2013 $ 3,058 2014 2,717 2015 3,464 2016 899
Total operating minimum lease payments $ 10,138
8. Capital Assets
Capital asset activity for the year ended June 30, 2012, was as follows:
Beginning Ending6/30/2011 Increase Decrease 6/30/2012
Production Plant $ 727,863 - - $ 727,863 Pumping & Treatment Plant 58,672,165 3,449,110 (33,511) 62,087,764
Distribution Plant
Distribution Mains 116,191,404 3,431,545 (18,582) 119,604,367 Transmission Mains 25,546,081 - - 25,546,081 Services & Meters 26,369,105 1,026,241 (182,258) 27,213,088 Other Accounts 20,080,774 366,988 (2,506) 20,445,256 Total Distribution Plant $ 188,187,364 $ 4,824,774 $ (203,346) $ 192,808,792
Total General Plant 19,474,934 1,596,757 (669,401) 20,402,290
Total Water Plant $ 267,062,326 $ 9,870,641 $ (906,258) $ 276,026,709
Less Accumulated Depreciation (84,111,062) (5,930,450) 752,473 (89,289,039) Net Plant Assets $ 182,951,264 $ 3,940,191 $ (153,785) $ 186,737,670
Work In Progress 15,122,044 15,002,267 (8,893,350) 21,230,961 Total Net Plant $ 198,073,308 $ 18,942,458 $ (9,047,135) $ 207,968,631
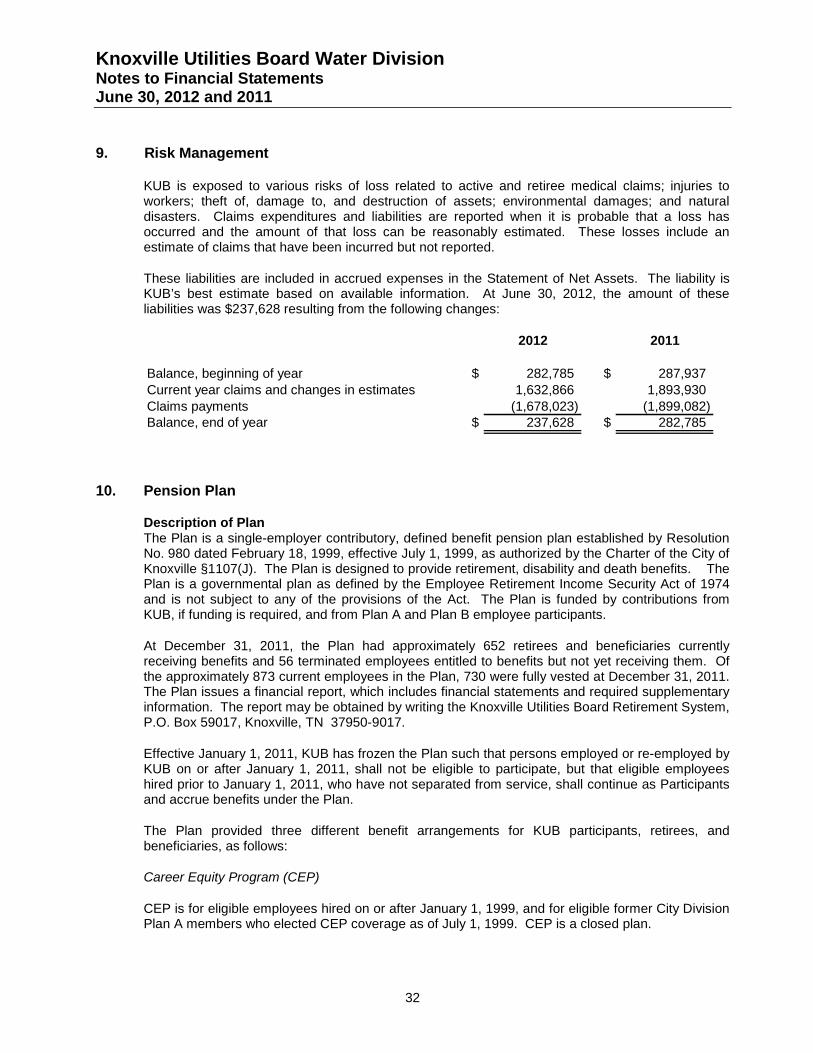
Knoxville Utilities Board Water Division Notes to Financial Statements June 30, 2012 and 2011
32
9. Risk Management
KUB is exposed to various risks of loss related to active and retiree medical claims; injuries to workers; theft of, damage to, and destruction of assets; environmental damages; and natural disasters. Claims expenditures and liabilities are reported when it is probable that a loss has occurred and the amount of that loss can be reasonably estimated. These losses include an estimate of claims that have been incurred but not reported.
These liabilities are included in accrued expenses in the Statement of Net Assets. The liability is KUB’s best estimate based on available information. At June 30, 2012, the amount of these liabilities was $237,628 resulting from the following changes:
2012 2011
Balance, beginning of year $ 282,785 $ 287,937 Current year claims and changes in estimates 1,632,866 1,893,930 Claims payments (1,678,023) (1,899,082) Balance, end of year $ 237,628 $ 282,785
10. Pension Plan
Description of Plan The Plan is a single-employer contributory, defined benefit pension plan established by Resolution No. 980 dated February 18, 1999, effective July 1, 1999, as authorized by the Charter of the City of Knoxville §1107(J). The Plan is designed to provide retirement, disability and death benefits. The Plan is a governmental plan as defined by the Employee Retirement Income Security Act of 1974 and is not subject to any of the provisions of the Act. The Plan is funded by contributions from KUB, if funding is required, and from Plan A and Plan B employee participants.
At December 31, 2011, the Plan had approximately 652 retirees and beneficiaries currently receiving benefits and 56 terminated employees entitled to benefits but not yet receiving them. Of the approximately 873 current employees in the Plan, 730 were fully vested at December 31, 2011. The Plan issues a financial report, which includes financial statements and required supplementary information. The report may be obtained by writing the Knoxville Utilities Board Retirement System, P.O. Box 59017, Knoxville, TN 37950-9017.
Effective January 1, 2011, KUB has frozen the Plan such that persons employed or re-employed by KUB on or after January 1, 2011, shall not be eligible to participate, but that eligible employees hired prior to January 1, 2011, who have not separated from service, shall continue as Participants and accrue benefits under the Plan.
The Plan provided three different benefit arrangements for KUB participants, retirees, and beneficiaries, as follows:
Career Equity Program (CEP)
CEP is for eligible employees hired on or after January 1, 1999, and for eligible former City Division Plan A members who elected CEP coverage as of July 1, 1999. CEP is a closed plan.
Knoxville Utilities Board Water Division Notes to Financial Statements June 30, 2012 and 2011
33
All eligible employees became participants on the date of his/her KUB employment. Participants are covered by Social Security. Participation in CEP does not require or permit employee contributions.
Plan A Plan A benefits are for former City Division Plan A active employees, vested terminated employees, retirees, and beneficiaries. Plan A is a closed plan.
All employees participating in the City Division Plan A as of June 30, 1999, were eligible to participate in KUB’s Plan A or the CEP program. Participants of Plan A are covered by Social Security. Plan A is a closed plan and is not available to KUB employees hired after July 1, 1999. Participation in Plan A requires employee contributions of 3 percent of the first $4,800 of annual earnings and 5 percent of annual earnings in excess of $4,800. Plan A provides for early retirement benefits with 25 years of service and normal retirement benefits at age 62 or older.
Plan B Plan B benefits are for former City Division Plan B active employees, vested terminated employees, retirees, and beneficiaries. Plan B is a closed plan.
All employees participating in the City Division Plan B as of June 30, 1999 are eligible to participate in KUB’s Plan B. Plan B is now a closed plan and no participants can be added. Participants of Plan B are not covered by Social Security. Participation in Plan B requires employee contributions of 4 percent of annual earnings. Plan B provides for retirement benefits after 25 years of service and the attainment of age 50.
Funding Policy For the Plan year ended December 31, 2011, a contribution of $3,593,282 is required to be made in the Plan sponsor’s fiscal year ending June 30, 2013. The Water Division’s portion of this contribution is $467,127. The annual required contribution was determined as part of the January 1, 2011 valuation using the Individual Entry Age Normal funding method. The objective under this method is to fund each participant’s benefits under the Plan as payments which are level as a percentage of salary, starting on the original participation date (employment date) and continuing until the assumed retirement, termination, disability or death. For the Plan year ended December 31, 2011, the Plan’s actuarial funded ratio was 104.5 percent.
At the time the funding method is introduced, there is a liability, which represents the contributions that would have been accumulated if this method of funding had always been used. The excess, if any, of this liability over the actuarial value of the assets held in the fund, is the unfunded actuarial accrued liability, which is typically funded over a chosen period in accordance with an amortization schedule.
Significant actuarial assumptions used in the valuation include (a) rate of return of investments of 8 percent, (b) the RP2000 Mortality Table, (c) annual projected salary increases based on participants’ ages ranging from age 25 to age 65 with salary increases from 2.58 percent to 7.92 percent, and (d) cost of living adjustment of 2.8 percent annually. The actuarial value of assets was determined using techniques that smooth the effect of short-term volatility in the market value of equities over a five-year period.
As of the actuarial report for the Plan year ended December 31, 2011, contributions of $3,593,282 and $3,244,057 for 2011 and 2010, respectively, are required to be made during the Plan sponsor’s fiscal years ending June 30, 2013 and 2012, respectively. Of these amounts, $467,127 and $421,727 are attributable to the Water Division.
Knoxville Utilities Board Water Division Notes to Financial Statements June 30, 2012 and 2011
34
Subsequent to June 30, 2012, the actuarial report for the Plan year ending December 31, 2012 was completed. For the Plan year ending December 31, 2012, a contribution of $5,502,677 is required to be made in the Plan sponsor’s fiscal year ending June 30, 2014. The Water Division’s portion of this contribution is $715,348. For the Plan year ending December 31, 2012, the Plan’s actuarial funded ratio was 94.1 percent.
11. Defined Contribution Plan
KUB has a defined contribution 401(k) employee retirement savings plan covering eligible KUB employees. Employees hired prior to January 1, 2011 may participate and receive a matching contribution of 50 percent of their own contribution up to a maximum match of 3 percent. Employees hired on or after January 1, 2011 have an enhanced 401(k) Plan due to the closure of the Defined Benefit Pension Plan. They may participate and receive a matching contribution of 50 percent of their own contribution up to a maximum match of 3 percent. They also receive a nonelective KUB contribution of from 3 percent to 6 percent, depending on years of service, whether they contribute or not.
Since July 1, 2000, 401(k) matching contributions for employees eligible to participate in the KUB Pension Plan have been funded by the Pension Plan. These funds are held by the Pension trustee until eligible for distribution. IRS rules permit the funding of 401(k) matching contributions from excess pension assets for employees covered under the Pension Plan. Based on the funding level of the Pension Plan, effective July 1, 2011, KUB began to reimburse the Pension Plan for the current matching contributions. The match and nonelective contributions for employees hired on or after January 1, 2011 are paid directly by KUB.
12. Other Post-Employment Benefits (OPEB)
The Governmental Accounting Standards Board (GASB) established new standards for the measurement, recognition, and reporting of other post-employment benefits (OPEB). OPEB includes post-employment benefits other than pension, which, for KUB, is presently limited to post-employment health care. GASB 45 requires the recognition of the accrued OPEB liability for the respective year, plus the disclosure of the total unfunded liability. GASB 45 was effective for KUB for the fiscal year beginning July 1, 2007.
KUB currently provides post-employment health care benefits to 633 former employees and 647 covered dependents. The cost of coverage is shared with retirees and beneficiaries. KUB recognizes its share of the cost of post-employment health care benefits as an expense as claims are paid. In anticipation of GASB 45, KUB amended its Group Health Plan in 1999, eliminating post-employment health care benefits for all employees hired on or after July 1, 1999. As of June 30, 2012, 450 active employees were eligible for individual and dependent coverage at separation if the employee meets the Rule of 80 (age plus years of service) with a minimum of 20 years of service. In May 2006, the state of Tennessee adopted Tennessee Code Annotated, Title 8, Chapter 50, Part 12 authorizing governmental entities to establish Trusts for the purpose of pre-funding their respective OPEB liabilities.
Knoxville Utilities Board Water Division Notes to Financial Statements June 30, 2012 and 2011
35
Although GASB 45 does not require pre-funding of the liability, KUB has determined that it is in the long-term economic interest of KUB and its ratepayers to establish a Trust to pre-fund KUB’s OPEB liability.
In October 2007, the KUB Board authorized the establishment of an OPEB Trust. The applicable documentation was submitted to the State Funding Board and, in December 2007, the State Funding Board approved the Trust. The Trust was also approved by the Internal Revenue Service in June 2008.
The Trust issues a financial report, which includes financial statements and required supplementary information. The report may be obtained by writing the Knoxville Utilities Board Retirement System, P.O. Box 59017, Knoxville, TN 37950-9017. The general administration and responsibility for the proper operation of the Trust is governed by a board of trustees, appointed by KUB’s President & CEO. The investment of all deposits to the Trust is governed by an Investment Policy, which was adopted by the KUB Board and approved by the State Funding Board.
Total contributions to the OPEB Trust for the fiscal year ended June 30, 2012 were $8.1 million (Division’s share $1.1 million). The contribution to the Trust exceeded the annual required contribution (ARC), as determined by the Postretirement Benefit Plan’s actuarial valuation for the year ended December 31, 2010, which was $4.6 million (Division’s share $0.6 million). As of June 30, 2012, the employer’s net OPEB obligation was $1.7 million (Division’s share $ 0.2 million).
The ARC for the fiscal year ending June 30, 2013, as determined by the Plan’s actuarial valuation for the year ended December 31, 2011 is $3.3 million (Division’s share $0.4 million).
The actuarial valuation for the Plan for the year ending December 31, 2012 has been completed. The valuation determined that the Plan’s actuarial accrued liability was $61.6 million (Division’s share $8 million). The actuarial value of the Plan’s assets was $37.9 million (Division’s share $4.9 million). As a result, the Plan’s unfunded actuarial accrued liability was $23.7 million (Division’s share $3.1 million). The Plan’s actuarial funded ratio was 62 percent. The valuation also determined that the employer’s ARC is $3.3 million for the fiscal year ending June 30, 2014 (Division’s share $0.4 million).
Knoxville Utilities Board Water Division Notes to Financial Statements June 30, 2012 and 2011
36
13. Related Party Transactions
The Division, in the normal course of operations, is involved in transactions with the City of Knoxville and with other divisions of KUB. Such transactions for the years ended June 30, 2012 and 2011, are summarized as follows:
2012 2011
City of KnoxvilleAmounts billed by the Division for utilities and
related services $ 3,360,826 $ 3,294,776 Payments by the Division in lieu of property tax 2,220,441 2,102,941 Payments by the Division for services provided 475,644 273,686
Other divisions of KUBAmounts billed to other divisions for utilities
and related services provided 300,591 298,643 Interdivisional rental expense 155,703 187,380 Interdivisional rental income 83,714 88,092 Amounts billed to the Division by other divisions
for utilities services provided 2,988,475 2,986,382
With respect to these transactions, accounts receivable from and accounts payable to the City of Knoxville and the other divisions included in the balance sheet at year end were:
2012 2011
Accounts receivable $ 275,310 $ 277,024
14. Other Commitments and Contingencies
In the normal course of business, there are various lawsuits pending against KUB. Management has reviewed these lawsuits with counsel, who is vigorously defending KUB's position and is of the opinion that the ultimate disposition of these matters will not have a material adverse effect on KUB's financial position, results of operations or cash flows.
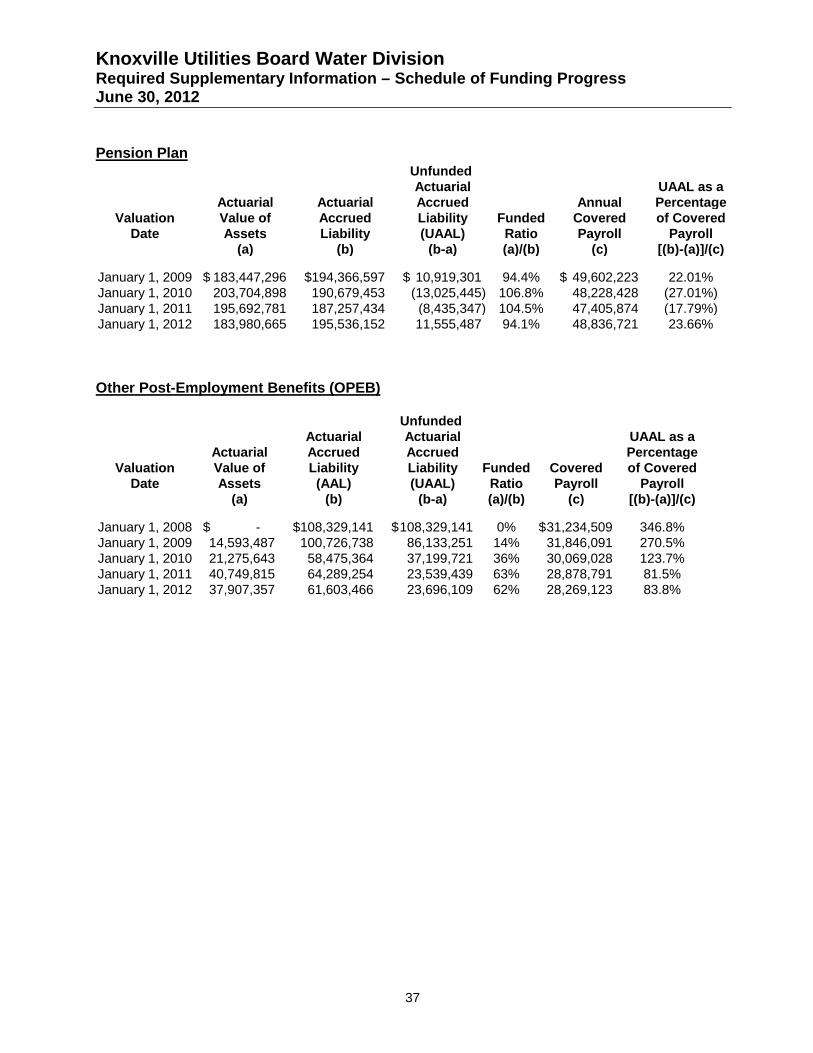
Knoxville Utilities Board Water Division Required Supplementary Information – Schedule of Funding Progress June 30, 2012
37
Unfunded Actuarial UAAL as a
Actuarial Actuarial Accrued Annual PercentageValuation Value of Accrued Liability Funded Covered of Covered
Date Assets Liability (UAAL) Ratio Payroll Payroll(a) (b) (b-a) (a)/(b) (c) [(b)-(a)]/(c)
January 1, 2009 183,447,296$ 194,366,597$ 10,919,301$ 94.4% 49,602,223$ 22.01%January 1, 2010 203,704,898 190,679,453 (13,025,445) 106.8% 48,228,428 (27.01%)January 1, 2011 195,692,781 187,257,434 (8,435,347) 104.5% 47,405,874 (17.79%)January 1, 2012 183,980,665 195,536,152 11,555,487 94.1% 48,836,721 23.66%
Pension Plan
Other Post-Employment Benefits (OPEB)
Unfunded Actuarial Actuarial UAAL as a
Actuarial Accrued Accrued PercentageValuation Value of Liability Liability Funded Covered of Covered
Date Assets (AAL) (UAAL) Ratio Payroll Payroll(a) (b) (b-a) (a)/(b) (c) [(b)-(a)]/(c)
January 1, 2008 -$ 108,329,141$ 108,329,141$ 0% 31,234,509$ 346.8%January 1, 2009 14,593,487 100,726,738 86,133,251 14% 31,846,091 270.5%January 1, 2010 21,275,643 58,475,364 37,199,721 36% 30,069,028 123.7%January 1, 2011 40,749,815 64,289,254 23,539,439 63% 28,878,791 81.5%January 1, 2012 37,907,357 61,603,466 23,696,109 62% 28,269,123 83.8%
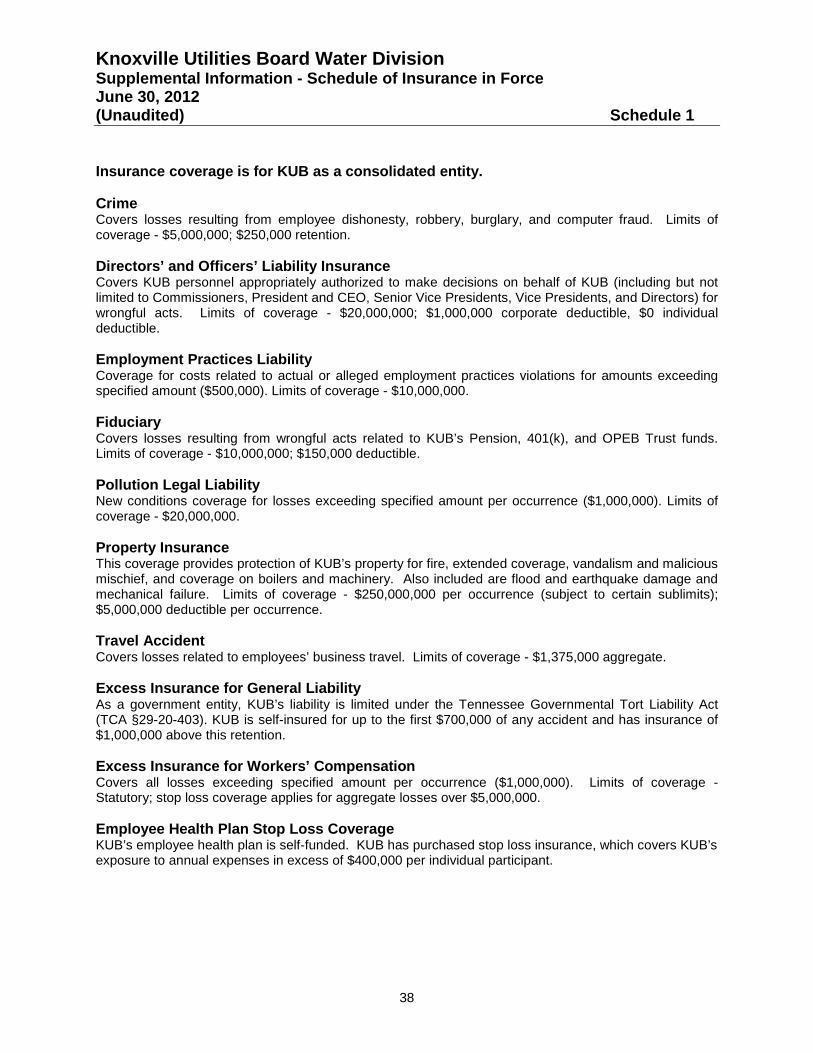
Knoxville Utilities Board Water Division Supplemental Information - Schedule of Insurance in Force June 30, 2012 (Unaudited) Schedule 1
38
Insurance coverage is for KUB as a consolidated entity. Crime Covers losses resulting from employee dishonesty, robbery, burglary, and computer fraud. Limits of coverage - $5,000,000; $250,000 retention. Directors’ and Officers’ Liability Insurance Covers KUB personnel appropriately authorized to make decisions on behalf of KUB (including but not limited to Commissioners, President and CEO, Senior Vice Presidents, Vice Presidents, and Directors) for wrongful acts. Limits of coverage - $20,000,000; $1,000,000 corporate deductible, $0 individual deductible. Employment Practices Liability Coverage for costs related to actual or alleged employment practices violations for amounts exceeding specified amount ($500,000). Limits of coverage - $10,000,000. Fiduciary Covers losses resulting from wrongful acts related to KUB’s Pension, 401(k), and OPEB Trust funds. Limits of coverage - $10,000,000; $150,000 deductible. Pollution Legal Liability New conditions coverage for losses exceeding specified amount per occurrence ($1,000,000). Limits of coverage - $20,000,000. Property Insurance This coverage provides protection of KUB’s property for fire, extended coverage, vandalism and malicious mischief, and coverage on boilers and machinery. Also included are flood and earthquake damage and mechanical failure. Limits of coverage - $250,000,000 per occurrence (subject to certain sublimits); $5,000,000 deductible per occurrence. Travel Accident Covers losses related to employees’ business travel. Limits of coverage - $1,375,000 aggregate. Excess Insurance for General Liability As a government entity, KUB’s liability is limited under the Tennessee Governmental Tort Liability Act (TCA §29-20-403). KUB is self-insured for up to the first $700,000 of any accident and has insurance of $1,000,000 above this retention. Excess Insurance for Workers’ Compensation Covers all losses exceeding specified amount per occurrence ($1,000,000). Limits of coverage - Statutory; stop loss coverage applies for aggregate losses over $5,000,000. Employee Health Plan Stop Loss Coverage KUB’s employee health plan is self-funded. KUB has purchased stop loss insurance, which covers KUB’s exposure to annual expenses in excess of $400,000 per individual participant.
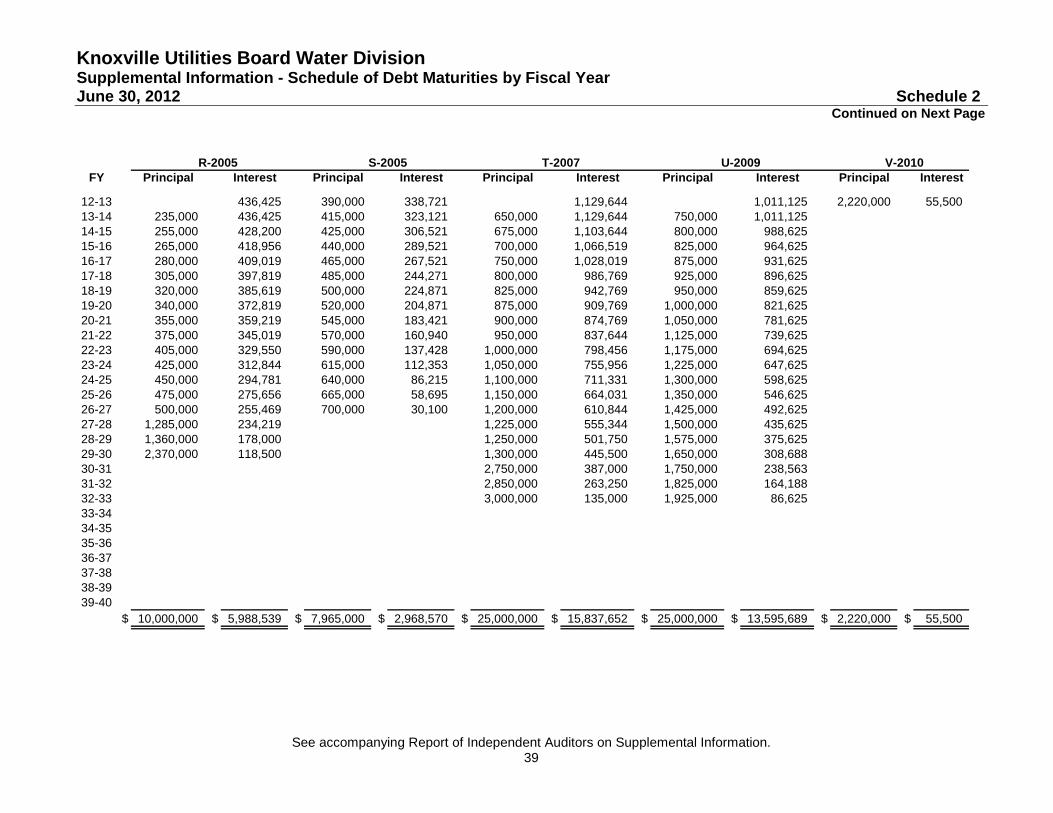
Knoxville Utilities Board Water Division Supplemental Information - Schedule of Debt Maturities by Fiscal Year June 30, 2012 Schedule 2
See accompanying Report of Independent Auditors on Supplemental Information. 39
Continued on Next Page
R-2005 S-2005 T-2007 U-2009 V-2010
FY Principal Interest Principal Interest Principal Interest Principal Interest Principal Interest
12-13 436,425 390,000 338,721 1,129,644 1,011,125 2,220,000 55,500 13-14 235,000 436,425 415,000 323,121 650,000 1,129,644 750,000 1,011,125 14-15 255,000 428,200 425,000 306,521 675,000 1,103,644 800,000 988,625 15-16 265,000 418,956 440,000 289,521 700,000 1,066,519 825,000 964,625 16-17 280,000 409,019 465,000 267,521 750,000 1,028,019 875,000 931,625 17-18 305,000 397,819 485,000 244,271 800,000 986,769 925,000 896,625 18-19 320,000 385,619 500,000 224,871 825,000 942,769 950,000 859,625 19-20 340,000 372,819 520,000 204,871 875,000 909,769 1,000,000 821,625 20-21 355,000 359,219 545,000 183,421 900,000 874,769 1,050,000 781,625 21-22 375,000 345,019 570,000 160,940 950,000 837,644 1,125,000 739,625 22-23 405,000 329,550 590,000 137,428 1,000,000 798,456 1,175,000 694,625 23-24 425,000 312,844 615,000 112,353 1,050,000 755,956 1,225,000 647,625 24-25 450,000 294,781 640,000 86,215 1,100,000 711,331 1,300,000 598,625 25-26 475,000 275,656 665,000 58,695 1,150,000 664,031 1,350,000 546,625 26-27 500,000 255,469 700,000 30,100 1,200,000 610,844 1,425,000 492,625 27-28 1,285,000 234,219 1,225,000 555,344 1,500,000 435,625 28-29 1,360,000 178,000 1,250,000 501,750 1,575,000 375,625 29-30 2,370,000 118,500 1,300,000 445,500 1,650,000 308,688 30-31 2,750,000 387,000 1,750,000 238,563 31-32 2,850,000 263,250 1,825,000 164,188 32-33 3,000,000 135,000 1,925,000 86,625 33-3434-3535-3636-3737-3838-3939-40
$ 10,000,000 $ 5,988,539 $ 7,965,000 $ 2,968,570 $ 25,000,000 $ 15,837,652 $ 25,000,000 $ 13,595,689 $ 2,220,000 $ 55,500
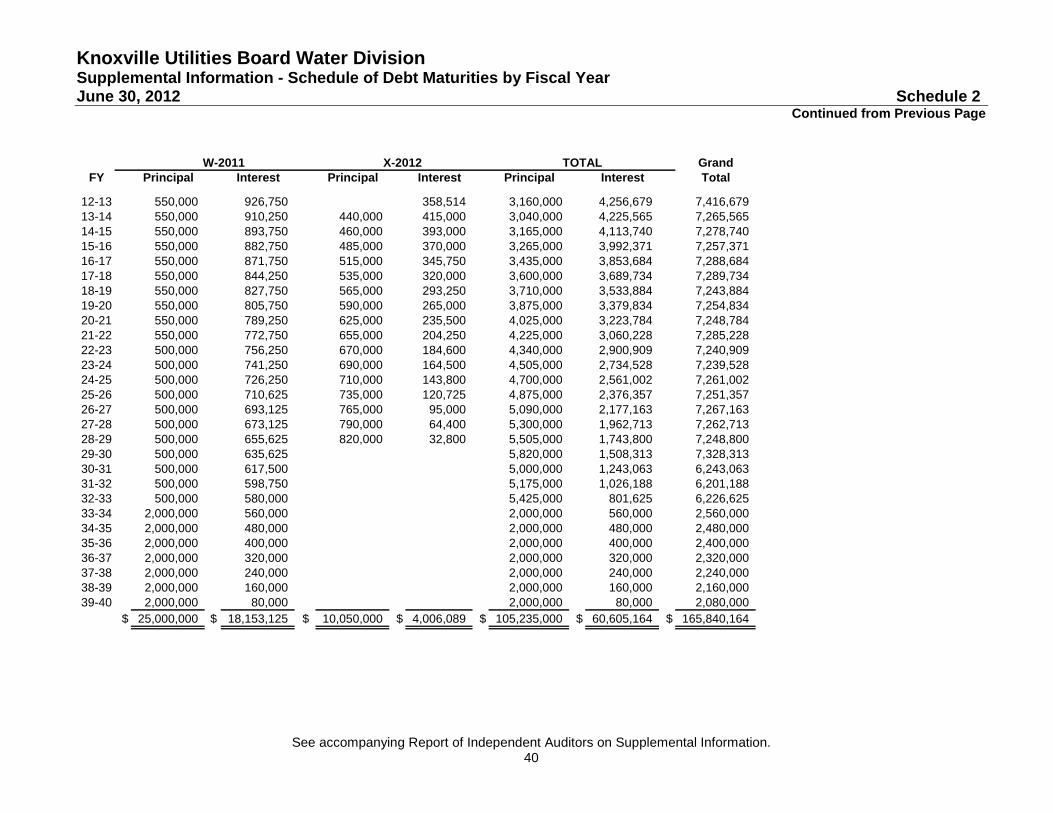
Knoxville Utilities Board Water Division Supplemental Information - Schedule of Debt Maturities by Fiscal Year June 30, 2012 Schedule 2
See accompanying Report of Independent Auditors on Supplemental Information. 40
Continued from Previous Page
W-2011 X-2012 TOTAL GrandFY Principal Interest Principal Interest Principal Interest Total
12-13 550,000 926,750 358,514 3,160,000 4,256,679 7,416,679 13-14 550,000 910,250 440,000 415,000 3,040,000 4,225,565 7,265,565 14-15 550,000 893,750 460,000 393,000 3,165,000 4,113,740 7,278,740 15-16 550,000 882,750 485,000 370,000 3,265,000 3,992,371 7,257,371 16-17 550,000 871,750 515,000 345,750 3,435,000 3,853,684 7,288,684 17-18 550,000 844,250 535,000 320,000 3,600,000 3,689,734 7,289,734 18-19 550,000 827,750 565,000 293,250 3,710,000 3,533,884 7,243,884 19-20 550,000 805,750 590,000 265,000 3,875,000 3,379,834 7,254,834 20-21 550,000 789,250 625,000 235,500 4,025,000 3,223,784 7,248,784 21-22 550,000 772,750 655,000 204,250 4,225,000 3,060,228 7,285,228 22-23 500,000 756,250 670,000 184,600 4,340,000 2,900,909 7,240,909 23-24 500,000 741,250 690,000 164,500 4,505,000 2,734,528 7,239,528 24-25 500,000 726,250 710,000 143,800 4,700,000 2,561,002 7,261,002 25-26 500,000 710,625 735,000 120,725 4,875,000 2,376,357 7,251,357 26-27 500,000 693,125 765,000 95,000 5,090,000 2,177,163 7,267,163 27-28 500,000 673,125 790,000 64,400 5,300,000 1,962,713 7,262,713 28-29 500,000 655,625 820,000 32,800 5,505,000 1,743,800 7,248,800 29-30 500,000 635,625 5,820,000 1,508,313 7,328,313 30-31 500,000 617,500 5,000,000 1,243,063 6,243,063 31-32 500,000 598,750 5,175,000 1,026,188 6,201,188 32-33 500,000 580,000 5,425,000 801,625 6,226,625 33-34 2,000,000 560,000 2,000,000 560,000 2,560,000 34-35 2,000,000 480,000 2,000,000 480,000 2,480,000 35-36 2,000,000 400,000 2,000,000 400,000 2,400,000 36-37 2,000,000 320,000 2,000,000 320,000 2,320,000 37-38 2,000,000 240,000 2,000,000 240,000 2,240,000 38-39 2,000,000 160,000 2,000,000 160,000 2,160,000 39-40 2,000,000 80,000 2,000,000 80,000 2,080,000
$ 25,000,000 $ 18,153,125 $ 10,050,000 $ 4,006,089 $ 105,235,000 $ 60,605,164 $ 165,840,164
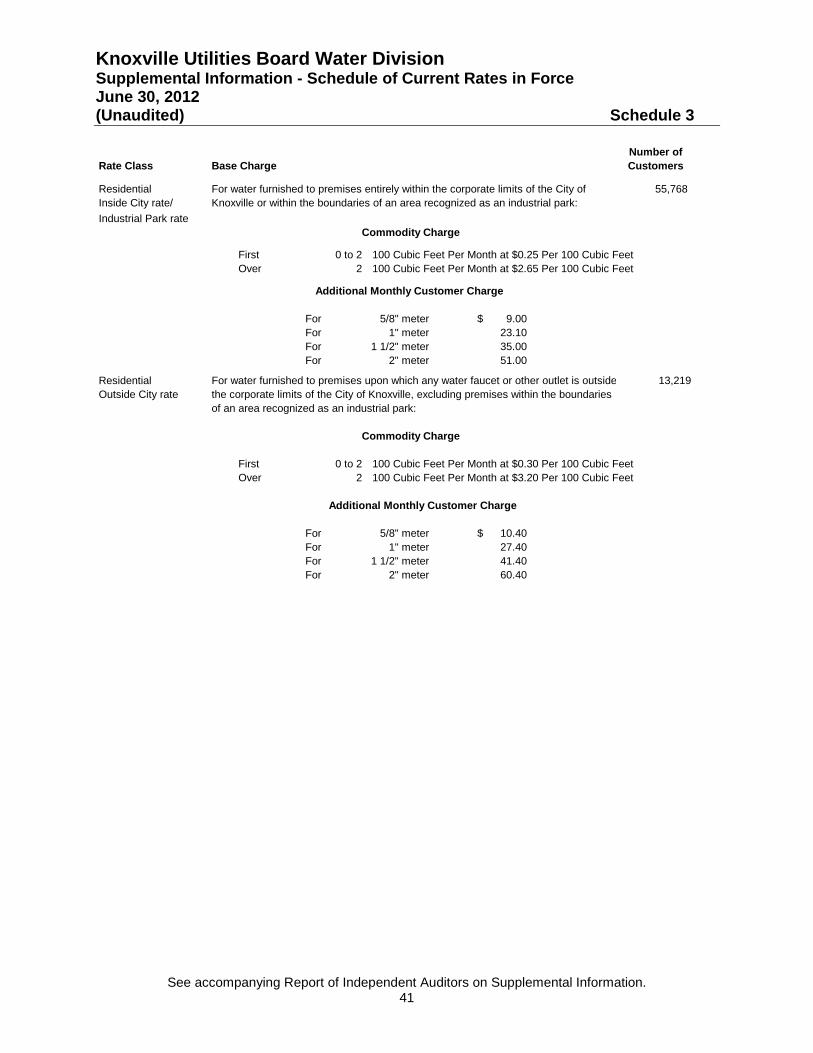
Knoxville Utilities Board Water Division Supplemental Information - Schedule of Current Rates in Force June 30, 2012 (Unaudited) Schedule 3
See accompanying Report of Independent Auditors on Supplemental Information. 41
Number ofRate Class Base Charge Customers
Residential For water furnished to premises entirely within the corporate limits of the City of 55,768 Inside City rate/ Knoxville or within the boundaries of an area recognized as an industrial park:Industrial Park rate
Commodity Charge
First 0 to 2 100 Cubic Feet Per Month at $0.25 Per 100 Cubic FeetOver 2 100 Cubic Feet Per Month at $2.65 Per 100 Cubic Feet
Additional Monthly Customer Charge
For 5/8" meter 9.00$ For 1" meter 23.10 For 1 1/2" meter 35.00 For 2" meter 51.00
Residential For water furnished to premises upon which any water faucet or other outlet is outside 13,219Outside City rate the corporate limits of the City of Knoxville, excluding premises within the boundaries
of an area recognized as an industrial park:
Commodity Charge
First 0 to 2 100 Cubic Feet Per Month at $0.30 Per 100 Cubic FeetOver 2 100 Cubic Feet Per Month at $3.20 Per 100 Cubic Feet
Additional Monthly Customer Charge
For 5/8" meter 10.40$ For 1" meter 27.40 For 1 1/2" meter 41.40 For 2" meter 60.40
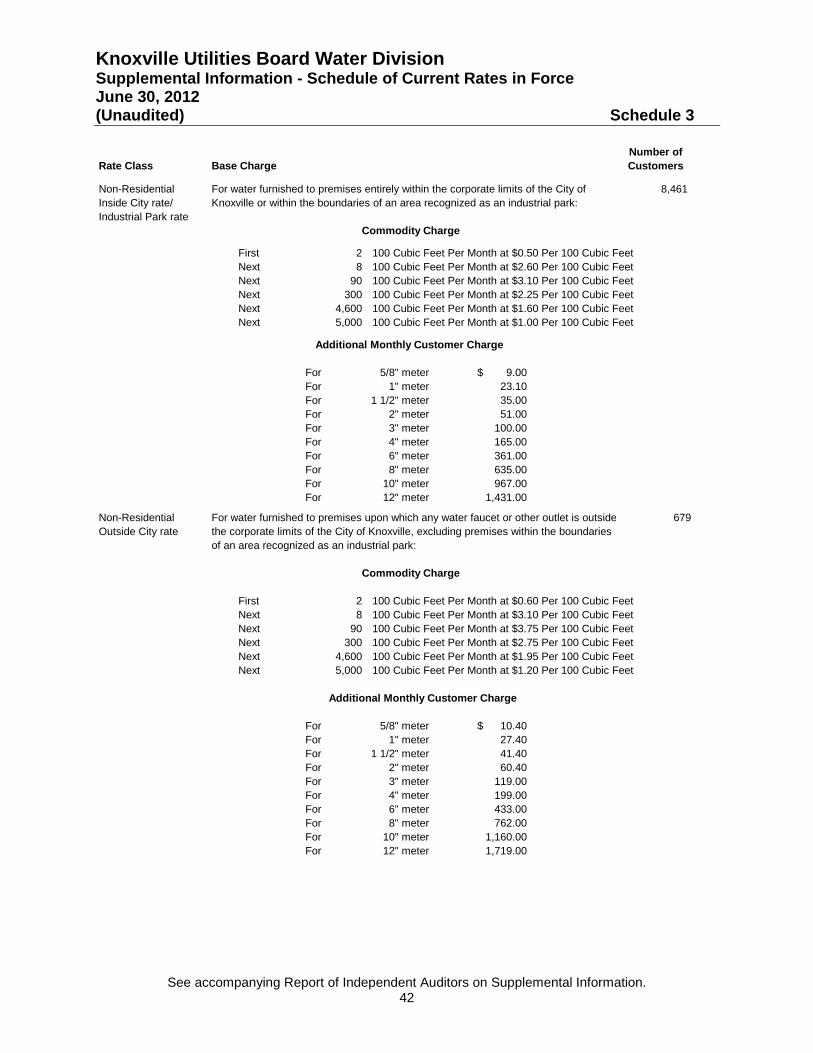
Knoxville Utilities Board Water Division Supplemental Information - Schedule of Current Rates in Force June 30, 2012 (Unaudited) Schedule 3
See accompanying Report of Independent Auditors on Supplemental Information. 42
Number ofRate Class Base Charge Customers
Non-Residential For water furnished to premises entirely within the corporate limits of the City of 8,461 Inside City rate/ Knoxville or within the boundaries of an area recognized as an industrial park:Industrial Park rate
Commodity Charge
First 2 100 Cubic Feet Per Month at $0.50 Per 100 Cubic FeetNext 8 100 Cubic Feet Per Month at $2.60 Per 100 Cubic FeetNext 90 100 Cubic Feet Per Month at $3.10 Per 100 Cubic FeetNext 300 100 Cubic Feet Per Month at $2.25 Per 100 Cubic FeetNext 4,600 100 Cubic Feet Per Month at $1.60 Per 100 Cubic FeetNext 5,000 100 Cubic Feet Per Month at $1.00 Per 100 Cubic Feet
Additional Monthly Customer Charge
For 5/8" meter 9.00$ For 1" meter 23.10 For 1 1/2" meter 35.00 For 2" meter 51.00 For 3" meter 100.00 For 4" meter 165.00 For 6" meter 361.00 For 8" meter 635.00 For 10" meter 967.00 For 12" meter 1,431.00
Non-Residential For water furnished to premises upon which any water faucet or other outlet is outside 679Outside City rate the corporate limits of the City of Knoxville, excluding premises within the boundaries
of an area recognized as an industrial park:
Commodity Charge
First 2 100 Cubic Feet Per Month at $0.60 Per 100 Cubic FeetNext 8 100 Cubic Feet Per Month at $3.10 Per 100 Cubic FeetNext 90 100 Cubic Feet Per Month at $3.75 Per 100 Cubic FeetNext 300 100 Cubic Feet Per Month at $2.75 Per 100 Cubic FeetNext 4,600 100 Cubic Feet Per Month at $1.95 Per 100 Cubic FeetNext 5,000 100 Cubic Feet Per Month at $1.20 Per 100 Cubic Feet
Additional Monthly Customer Charge
For 5/8" meter 10.40$ For 1" meter 27.40 For 1 1/2" meter 41.40 For 2" meter 60.40 For 3" meter 119.00 For 4" meter 199.00 For 6" meter 433.00 For 8" meter 762.00 For 10" meter 1,160.00 For 12" meter 1,719.00
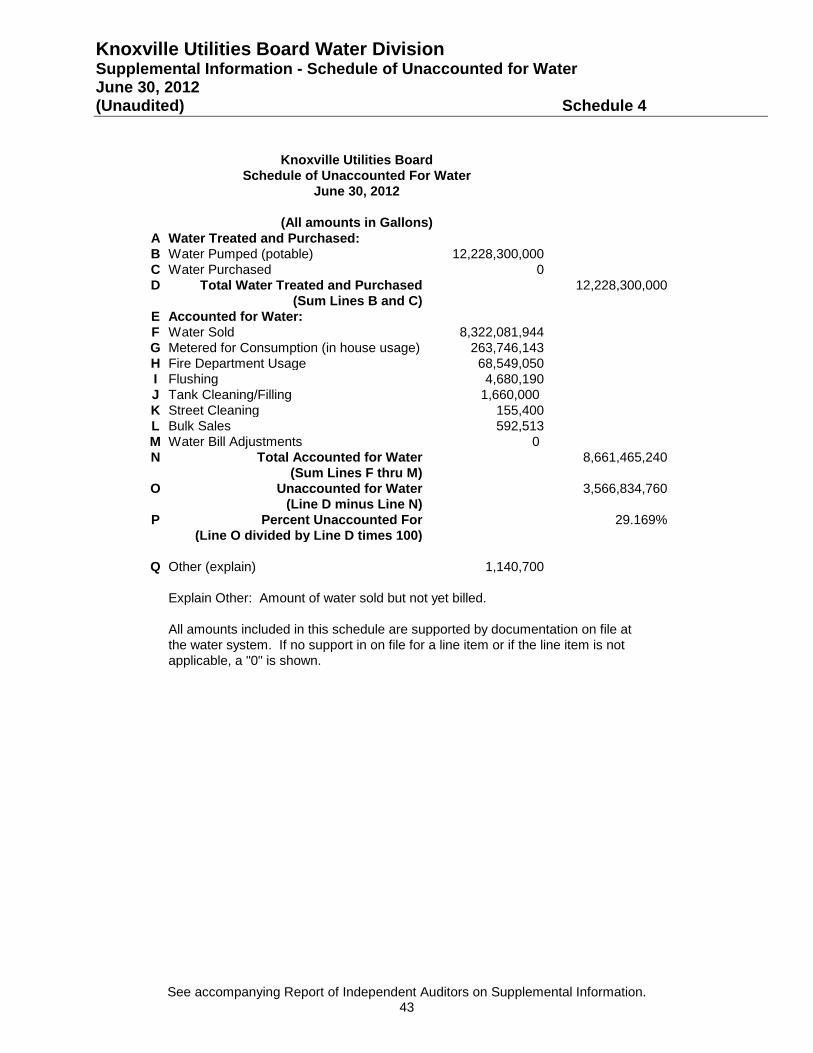
Knoxville Utilities Board Water Division Supplemental Information - Schedule of Unaccounted for Water June 30, 2012 (Unaudited) Schedule 4
See accompanying Report of Independent Auditors on Supplemental Information. 43
DRAFT
A Water Treated and Purchased:B Water Pumped (potable) 12,228,300,000C Water Purchased 0D Total Water Treated and Purchased 12,228,300,000
(Sum Lines B and C)E Accounted for Water:F Water Sold 8,322,081,944G Metered for Consumption (in house usage) 263,746,143H Fire Department Usage 68,549,050I Flushing 4,680,190J Tank Cleaning/Filling 1,660,000K Street Cleaning 155,400L Bulk Sales 592,513M Water Bill Adjustments 0N Total Accounted for Water 8,661,465,240
(Sum Lines F thru M)O Unaccounted for Water 3,566,834,760
(Line D minus Line N)P Percent Unaccounted For 29.169%
(Line O divided by Line D times 100)
Q Other (explain) 1,140,700
Explain Other: Amount of water sold but not yet billed.
All amounts included in this schedule are supported by documentation on file atthe water system. If no support in on file for a line item or if the line item is not applicable, a "0" is shown.
Knoxville Utilities BoardSchedule of Unaccounted For Water
June 30, 2012
(All amounts in Gallons)
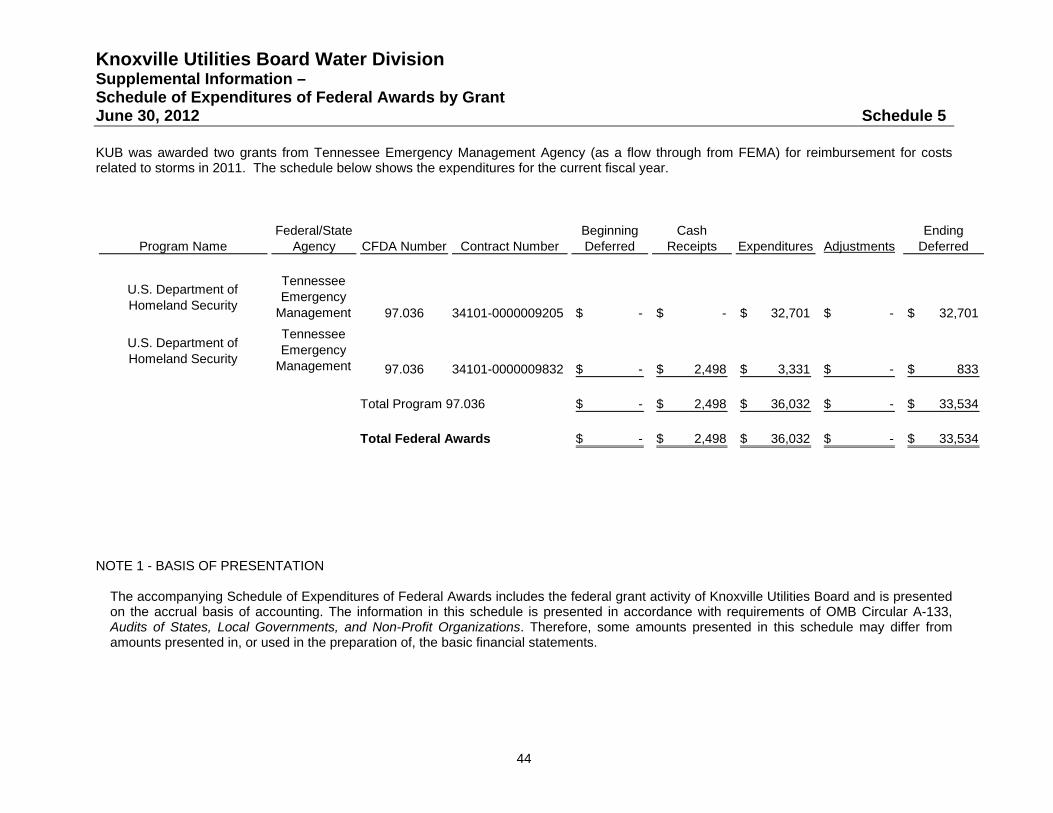
Knoxville Utilities Board Water Division Supplemental Information – Schedule of Expenditures of Federal Awards by Grant June 30, 2012 Schedule 5
44
KUB was awarded two grants from Tennessee Emergency Management Agency (as a flow through from FEMA) for reimbursement for costs related to storms in 2011. The schedule below shows the expenditures for the current fiscal year.
Federal/State Beginning Cash EndingProgram Name Agency CFDA Number Contract Number Deferred Receipts Expenditures Adjustments Deferred
U.S. Department of Homeland Security
Tennessee Emergency
Management 97.036 34101-0000009205 -$ -$ 32,701$ -$ 32,701$
U.S. Department of Homeland Security
Tennessee Emergency
Management 97.036 34101-0000009832 -$ 2,498$ 3,331$ -$ 833$
Total Program 97.036 -$ 2,498$ 36,032$ -$ 33,534$
Total Federal Awards -$ 2,498$ 36,032$ -$ 33,534$
NOTE 1 - BASIS OF PRESENTATION
The accompanying Schedule of Expenditures of Federal Awards includes the federal grant activity of Knoxville Utilities Board and is presented on the accrual basis of accounting. The information in this schedule is presented in accordance with requirements of OMB Circular A-133, Audits of States, Local Governments, and Non-Profit Organizations. Therefore, some amounts presented in this schedule may differ from amounts presented in, or used in the preparation of, the basic financial statements.
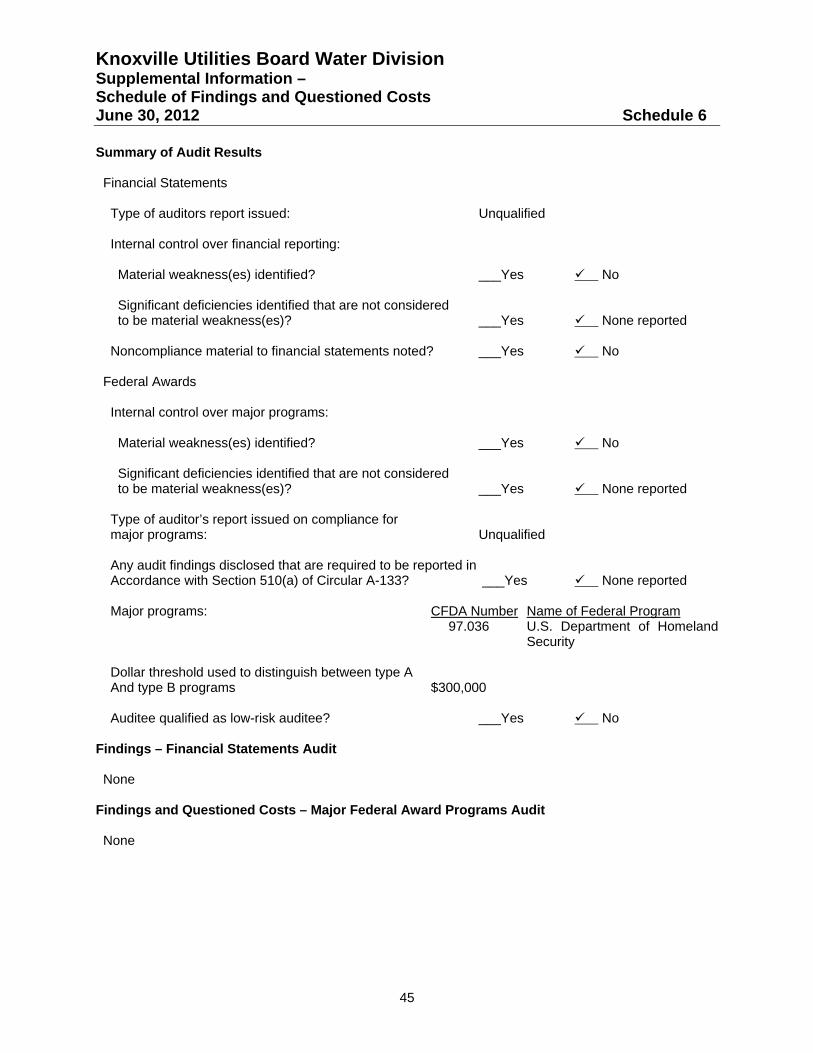
Knoxville Utilities Board Water Division Supplemental Information – Schedule of Findings and Questioned Costs June 30, 2012 Schedule 6
45
Summary of Audit Results Financial Statements Type of auditors report issued: Unqualified Internal control over financial reporting: Material weakness(es) identified? ___Yes No Significant deficiencies identified that are not considered to be material weakness(es)? ___Yes None reported Noncompliance material to financial statements noted? ___Yes No Federal Awards Internal control over major programs: Material weakness(es) identified? ___Yes No Significant deficiencies identified that are not considered to be material weakness(es)? ___Yes None reported Type of auditor’s report issued on compliance for major programs: Unqualified Any audit findings disclosed that are required to be reported in Accordance with Section 510(a) of Circular A-133? ___Yes None reported Major programs: CFDA Number Name of Federal Program
97.036 U.S. Department of Homeland Security
Dollar threshold used to distinguish between type A And type B programs $300,000 Auditee qualified as low-risk auditee? ___Yes No Findings – Financial Statements Audit None Findings and Questioned Costs – Major Federal Award Programs Audit None
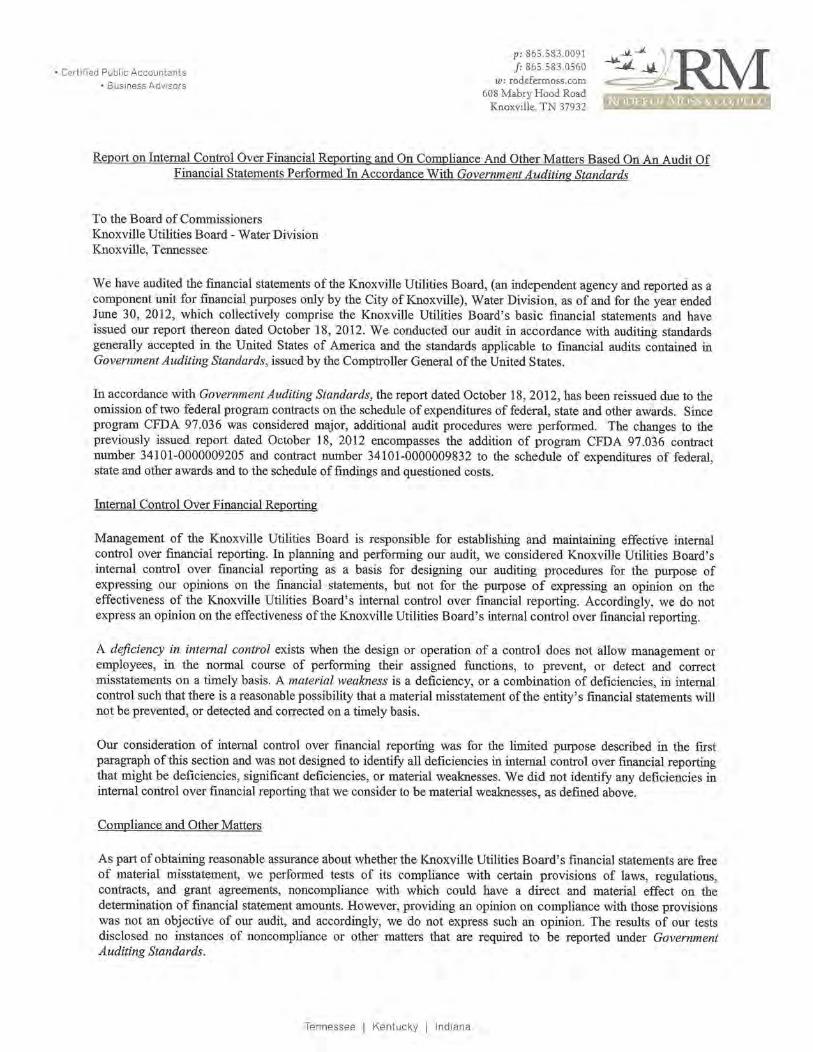


Knoxville Utilities Board Wastewater Division Financial Statements and Supplemental Information June 30, 2012 and 2011
Knoxville Utilities Board Wastewater Division Index June 30, 2012 and 2011 Page(s)
Independent Auditors’ Report ................................................................................................ 1-2
Management’s Discussion and Analysis .................................................................................. 3-19
Financial Statements
Statements of Net Assets ...................................................................................................... 20-21
Statements of Revenues, Expenses and Changes in Net Assets .............................................. 22
Statements of Cash Flows .......................................................................................................... 23
Notes to Financial Statements ............................................................................................... 24-38
Required Supplementary Information – Schedule of Funding Progress ..................................... 39
Supplemental Information:
Schedule 1 – Schedule of Insurance in Force ............................................................................ 40
Schedule 2 – Schedule of Debt Maturities by Fiscal Year ..................................................... 41-42
Schedule 3 – Schedule of Current Rates in Force ................................................................. 43-46
Schedule 4 – Schedule of Expenditures of Federal Awards ...................................................... 47
Schedule 5 – Schedule of Findings and Questioned Costs ........................................................ 48
Report of Independent Auditors on Internal Control over Financial Reporting and on Compliance and Other Matters Based on an Audit of Financial Statements Performed in Accordance with Government Auditing Standards .......................................................... 49-50 Report of Independent Auditors Report on Compliance with Requirements that could have a Direct Material Effect on each Major Program and on Internal Control over Compliance in Accordance with OMB Circular A-133 ...................................................... 51-52
Knoxville Utilities Board Wastewater Division Management’s Discussion and Analysis June 30, 2012 and 2011
3
Knoxville Utilities Board (KUB), comprised of the Electric Division, Water Division, Gas Division, and Wastewater Division (Divisions), is reported as a component unit enterprise fund in the financial statements of the City of Knoxville. KUB's responsibility is to oversee the purchase, production, distribution, and processing of electricity, water, natural gas, and wastewater services. A seven-member Board of Commissioners governs KUB. The Board has all powers to construct, acquire, expand, or operate the Divisions. It has full control and complete jurisdiction over the management and operation of the Divisions. The Wastewater Division (Division) provides services to certain customers in Knox County and in two surrounding counties in East Tennessee. The Division's accounts are maintained in conformity with the Uniform System of Accounts of the National Association of Regulatory Utility Commissioners (NARUC) and the Governmental Accounting Standards Board (GASB), as applicable. The financial statements present only the Wastewater Division and do not purport to, and do not, present fairly the consolidated financial position of Knoxville Utilities Board at June 30, 2012 and 2011, and the changes in its financial position for the years then ended in conformity with accounting principles generally accepted in the United States of America. The Division’s discussion and analysis is designed to (a) assist the reader in focusing on significant financial issues, (b) provide an overview of the Division’s financial activity, (c) identify major changes in the Division’s financial position, and (d) identify any financial concerns. The Division’s Management Discussion and Analysis (“MD&A”) focuses on the fiscal year ending June 30, 2012 activities, resulting changes and current known facts, and should be read in conjunction with the Division’s financial statements.
Wastewater Division Highlights System Highlights
The wastewater service area covers 242 square miles and includes 69,200 wastewater customers. KUB maintains 1,325 miles of services mains, 68 pump stations, and 4 treatment plants to treat 15.4 billion gallons of wastewater on an annual basis. Rated capacity for the wastewater system is 66 million gallons. The average daily flow is 42.2 million gallons daily. Financial Highlights The Division’s net assets increased $12 million or 5.3 percent, compared to a $9.4 million increase last fiscal year.
Operating revenue increased $4.7 million or 7.2 percent, the result of a 12 percent rate increase effective on April 2011 customer bills.
Operating expenses increased $1.3 million or 3.3 percent. Operating and maintenance (O&M) expenditures decreased $0.3 million or 1 percent. Depreciation expense rose $1.5 million or 13 percent. Taxes and tax equivalents increased $0.1 million or 3.1 percent.
Non-Operating revenues decreased $1.5 million from the prior year. Lower interest rates on longer-term investments resulted in a $0.1 million decrease in interest income. Interest expense increased $1.3 million or 7.5 percent, due to the issuance of $70 million in bonds in December 2010.
Capital contributions increased $0.6 million, the result of a rise in donated assets from developers compared to the previous fiscal year.
Total plant assets (net) increased $47.8 million or 9.1 percent over the end of the last fiscal year.
Long-term debt represented 62 percent of the Division’s capital structure as of June 30, 2012, as compared to 63.6 percent last year. The decline is attributed to a decrease in long-term debt, the
Knoxville Utilities Board Wastewater Division Management’s Discussion and Analysis June 30, 2012 and 2011
4
combined result of the April 2012 refunding of $18 million in debt, which reduced principal by $0.9 million, and the scheduled repayment of debt during the fiscal year. Capital structure equals long-term debt (which includes the current portion of revenue bonds and notes, as applicable, due to be retired the next fiscal year) plus net assets.
The Division’s bond covenants require a debt service coverage ratio of at least 1.2 times the maximum principal and interest payments over the life of the Division’s outstanding bonds. Current year and maximum debt coverage are 1.74.
Division Highlights
The wastewater system added approximately 400 customers during fiscal year 2012.
The Division refunded $18 million of long-term bonds at lower interest rates in April 2012. This refunding resulted in a savings of $2.7 million over the term of the debt (or $2.1 million on a net present value basis). The typical residential wastewater customer’s average monthly bill was $42.30 at fiscal year end, which is consistent with last year’s monthly bill. Although KUB is making upgrades to its Kuwahee and Fourth Creek wastewater treatment facilities in order to comply with the requirements of the Consent Decree (see below), KUB’s treatment plants continue to meet high standards of operation. Each of KUB’s four wastewater treatment plants won an award from the National Association of Clean Water Agencies for outstanding permit compliance in 2011. KUB also received a National Biosolids Partnership certification in December 2011 following a rigorous review process and independent audit. (Biosolids are nutrient-rich organic matter produced by wastewater treatment that can be recycled as fertilizer). Consent Decree In February 2005, a Consent Decree was entered into federal court regarding the operation of KUB’s wastewater system. Under the terms of the Consent Decree, the remediation of identified sanitary sewer overflows (“SSOs”) on KUB’s wastewater system must be completed by June 30, 2016. KUB anticipates the Division will spend approximately $530 million in capital investments through its PACE 10 program in order to comply with the terms of the Consent Decree related to the collection system. PACE 10 is an accelerated ten-year program to help improve Knoxville’s waterways, the quality of life, and the economic well being of the community. The Consent Decree also required KUB to perform an evaluation of the wet-weather performance and capacity of its wastewater treatment plants. In July 2007, KUB submitted a Composite Correction Plan (CCP) for its wastewater treatment plants to EPA for review. The development and filing of the CCP was a requirement of the federal order of February 2005. The CCP includes recommended improvements to KUB’s Kuwahee and Fourth Creek treatment plants to address wet weather capacity issues noted in prior assessments. The EPA approved the CCP in January 2009 including a recommended schedule of plant improvements that extends beyond the expiration date of the original Consent Decree. An amendment to the Consent Decree incorporating and establishing this schedule was agreed to by all parties and was entered on June 23, 2009. The purpose of the Amendment is to allow KUB to complete a portion of work outlined in the CCP after the Consent Decree deadline of June 30, 2016. The CCP provides for a biologically enhanced high-rate clarification (the “BEHRC”) secondary treatment system to be installed at the Fourth Creek treatment plant by June 30, 2018 and at the Kuwahee treatment plant by June 30, 2021. The total cost of such improvements is estimated to be approximately $120 million. KUB’s total estimated capital investment to comply with the terms of the Consent Decree is $650 million.
Knoxville Utilities Board Wastewater Division Management’s Discussion and Analysis June 30, 2012 and 2011
5
During fiscal year 2006, KUB launched the Private Lateral Program (PLP), as required by the Consent Decree, under which KUB tests private collection system laterals on its wastewater system over a ten-year period. Defective laterals and improper connections can introduce rainwater overloading the wastewater system and add pollution to area waterways. If a private lateral fails the respective inspection test, then the customer is required to have the lateral repaired/replaced within a specified time period. The $2 million SEP provides funding for lateral repairs/replacements for eligible low-income customers. All of the SEP funds were disbursed as of April 2012. KUB’s funding plan for the Consent Decree includes long-term bonds and a series of rate increases phased in over the term of the order. Bond proceeds fund all wastewater capital projects, the majority of which are related to the Consent Decree. As of June 30, 2012, the Wastewater Division had issued $360 million in bonds to fund system capital improvements since the inception of the Consent Decree. The KUB Board of Commissioners approved two 50 percent rate increases, which went into effect in April 2005 and January 2007, respectively. The Board also approved an 8 percent rate increase, which was effective in September 2008, and a 12 percent rate increase, which was effective in April 2011. The Board also adopted a 12 percent rate increase to be effective October 2012. KUB anticipates additional bond issues and rate increases over the next decade to help fund wastewater capital improvements. KUB continues to be in compliance with Consent Decree requirements. As part of the PACE 10 program, KUB has installed storage tanks providing 34 million gallons of wastewater storage to control wet-weather overflows and rehabilitated or replaced approximately 203 miles of collection system pipe. KUB also continues to maintain a proactive operations and maintenance plan for the wastewater collection system including inspection, cleaning, grease control, and private lateral enforcement. The result of the PACE 10 program is a substantial reduction in sanitary sewer overflows.
During fiscal year 2012, the Wastewater Division incurred $60.5 million in total expenditures related to Consent Decree requirements, including $3.7 million for operating costs and $56.8 million in capital improvements which included the rehabilitation or replacement of 29 miles of wastewater main. During the fiscal year, $20.4 million was spent on sewer mini-basin rehab and replacement. Trunk line replacement and rehabilitation accounted for $17 million of capital expenditures during the fiscal year. Upgrades currently in progress at the Kuwahee and Fourth Creek treatment facilities accounted for $11.8 million of fiscal year 2012 capital expenditures. As of June 30, 2012, the Wastewater Division had completed its eighth full year under the Consent Decree, spending $371.5 million on capital investments to meet Consent Decree requirements. KUB remains on time and on budget in meeting the requirements of the Consent Decree.
(Space left intentionally blank)
Knoxville Utilities Board Wastewater Division Management’s Discussion and Analysis June 30, 2012 and 2011
6
Division Cash Budget Appropriations KUB’s Board of Commissioners adopted a Wastewater Division budget of $115.2 million for fiscal year 2012. At year end, the Division was $1.6 million under budget as O&M expenses were $1.5 million less than anticipated. Capital spending was on budget. Cash operating receipts were on target. Bond proceeds of $27.5 million were transferred to the general fund to pay for capital expenditures during fiscal year 2012. The Division’s general fund balance was $8.5 million higher than budgeted. The numbers below are presented on a cash basis.
Wastewater Division Cash Report
As of June 30, 2012
(in thousands of dollars) FY 2012 FY 2012 Dollar Percent Budget Actual FYTD Variance* Variance
Beginning Balance General Fund $ 31,855 $ 31,855 Operating Receipts 72,281 72,319 38 0.1% Disbursements Operation & Maintenance Expense 26,286 24,762 1,524 5.8% Capital Expenditures 59,003 59,020 (17) - % Debt Service & Taxes 29,861 29,766 95 0.3% Total Disbursements 115,150 113,548 1,602 1.4% Bond Proceeds 27,458 34,305 6,847 24.9% Net Flow-throughs and Transfers 10 66 56 100% Ending General Fund Balance $ 16,454 $ 24,997 $ 8,543 51.9% *(-) indicates a decrease to cash
KUB, Wastewater Division, Financial Statements
The Division’s financial performance is reported under three basic financial statements: the Statement of Net Assets; the Statement of Revenues, Expenses and Changes in Net Assets; and the Statement of Cash Flows. Statement of Net Assets
The Division reports its assets, liabilities, and net assets in the Statement of Net Assets. Assets are classified as current, restricted, wastewater plant in service, or other assets.
Liabilities are classified as current, other, or long-term debt. Net assets are classified as invested in capital assets, net of related debt; restricted; or unrestricted. Net assets tell the user what the Division has done with its accumulated earnings, not just the balance. Invested in capital assets, net of related debt, reflects the book value of all capital assets less the outstanding balances of debt used to acquire, construct, or improve those assets.
Knoxville Utilities Board Wastewater Division Management’s Discussion and Analysis June 30, 2012 and 2011
7
Restricted net assets are assets that have been limited to specific uses by the Division’s bond covenants or through resolutions passed by the KUB Board of Commissioners. Unrestricted net assets are a residual classification; the amount remaining after reporting net assets as either invested in capital or restricted is reported there.
Statement of Revenues, Expenses and Changes in Net Assets
The Division reports its revenues and expenses (both operating and non-operating) on the Statement of Revenues, Expenses and Changes in Net Assets. In addition, any capital contributions or assets donated by developers are reported on this statement.
Total revenue less total expense equals the change in net assets for the reporting period. Net assets at the beginning of the period are increased or decreased, as applicable, by the change in net assets for the reporting period.
The change in net assets for the reporting period is added to the net assets segment of the Statement of Net Assets.
Statement of Cash Flows
The Division reports cash flows from operating activities, capital and related-financing activities, and investing activities on the Statement of Cash Flows. This statement tells the user the Division’s sources and uses of cash during the reporting period.
The statement indicates the Division’s beginning cash balance and ending cash balance and the means by which it was either increased or decreased during the reporting period.
The statement also reconciles cash flow to operating income as it appears on the Statement of Revenues, Expenses and Changes in Net Assets.
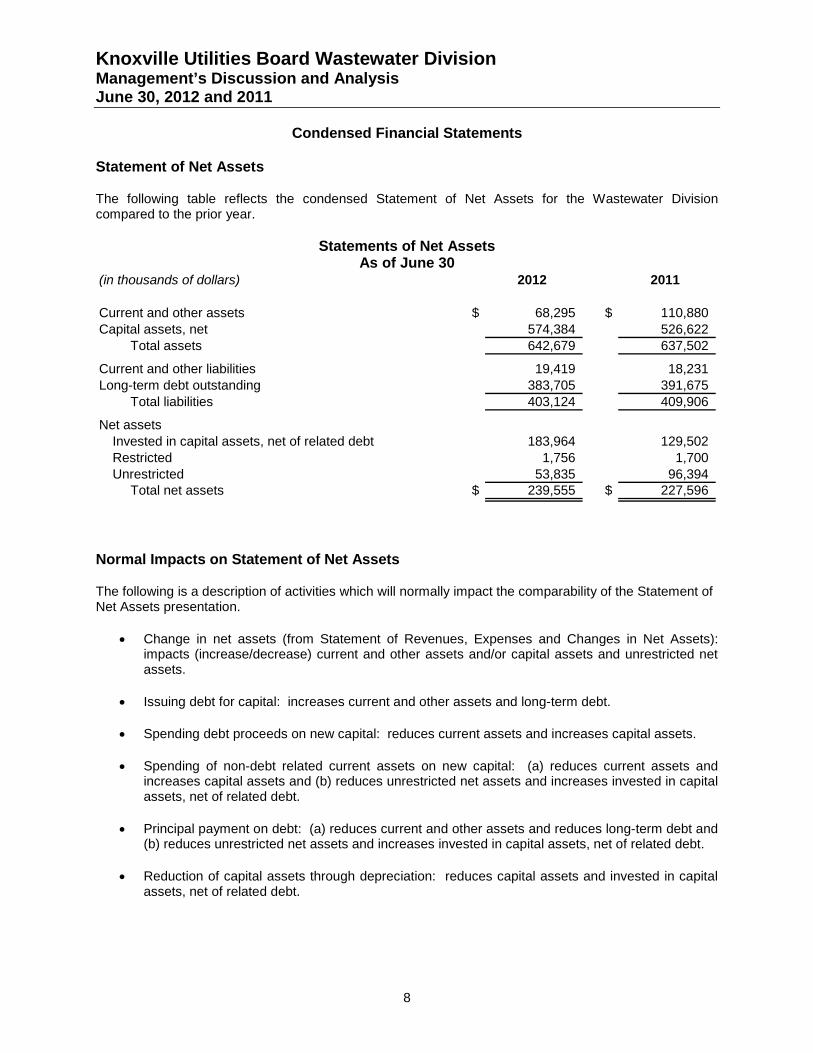
Knoxville Utilities Board Wastewater Division Management’s Discussion and Analysis June 30, 2012 and 2011
8
Condensed Financial Statements
Statement of Net Assets
The following table reflects the condensed Statement of Net Assets for the Wastewater Division compared to the prior year.
Statements of Net Assets As of June 30
(in thousands of dollars) 2012 2011
Current and other assets $ 68,295 $ 110,880 Capital assets, net 574,384 526,622
Total assets 642,679 637,502
Current and other liabilities 19,419 18,231 Long-term debt outstanding 383,705 391,675
Total liabilities 403,124 409,906
Net assetsInvested in capital assets, net of related debt 183,964 129,502 Restricted 1,756 1,700 Unrestricted 53,835 96,394
Total net assets $ 239,555 $ 227,596
Normal Impacts on Statement of Net Assets
The following is a description of activities which will normally impact the comparability of the Statement of Net Assets presentation.
• Change in net assets (from Statement of Revenues, Expenses and Changes in Net Assets): impacts (increase/decrease) current and other assets and/or capital assets and unrestricted net assets.
• Issuing debt for capital: increases current and other assets and long-term debt.
• Spending debt proceeds on new capital: reduces current assets and increases capital assets.
• Spending of non-debt related current assets on new capital: (a) reduces current assets and increases capital assets and (b) reduces unrestricted net assets and increases invested in capital assets, net of related debt.
• Principal payment on debt: (a) reduces current and other assets and reduces long-term debt and (b) reduces unrestricted net assets and increases invested in capital assets, net of related debt.
• Reduction of capital assets through depreciation: reduces capital assets and invested in capital assets, net of related debt.
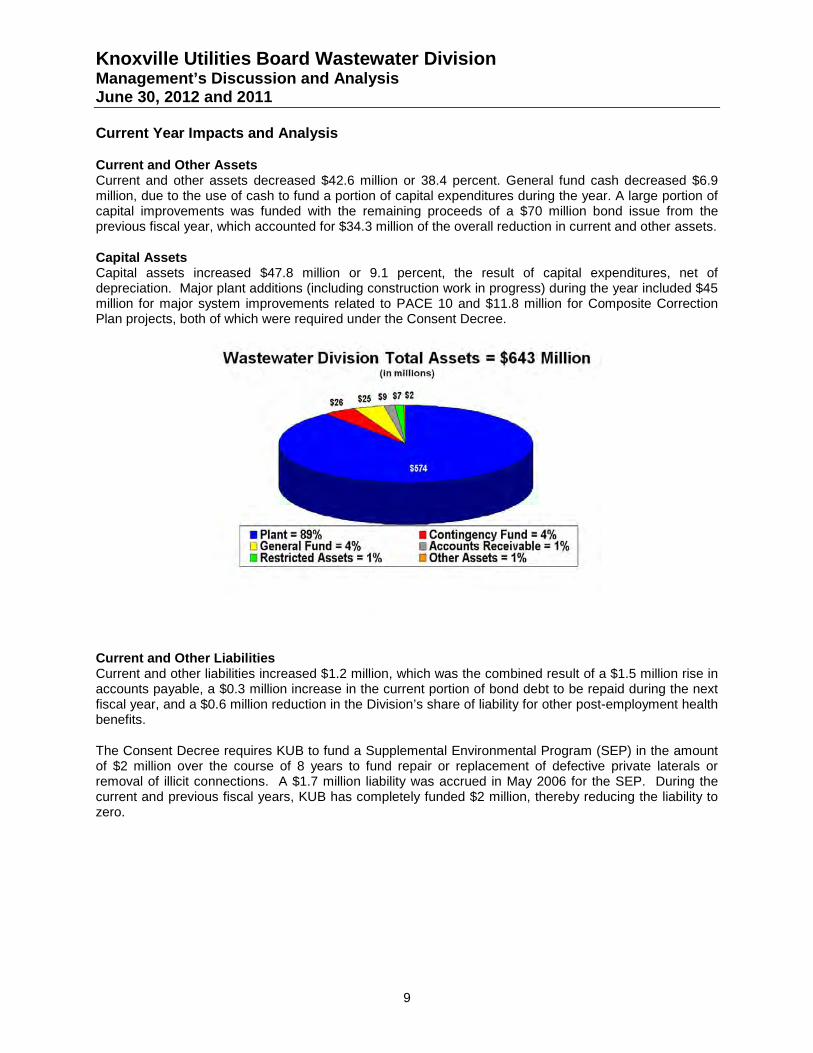
Knoxville Utilities Board Wastewater Division Management’s Discussion and Analysis June 30, 2012 and 2011
9
Current Year Impacts and Analysis
Current and Other Assets Current and other assets decreased $42.6 million or 38.4 percent. General fund cash decreased $6.9 million, due to the use of cash to fund a portion of capital expenditures during the year. A large portion of capital improvements was funded with the remaining proceeds of a $70 million bond issue from the previous fiscal year, which accounted for $34.3 million of the overall reduction in current and other assets.
Capital Assets Capital assets increased $47.8 million or 9.1 percent, the result of capital expenditures, net of depreciation. Major plant additions (including construction work in progress) during the year included $45 million for major system improvements related to PACE 10 and $11.8 million for Composite Correction Plan projects, both of which were required under the Consent Decree.
Current and Other Liabilities Current and other liabilities increased $1.2 million, which was the combined result of a $1.5 million rise in accounts payable, a $0.3 million increase in the current portion of bond debt to be repaid during the next fiscal year, and a $0.6 million reduction in the Division’s share of liability for other post-employment health benefits.
The Consent Decree requires KUB to fund a Supplemental Environmental Program (SEP) in the amount of $2 million over the course of 8 years to fund repair or replacement of defective private laterals or removal of illicit connections. A $1.7 million liability was accrued in May 2006 for the SEP. During the current and previous fiscal years, KUB has completely funded $2 million, thereby reducing the liability to zero.
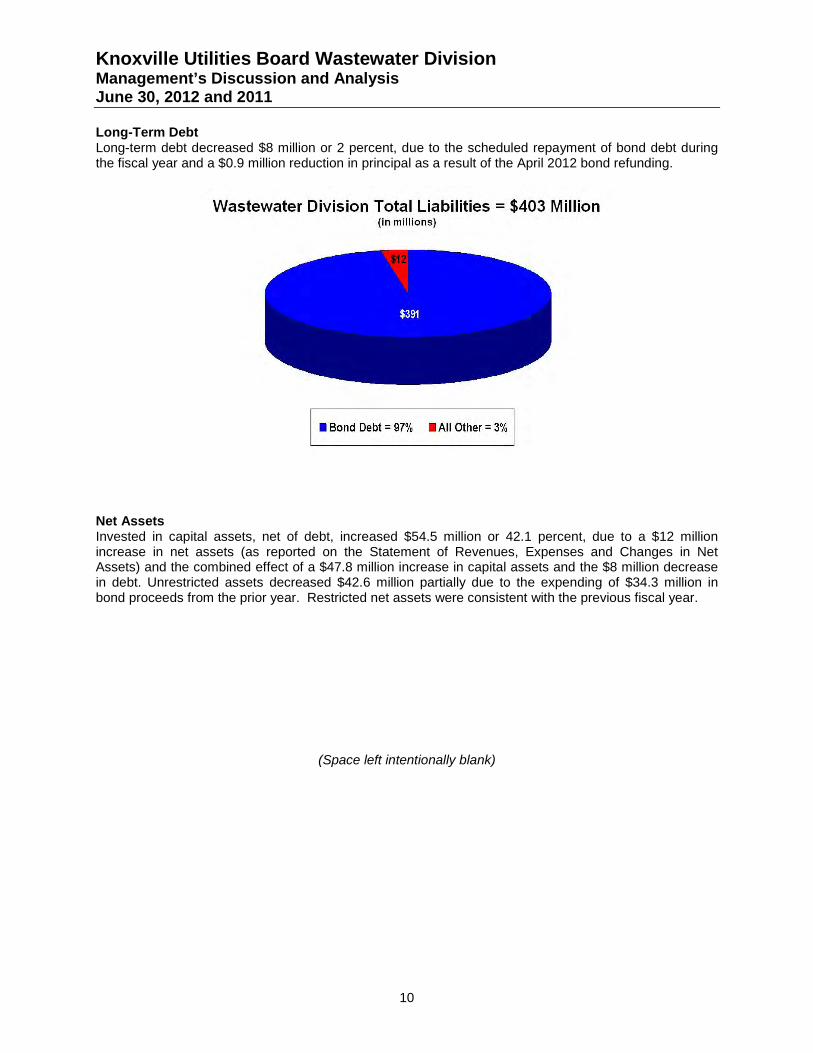
Knoxville Utilities Board Wastewater Division Management’s Discussion and Analysis June 30, 2012 and 2011
10
Long-Term Debt Long-term debt decreased $8 million or 2 percent, due to the scheduled repayment of bond debt during the fiscal year and a $0.9 million reduction in principal as a result of the April 2012 bond refunding.
Net Assets Invested in capital assets, net of debt, increased $54.5 million or 42.1 percent, due to a $12 million increase in net assets (as reported on the Statement of Revenues, Expenses and Changes in Net Assets) and the combined effect of a $47.8 million increase in capital assets and the $8 million decrease in debt. Unrestricted assets decreased $42.6 million partially due to the expending of $34.3 million in bond proceeds from the prior year. Restricted net assets were consistent with the previous fiscal year.
(Space left intentionally blank)
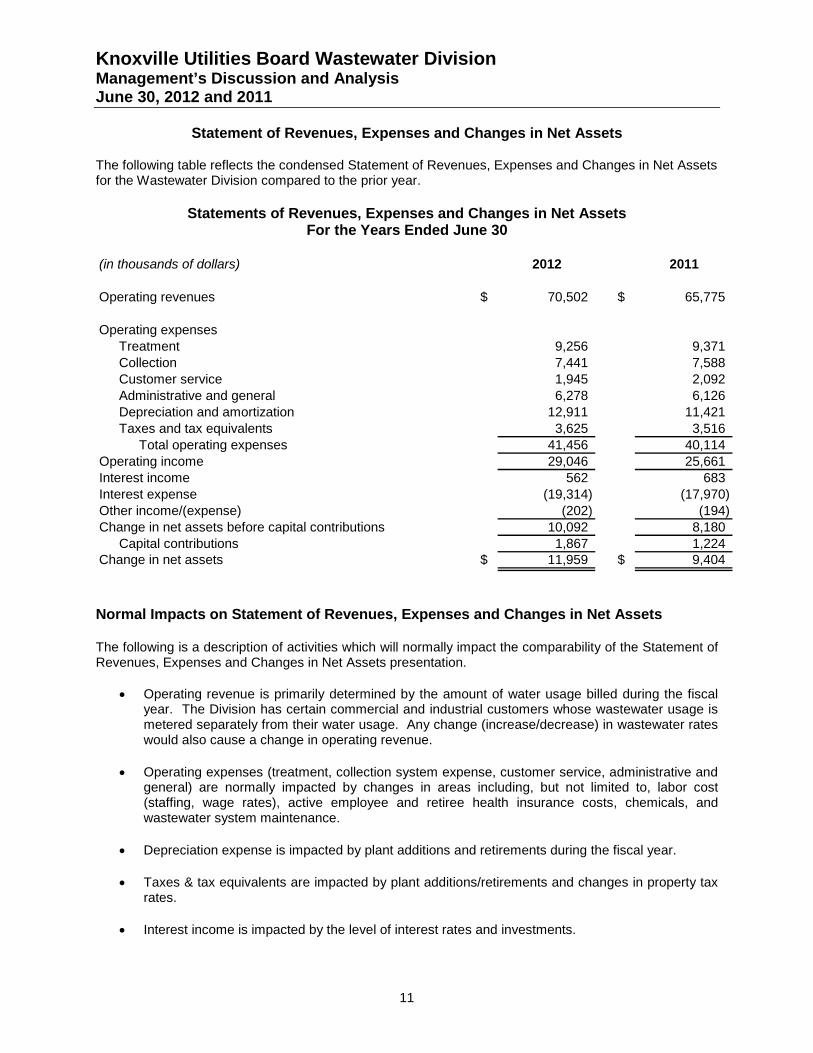
Knoxville Utilities Board Wastewater Division Management’s Discussion and Analysis June 30, 2012 and 2011
11
Statement of Revenues, Expenses and Changes in Net Assets
The following table reflects the condensed Statement of Revenues, Expenses and Changes in Net Assets for the Wastewater Division compared to the prior year.
Statements of Revenues, Expenses and Changes in Net Assets
For the Years Ended June 30 (in thousands of dollars) 2012 2011
Operating revenues $ 70,502 $ 65,775
Operating expensesTreatment 9,256 9,371 Collection 7,441 7,588 Customer service 1,945 2,092 Administrative and general 6,278 6,126 Depreciation and amortization 12,911 11,421 Taxes and tax equivalents 3,625 3,516
Total operating expenses 41,456 40,114 Operating income 29,046 25,661 Interest income 562 683 Interest expense (19,314) (17,970) Other income/(expense) (202) (194) Change in net assets before capital contributions 10,092 8,180
Capital contributions 1,867 1,224 Change in net assets $ 11,959 $ 9,404
Normal Impacts on Statement of Revenues, Expenses and Changes in Net Assets The following is a description of activities which will normally impact the comparability of the Statement of Revenues, Expenses and Changes in Net Assets presentation.
• Operating revenue is primarily determined by the amount of water usage billed during the fiscal year. The Division has certain commercial and industrial customers whose wastewater usage is metered separately from their water usage. Any change (increase/decrease) in wastewater rates would also cause a change in operating revenue.
• Operating expenses (treatment, collection system expense, customer service, administrative and general) are normally impacted by changes in areas including, but not limited to, labor cost (staffing, wage rates), active employee and retiree health insurance costs, chemicals, and wastewater system maintenance.
• Depreciation expense is impacted by plant additions and retirements during the fiscal year.
• Taxes & tax equivalents are impacted by plant additions/retirements and changes in property tax rates.
• Interest income is impacted by the level of interest rates and investments.
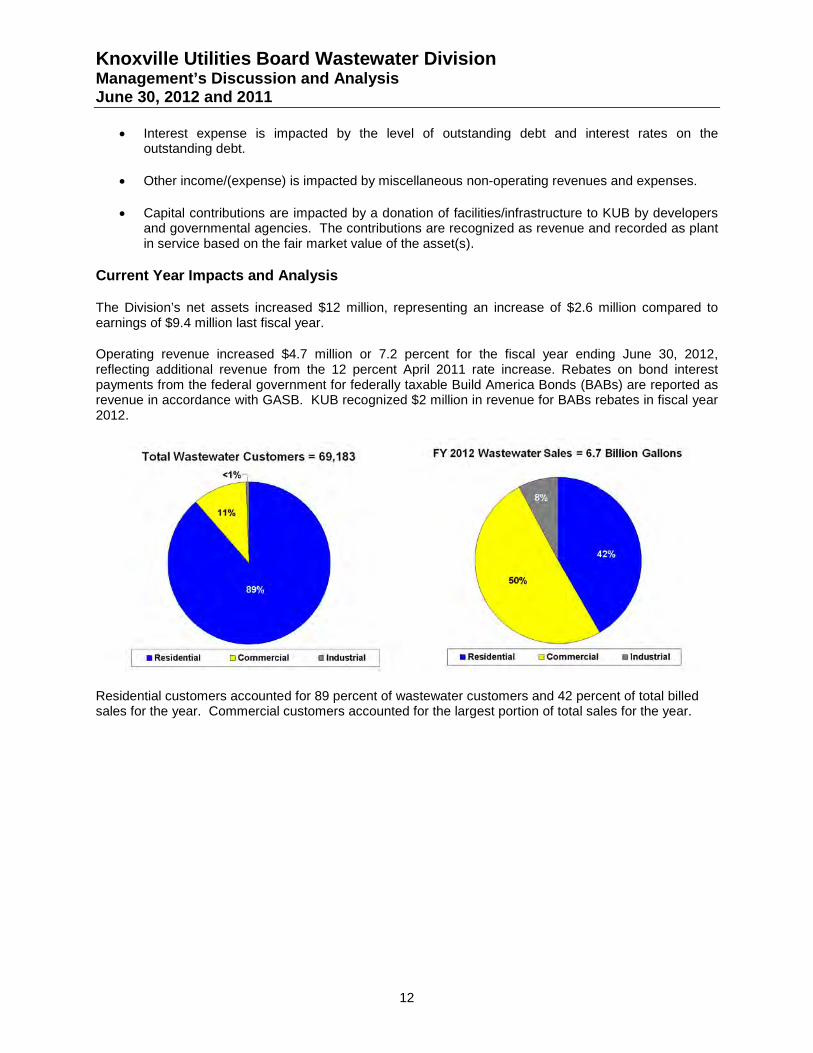
Knoxville Utilities Board Wastewater Division Management’s Discussion and Analysis June 30, 2012 and 2011
12
• Interest expense is impacted by the level of outstanding debt and interest rates on the outstanding debt.
• Other income/(expense) is impacted by miscellaneous non-operating revenues and expenses.
• Capital contributions are impacted by a donation of facilities/infrastructure to KUB by developers and governmental agencies. The contributions are recognized as revenue and recorded as plant in service based on the fair market value of the asset(s).
Current Year Impacts and Analysis
The Division’s net assets increased $12 million, representing an increase of $2.6 million compared to earnings of $9.4 million last fiscal year.
Operating revenue increased $4.7 million or 7.2 percent for the fiscal year ending June 30, 2012, reflecting additional revenue from the 12 percent April 2011 rate increase. Rebates on bond interest payments from the federal government for federally taxable Build America Bonds (BABs) are reported as revenue in accordance with GASB. KUB recognized $2 million in revenue for BABs rebates in fiscal year 2012.
Residential customers accounted for 89 percent of wastewater customers and 42 percent of total billed sales for the year. Commercial customers accounted for the largest portion of total sales for the year.
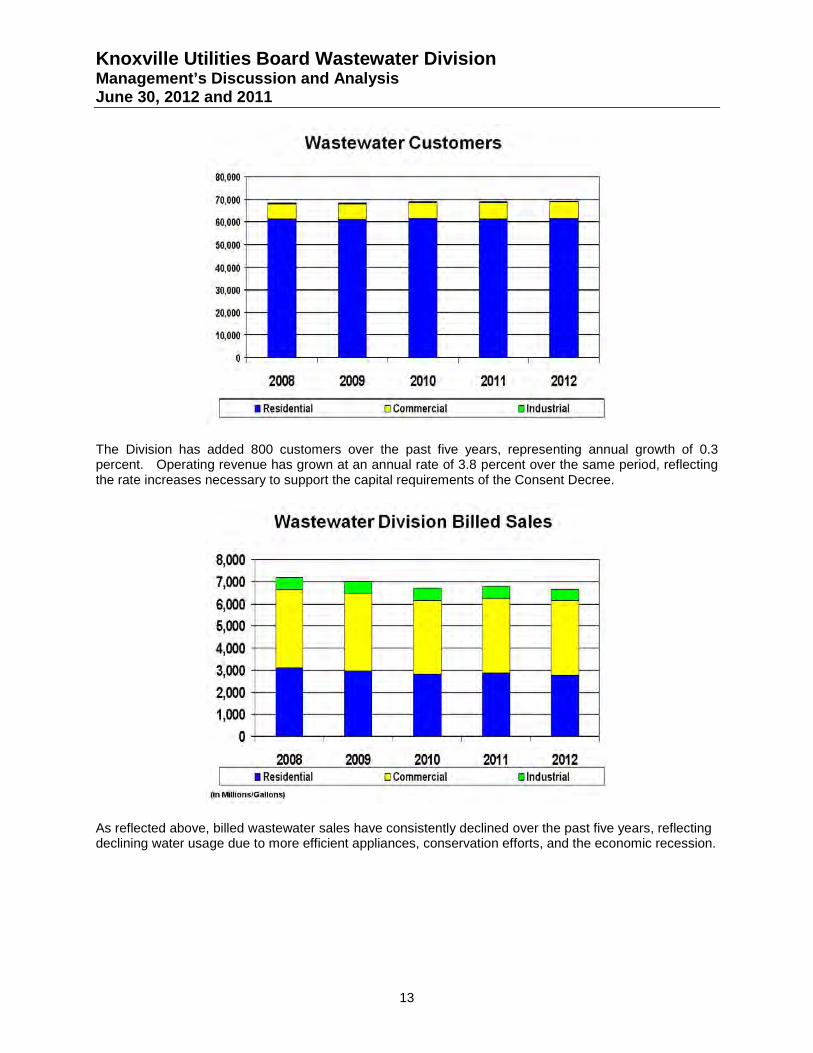
Knoxville Utilities Board Wastewater Division Management’s Discussion and Analysis June 30, 2012 and 2011
13
The Division has added 800 customers over the past five years, representing annual growth of 0.3 percent. Operating revenue has grown at an annual rate of 3.8 percent over the same period, reflecting the rate increases necessary to support the capital requirements of the Consent Decree.
As reflected above, billed wastewater sales have consistently declined over the past five years, reflecting declining water usage due to more efficient appliances, conservation efforts, and the economic recession.
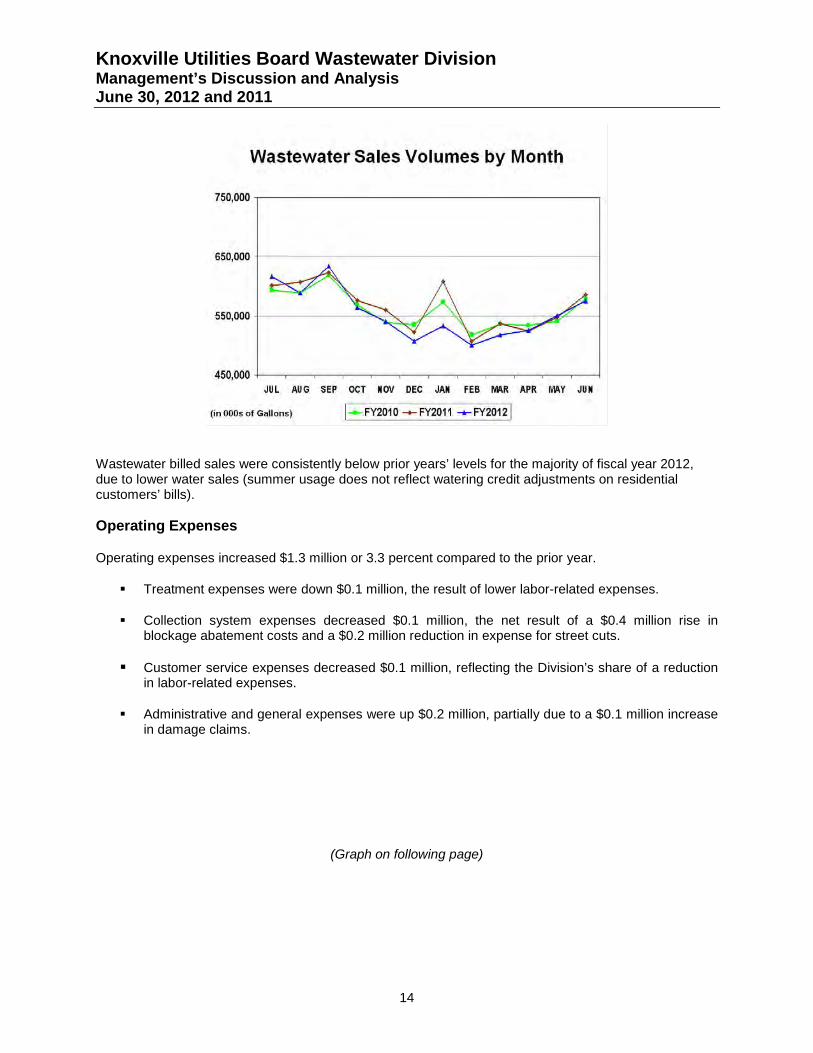
Knoxville Utilities Board Wastewater Division Management’s Discussion and Analysis June 30, 2012 and 2011
14
Wastewater billed sales were consistently below prior years’ levels for the majority of fiscal year 2012, due to lower water sales (summer usage does not reflect watering credit adjustments on residential customers’ bills). Operating Expenses
Operating expenses increased $1.3 million or 3.3 percent compared to the prior year.
Treatment expenses were down $0.1 million, the result of lower labor-related expenses.
Collection system expenses decreased $0.1 million, the net result of a $0.4 million rise in blockage abatement costs and a $0.2 million reduction in expense for street cuts.
Customer service expenses decreased $0.1 million, reflecting the Division’s share of a reduction in labor-related expenses.
Administrative and general expenses were up $0.2 million, partially due to a $0.1 million increase in damage claims.
(Graph on following page)
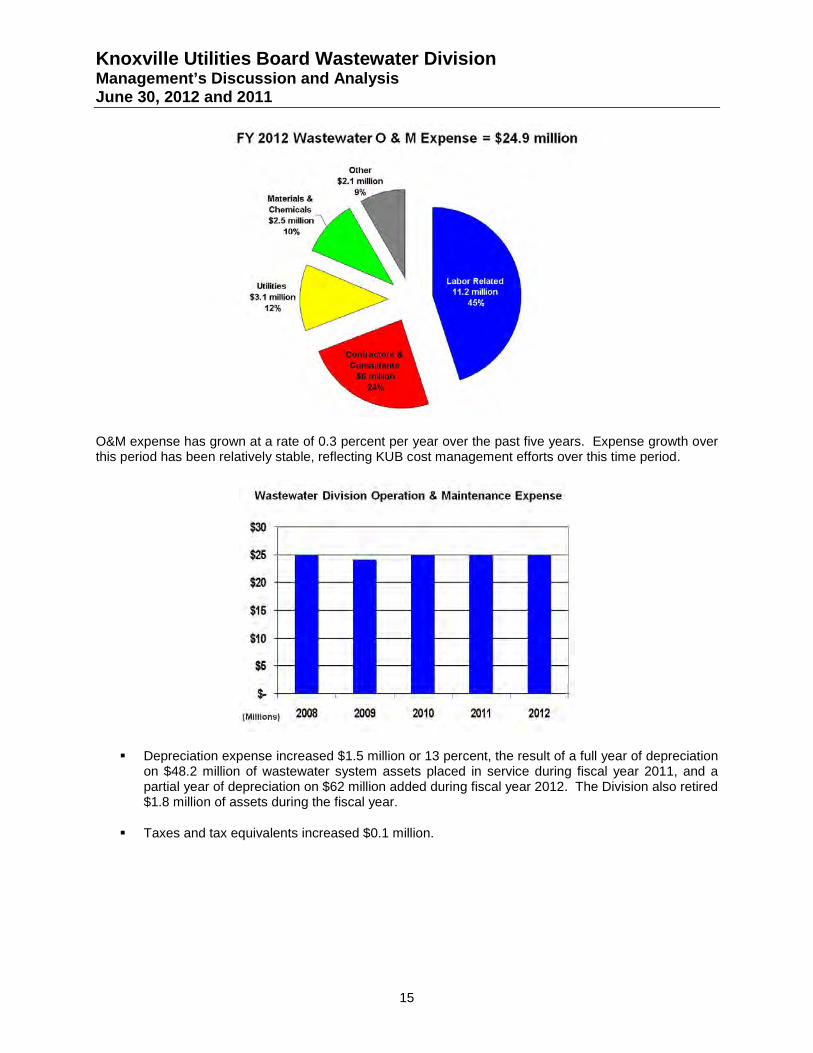
Knoxville Utilities Board Wastewater Division Management’s Discussion and Analysis June 30, 2012 and 2011
15
O&M expense has grown at a rate of 0.3 percent per year over the past five years. Expense growth over this period has been relatively stable, reflecting KUB cost management efforts over this time period.
Depreciation expense increased $1.5 million or 13 percent, the result of a full year of depreciation on $48.2 million of wastewater system assets placed in service during fiscal year 2011, and a partial year of depreciation on $62 million added during fiscal year 2012. The Division also retired $1.8 million of assets during the fiscal year.
Taxes and tax equivalents increased $0.1 million.
Knoxville Utilities Board Wastewater Division Management’s Discussion and Analysis June 30, 2012 and 2011
16
Other Income and Expense
Interest income decreased $0.1 million, the result of lower longer-term interest rates.
Interest expense increased $1.3 million or 7.5 percent, due to a full year of interest on $70 million in revenue bonds issued in fiscal year 2011.
Other income (net) was consistent with the prior year.
Capital contributions increased $0.6 million compared to last fiscal year as a result of assets received from developers and other governmental entities during the fiscal year, including the new Cherokee Farm development of the University of Tennessee.
(Space left intentionally blank)
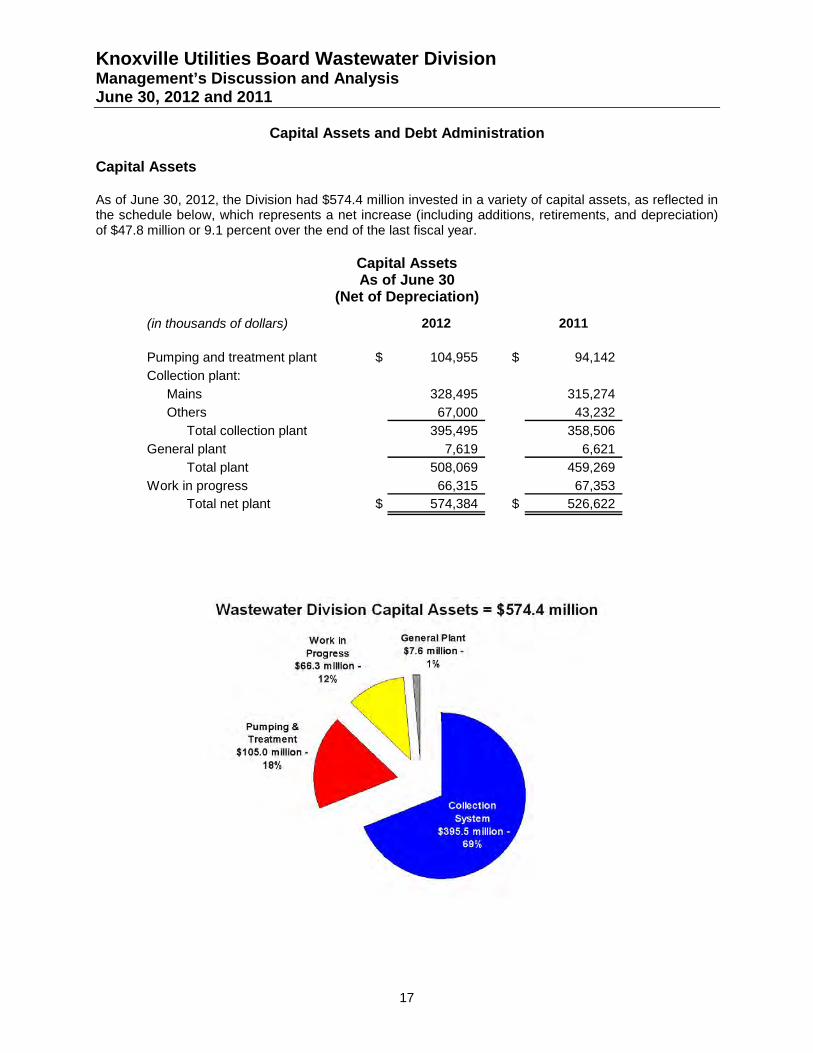
Knoxville Utilities Board Wastewater Division Management’s Discussion and Analysis June 30, 2012 and 2011
17
Capital Assets and Debt Administration
Capital Assets As of June 30, 2012, the Division had $574.4 million invested in a variety of capital assets, as reflected in the schedule below, which represents a net increase (including additions, retirements, and depreciation) of $47.8 million or 9.1 percent over the end of the last fiscal year.
Capital Assets As of June 30
(Net of Depreciation)
(in thousands of dollars) 2012 2011
Pumping and treatment plant $ 104,955 $ 94,142 Collection plant:
Mains 328,495 315,274 Others 67,000 43,232
Total collection plant 395,495 358,506 General plant 7,619 6,621
Total plant 508,069 459,269 Work in progress 66,315 67,353
Total net plant $ 574,384 $ 526,622
Knoxville Utilities Board Wastewater Division Management’s Discussion and Analysis June 30, 2012 and 2011
18
Major capital asset additions during the year were as follows: • $45 million related to PACE 10 projects.
$20.4 million for sewer mini-basin rehab and replacement $17 million for sewer trunk line replacement and rehabilitation $3.2 million for pump station design and construction $2.7 million for storage tank design and construction
• $11.8 million for Composite Correction Plan projects.
$9.3 million for upgrades to the Kuwahee Wastewater Treatment Plant $2.5 million for upgrades at the Fourth Creek Facility
Debt Outstanding As of June 30, 2012, the Division had $390.7 million in debt outstanding (including the current portion of revenue bonds), compared to $398.4 million last year, which is a decrease of $7.7 million or 1.9 percent. The Division’s weighted average cost of debt as of June 30, 2012 was 4.86 percent (the effective weighted average cost of debt is 4.35 percent, which reflects the Build America Bond rebate for a portion of the outstanding debt). KUB refunded $18 million in outstanding bonds issued in 2004 at lower interest rates. KUB issued $17.1 million in revenue refunding bonds, which when combined with a reoffering premium of $1.3 million, retired the $18 million in outstanding bonds and covered the underwriter’s discount and costs of issuance. The Division’s outstanding debt is rated by Standard & Poor’s and Moody’s Investors Service. As of June 30, 2012, the Division’s revenue bonds were rated AA+ by Standard & Poor’s and Aa2 by Moody’s Investors Service. The following is a schedule of the Division’s outstanding debt as of June 30, 2012.
Outstanding Debt As of June 30
(in thousands of dollars) 2012 2011
Revenue bonds $ 390,745 $ 398,405 Total outstanding debt $ 390,745 $ 398,405
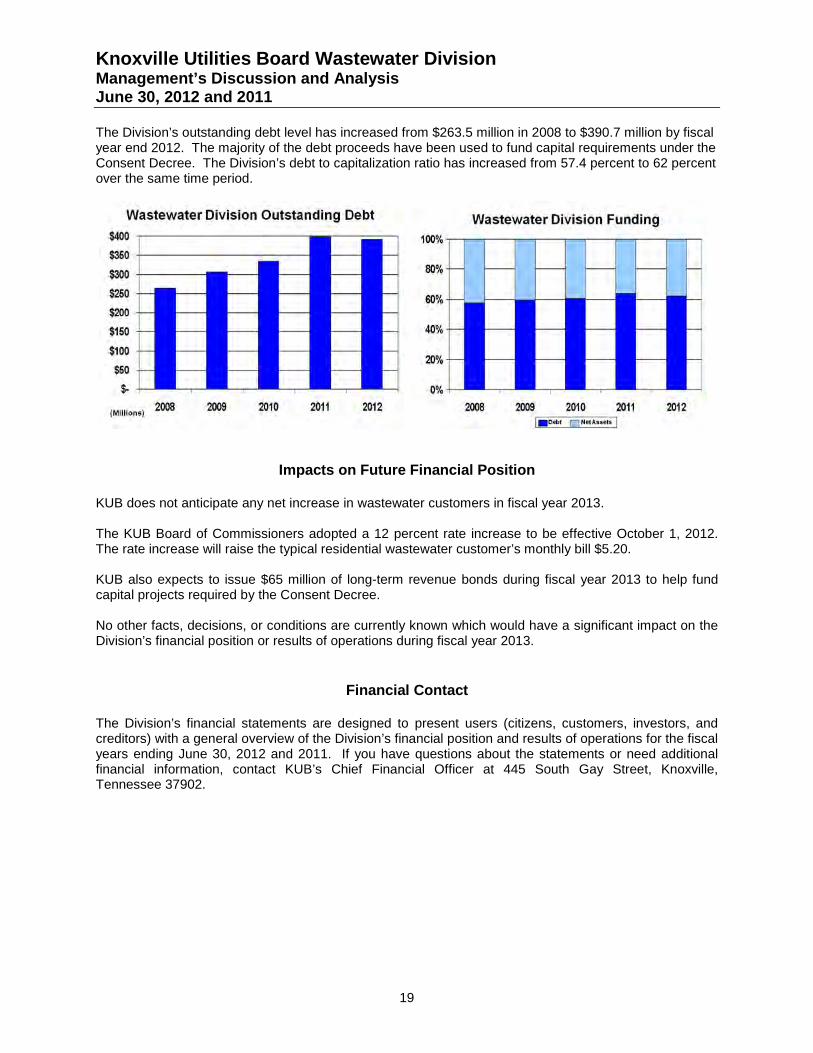
Knoxville Utilities Board Wastewater Division Management’s Discussion and Analysis June 30, 2012 and 2011
19
The Division’s outstanding debt level has increased from $263.5 million in 2008 to $390.7 million by fiscal year end 2012. The majority of the debt proceeds have been used to fund capital requirements under the Consent Decree. The Division’s debt to capitalization ratio has increased from 57.4 percent to 62 percent over the same time period.
Impacts on Future Financial Position KUB does not anticipate any net increase in wastewater customers in fiscal year 2013. The KUB Board of Commissioners adopted a 12 percent rate increase to be effective October 1, 2012. The rate increase will raise the typical residential wastewater customer’s monthly bill $5.20. KUB also expects to issue $65 million of long-term revenue bonds during fiscal year 2013 to help fund capital projects required by the Consent Decree. No other facts, decisions, or conditions are currently known which would have a significant impact on the Division’s financial position or results of operations during fiscal year 2013.
Financial Contact The Division’s financial statements are designed to present users (citizens, customers, investors, and creditors) with a general overview of the Division’s financial position and results of operations for the fiscal years ending June 30, 2012 and 2011. If you have questions about the statements or need additional financial information, contact KUB’s Chief Financial Officer at 445 South Gay Street, Knoxville, Tennessee 37902.
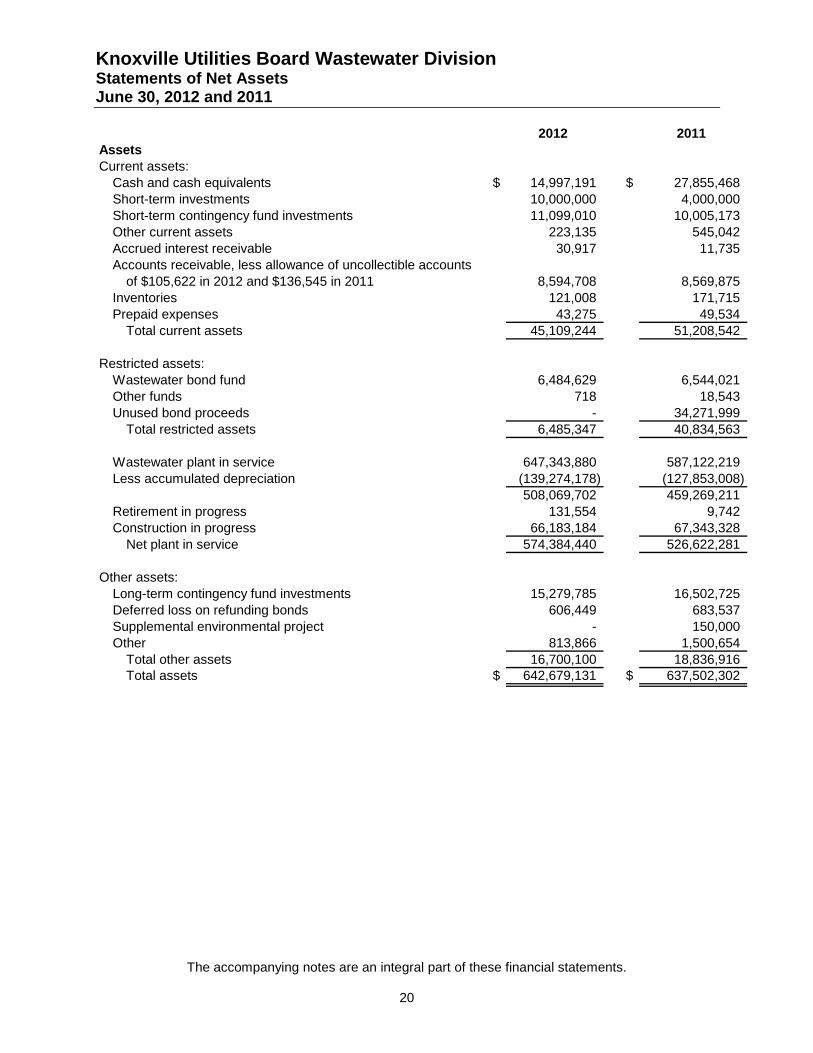
Knoxville Utilities Board Wastewater Division Statements of Net Assets June 30, 2012 and 2011
The accompanying notes are an integral part of these financial statements.
20
2012 2011AssetsCurrent assets:
Cash and cash equivalents $ 14,997,191 $ 27,855,468 Short-term investments 10,000,000 4,000,000 Short-term contingency fund investments 11,099,010 10,005,173 Other current assets 223,135 545,042 Accrued interest receivable 30,917 11,735 Accounts receivable, less allowance of uncollectible accounts
of $105,622 in 2012 and $136,545 in 2011 8,594,708 8,569,875 Inventories 121,008 171,715 Prepaid expenses 43,275 49,534
Total current assets 45,109,244 51,208,542
Restricted assets:Wastewater bond fund 6,484,629 6,544,021 Other funds 718 18,543 Unused bond proceeds - 34,271,999
Total restricted assets 6,485,347 40,834,563
Wastewater plant in service 647,343,880 587,122,219 Less accumulated depreciation (139,274,178) (127,853,008)
508,069,702 459,269,211 Retirement in progress 131,554 9,742 Construction in progress 66,183,184 67,343,328
Net plant in service 574,384,440 526,622,281
Other assets:Long-term contingency fund investments 15,279,785 16,502,725 Deferred loss on refunding bonds 606,449 683,537 Supplemental environmental project - 150,000 Other 813,866 1,500,654
Total other assets 16,700,100 18,836,916 Total assets $ 642,679,131 $ 637,502,302
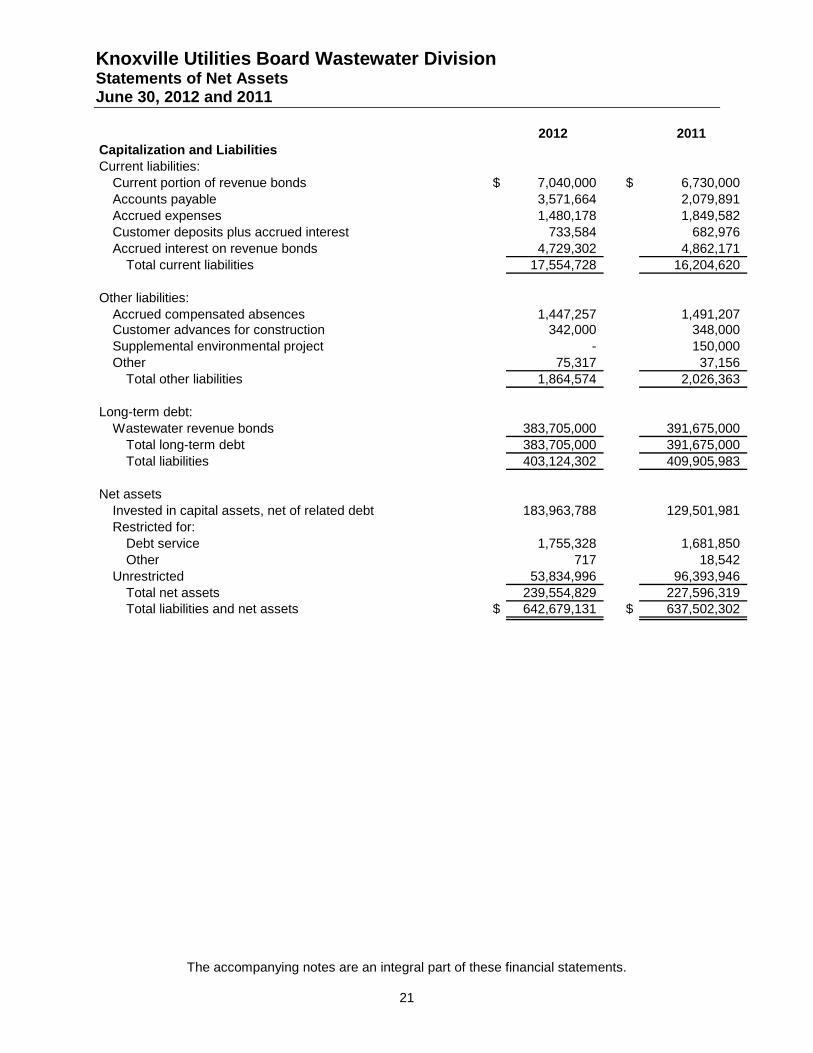
Knoxville Utilities Board Wastewater Division Statements of Net Assets June 30, 2012 and 2011
The accompanying notes are an integral part of these financial statements.
21
2012 2011Capitalization and LiabilitiesCurrent liabilities:
Current portion of revenue bonds $ 7,040,000 $ 6,730,000 Accounts payable 3,571,664 2,079,891 Accrued expenses 1,480,178 1,849,582 Customer deposits plus accrued interest 733,584 682,976 Accrued interest on revenue bonds 4,729,302 4,862,171
Total current liabilities 17,554,728 16,204,620
Other liabilities:Accrued compensated absences 1,447,257 1,491,207 Customer advances for construction 342,000 348,000 Supplemental environmental project - 150,000 Other 75,317 37,156
Total other liabilities 1,864,574 2,026,363
Long-term debt:Wastewater revenue bonds 383,705,000 391,675,000
Total long-term debt 383,705,000 391,675,000 Total liabilities 403,124,302 409,905,983
Net assetsInvested in capital assets, net of related debt 183,963,788 129,501,981 Restricted for:
Debt service 1,755,328 1,681,850 Other 717 18,542
Unrestricted 53,834,996 96,393,946 Total net assets 239,554,829 227,596,319 Total liabilities and net assets $ 642,679,131 $ 637,502,302
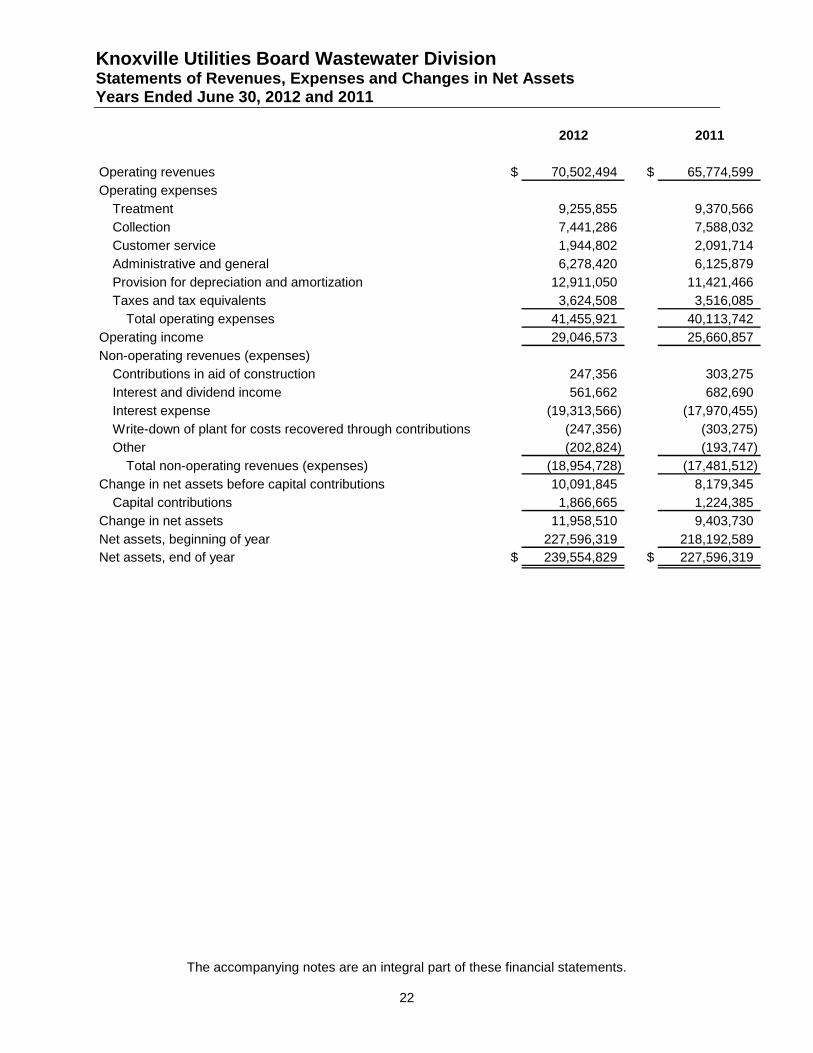
Knoxville Utilities Board Wastewater Division Statements of Revenues, Expenses and Changes in Net Assets Years Ended June 30, 2012 and 2011
The accompanying notes are an integral part of these financial statements.
22
2012 2011
Operating revenues $ 70,502,494 $ 65,774,599 Operating expenses
Treatment 9,255,855 9,370,566 Collection 7,441,286 7,588,032 Customer service 1,944,802 2,091,714 Administrative and general 6,278,420 6,125,879 Provision for depreciation and amortization 12,911,050 11,421,466 Taxes and tax equivalents 3,624,508 3,516,085
Total operating expenses 41,455,921 40,113,742 Operating income 29,046,573 25,660,857 Non-operating revenues (expenses)
Contributions in aid of construction 247,356 303,275 Interest and dividend income 561,662 682,690 Interest expense (19,313,566) (17,970,455) Write-down of plant for costs recovered through contributions (247,356) (303,275) Other (202,824) (193,747)
Total non-operating revenues (expenses) (18,954,728) (17,481,512) Change in net assets before capital contributions 10,091,845 8,179,345
Capital contributions 1,866,665 1,224,385 Change in net assets 11,958,510 9,403,730 Net assets, beginning of year 227,596,319 218,192,589 Net assets, end of year $ 239,554,829 $ 227,596,319
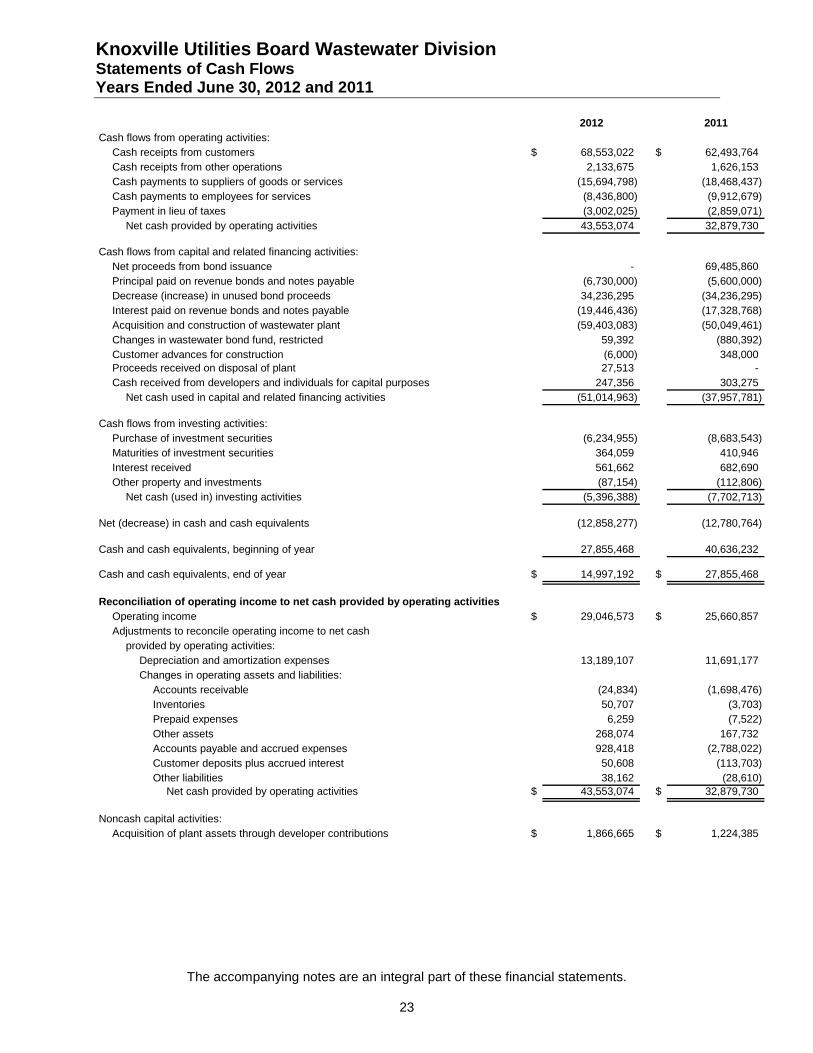
Knoxville Utilities Board Wastewater Division Statements of Cash Flows Years Ended June 30, 2012 and 2011
The accompanying notes are an integral part of these financial statements.
23
2012 2011Cash flows from operating activities:
Cash receipts from customers $ 68,553,022 $ 62,493,764 Cash receipts from other operations 2,133,675 1,626,153 Cash payments to suppliers of goods or services (15,694,798) (18,468,437) Cash payments to employees for services (8,436,800) (9,912,679) Payment in lieu of taxes (3,002,025) (2,859,071)
Net cash provided by operating activities 43,553,074 32,879,730
Cash flows from capital and related financing activities:Net proceeds from bond issuance - 69,485,860 Principal paid on revenue bonds and notes payable (6,730,000) (5,600,000) Decrease (increase) in unused bond proceeds 34,236,295 (34,236,295) Interest paid on revenue bonds and notes payable (19,446,436) (17,328,768) Acquisition and construction of wastewater plant (59,403,083) (50,049,461) Changes in wastewater bond fund, restricted 59,392 (880,392) Customer advances for construction (6,000) 348,000 Proceeds received on disposal of plant 27,513 - Cash received from developers and individuals for capital purposes 247,356 303,275
Net cash used in capital and related financing activities (51,014,963) (37,957,781)
Cash flows from investing activities:Purchase of investment securities (6,234,955) (8,683,543) Maturities of investment securities 364,059 410,946 Interest received 561,662 682,690 Other property and investments (87,154) (112,806)
Net cash (used in) investing activities (5,396,388) (7,702,713)
Net (decrease) in cash and cash equivalents (12,858,277) (12,780,764)
Cash and cash equivalents, beginning of year 27,855,468 40,636,232
Cash and cash equivalents, end of year $ 14,997,192 $ 27,855,468
Reconciliation of operating income to net cash provided by operating activitiesOperating income $ 29,046,573 $ 25,660,857 Adjustments to reconcile operating income to net cash
provided by operating activities:Depreciation and amortization expenses 13,189,107 11,691,177 Changes in operating assets and liabilities:
Accounts receivable (24,834) (1,698,476) Inventories 50,707 (3,703) Prepaid expenses 6,259 (7,522) Other assets 268,074 167,732 Accounts payable and accrued expenses 928,418 (2,788,022) Customer deposits plus accrued interest 50,608 (113,703) Other liabilities 38,162 (28,610)
Net cash provided by operating activities $ 43,553,074 $ 32,879,730
Noncash capital activities:Acquisition of plant assets through developer contributions $ 1,866,665 $ 1,224,385
Knoxville Utilities Board Wastewater Division Notes to Financial Statements June 30, 2012 and 2011
24
1. Description of Business
Knoxville Utilities Board (KUB), comprised of the Electric Division, Water Division, Gas Division, and Wastewater Division (Divisions), is reported as a component unit enterprise fund in the financial statements of the City of Knoxville. KUB's responsibility is to oversee the purchase, production, distribution, and processing of electricity, water, natural gas, and wastewater services. A seven-member Board of Commissioners governs KUB. The Board has all powers to construct, acquire, expand, or operate the Divisions. It has full control and complete jurisdiction over the management and operation of the Divisions. The Wastewater Division (Division) provides services to certain customers in Knox County and in two surrounding counties in East Tennessee. The Division's accounts are maintained in conformity with the Uniform System of Accounts of the National Association of Regulatory Utility Commissioners (NARUC) and the Governmental Accounting Standards Board (GASB), as applicable. The financial statements present only the Wastewater Division and do not purport to, and do not, present fairly the consolidated financial position of Knoxville Utilities Board at June 30, 2012 and 2011, and the changes in its financial position for the years then ended in conformity with accounting principles generally accepted in the United States of America.
2. Significant Accounting Policies
Basis of Accounting KUB follows the provisions of Statement No. 34 (Statement 34) of the Governmental Accounting Standards Board Basic Financial Statements − and Management’s Discussion and Analysis − for State and Local Governments. Statement 34 established standards for external financial reporting for all state and local governmental entities, which includes a statement of net assets; a statement of revenues, expenses and changes in net assets; and a statement of cash flows. It requires the classification of net assets into three components − invested in capital assets, net of related debt; restricted; and unrestricted. These classifications are defined as follows:
• Invested in capital assets, net of related debt − This component of net assets consists of capital assets, including restricted capital assets, net of accumulated depreciation and reduced by the outstanding balances of any bonds, mortgages, notes, or other borrowings that are attributable to the acquisition, construction, or improvement of those assets. If there are significant unspent related debt proceeds at year end, the portion of the debt attributable to the unspent proceeds is not included in the calculation of invested in capital assets, net of related debt. Rather, that portion of the debt is included in the same net assets component as the unspent proceeds.
• Restricted − This component of net assets consists of restrictions placed on net asset use through external constraints imposed by creditors (such as through debt covenants), grantors, contributors, or laws or regulations of other governments or restrictions imposed by law through constitutional provisions or enabling legislation.
• Unrestricted net assets − This component of net assets consists of net assets that do not meet the definition of “restricted” or “invested in capital assets, net of related debt.”
Knoxville Utilities Board Wastewater Division Notes to Financial Statements June 30, 2012 and 2011
25
The financial statements are prepared on the accrual basis of accounting, whereby revenues are recognized when earned and expenses are recognized when incurred. The accounting and financial reporting treatment applied to the Division is determined by measurement focus. The transactions of the Division are accounted for on a flow of economic resources measurement focus. With this measurement focus, all assets and all liabilities associated with the operations are included on the statement of net assets. Net assets (i.e., total assets net of total liabilities) are segregated into invested in capital assets, net of related debt; restricted for capital activity and debt service; and unrestricted components.
As allowed by the Governmental Accounting Standards Board (GASB) Statement No. 20, Accounting and Financial Reporting for Proprietary Funds and Other Governmental Entities That Use Proprietary Fund Accounting, KUB’s policy is to apply only those Financial Accounting Standards Board statements, related interpretations, Accounting Principles Board opinions and accounting research bulletins issued on or prior to November 30, 1989 that do not conflict with Governmental Accounting Standards.
Wastewater Plant Wastewater plant and other property are stated on the basis of original cost. The cost of current repairs and minor replacements is charged to operating expense. The cost of renewals and improvements is capitalized. The original cost of utility plant assets retired or otherwise disposed of and the cost of removal less salvage value is charged to accumulated depreciation. When other property is retired, the related asset and accumulated depreciation are removed from the accounts, and the gain or loss is included in the results of operations.
The provision for depreciation of wastewater plant in service is based on the estimated useful lives of the assets, which range from three to fifty years, and is computed using the straight-line method. Pursuant to NARUC, the caption "Provision for depreciation" in the statements of revenue, expenses and change in net assets does not include depreciation for transportation equipment of $278,058 in 2012 and $269,711 in 2011. Interest costs are expensed as incurred.
Operating Revenue Operating revenue consists primarily of charges for services provided by the principal operations of the KUB Wastewater Division. Operating revenue is recorded when the service is rendered, on a cycle basis, and includes an estimate of unbilled revenue. Revenues are reported net of bad debt expense of $215,679 in 2012 and $304,234 in 2011.
Non-operating Revenue Non-operating revenue consists of revenues that are related to financing and investing types of activities and result from non-exchange transactions or ancillary activities.
Expense When an expense is incurred for purposes for which there are both restricted and unrestricted net assets available, it is KUB’s policy to apply those expenses to restricted net assets to the extent such are available and then to unrestricted net assets.
Knoxville Utilities Board Wastewater Division Notes to Financial Statements June 30, 2012 and 2011
26
Contributions in Aid of Construction and Capital Contributions Contributions in aid of construction are cash collections from customers or others for a particular purpose, generally the construction of new facilities to serve new customers in excess of the investment KUB is willing to make for a particular incremental revenue source. KUB reduces the plant account balances to which contributions relate by the actual amount of the contribution and recognizes the contributions as non operating revenue in accordance with FAS 71, “Accounting for the Effects of Certain Types of Regulation”.
Capital contributions represent contributions of utility plant infrastructure constructed by developers and others in industrial parks and other developments, and transferred to KUB upon completion of construction and the initiation of utility service. In accordance with GASB 33, “Accounting and Financial Reporting for Nonexchange Transactions”, such contributions are recognized as revenues and capital assets upon receipt.
Inventories Inventories consist of plant materials and operating supplies and are valued at the lower of average cost or replacement value.
Pension Plan The Division’s employees are participants in the Knoxville Utilities Board Pension Plan as authorized by the Charter of the City of Knoxville §1107(J) (Note 10). The Division’s policy is to fund pension cost accrued. As required by GASB Statement No. 27, KUB measures and discloses the annual pension cost on the accrual basis of accounting. At the time the funding method is introduced, there is a liability, which represents the contributions that would have been accumulated if this method of funding had always been used. The excess, if any, of this liability over the actuarial value of the assets held in the fund is the unfunded actuarial accrued liability, which is typically funded over a chosen period in accordance with an amortization schedule.
Investments Investments are carried at fair value as determined by quoted market prices at the reporting date.
Self-Insurance KUB has established self-insurance programs covering portions of workers' compensation, employee health, environmental liability, general liability, property and casualty liability, and automobile liability claims. A liability is accrued for claims as they are incurred. When applicable, claims in excess of the self-insured risk are covered by KUB's insurance carriers. Additionally, KUB provides certain lifetime health benefits to eligible retired employees under a self-insured plan administered by a third party.
Estimates The preparation of financial statements in conformity with generally accepted accounting principles requires management to make estimates and assumptions that affect the reported amounts of assets and liabilities and disclosures of contingent assets and liabilities at the date of the financial statements and the reported amounts of revenues and expenses during the reporting period. These estimates are based on historical experience and various other assumptions that KUB believes are reasonable under the circumstances. However, future events are subject to change and the best estimates and judgments routinely require adjustment. Estimates are used for, but not limited to, inventory valuation, provision for doubtful accounts, depreciable lives of plant assets, unbilled revenue volumes, pension trust valuations, OPEB trust valuations, insurance liability reserves, and potential losses from contingencies and litigation. Actual results could differ from those estimates.
Knoxville Utilities Board Wastewater Division Notes to Financial Statements June 30, 2012 and 2011
27
Restricted and Designated Assets Certain assets are restricted by bond resolutions for utility plant construction and debt repayment. In addition, management has designated additional assets for contingency purposes and economic development.
Cash Equivalents For purposes of the statements of cash flows, KUB considers all unrestricted and undesignated highly liquid investments with an original maturity of three months or less when purchased to be cash equivalents.
Compensated Absences KUB accrues a liability for earned but unpaid paid-time off (PTO) days.
Subsequent Events KUB has evaluated events and transactions through October 18, 2012, the date these financial statements were issued, for items that should potentially be recognized or disclosed.
Reclassifications Certain reclassifications have been made to the 2011 balances to conform to the 2012 presentation.
3. Deposits and Investments
State law authorizes KUB to invest in obligations of the United States Treasury, its agencies and instrumentalities; certificates of deposit; repurchase agreements; money market funds; and the State Treasurer's Investment Pool. All deposits in excess of federal depository insurance limits and investments in other than the State Treasurer's Investment Pool are collateralized with government securities held in KUB's name by a third-party custodian bank(s) acting as KUB's agent(s), or through the state of Tennessee's collateral pool. Financial institutions that participate in the collateral pool are subject to special assessment; therefore, the deposits and investments of investors such as KUB are considered insured. Interest income is recorded on an accrual basis.
Information related to the carrying value and bank balances of deposits (except as described below), and the carrying value and fair value of investments at June 30, 2012, is as follows:
Carrying BankValue Balance
DepositsDeposits in financial institutions $ 14,997,909 $ 20,135,468
InvestmentsCertificates of Deposits 25,516,989 25,516,989 State Treasurer's Investment Pool - - Agency Bonds 17,266,926 17,266,926
$ 57,781,824 $ 62,919,383
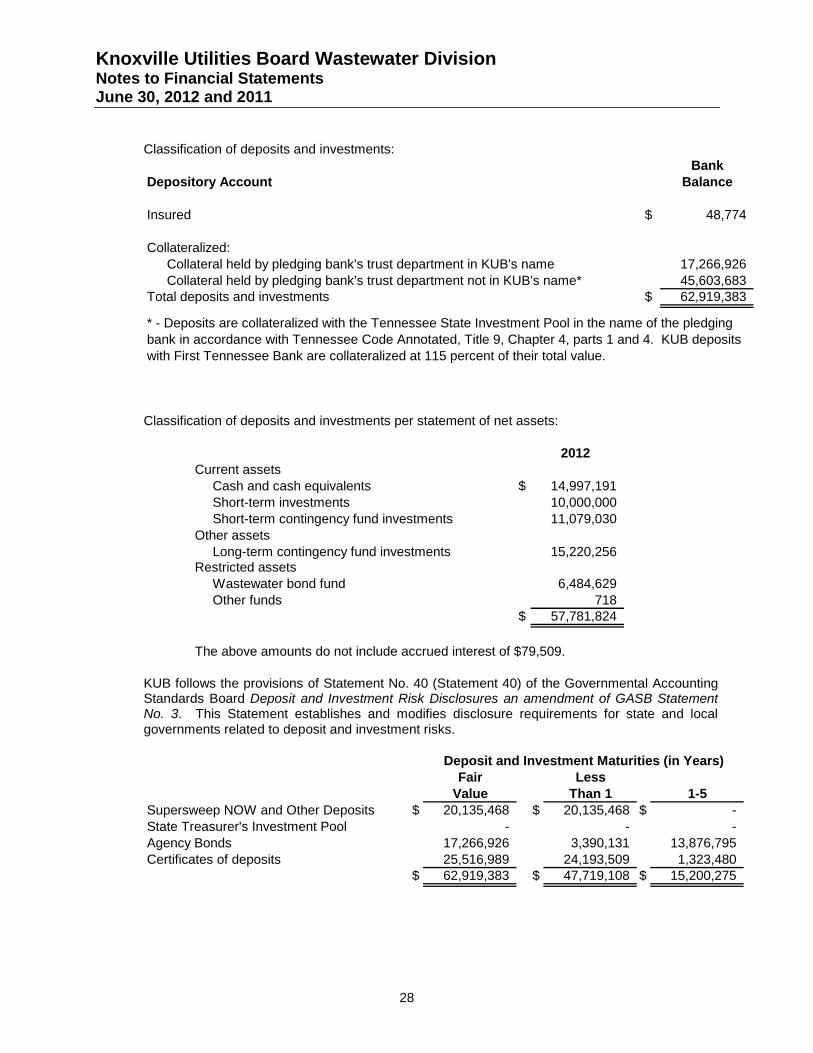
Knoxville Utilities Board Wastewater Division Notes to Financial Statements June 30, 2012 and 2011
28
Classification of deposits and investments: Bank
Depository Account Balance
Insured $ 48,774
Collateralized:Collateral held by pledging bank's trust department in KUB's name 17,266,926 Collateral held by pledging bank's trust department not in KUB's name* 45,603,683
Total deposits and investments $ 62,919,383
* - Deposits are collateralized with the Tennessee State Investment Pool in the name of the pledging bank in accordance with Tennessee Code Annotated, Title 9, Chapter 4, parts 1 and 4. KUB deposits with First Tennessee Bank are collateralized at 115 percent of their total value.
Classification of deposits and investments per statement of net assets:
2012Current assets
Cash and cash equivalents $ 14,997,191 Short-term investments 10,000,000 Short-term contingency fund investments 11,079,030
Other assetsLong-term contingency fund investments 15,220,256
Restricted assetsWastewater bond fund 6,484,629 Other funds 718
$ 57,781,824
The above amounts do not include accrued interest of $79,509. KUB follows the provisions of Statement No. 40 (Statement 40) of the Governmental Accounting Standards Board Deposit and Investment Risk Disclosures an amendment of GASB Statement No. 3. This Statement establishes and modifies disclosure requirements for state and local governments related to deposit and investment risks.
Fair LessValue Than 1 1-5
Supersweep NOW and Other Deposits $ 20,135,468 $ 20,135,468 $ -State Treasurer's Investment Pool - - -Agency Bonds 17,266,926 3,390,131 13,876,795Certificates of deposits 25,516,989 24,193,509 1,323,480
$ 62,919,383 $ 47,719,108 $ 15,200,275
Deposit and Investment Maturities (in Years)
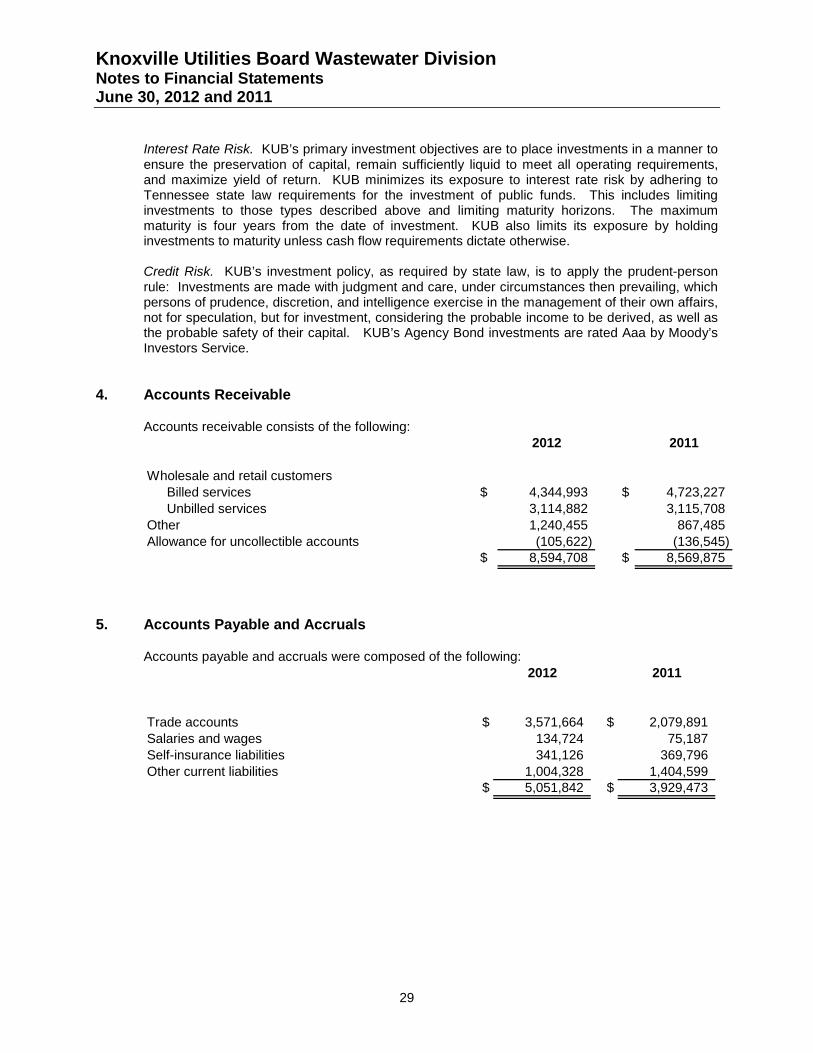
Knoxville Utilities Board Wastewater Division Notes to Financial Statements June 30, 2012 and 2011
29
Interest Rate Risk. KUB’s primary investment objectives are to place investments in a manner to ensure the preservation of capital, remain sufficiently liquid to meet all operating requirements, and maximize yield of return. KUB minimizes its exposure to interest rate risk by adhering to Tennessee state law requirements for the investment of public funds. This includes limiting investments to those types described above and limiting maturity horizons. The maximum maturity is four years from the date of investment. KUB also limits its exposure by holding investments to maturity unless cash flow requirements dictate otherwise.
Credit Risk. KUB’s investment policy, as required by state law, is to apply the prudent-person rule: Investments are made with judgment and care, under circumstances then prevailing, which persons of prudence, discretion, and intelligence exercise in the management of their own affairs, not for speculation, but for investment, considering the probable income to be derived, as well as the probable safety of their capital. KUB’s Agency Bond investments are rated Aaa by Moody’s Investors Service.
4. Accounts Receivable
Accounts receivable consists of the following: 2012 2011
Wholesale and retail customers Billed services $ 4,344,993 $ 4,723,227 Unbilled services 3,114,882 3,115,708 Other 1,240,455 867,485 Allowance for uncollectible accounts (105,622) (136,545)
$ 8,594,708 $ 8,569,875
5. Accounts Payable and Accruals
Accounts payable and accruals were composed of the following: 2012 2011
Trade accounts $ 3,571,664 $ 2,079,891 Salaries and wages 134,724 75,187 Self-insurance liabilities 341,126 369,796 Other current liabilities 1,004,328 1,404,599
$ 5,051,842 $ 3,929,473
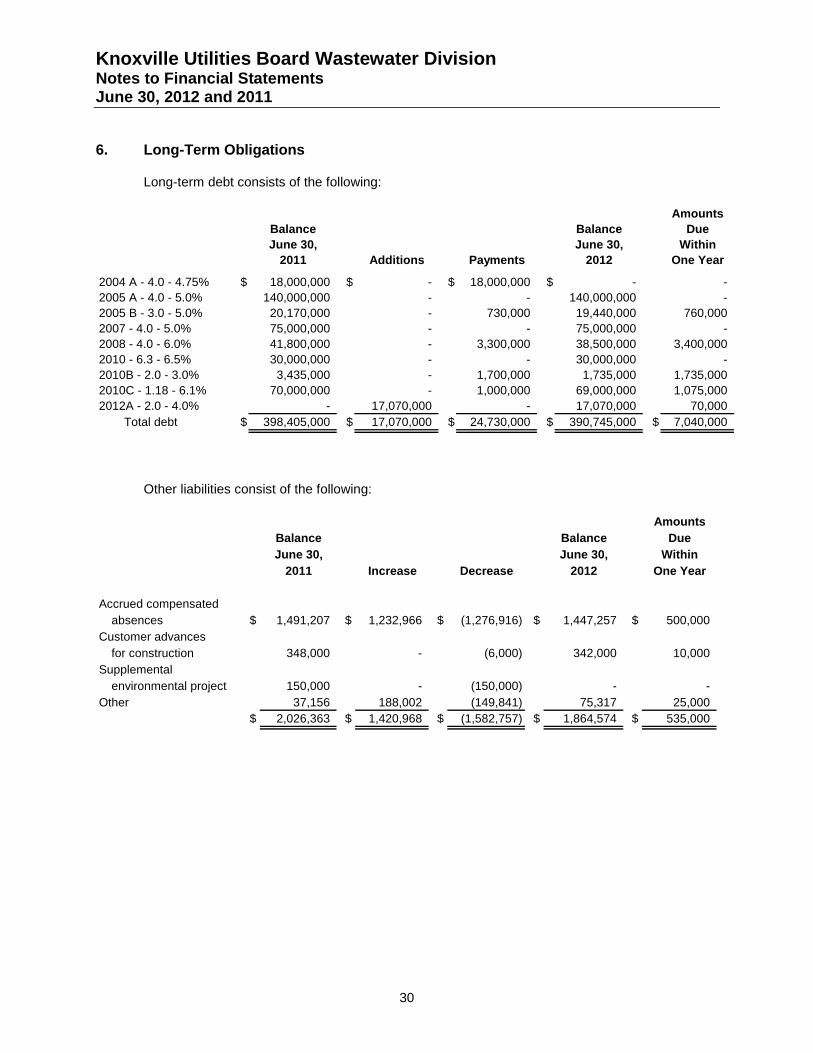
Knoxville Utilities Board Wastewater Division Notes to Financial Statements June 30, 2012 and 2011
30
6. Long-Term Obligations
Long-term debt consists of the following:
AmountsBalance Balance DueJune 30, June 30, Within
2011 Additions Payments 2012 One Year
2004 A - 4.0 - 4.75% $ 18,000,000 $ - $ 18,000,000 $ - - 2005 A - 4.0 - 5.0% 140,000,000 - - 140,000,000 - 2005 B - 3.0 - 5.0% 20,170,000 - 730,000 19,440,000 760,000 2007 - 4.0 - 5.0% 75,000,000 - - 75,000,000 - 2008 - 4.0 - 6.0% 41,800,000 - 3,300,000 38,500,000 3,400,000 2010 - 6.3 - 6.5% 30,000,000 - - 30,000,000 - 2010B - 2.0 - 3.0% 3,435,000 - 1,700,000 1,735,000 1,735,000 2010C - 1.18 - 6.1% 70,000,000 - 1,000,000 69,000,000 1,075,000 2012A - 2.0 - 4.0% - 17,070,000 - 17,070,000 70,000
Total debt $ 398,405,000 $ 17,070,000 $ 24,730,000 $ 390,745,000 $ 7,040,000
Other liabilities consist of the following:
AmountsBalance Balance DueJune 30, June 30, Within
2011 Increase Decrease 2012 One Year
Accrued compensatedabsences $ 1,491,207 $ 1,232,966 $ (1,276,916) $ 1,447,257 $ 500,000
Customer advancesfor construction 348,000 - (6,000) 342,000 10,000
Supplementalenvironmental project 150,000 - (150,000) - -
Other 37,156 188,002 (149,841) 75,317 25,000 $ 2,026,363 $ 1,420,968 $ (1,582,757) $ 1,864,574 $ 535,000
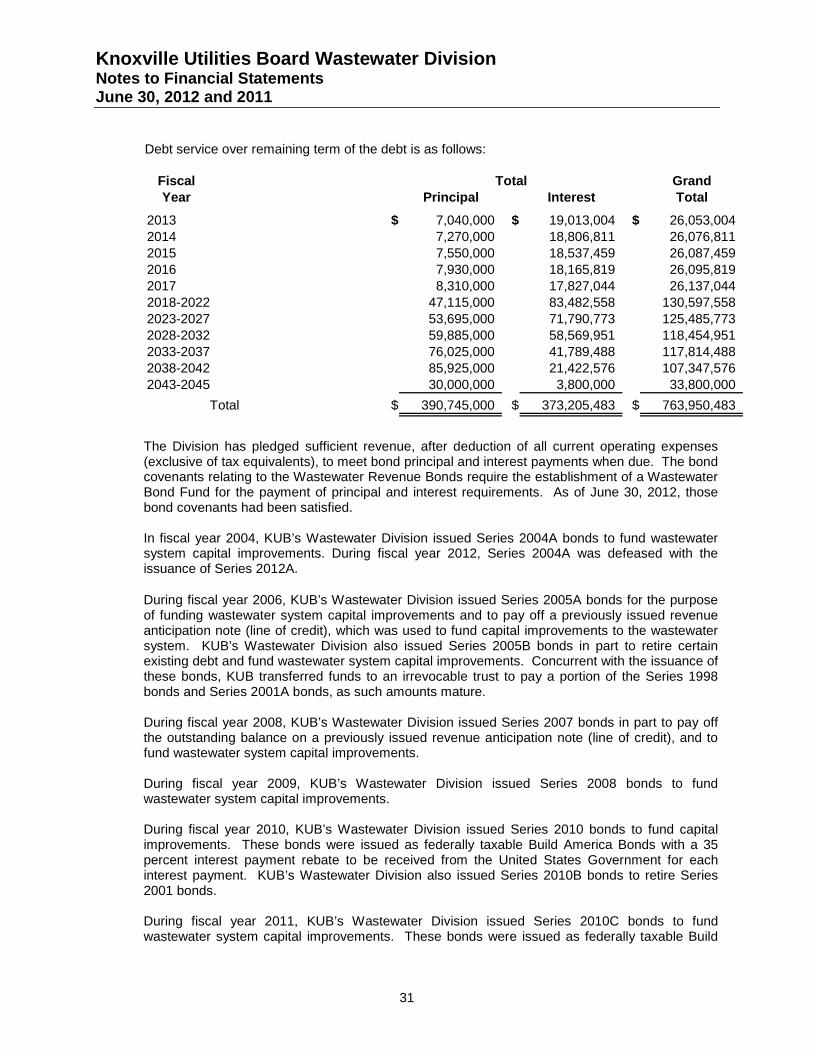
Knoxville Utilities Board Wastewater Division Notes to Financial Statements June 30, 2012 and 2011
31
Debt service over remaining term of the debt is as follows:
Fiscal GrandYear Principal Interest Total
2013 $ 7,040,000 $ 19,013,004 $ 26,053,004 2014 7,270,000 18,806,811 26,076,811 2015 7,550,000 18,537,459 26,087,459 2016 7,930,000 18,165,819 26,095,819 2017 8,310,000 17,827,044 26,137,044 2018-2022 47,115,000 83,482,558 130,597,558 2023-2027 53,695,000 71,790,773 125,485,773 2028-2032 59,885,000 58,569,951 118,454,951 2033-2037 76,025,000 41,789,488 117,814,488 2038-2042 85,925,000 21,422,576 107,347,576 2043-2045 30,000,000 3,800,000 33,800,000
Total $ 390,745,000 $ 373,205,483 $ 763,950,483
Total
The Division has pledged sufficient revenue, after deduction of all current operating expenses (exclusive of tax equivalents), to meet bond principal and interest payments when due. The bond covenants relating to the Wastewater Revenue Bonds require the establishment of a Wastewater Bond Fund for the payment of principal and interest requirements. As of June 30, 2012, those bond covenants had been satisfied. In fiscal year 2004, KUB’s Wastewater Division issued Series 2004A bonds to fund wastewater system capital improvements. During fiscal year 2012, Series 2004A was defeased with the issuance of Series 2012A.
During fiscal year 2006, KUB’s Wastewater Division issued Series 2005A bonds for the purpose of funding wastewater system capital improvements and to pay off a previously issued revenue anticipation note (line of credit), which was used to fund capital improvements to the wastewater system. KUB’s Wastewater Division also issued Series 2005B bonds in part to retire certain existing debt and fund wastewater system capital improvements. Concurrent with the issuance of these bonds, KUB transferred funds to an irrevocable trust to pay a portion of the Series 1998 bonds and Series 2001A bonds, as such amounts mature. During fiscal year 2008, KUB’s Wastewater Division issued Series 2007 bonds in part to pay off the outstanding balance on a previously issued revenue anticipation note (line of credit), and to fund wastewater system capital improvements. During fiscal year 2009, KUB’s Wastewater Division issued Series 2008 bonds to fund wastewater system capital improvements.
During fiscal year 2010, KUB’s Wastewater Division issued Series 2010 bonds to fund capital improvements. These bonds were issued as federally taxable Build America Bonds with a 35 percent interest payment rebate to be received from the United States Government for each interest payment. KUB’s Wastewater Division also issued Series 2010B bonds to retire Series 2001 bonds. During fiscal year 2011, KUB’s Wastewater Division issued Series 2010C bonds to fund wastewater system capital improvements. These bonds were issued as federally taxable Build
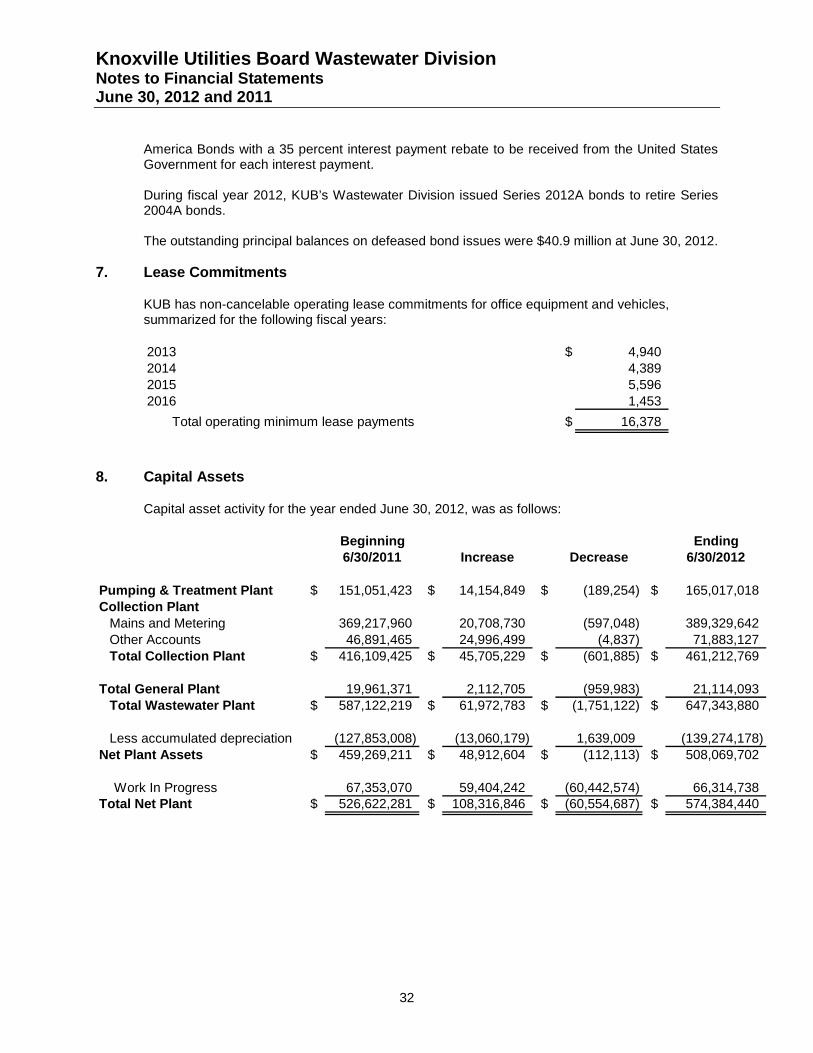
Knoxville Utilities Board Wastewater Division Notes to Financial Statements June 30, 2012 and 2011
32
America Bonds with a 35 percent interest payment rebate to be received from the United States Government for each interest payment. During fiscal year 2012, KUB’s Wastewater Division issued Series 2012A bonds to retire Series 2004A bonds. The outstanding principal balances on defeased bond issues were $40.9 million at June 30, 2012.
7. Lease Commitments
KUB has non-cancelable operating lease commitments for office equipment and vehicles, summarized for the following fiscal years:
2013 $ 4,940 2014 4,389 2015 5,596 2016 1,453
Total operating minimum lease payments $ 16,378
8. Capital Assets
Capital asset activity for the year ended June 30, 2012, was as follows:
Beginning Ending6/30/2011 Increase Decrease 6/30/2012
Pumping & Treatment Plant $ 151,051,423 $ 14,154,849 $ (189,254) $ 165,017,018 Collection Plant
Mains and Metering 369,217,960 20,708,730 (597,048) 389,329,642 Other Accounts 46,891,465 24,996,499 (4,837) 71,883,127 Total Collection Plant $ 416,109,425 $ 45,705,229 $ (601,885) $ 461,212,769
Total General Plant 19,961,371 2,112,705 (959,983) 21,114,093
Total Wastewater Plant $ 587,122,219 $ 61,972,783 $ (1,751,122) $ 647,343,880
Less accumulated depreciation (127,853,008) (13,060,179) 1,639,009 (139,274,178) Net Plant Assets $ 459,269,211 $ 48,912,604 $ (112,113) $ 508,069,702
Work In Progress 67,353,070 59,404,242 (60,442,574) 66,314,738 Total Net Plant $ 526,622,281 $ 108,316,846 $ (60,554,687) $ 574,384,440
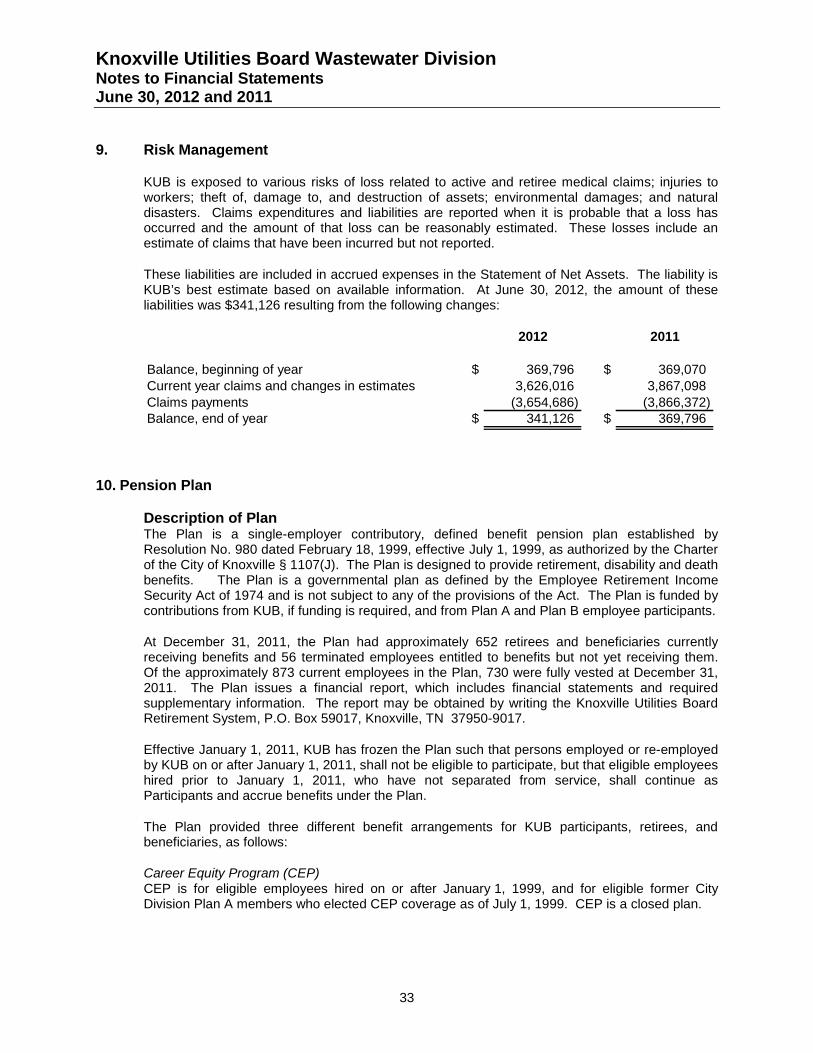
Knoxville Utilities Board Wastewater Division Notes to Financial Statements June 30, 2012 and 2011
33
9. Risk Management
KUB is exposed to various risks of loss related to active and retiree medical claims; injuries to workers; theft of, damage to, and destruction of assets; environmental damages; and natural disasters. Claims expenditures and liabilities are reported when it is probable that a loss has occurred and the amount of that loss can be reasonably estimated. These losses include an estimate of claims that have been incurred but not reported.
These liabilities are included in accrued expenses in the Statement of Net Assets. The liability is KUB’s best estimate based on available information. At June 30, 2012, the amount of these liabilities was $341,126 resulting from the following changes:
2012 2011
Balance, beginning of year $ 369,796 $ 369,070 Current year claims and changes in estimates 3,626,016 3,867,098 Claims payments (3,654,686) (3,866,372) Balance, end of year $ 341,126 $ 369,796
10. Pension Plan
Description of Plan The Plan is a single-employer contributory, defined benefit pension plan established by Resolution No. 980 dated February 18, 1999, effective July 1, 1999, as authorized by the Charter of the City of Knoxville § 1107(J). The Plan is designed to provide retirement, disability and death benefits. The Plan is a governmental plan as defined by the Employee Retirement Income Security Act of 1974 and is not subject to any of the provisions of the Act. The Plan is funded by contributions from KUB, if funding is required, and from Plan A and Plan B employee participants.
At December 31, 2011, the Plan had approximately 652 retirees and beneficiaries currently receiving benefits and 56 terminated employees entitled to benefits but not yet receiving them. Of the approximately 873 current employees in the Plan, 730 were fully vested at December 31, 2011. The Plan issues a financial report, which includes financial statements and required supplementary information. The report may be obtained by writing the Knoxville Utilities Board Retirement System, P.O. Box 59017, Knoxville, TN 37950-9017.
Effective January 1, 2011, KUB has frozen the Plan such that persons employed or re-employed by KUB on or after January 1, 2011, shall not be eligible to participate, but that eligible employees hired prior to January 1, 2011, who have not separated from service, shall continue as Participants and accrue benefits under the Plan.
The Plan provided three different benefit arrangements for KUB participants, retirees, and beneficiaries, as follows:
Career Equity Program (CEP) CEP is for eligible employees hired on or after January 1, 1999, and for eligible former City Division Plan A members who elected CEP coverage as of July 1, 1999. CEP is a closed plan.
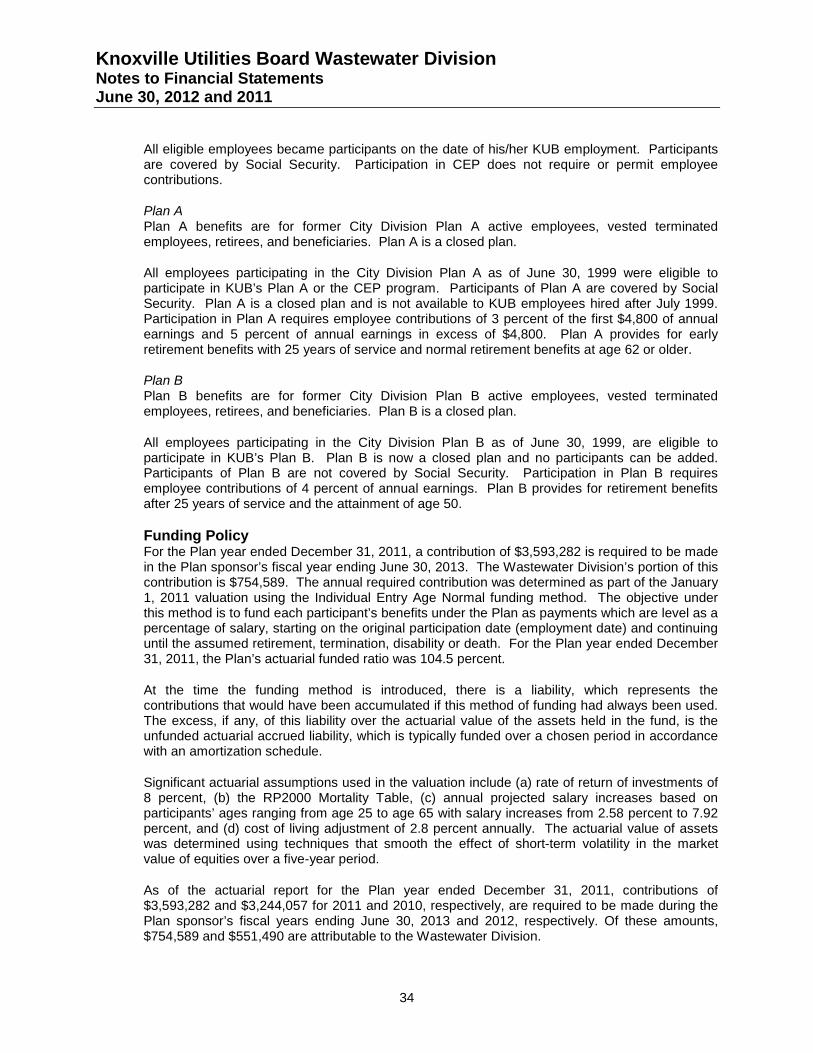
Knoxville Utilities Board Wastewater Division Notes to Financial Statements June 30, 2012 and 2011
34
All eligible employees became participants on the date of his/her KUB employment. Participants are covered by Social Security. Participation in CEP does not require or permit employee contributions.
Plan A Plan A benefits are for former City Division Plan A active employees, vested terminated employees, retirees, and beneficiaries. Plan A is a closed plan.
All employees participating in the City Division Plan A as of June 30, 1999 were eligible to participate in KUB’s Plan A or the CEP program. Participants of Plan A are covered by Social Security. Plan A is a closed plan and is not available to KUB employees hired after July 1999. Participation in Plan A requires employee contributions of 3 percent of the first $4,800 of annual earnings and 5 percent of annual earnings in excess of $4,800. Plan A provides for early retirement benefits with 25 years of service and normal retirement benefits at age 62 or older.
Plan B Plan B benefits are for former City Division Plan B active employees, vested terminated employees, retirees, and beneficiaries. Plan B is a closed plan.
All employees participating in the City Division Plan B as of June 30, 1999, are eligible to participate in KUB’s Plan B. Plan B is now a closed plan and no participants can be added. Participants of Plan B are not covered by Social Security. Participation in Plan B requires employee contributions of 4 percent of annual earnings. Plan B provides for retirement benefits after 25 years of service and the attainment of age 50.
Funding Policy For the Plan year ended December 31, 2011, a contribution of $3,593,282 is required to be made in the Plan sponsor’s fiscal year ending June 30, 2013. The Wastewater Division’s portion of this contribution is $754,589. The annual required contribution was determined as part of the January 1, 2011 valuation using the Individual Entry Age Normal funding method. The objective under this method is to fund each participant’s benefits under the Plan as payments which are level as a percentage of salary, starting on the original participation date (employment date) and continuing until the assumed retirement, termination, disability or death. For the Plan year ended December 31, 2011, the Plan’s actuarial funded ratio was 104.5 percent.
At the time the funding method is introduced, there is a liability, which represents the contributions that would have been accumulated if this method of funding had always been used. The excess, if any, of this liability over the actuarial value of the assets held in the fund, is the unfunded actuarial accrued liability, which is typically funded over a chosen period in accordance with an amortization schedule.
Significant actuarial assumptions used in the valuation include (a) rate of return of investments of 8 percent, (b) the RP2000 Mortality Table, (c) annual projected salary increases based on participants’ ages ranging from age 25 to age 65 with salary increases from 2.58 percent to 7.92 percent, and (d) cost of living adjustment of 2.8 percent annually. The actuarial value of assets was determined using techniques that smooth the effect of short-term volatility in the market value of equities over a five-year period.
As of the actuarial report for the Plan year ended December 31, 2011, contributions of $3,593,282 and $3,244,057 for 2011 and 2010, respectively, are required to be made during the Plan sponsor’s fiscal years ending June 30, 2013 and 2012, respectively. Of these amounts, $754,589 and $551,490 are attributable to the Wastewater Division.
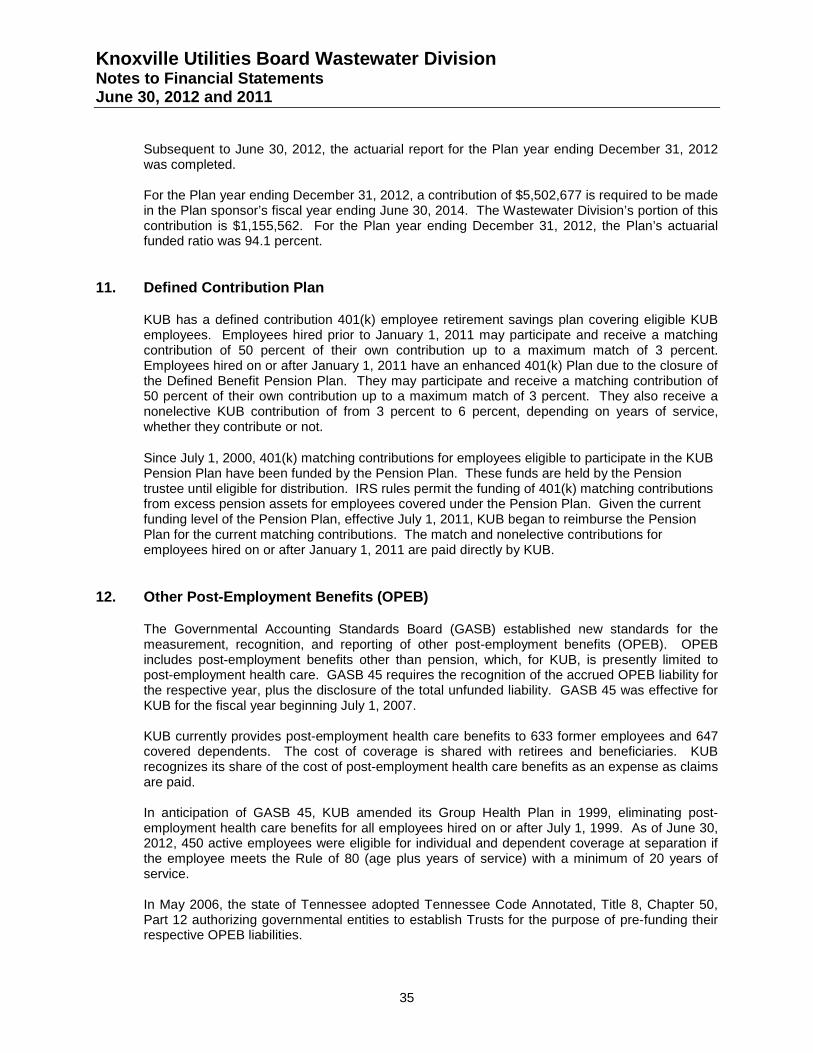
Knoxville Utilities Board Wastewater Division Notes to Financial Statements June 30, 2012 and 2011
35
Subsequent to June 30, 2012, the actuarial report for the Plan year ending December 31, 2012 was completed. For the Plan year ending December 31, 2012, a contribution of $5,502,677 is required to be made in the Plan sponsor’s fiscal year ending June 30, 2014. The Wastewater Division’s portion of this contribution is $1,155,562. For the Plan year ending December 31, 2012, the Plan’s actuarial funded ratio was 94.1 percent.
11. Defined Contribution Plan
KUB has a defined contribution 401(k) employee retirement savings plan covering eligible KUB employees. Employees hired prior to January 1, 2011 may participate and receive a matching contribution of 50 percent of their own contribution up to a maximum match of 3 percent. Employees hired on or after January 1, 2011 have an enhanced 401(k) Plan due to the closure of the Defined Benefit Pension Plan. They may participate and receive a matching contribution of 50 percent of their own contribution up to a maximum match of 3 percent. They also receive a nonelective KUB contribution of from 3 percent to 6 percent, depending on years of service, whether they contribute or not.
Since July 1, 2000, 401(k) matching contributions for employees eligible to participate in the KUB Pension Plan have been funded by the Pension Plan. These funds are held by the Pension trustee until eligible for distribution. IRS rules permit the funding of 401(k) matching contributions from excess pension assets for employees covered under the Pension Plan. Given the current funding level of the Pension Plan, effective July 1, 2011, KUB began to reimburse the Pension Plan for the current matching contributions. The match and nonelective contributions for employees hired on or after January 1, 2011 are paid directly by KUB.
12. Other Post-Employment Benefits (OPEB)
The Governmental Accounting Standards Board (GASB) established new standards for the measurement, recognition, and reporting of other post-employment benefits (OPEB). OPEB includes post-employment benefits other than pension, which, for KUB, is presently limited to post-employment health care. GASB 45 requires the recognition of the accrued OPEB liability for the respective year, plus the disclosure of the total unfunded liability. GASB 45 was effective for KUB for the fiscal year beginning July 1, 2007.
KUB currently provides post-employment health care benefits to 633 former employees and 647 covered dependents. The cost of coverage is shared with retirees and beneficiaries. KUB recognizes its share of the cost of post-employment health care benefits as an expense as claims are paid.
In anticipation of GASB 45, KUB amended its Group Health Plan in 1999, eliminating post-employment health care benefits for all employees hired on or after July 1, 1999. As of June 30, 2012, 450 active employees were eligible for individual and dependent coverage at separation if the employee meets the Rule of 80 (age plus years of service) with a minimum of 20 years of service. In May 2006, the state of Tennessee adopted Tennessee Code Annotated, Title 8, Chapter 50, Part 12 authorizing governmental entities to establish Trusts for the purpose of pre-funding their respective OPEB liabilities.
Knoxville Utilities Board Wastewater Division Notes to Financial Statements June 30, 2012 and 2011
36
Although GASB 45 does not require pre-funding of the liability, KUB has determined that it is in the long-term economic interest of KUB and its ratepayers to establish a Trust to pre-fund KUB’s OPEB liability.
In October 2007, the KUB Board authorized the establishment of an OPEB Trust. The applicable documentation was submitted to the State Funding Board and, in December 2007, the State Funding Board approved the Trust. The Trust was also approved by the Internal Revenue Service in June 2008. The Trust issues a financial report, which includes financial statements and required supplementary information. The report may be obtained by writing the Knoxville Utilities Board Retirement System, P.O. Box 59017, Knoxville, TN 37950-9017.
The general administration and responsibility for the proper operation of the Trust is governed by a board of trustees, appointed by KUB’s President & CEO. The investment of all deposits to the Trust is governed by an Investment Policy, which was adopted by the KUB Board and approved by the State Funding Board. Total contributions to the OPEB Trust for the fiscal year ended June 30, 2012 were $8.1 million (Division’s share $1.3 million). The contribution to the Trust exceeded the annual required contribution (ARC), as determined by the Postretirement Benefit Plan’s actuarial valuation for the year ended December 31, 2010, which was $4.6 million (Division’s share $0.8 million). As of June 30, 2012, the employer’s net OPEB obligation was $1.7 million (Division’s share $0.3 million).
The ARC for the fiscal year ending June 30, 2013, as determined by the Plan’s actuarial valuation for the year ended December 31, 2011 is $3.3 million (Division’s share $0.7 million).
The actuarial valuation for the Plan for the year ending December 31, 2012 has been completed. The valuation determined that the Plan’s actuarial accrued liability was $61.6 million (Division’s share $13 million). The actuarial value of the Plan’s assets was $37.9 million (Division’s share $8 million). As a result, the Plan’s unfunded actuarial accrued liability was $23.7 million (Division’s share $5 million). The Plan’s actuarial funded ratio was 62 percent. The valuation also determined that the employer’s ARC is $3.3 million for the fiscal year ending June 30, 2014 (Division’s share $0.7 million).
Knoxville Utilities Board Wastewater Division Notes to Financial Statements June 30, 2012 and 2011
37
13. Related Party Transactions
The Division, in the normal course of operations, is involved in transactions with the City of Knoxville and with other divisions of KUB. Such transactions for the years ended June 30, 2012 and 2011 are summarized as follows:
2012 2011
City of KnoxvilleAmounts billed by the Division for utilities and
related services $ 704,749 $ 658,183 Payments by the Division in lieu of property tax 3,002,025 2,859,071 Payments by the Division for services provided 421,662 756,303
Other divisions of KUBAmounts billed to other divisions for utilities
and related services provided 312,212 312,296 Interdivisional rental expense 164,829 201,856 Interdivisional rental income 90,385 91,525 Amounts billed to the Division by other divisions
for utilities services provided 2,860,227 3,076,452
With respect to these transactions, accounts receivable from and accounts payable to the City of Knoxville and the other divisions included in the balance sheet at year end were:
2012 2011
Accounts receivable $ 16,444 $ 24,428
14. Other Commitments and Contingencies
In the normal course of business, there are various lawsuits pending against KUB. Management has reviewed these lawsuits with counsel, who is vigorously defending KUB's position and is of the opinion that the ultimate disposition of these matters will not have a material adverse effect on KUB's financial position, results of operations or cash flows.
In February 2005, a Consent Decree was entered into federal court regarding the operation of KUB’s wastewater system. Under the terms of the Consent Decree, the remediation of identified sanitary sewer overflows (“SSOs”) on KUB’s wastewater system must be completed by June 30, 2016. KUB anticipates the Division will spend approximately $530 million in capital investments in order to comply with the terms of the Consent Decree related to the collection system. The Consent Decree also required KUB to perform an evaluation of the wet-weather performance and capacity of its wastewater treatment plants. In July 2007, KUB submitted a Composite Correction Plan (CCP) for its wastewater treatment plants to EPA for review. The development and filing of the CCP was a requirement of the federal order of February 2005. The CCP includes recommended improvements to KUB’s Kuwahee and Fourth Creek treatment plants to address wet weather capacity issues noted in prior assessments. The EPA approved the CCP in January 2009 including a recommended schedule of plant improvements that extends beyond the expiration date of the original Consent Decree. An amendment to the Consent Decree incorporating and establishing this schedule was
Knoxville Utilities Board Wastewater Division Notes to Financial Statements June 30, 2012 and 2011
38
agreed to by all parties and was entered on June 23, 2009. The purpose of the Amendment is to allow KUB to complete a portion of work outlined in the CCP after the Consent Decree deadline of June 30, 2016. The CCP provides for a biologically enhanced high-rate clarification (the “BEHRC”) secondary treatment system to be installed at the Fourth Creek treatment plant by June 30, 2018, and at the Kuwahee treatment plant by June 30, 2021. The total cost of such improvements is estimated to be approximately $120 million.
KUB’s total estimated capital investment to comply with the terms of the Consent Decree is $650 million. During fiscal year 2006, KUB launched the Private Lateral Program (PLP), as required by the Consent Decree, under which KUB tests private collection system laterals on its wastewater system over a ten-year period. Defective laterals and improper connections can introduce rainwater overloading the wastewater system and add pollution to area waterways. If a private lateral fails the respective inspection test, then the customer is required to have the lateral repaired/replaced within a specified time period. The $2 million SEP provides funding for lateral repairs/replacements for eligible low-income customers. A $1.7 million liability was accrued in May 2006 for the SEP. In fiscal year 2012, KUB completed funding of the SEP. KUB’s funding plan for the Consent Decree includes long-term bonds and a series of rate increases phased in over the term of the order. Bond proceeds fund all wastewater capital projects, the majority of which are related to the Consent Decree. As of June 30, 2012, the Wastewater Division had issued $360 million in bonds to fund system capital improvements since the inception of the Consent Decree. The KUB Board of Commissioners approved two 50 percent rate increases, which went into effect in April 2005 and January 2007, respectively. The Board also approved an 8 percent rate increase, which was effective in September 2008, and a 12 percent rate increase, which was effective in April 2011. The Board also adopted a 12 percent rate increase to be effective October 2012. KUB anticipates additional bond issues and rate increases over the next decade to help fund wastewater capital improvements.
Knoxville Utilities Board Wastewater Division Required Supplementary Information – Schedule of Funding Progress June 30, 2012
39
Pension Plan
Other Post-Employment Benefits (OPEB)
Unfunded Actuarial Actuarial UAAL as a
Actuarial Accrued Accrued PercentageValue of Liability Liability Funded Covered of Covered
Valuation Assets (AAL) (UAAL) Ratio Payroll PayrollDate (a) (b) (b-a) (a)/(b) (c) [(b)-(a)]/(c)
January 1, 2008 -$ 108,329,141$ 108,329,141$ 0% 31,234,509$ 346.8%January 1, 2009 14,593,487 100,726,738 86,133,251 14% 31,846,091 270.5%January 1, 2010 21,275,643 58,475,364 37,199,721 36% 30,069,028 123.7%January 1, 2011 40,749,815 64,289,254 23,539,439 63% 28,878,791 81.5%January 1, 2012 37,907,357 61,603,466 23,696,109 62% 28,269,123 83.8%
Unfunded Actuarial UAAL as a
Actuarial Actuarial Accrued Annual PercentageValuation Value of Accrued Liability Funded Covered of Covered
Date Assets Liability (UAAL) Ratio Payroll Payroll(a) (b) (b-a) (a)/(b) (c) [(b)-(a)]/(c)
January 1, 2009 183,447,296$ 194,366,597$ 10,919,301$ 94.4% 49,602,223$ 22.01%January 1, 2010 203,704,898 190,679,453 (13,025,445) 106.8% 48,228,428 (27.01%)January 1, 2011 195,692,781 187,257,434 (8,435,347) 104.5% 47,405,874 (17.79%)January 1, 2012 183,980,665 195,536,152 11,555,487 94.1% 48,836,721 23.66%
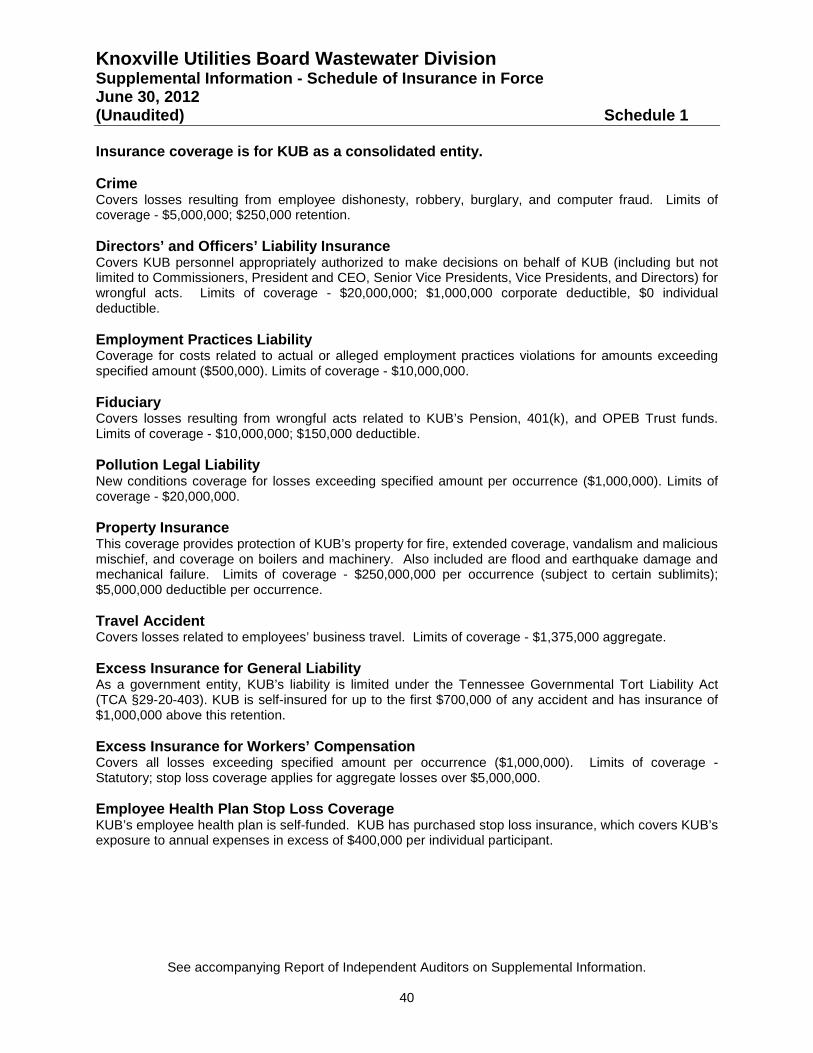
Knoxville Utilities Board Wastewater Division Supplemental Information - Schedule of Insurance in Force June 30, 2012 (Unaudited) Schedule 1
See accompanying Report of Independent Auditors on Supplemental Information.
40
Insurance coverage is for KUB as a consolidated entity. Crime Covers losses resulting from employee dishonesty, robbery, burglary, and computer fraud. Limits of coverage - $5,000,000; $250,000 retention. Directors’ and Officers’ Liability Insurance Covers KUB personnel appropriately authorized to make decisions on behalf of KUB (including but not limited to Commissioners, President and CEO, Senior Vice Presidents, Vice Presidents, and Directors) for wrongful acts. Limits of coverage - $20,000,000; $1,000,000 corporate deductible, $0 individual deductible. Employment Practices Liability Coverage for costs related to actual or alleged employment practices violations for amounts exceeding specified amount ($500,000). Limits of coverage - $10,000,000. Fiduciary Covers losses resulting from wrongful acts related to KUB’s Pension, 401(k), and OPEB Trust funds. Limits of coverage - $10,000,000; $150,000 deductible. Pollution Legal Liability New conditions coverage for losses exceeding specified amount per occurrence ($1,000,000). Limits of coverage - $20,000,000. Property Insurance This coverage provides protection of KUB’s property for fire, extended coverage, vandalism and malicious mischief, and coverage on boilers and machinery. Also included are flood and earthquake damage and mechanical failure. Limits of coverage - $250,000,000 per occurrence (subject to certain sublimits); $5,000,000 deductible per occurrence. Travel Accident Covers losses related to employees’ business travel. Limits of coverage - $1,375,000 aggregate. Excess Insurance for General Liability As a government entity, KUB’s liability is limited under the Tennessee Governmental Tort Liability Act (TCA §29-20-403). KUB is self-insured for up to the first $700,000 of any accident and has insurance of $1,000,000 above this retention. Excess Insurance for Workers’ Compensation Covers all losses exceeding specified amount per occurrence ($1,000,000). Limits of coverage - Statutory; stop loss coverage applies for aggregate losses over $5,000,000. Employee Health Plan Stop Loss Coverage KUB’s employee health plan is self-funded. KUB has purchased stop loss insurance, which covers KUB’s exposure to annual expenses in excess of $400,000 per individual participant.
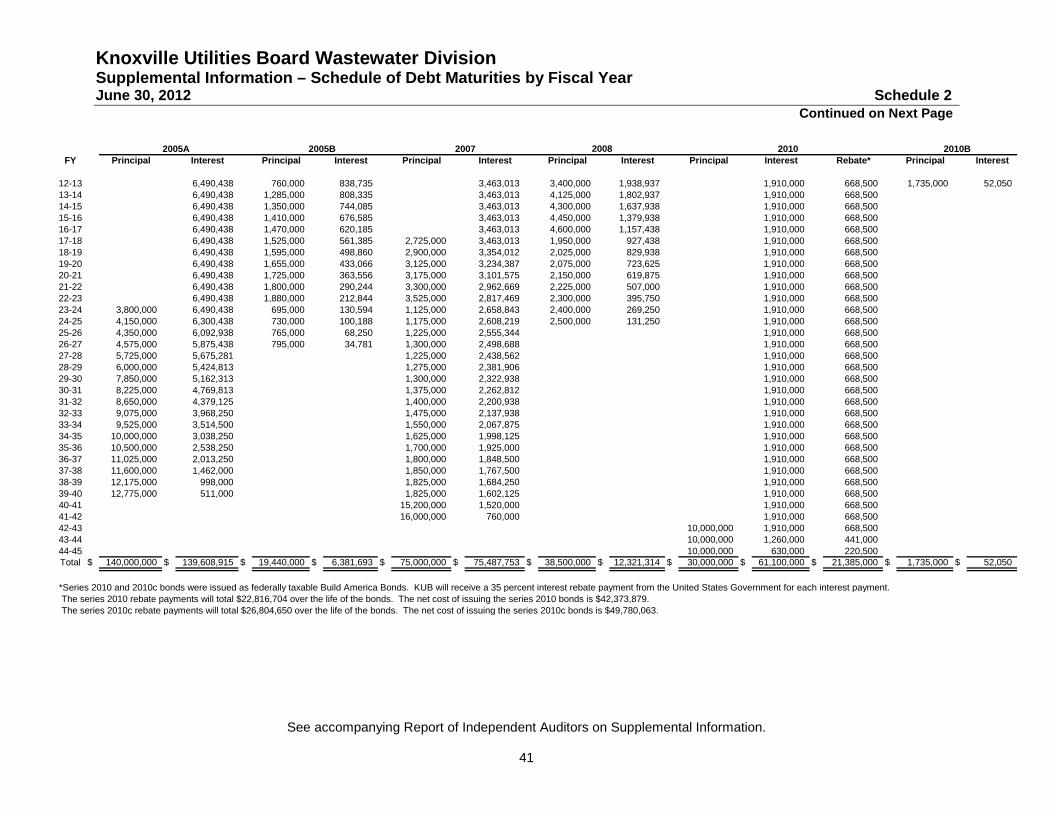
Knoxville Utilities Board Wastewater Division Supplemental Information – Schedule of Debt Maturities by Fiscal Year June 30, 2012 Schedule 2
See accompanying Report of Independent Auditors on Supplemental Information.
41
Continued on Next Page
2005A 2005B 2007 2010 2010BFY Principal Interest Principal Interest Principal Interest Principal Interest Principal Interest Rebate* Principal Interest
12-13 6,490,438 760,000 838,735 3,463,013 3,400,000 1,938,937 1,910,000 668,500 1,735,000 52,050 13-14 6,490,438 1,285,000 808,335 3,463,013 4,125,000 1,802,937 1,910,000 668,500 14-15 6,490,438 1,350,000 744,085 3,463,013 4,300,000 1,637,938 1,910,000 668,500 15-16 6,490,438 1,410,000 676,585 3,463,013 4,450,000 1,379,938 1,910,000 668,500 16-17 6,490,438 1,470,000 620,185 3,463,013 4,600,000 1,157,438 1,910,000 668,500 17-18 6,490,438 1,525,000 561,385 2,725,000 3,463,013 1,950,000 927,438 1,910,000 668,500 18-19 6,490,438 1,595,000 498,860 2,900,000 3,354,012 2,025,000 829,938 1,910,000 668,500 19-20 6,490,438 1,655,000 433,066 3,125,000 3,234,387 2,075,000 723,625 1,910,000 668,500 20-21 6,490,438 1,725,000 363,556 3,175,000 3,101,575 2,150,000 619,875 1,910,000 668,500 21-22 6,490,438 1,800,000 290,244 3,300,000 2,962,669 2,225,000 507,000 1,910,000 668,500 22-23 6,490,438 1,880,000 212,844 3,525,000 2,817,469 2,300,000 395,750 1,910,000 668,500 23-24 3,800,000 6,490,438 695,000 130,594 1,125,000 2,658,843 2,400,000 269,250 1,910,000 668,500 24-25 4,150,000 6,300,438 730,000 100,188 1,175,000 2,608,219 2,500,000 131,250 1,910,000 668,500 25-26 4,350,000 6,092,938 765,000 68,250 1,225,000 2,555,344 1,910,000 668,500 26-27 4,575,000 5,875,438 795,000 34,781 1,300,000 2,498,688 1,910,000 668,500 27-28 5,725,000 5,675,281 1,225,000 2,438,562 1,910,000 668,500 28-29 6,000,000 5,424,813 1,275,000 2,381,906 1,910,000 668,500 29-30 7,850,000 5,162,313 1,300,000 2,322,938 1,910,000 668,500 30-31 8,225,000 4,769,813 1,375,000 2,262,812 1,910,000 668,500 31-32 8,650,000 4,379,125 1,400,000 2,200,938 1,910,000 668,500 32-33 9,075,000 3,968,250 1,475,000 2,137,938 1,910,000 668,500 33-34 9,525,000 3,514,500 1,550,000 2,067,875 1,910,000 668,500 34-35 10,000,000 3,038,250 1,625,000 1,998,125 1,910,000 668,500 35-36 10,500,000 2,538,250 1,700,000 1,925,000 1,910,000 668,500 36-37 11,025,000 2,013,250 1,800,000 1,848,500 1,910,000 668,500 37-38 11,600,000 1,462,000 1,850,000 1,767,500 1,910,000 668,500 38-39 12,175,000 998,000 1,825,000 1,684,250 1,910,000 668,500 39-40 12,775,000 511,000 1,825,000 1,602,125 1,910,000 668,500 40-41 15,200,000 1,520,000 1,910,000 668,500 41-42 16,000,000 760,000 1,910,000 668,500 42-43 10,000,000 1,910,000 668,500 43-44 10,000,000 1,260,000 441,000 44-45 10,000,000 630,000 220,500 Total $ 140,000,000 $ 139,608,915 $ 19,440,000 $ 6,381,693 $ 75,000,000 $ 75,487,753 $ 38,500,000 $ 12,321,314 $ 30,000,000 $ 61,100,000 $ 21,385,000 $ 1,735,000 $ 52,050
*Series 2010 and 2010c bonds were issued as federally taxable Build America Bonds. KUB will receive a 35 percent interest rebate payment from the United States Government for each interest payment. The series 2010 rebate payments will total $22,816,704 over the life of the bonds. The net cost of issuing the series 2010 bonds is $42,373,879. The series 2010c rebate payments will total $26,804,650 over the life of the bonds. The net cost of issuing the series 2010c bonds is $49,780,063.
2008
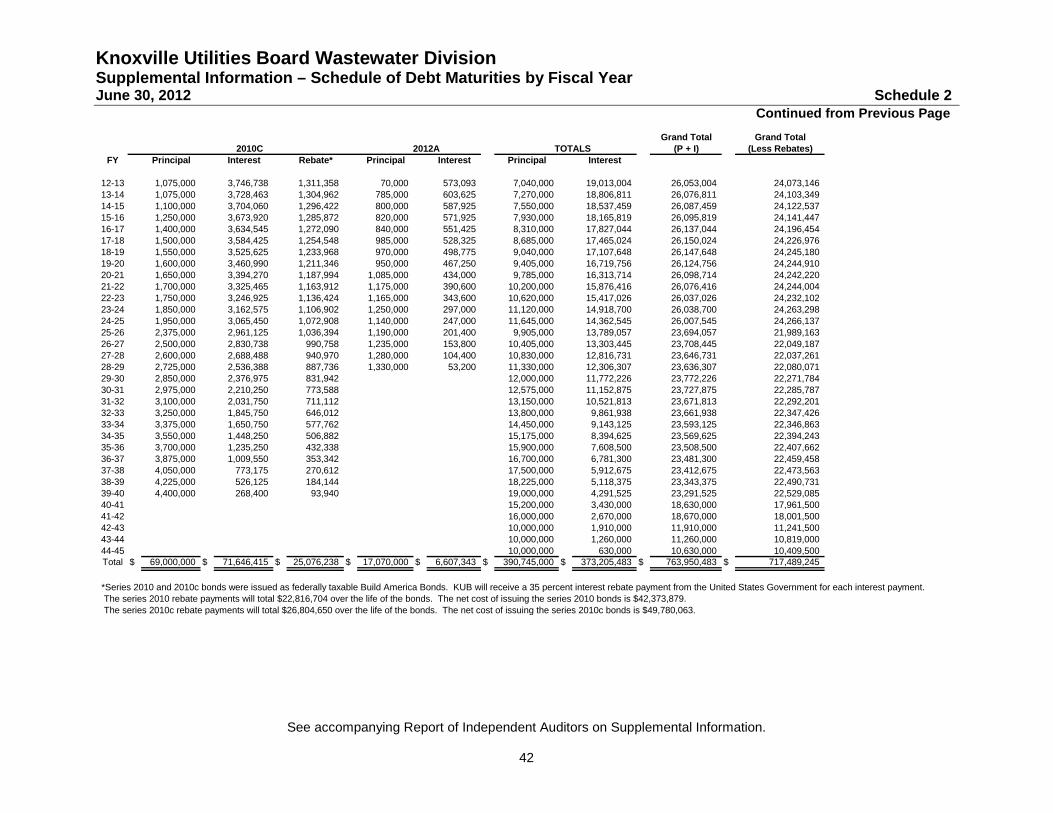
Knoxville Utilities Board Wastewater Division Supplemental Information – Schedule of Debt Maturities by Fiscal Year June 30, 2012 Schedule 2
See accompanying Report of Independent Auditors on Supplemental Information.
42
Continued from Previous Page
Grand Total Grand Total2010C 2012A TOTALS (P + I) (Less Rebates)
FY Principal Interest Rebate* Principal Interest Principal Interest
12-13 1,075,000 3,746,738 1,311,358 70,000 573,093 7,040,000 19,013,004 26,053,004 24,073,146 13-14 1,075,000 3,728,463 1,304,962 785,000 603,625 7,270,000 18,806,811 26,076,811 24,103,349 14-15 1,100,000 3,704,060 1,296,422 800,000 587,925 7,550,000 18,537,459 26,087,459 24,122,537 15-16 1,250,000 3,673,920 1,285,872 820,000 571,925 7,930,000 18,165,819 26,095,819 24,141,447 16-17 1,400,000 3,634,545 1,272,090 840,000 551,425 8,310,000 17,827,044 26,137,044 24,196,454 17-18 1,500,000 3,584,425 1,254,548 985,000 528,325 8,685,000 17,465,024 26,150,024 24,226,976 18-19 1,550,000 3,525,625 1,233,968 970,000 498,775 9,040,000 17,107,648 26,147,648 24,245,180 19-20 1,600,000 3,460,990 1,211,346 950,000 467,250 9,405,000 16,719,756 26,124,756 24,244,910 20-21 1,650,000 3,394,270 1,187,994 1,085,000 434,000 9,785,000 16,313,714 26,098,714 24,242,220 21-22 1,700,000 3,325,465 1,163,912 1,175,000 390,600 10,200,000 15,876,416 26,076,416 24,244,004 22-23 1,750,000 3,246,925 1,136,424 1,165,000 343,600 10,620,000 15,417,026 26,037,026 24,232,102 23-24 1,850,000 3,162,575 1,106,902 1,250,000 297,000 11,120,000 14,918,700 26,038,700 24,263,298 24-25 1,950,000 3,065,450 1,072,908 1,140,000 247,000 11,645,000 14,362,545 26,007,545 24,266,137 25-26 2,375,000 2,961,125 1,036,394 1,190,000 201,400 9,905,000 13,789,057 23,694,057 21,989,163 26-27 2,500,000 2,830,738 990,758 1,235,000 153,800 10,405,000 13,303,445 23,708,445 22,049,187 27-28 2,600,000 2,688,488 940,970 1,280,000 104,400 10,830,000 12,816,731 23,646,731 22,037,261 28-29 2,725,000 2,536,388 887,736 1,330,000 53,200 11,330,000 12,306,307 23,636,307 22,080,071 29-30 2,850,000 2,376,975 831,942 12,000,000 11,772,226 23,772,226 22,271,784 30-31 2,975,000 2,210,250 773,588 12,575,000 11,152,875 23,727,875 22,285,787 31-32 3,100,000 2,031,750 711,112 13,150,000 10,521,813 23,671,813 22,292,201 32-33 3,250,000 1,845,750 646,012 13,800,000 9,861,938 23,661,938 22,347,426 33-34 3,375,000 1,650,750 577,762 14,450,000 9,143,125 23,593,125 22,346,863 34-35 3,550,000 1,448,250 506,882 15,175,000 8,394,625 23,569,625 22,394,243 35-36 3,700,000 1,235,250 432,338 15,900,000 7,608,500 23,508,500 22,407,662 36-37 3,875,000 1,009,550 353,342 16,700,000 6,781,300 23,481,300 22,459,458 37-38 4,050,000 773,175 270,612 17,500,000 5,912,675 23,412,675 22,473,563 38-39 4,225,000 526,125 184,144 18,225,000 5,118,375 23,343,375 22,490,731 39-40 4,400,000 268,400 93,940 19,000,000 4,291,525 23,291,525 22,529,085 40-41 15,200,000 3,430,000 18,630,000 17,961,500 41-42 16,000,000 2,670,000 18,670,000 18,001,500 42-43 10,000,000 1,910,000 11,910,000 11,241,500 43-44 10,000,000 1,260,000 11,260,000 10,819,000 44-45 10,000,000 630,000 10,630,000 10,409,500 Total $ 69,000,000 $ 71,646,415 $ 25,076,238 $ 17,070,000 $ 6,607,343 $ 390,745,000 $ 373,205,483 $ 763,950,483 $ 717,489,245
*Series 2010 and 2010c bonds were issued as federally taxable Build America Bonds. KUB will receive a 35 percent interest rebate payment from the United States Government for each interest payment. The series 2010 rebate payments will total $22,816,704 over the life of the bonds. The net cost of issuing the series 2010 bonds is $42,373,879. The series 2010c rebate payments will total $26,804,650 over the life of the bonds. The net cost of issuing the series 2010c bonds is $49,780,063.
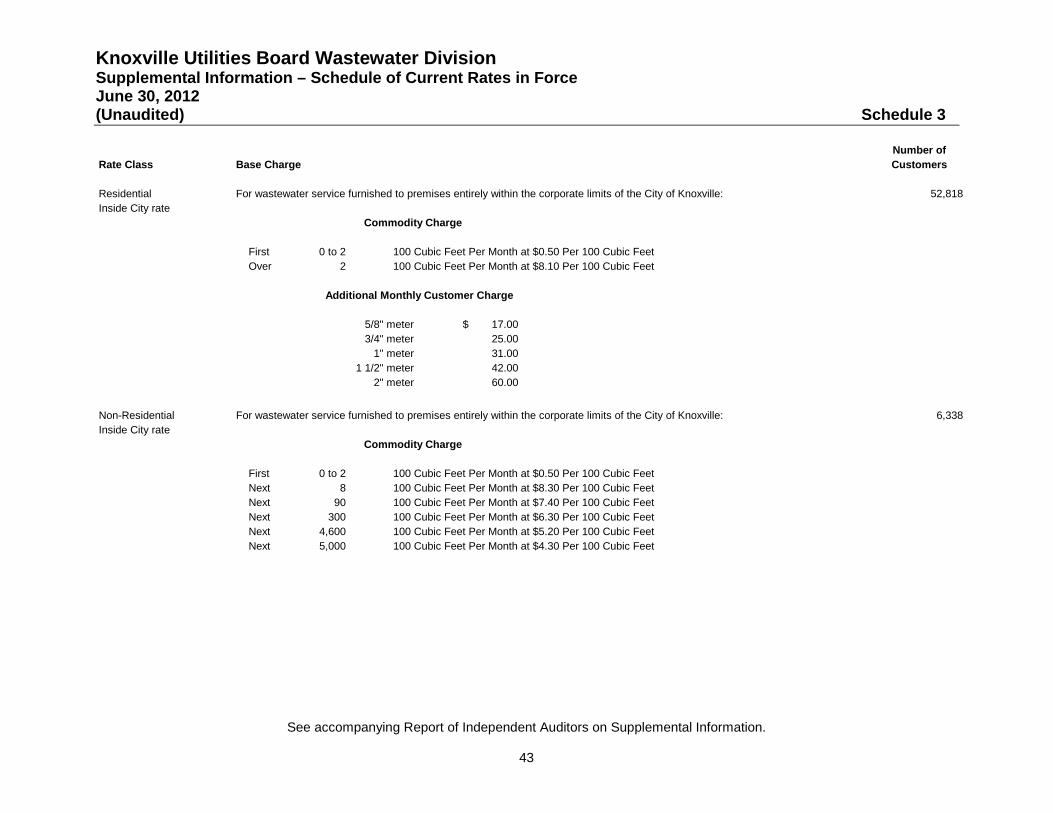
Knoxville Utilities Board Wastewater Division Supplemental Information – Schedule of Current Rates in Force June 30, 2012 (Unaudited) Schedule 3
See accompanying Report of Independent Auditors on Supplemental Information.
43
Number ofRate Class Base Charge Customers
Residential For wastewater service furnished to premises entirely within the corporate limits of the City of Knoxville: 52,818Inside City rate
First 0 to 2 100 Cubic Feet Per Month at $0.50 Per 100 Cubic FeetOver 2 100 Cubic Feet Per Month at $8.10 Per 100 Cubic Feet
5/8" meter 17.00$ 3/4" meter 25.00
1" meter 31.00 1 1/2" meter 42.00
2" meter 60.00
Non-Residential For wastewater service furnished to premises entirely within the corporate limits of the City of Knoxville: 6,338Inside City rate
First 0 to 2 100 Cubic Feet Per Month at $0.50 Per 100 Cubic FeetNext 8 100 Cubic Feet Per Month at $8.30 Per 100 Cubic FeetNext 90 100 Cubic Feet Per Month at $7.40 Per 100 Cubic FeetNext 300 100 Cubic Feet Per Month at $6.30 Per 100 Cubic FeetNext 4,600 100 Cubic Feet Per Month at $5.20 Per 100 Cubic FeetNext 5,000 100 Cubic Feet Per Month at $4.30 Per 100 Cubic Feet
Commodity Charge
Additional Monthly Customer Charge
Commodity Charge

Knoxville Utilities Board Wastewater Division Supplemental Information – Schedule of Current Rates in Force June 30, 2012 (Unaudited) Schedule 3
See accompanying Report of Independent Auditors on Supplemental Information.
44
5/8" meter 17.00$ 3/4" meter 25.00
1" meter 31.00 1 1/2" meter 42.00
2" meter 60.00 3" meter 104.00 4" meter 169.00 6" meter 360.00 8" meter 625.00
10" meter 947.00 12" meter 1,396.00
Additional Monthly Customer Charge
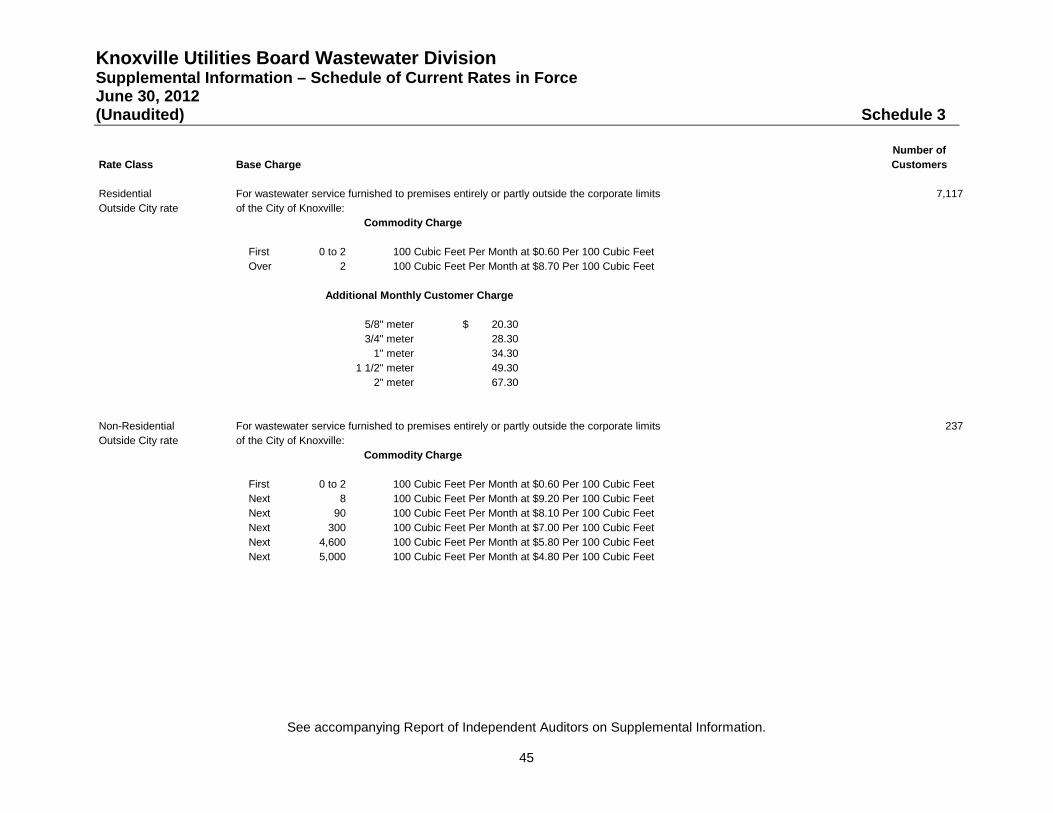
Knoxville Utilities Board Wastewater Division Supplemental Information – Schedule of Current Rates in Force June 30, 2012 (Unaudited) Schedule 3
See accompanying Report of Independent Auditors on Supplemental Information.
45
Number ofRate Class Base Charge Customers
Residential For wastewater service furnished to premises entirely or partly outside the corporate limits 7,117Outside City rate of the City of Knoxville:
First 0 to 2 100 Cubic Feet Per Month at $0.60 Per 100 Cubic FeetOver 2 100 Cubic Feet Per Month at $8.70 Per 100 Cubic Feet
5/8" meter 20.30$ 3/4" meter 28.30
1" meter 34.30 1 1/2" meter 49.30
2" meter 67.30
Non-Residential For wastewater service furnished to premises entirely or partly outside the corporate limits 237Outside City rate of the City of Knoxville:
First 0 to 2 100 Cubic Feet Per Month at $0.60 Per 100 Cubic FeetNext 8 100 Cubic Feet Per Month at $9.20 Per 100 Cubic FeetNext 90 100 Cubic Feet Per Month at $8.10 Per 100 Cubic FeetNext 300 100 Cubic Feet Per Month at $7.00 Per 100 Cubic FeetNext 4,600 100 Cubic Feet Per Month at $5.80 Per 100 Cubic FeetNext 5,000 100 Cubic Feet Per Month at $4.80 Per 100 Cubic Feet
Commodity Charge
Commodity Charge
Additional Monthly Customer Charge
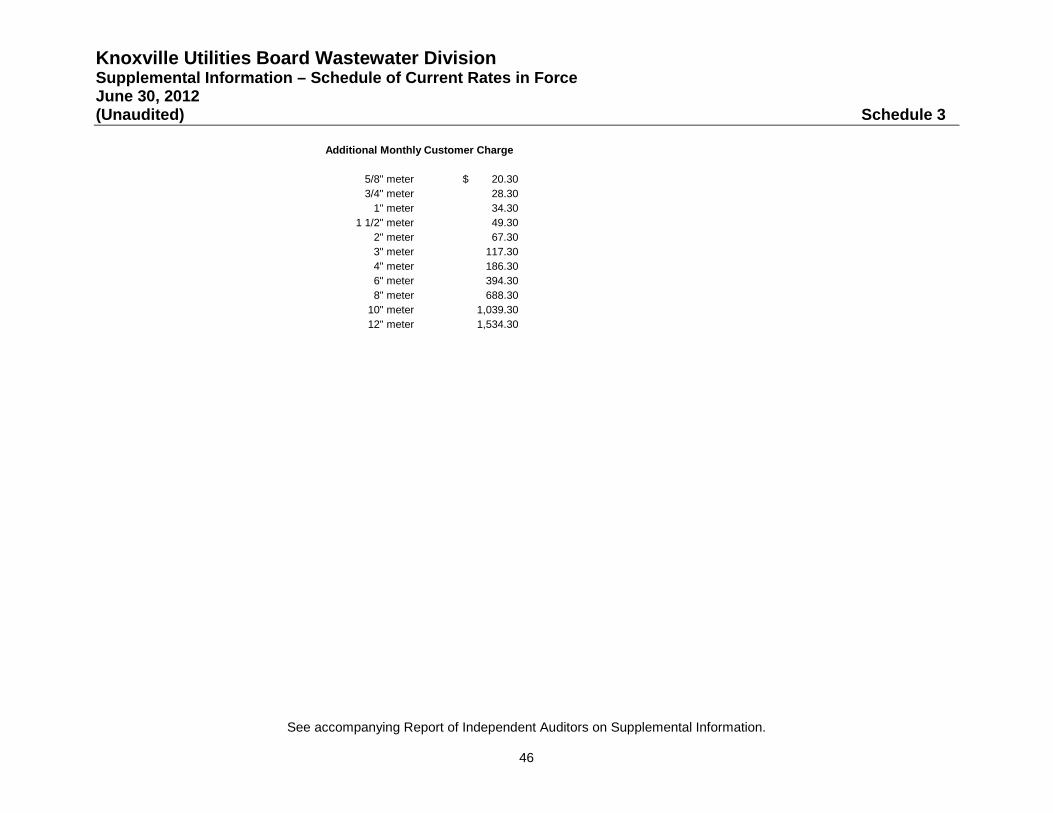
Knoxville Utilities Board Wastewater Division Supplemental Information – Schedule of Current Rates in Force June 30, 2012 (Unaudited) Schedule 3
See accompanying Report of Independent Auditors on Supplemental Information.
46
5/8" meter 20.30$ 3/4" meter 28.30
1" meter 34.30 1 1/2" meter 49.30
2" meter 67.30 3" meter 117.30 4" meter 186.30 6" meter 394.30 8" meter 688.30
10" meter 1,039.30 12" meter 1,534.30
Additional Monthly Customer Charge
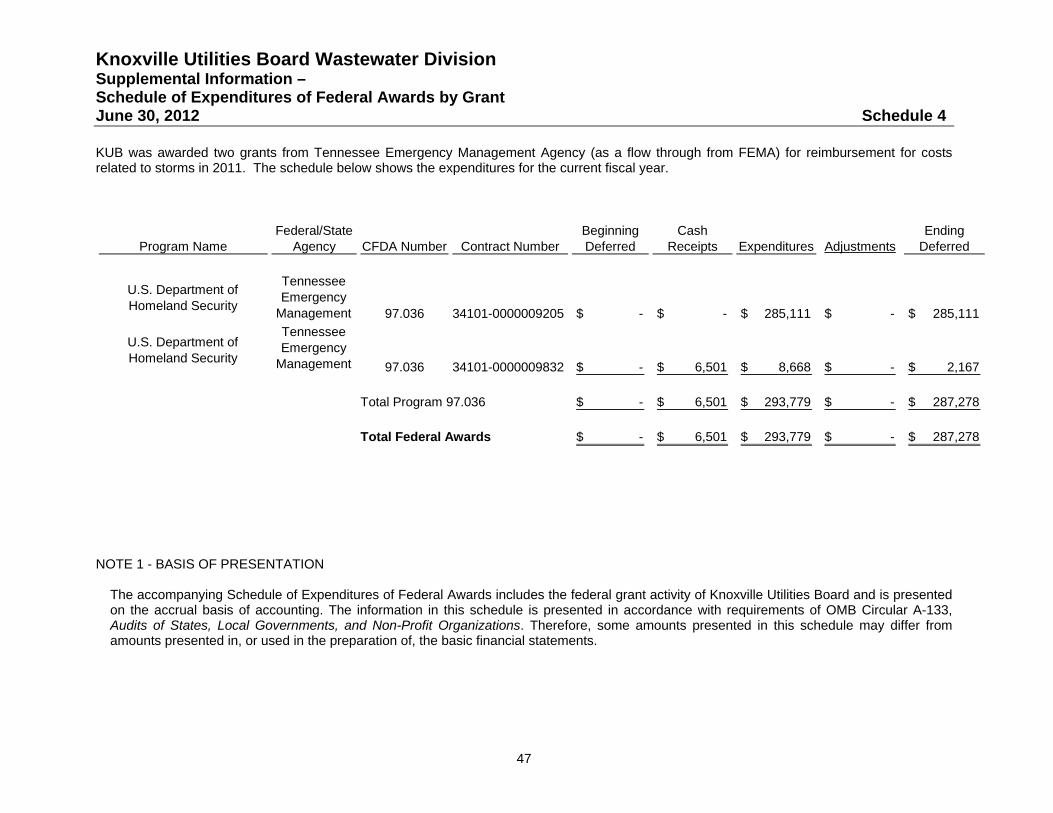
Knoxville Utilities Board Wastewater Division Supplemental Information – Schedule of Expenditures of Federal Awards by Grant June 30, 2012 Schedule 4
47
KUB was awarded two grants from Tennessee Emergency Management Agency (as a flow through from FEMA) for reimbursement for costs related to storms in 2011. The schedule below shows the expenditures for the current fiscal year.
Federal/State Beginning Cash EndingProgram Name Agency CFDA Number Contract Number Deferred Receipts Expenditures Adjustments Deferred
U.S. Department of Homeland Security
Tennessee Emergency
Management 97.036 34101-0000009205 -$ -$ 285,111$ -$ 285,111$
U.S. Department of Homeland Security
Tennessee Emergency
Management 97.036 34101-0000009832 -$ 6,501$ 8,668$ -$ 2,167$
Total Program 97.036 -$ 6,501$ 293,779$ -$ 287,278$
Total Federal Awards -$ 6,501$ 293,779$ -$ 287,278$
NOTE 1 - BASIS OF PRESENTATION
The accompanying Schedule of Expenditures of Federal Awards includes the federal grant activity of Knoxville Utilities Board and is presented on the accrual basis of accounting. The information in this schedule is presented in accordance with requirements of OMB Circular A-133, Audits of States, Local Governments, and Non-Profit Organizations. Therefore, some amounts presented in this schedule may differ from amounts presented in, or used in the preparation of, the basic financial statements.

Knoxville Utilities Board Wastewater Division Supplemental Information – Schedule of Findings and Questioned Costs June 30, 2012 Schedule 5
48
Summary of Audit Results Financial Statements Type of auditors report issued: Unqualified Internal control over financial reporting: Material weakness(es) identified? ___Yes No Significant deficiencies identified that are not considered to be material weakness(es)? ___Yes None reported Noncompliance material to financial statements noted? ___Yes No Federal Awards Internal control over major programs: Material weakness(es) identified? ___Yes No Significant deficiencies identified that are not considered to be material weakness(es)? ___Yes None reported Type of auditor’s report issued on compliance for major programs: Unqualified Any audit findings disclosed that are required to be reported in Accordance with Section 510(a) of Circular A-133? ___Yes None reported Major programs: CFDA Number Name of Federal Program
97.036 U.S. Department of Homeland Security
Dollar threshold used to distinguish between type A And type B programs $300,000 Auditee qualified as low-risk auditee? ___Yes No Findings – Financial Statements Audit None Findings and Questioned Costs – Major Federal Award Programs Audit None