Knowledge Organiser Science Year 7
16
Knowledge Organiser Science Year 7 Name________________ Class _____ This contains all the key ideas and knowledge you’ll need for Year 7 Science. You can make additional notes on the pages to help you understand the Science. This knowledge organiser should be on your desk and used every lesson.
Transcript of Knowledge Organiser Science Year 7

Knowledge OrganiserScienceYear 7
Name________________ Class _____This contains all the key ideas and knowledge you’ll need for Year 7 Science.
You can make additional notes on the pages to help you understand the Science.
This knowledge organiser should be on your desk and used every lesson.

Explaining the properties of solids
Conservation of massThe particles stay the same when a substance changes state - only their closeness, arrangement or motion change. This means that the mass of the substance stays the same.
For example, 10 g of water boils to form 10 g of steam, or freezes to form 10 g of ice. This is called conservation of mass.
7CPParticles
Property Reason
Fixed shape & cannot flow
Particles cannot move from place to place
Cannot be compressed (squashed)
Particles are close together and have no space to move into
Property Reason
They flow and take the shape of their container
The particles can move around each other
They cannot be compressed (squashed)
The particles are close together and have no space to move into
Property Reason
They flow and completely fill their container
The particles can move quickly in all directions
They can be compressed (squashed)
The particles are far apart and have space to move into
Explaining the properties of liquids Explaining the properties of gases
melting Boiling (or evaporating)
CondensingFreezing
Gaining energy
Losing energy
Gaining energyLosing energy
Condensing Freezing
Description Gas to liquid Liquid to solid
Closeness of particles
Become much closer together
Stay close together
Arrangement of particles
Stay random Random to regular
Motion of particles
Stop moving quickly in all directions, and can only move around each other
Stop moving around each other, and only vibrate on the spot
Melting Evaporating or boiling
Description Solid to liquid Liquid to gas
Closeness of particles
Stay close together Become much further apart
Arrangement of particles
Regular to random Stay random
Motion of particles
Start to move around each other
Start to move quickly in all directions
DiffusionDiffusion is the movement of a substance from an area of high concentration to an area of low concentration.
Diffusion happens in liquids and gases because their particles move randomly from place to place.
Gas PressureWhen gas particles hit the walls of their
container, they cause pressure. The faster the particles move, the higher the gas pressure.
1

A pure substance contains only one type of particle. For example:• Pure iron contains only iron particles (called iron atoms);• Pure water contains only water particles (called water molecules);• Pure oxygen only contains oxygen particles (called oxygen molecules).
Chromatography is a method for separating dissolved substances from one another.
It works because some of the coloured substances dissolve better than others, so they travel further up the paper.
A pencil line is drawn, and spots of ink or dye are placed on it. There is a container of solvent (egwater or ethanol).
As the solvent continues to travel up the paper, the different coloured substances spread apart.
A chromatogram, the results of chromatography experiment.
Dissolving is one way to make a mixture. For example, when salt is stirred into water, the salt dissolves in the water to make salt solution.
In a solution:• the substance that dissolves is called the solute;• the substance that the solute dissolves in is called the solvent.
E.G In salt solution, salt is the solute and water is the solvent.When you can’t dissolve any more solute in a solvent, we say the solution is saturated.
Distillation is a method for separating the solvent from a solution.
For example, water can be separated from salt solution because water has a much lower boiling point than salt. When the solution is heated, the water evaporates. It is then cooled and condensed into a separate container. The salt does not evaporate and so it stays behind.
Evaporation is used to separate a soluble solid from a liquid.
For example, copper sulphate is soluble in water –its crystals dissolve in water to form copper sulphate solution.
During evaporation, the water evaporates away leaving solid copper sulphate crystals behind.
Filtration is a method for separating an insolublesolid from a liquid.
When a mixture of sand and water is filtered:• the sand stays behind in the filter paper (it
becomes the residue);• the water passes through the filter paper (it
becomes the filtrate).
A mixture contains more than one type of particle that are not chemically joined together.For example:• Steel contains iron particles and small amounts of carbon particles (called carbon atoms);• Tap water contains water particles and small amounts of other particles (called ions);• Air contains 21% oxygen, 78% nitrogen and 1% of other gases (eg argon and carbon dioxide).
7CP Particles
We can separate mixtures in different ways depending on their properties:
• Filtration• Evaporation• Chromatography• Distillation
2
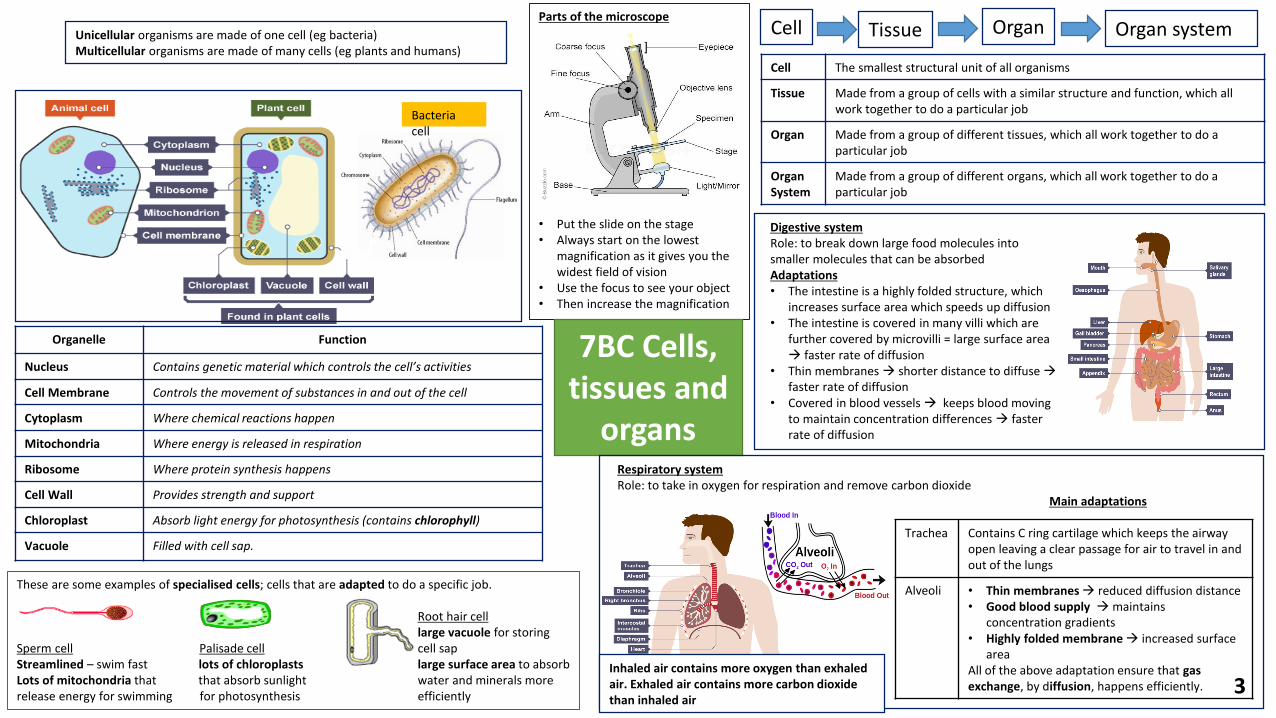
Parts of the microscope
• Put the slide on the stage• Always start on the lowest
magnification as it gives you the widest field of vision
• Use the focus to see your object • Then increase the magnification
Organelle Function
Nucleus Contains genetic material which controls the cell’s activities
Cell Membrane Controls the movement of substances in and out of the cell
Cytoplasm Where chemical reactions happen
Mitochondria Where energy is released in respiration
Ribosome Where protein synthesis happens
Cell Wall Provides strength and support
Chloroplast Absorb light energy for photosynthesis (contains chlorophyll)
Vacuole Filled with cell sap.
Cell The smallest structural unit of all organisms
Tissue Made from a group of cells with a similar structure and function, which all work together to do a particular job
Organ Made from a group of different tissues, which all work together to do a particular job
OrganSystem
Made from a group of different organs, which all work together to do a particular job
Unicellular organisms are made of one cell (eg bacteria)Multicellular organisms are made of many cells (eg plants and humans)
7BC Cells, tissues and
organs
These are some examples of specialised cells; cells that are adapted to do a specific job.
Root hair celllarge vacuole for storing
Sperm cell Palisade cell cell sapStreamlined – swim fast lots of chloroplasts large surface area to absorbLots of mitochondria that that absorb sunlight water and minerals more release energy for swimming for photosynthesis efficiently
Digestive systemRole: to break down large food molecules into smaller molecules that can be absorbedAdaptations• The intestine is a highly folded structure, which
increases surface area which speeds up diffusion• The intestine is covered in many villi which are
further covered by microvilli = large surface area → faster rate of diffusion
• Thin membranes → shorter distance to diffuse →faster rate of diffusion
• Covered in blood vessels → keeps blood moving to maintain concentration differences → faster rate of diffusion
Bacteria cell
Respiratory system Role: to take in oxygen for respiration and remove carbon dioxide
Main adaptations
Trachea Contains C ring cartilage which keeps the airway open leaving a clear passage for air to travel in and out of the lungs
Alveoli • Thin membranes → reduced diffusion distance• Good blood supply →maintains
concentration gradients• Highly folded membrane → increased surface
areaAll of the above adaptation ensure that gas exchange, by diffusion, happens efficiently.
Cell Tissue Organ Organ system
Inhaled air contains more oxygen than exhaled air. Exhaled air contains more carbon dioxide than inhaled air
3

Names for types of force:- Air resistance- Friction- Lift- Magnetic force- Normal contact- Tension- Thrust- Upthrust- Water resistance- Weight
7PF Forces & Motion Distance/Time Graphs
Forces are measured Newtons (N) using a Newton meter PressurePressure is a measure of how spread out a force is. We calculate it by using:
p = F/A
p= pressure (Pa or N/m2); F = Force (N); = Area (m2).
Mass, weight and gravityMass is a measure of how much matter an object is made up of. It is measured in kilograms(kg).
Weight is the force of gravity pulling on every kg of mass. It is measured in Newtons (N).We can calculate weight by using:
W = m x g
W = weight (N); m = mass (kg); g = gravitational field strength (N/kg)
Gravitational field strength of Earth is 10N/kg
Velocity and speedSpeed is a measure of how quickly an object travels a given distance.
We calculate speed by using:
Speed (m/s) = distance (m) / time (s)
Velocity is the same as speed, but tells us the direction we are travelling in as well (ie forwards or backwards).
How to present calculations in physics:1) Write down the values that you know;2) Identify the value that you are trying to work
out;3) Write down the formula that you will use;4) Substitute the known values into the
formula;5) Calculate your answer and write it down;6) Underline your answer;7) Include the correct unit.
Using forces to explain motion:1. Balanced forces acting on an object will cause it to stay
stationary or travel with constant speed2. Unbalanced forces acting on an object will cause it to
accelerate, decelerate or change direction
• d = 20m; t = 5s;
• v = ?;
• v = d/t
• v = 20/5
• v = 4 m/s
Force diagrams should always include three pieces of information about each force:1. Direction - Use arrows to state the direction of the
force;2. Size - The longer the arrow the bigger the force;3. Name - Label your force arrow with a name of the
force.
4
Conservation of mass
Total mass = Total massof reactants of products
We say that mass is conserved in a chemical reaction.
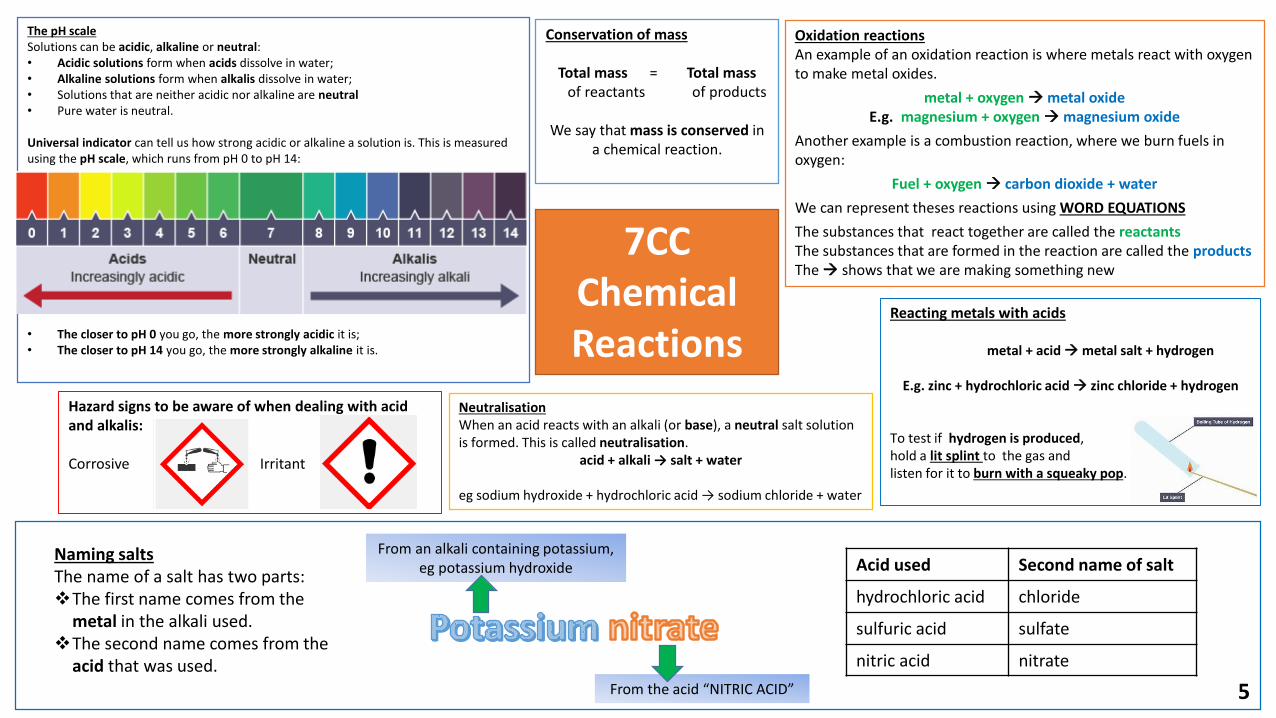
The pH scaleSolutions can be acidic, alkaline or neutral:• Acidic solutions form when acids dissolve in water;• Alkaline solutions form when alkalis dissolve in water;• Solutions that are neither acidic nor alkaline are neutral• Pure water is neutral.
Universal indicator can tell us how strong acidic or alkaline a solution is. This is measured using the pH scale, which runs from pH 0 to pH 14:
• The closer to pH 0 you go, the more strongly acidic it is;• The closer to pH 14 you go, the more strongly alkaline it is.
7CC Chemical Reactions
Neutralisation When an acid reacts with an alkali (or base), a neutral salt solution is formed. This is called neutralisation.
acid + alkali → salt + water
eg sodium hydroxide + hydrochloric acid → sodium chloride + water
Naming saltsThe name of a salt has two parts:❖The first name comes from the
metal in the alkali used.❖The second name comes from the
acid that was used.
Acid used Second name of salt
hydrochloric acid chloride
sulfuric acid sulfate
nitric acid nitrate
Oxidation reactionsAn example of an oxidation reaction is where metals react with oxygen to make metal oxides.
metal + oxygen →metal oxideE.g. magnesium + oxygen →magnesium oxide
Another example is a combustion reaction, where we burn fuels in oxygen:
Fuel + oxygen → carbon dioxide + water
We can represent theses reactions using WORD EQUATIONS
The substances that react together are called the reactantsThe substances that are formed in the reaction are called the productsThe → shows that we are making something new
Hazard signs to be aware of when dealing with acid and alkalis:
Corrosive Irritant
Reacting metals with acids
metal + acid →metal salt + hydrogen
E.g. zinc + hydrochloric acid → zinc chloride + hydrogen
To test if hydrogen is produced, hold a lit splint to the gas and listen for it to burn with a squeaky pop.
From an alkali containing potassium, eg potassium hydroxide
From the acid “NITRIC ACID” 5

Different energy stores:• Chemical;• Kinetic;• Gravitational potential;• Elastic potential;• Magnetic;• Electrostatic;• Internal (or thermal);• Nuclear
Heat transfer – there are three ways to transfer heat:1) Conduction – heat transfer in a solid;The solid particles are always vibrating. Heat makes the particles vibrate more. Because they are touching, the particles collide with the particles next to them with more energy, and this transfers the heat along. 2) Convection – heat transfer in fluids (liquids and gases);Particles in a fluid gain energy and move further apart. This makes the fluid less dense, causing it to rise. 3) Radiation – heat transfer via infra-red (thermal) radiation – can travel through a vacuum.
We can measure the amount of energy in a store
Units of energy:joules (J);kilojoules (kJ); kilowatt-hours (kWh).
Power is a measure of how fast energy is being transferred.
Units of power:watts (W);kilowatts (kW).
The energy laws:1) Energy can not be destroyed or created, only transferred - this is
called conservation of energy;2) Energy tends to spread out and become less useful (eg hot
objects always eventually cool down).
Renewable and non-renewable resources:1) Non-renewable energy resources cannot be replaced once they are all used up;
• Fossil fuels (coal, oil, gas)- releases carbon dioxide (a greenhouse gas and increases global warming). - releases sulphur dioxide and nitrogen oxides, which cause acid rain
• Nuclear+ nuclear fuels do not produce carbon dioxide or sulphur dioxide;- non-renewable energy resources. They will run out one day;- risk of radioactive material being released into the environment
2) Renewable energy resources can be replaced, and will not run out;• Wind
+ no release of carbon dioxide or sulphur dioxide- if there is no wind, there is no electricity.
• Water (wave, tidal or hydroelectric)+ noif there is no wind, there is no electricity.release of carbon dioxide or sulphur dioxide
- difficult for wave machines to produce large amounts of electricity.- tidal barrages destroy the habitats;- hydroelectric floods farmland and push people from their homes.
• Geothermal+ no release of carbon dioxide or sulphur dioxide- most parts of the world do not have suitable areas for geothermal
• Solar+ no release of carbon dioxide or sulphur dioxide- if there is no sunlight, there is no electricity.
PathwaysThere are 4 main pathways by which energy can be transferred:• by mechanical work (a force causing an object to move);• by electrical work (when charges move due to a potential difference);• By heating (due to a difference in temperature);• By radiation (due to electromagnetic waves, eg light or to mechanical
waves, eg sound).
PowerPower is calculated by dividing energy transferred by time taken
P = E/t
P= :Power (W); E = energy (J); t = time (s)
Energy costs money.To work out how much it costs you need to know:
• the amount of units of energy used (in kWh notjoules);
• the cost per unit (1 unit is 1 kWh) – you will be told this
total cost (p) = number of kilowatt-hours (kWh) × cost per kilowatt-hour (p)
Efficiency (%) = Useful Energy Transferred (Joules) x 100 (%)
Total Energy Supplied (Joules)
Total energy before transfer = total energy after transfer
7PE EnergyEnergy supplied = useful energy + wasted energy
You can work out how many units something uses if you know its power (in kW) and how long you have used it for (in hours):
number of units of energy used (kWh) = power (kW) x time (s)
6

Testes - produces gametes (sex cells) called sperm; make male sex hormones.Glands - produce a fluid which is mixed with sperm. The mixture of sperm and fluid is called semen.Sperm ducts – takes the sperm from the testes to the penisUrethra – semen passes through here during ejaculation;Penis - passes urine out of the man's body; passes semen out of the man's body.
Fertilisation happens if the egg cell meets and joins with a sperm cell in the oviduct. The fertilised egg (zygote) attaches to the lining of the uterus.
The woman becomes pregnant, the lining of the uterus does not break down and menstruation does not happen
7BR Reproduction
Ovaries - contain hundreds of undeveloped female gametes (sex cells) called ova (egg cells). Oviducts – connect the ovary to the uterus; lined with cilia. Every month, an egg develops, becomes mature and is released from an ovary to the uterus;Uterus - a muscular bag with a soft lining; where a baby develops until birth;Cervix - a ring of muscle at the lower end of the uterus; keeps baby in place during pregnancy;Vagina - muscular tube leading from cervix to the outside of a woman's body. The penis goes into the vagina during sexual intercourse.
The menstrual cycle
The thickness of the uterus lining varies during the menstrual cycle.
The menstrual cycle lasts about 28 days, it stops while a woman is pregnant:
• Day 1, is when bleeding from the vagina begins, caused by the loss of the uterus lining, with a little blood. This is called menstruation or having a period.
• Day 5, the loss of blood stops. The uterus lining begins to re-grow; an egg cell starts to mature in one of the ovaries.
• Day 14, the mature egg cell is released from the ovary. This is called ovulation. The egg cell travels through the oviduct towards the uterus.
If the egg cell does not meet with a sperm cell in the oviduct, the lining of the uterus begins to break down and the cycle repeats.
Fertilisation → Zygote → Embryo → Foetus → Baby → Birth
A foetus develops in the uterusThe foetus relies on its mother for:• protection against bumps, and temperature changes;• oxygen for respiration;• nutrients (food and water).
The foetus also needs its waste substances removing.
The foetus is protected by the uterus and the amniotic fluid, a liquid contained in a bag called the amnion.
The placenta provides oxygen and nutrients, and removes waste (eg carbon dioxide). The umbilical cord joins the placenta to the foetus, and transfers substances between the two. 7
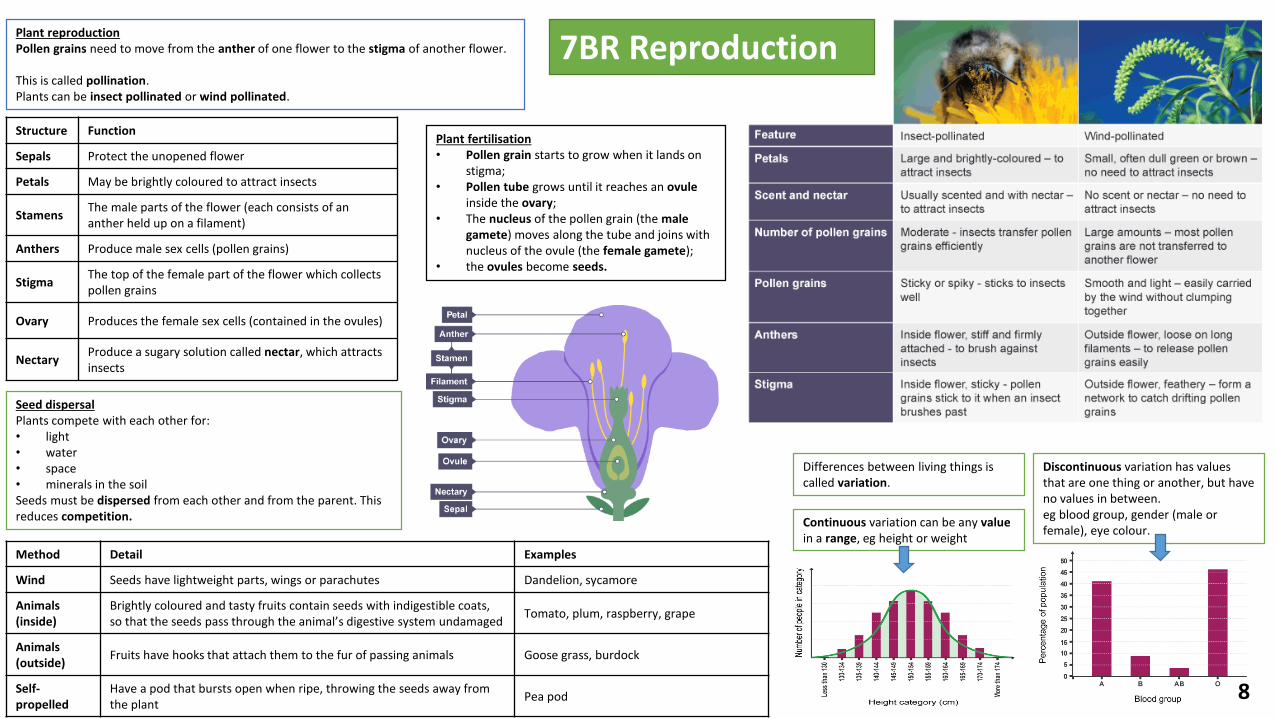
Plant reproductionPollen grains need to move from the anther of one flower to the stigma of another flower.
This is called pollination. Plants can be insect pollinated or wind pollinated.
Seed dispersalPlants compete with each other for:• light • water • space • minerals in the soil Seeds must be dispersed from each other and from the parent. This reduces competition. Continuous variation can be any value
in a range, eg height or weight
7BR Reproduction
Structure Function
Sepals Protect the unopened flower
Petals May be brightly coloured to attract insects
StamensThe male parts of the flower (each consists of an anther held up on a filament)
Anthers Produce male sex cells (pollen grains)
StigmaThe top of the female part of the flower which collects pollen grains
Ovary Produces the female sex cells (contained in the ovules)
NectaryProduce a sugary solution called nectar, which attracts insects
Plant fertilisation • Pollen grain starts to grow when it lands on
stigma;• Pollen tube grows until it reaches an ovule
inside the ovary;• The nucleus of the pollen grain (the male
gamete) moves along the tube and joins with nucleus of the ovule (the female gamete);
• the ovules become seeds.
Method Detail Examples
Wind Seeds have lightweight parts, wings or parachutes Dandelion, sycamore
Animals (inside)
Brightly coloured and tasty fruits contain seeds with indigestible coats, so that the seeds pass through the animal’s digestive system undamaged
Tomato, plum, raspberry, grape
Animals (outside)
Fruits have hooks that attach them to the fur of passing animals Goose grass, burdock
Self-propelled
Have a pod that bursts open when ripe, throwing the seeds away from the plant
Pea pod
Differences between living things is called variation.
Discontinuous variation has values that are one thing or another, but have no values in between.eg blood group, gender (male or female), eye colour.
8
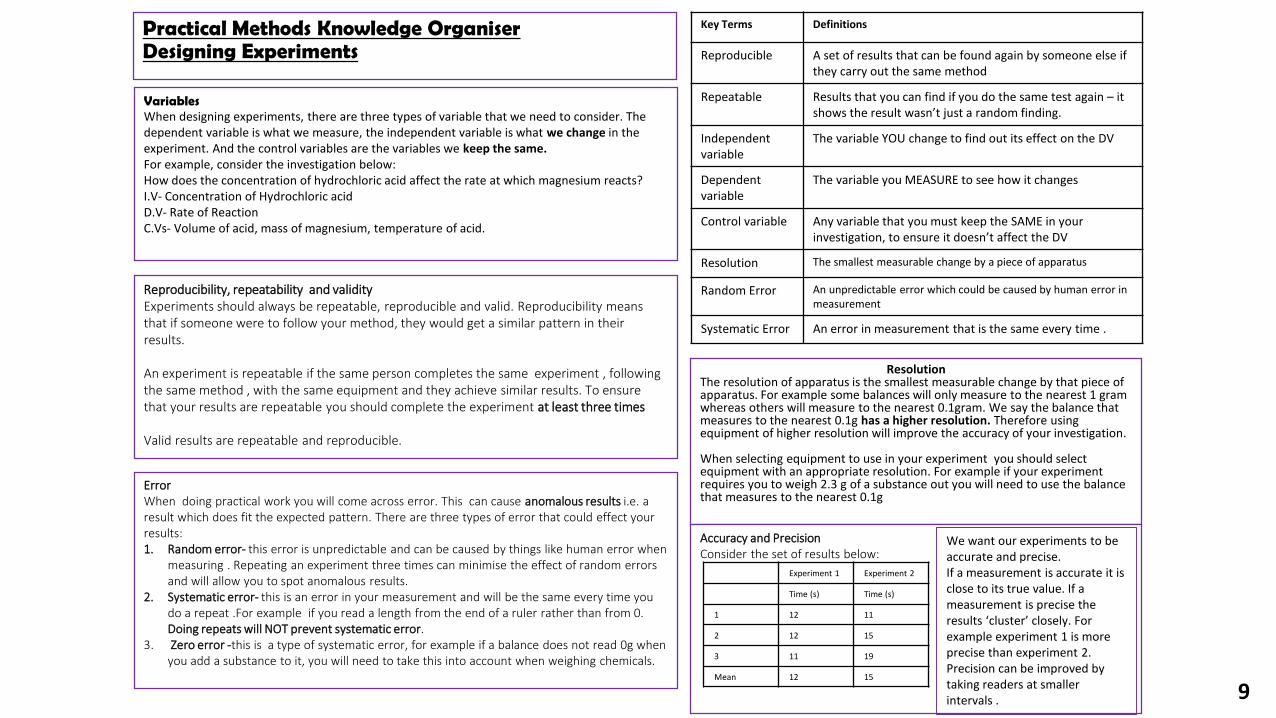
Practical Methods Knowledge OrganiserDesigning Experiments
Key Terms Definitions
Reproducible A set of results that can be found again by someone else if they carry out the same method
Repeatable Results that you can find if you do the same test again – it shows the result wasn’t just a random finding.
Independent variable
The variable YOU change to find out its effect on the DV
Dependent variable
The variable you MEASURE to see how it changes
Control variable Any variable that you must keep the SAME in your investigation, to ensure it doesn’t affect the DV
Resolution The smallest measurable change by a piece of apparatus
Random Error An unpredictable error which could be caused by human error in measurement
Systematic Error An error in measurement that is the same every time .
Reproducibility, repeatability and validityExperiments should always be repeatable, reproducible and valid. Reproducibility means that if someone were to follow your method, they would get a similar pattern in their results.
An experiment is repeatable if the same person completes the same experiment , following the same method , with the same equipment and they achieve similar results. To ensure that your results are repeatable you should complete the experiment at least three times
Valid results are repeatable and reproducible.
ErrorWhen doing practical work you will come across error. This can cause anomalous results i.e. a result which does fit the expected pattern. There are three types of error that could effect your results:1. Random error- this error is unpredictable and can be caused by things like human error when
measuring . Repeating an experiment three times can minimise the effect of random errors and will allow you to spot anomalous results.
2. Systematic error- this is an error in your measurement and will be the same every time you do a repeat .For example if you read a length from the end of a ruler rather than from 0. Doing repeats will NOT prevent systematic error.
3. Zero error -this is a type of systematic error, for example if a balance does not read 0g when you add a substance to it, you will need to take this into account when weighing chemicals.
VariablesWhen designing experiments, there are three types of variable that we need to consider. The dependent variable is what we measure, the independent variable is what we change in the experiment. And the control variables are the variables we keep the same.For example, consider the investigation below:How does the concentration of hydrochloric acid affect the rate at which magnesium reacts?I.V- Concentration of Hydrochloric acidD.V- Rate of ReactionC.Vs- Volume of acid, mass of magnesium, temperature of acid.
ResolutionThe resolution of apparatus is the smallest measurable change by that piece of apparatus. For example some balances will only measure to the nearest 1 gram whereas others will measure to the nearest 0.1gram. We say the balance that measures to the nearest 0.1g has a higher resolution. Therefore using equipment of higher resolution will improve the accuracy of your investigation.
When selecting equipment to use in your experiment you should select equipment with an appropriate resolution. For example if your experiment requires you to weigh 2.3 g of a substance out you will need to use the balance that measures to the nearest 0.1g
Accuracy and PrecisionConsider the set of results below:
Experiment 1 Experiment 2
Time (s) Time (s)
1 12 11
2 12 15
3 11 19
Mean 12 15
We want our experiments to be accurate and precise.If a measurement is accurate it is close to its true value. If a measurement is precise the results ‘cluster’ closely. For example experiment 1 is more precise than experiment 2. Precision can be improved by taking readers at smaller intervals . 9

Practical Methods Knowledge OrganiserProcessing Data – Tables and Averages
Key Terms Definitions
Uncertainty The amount of error your measurements might have
Mean The total of the values divided by the number of values
Median The middle value in a set of data
Mode The most commonly occurring value in a set of data
UncertaintyThere will always be some uncertainty in the results you collect, there are two main reasons for this.When you repeat an experiment you often get different results, this is due to random error. The resolution of your equipment will also cause uncertainty. There will therefore be a degree of uncertainty in your mean. For example take the two sets of results below:
We can calculate the uncertainty in the mean of the two experiments by dividing the range of results by 2:Experiment 1= 0.5/2= +/-0.25sExperiment 2= 4/2= +/-2s
Experiment 1 therefore is more precise than experiment 2. This is partly because they used a stopwatch with a higher resolution.
Increasing the quantity of something can help to reduce the uncertainty. For example in the table above, if I had used a larger piece of magnesium, then it would have taken longer to
disappear and this could reduce the percentage uncertainty.
Equation
Uncertainty=𝑅𝑎𝑛𝑔𝑒
2
Time for a piece of magnesium to disappear in 2M HCL (s)
1 2 3 Mean
Experiment 1 12.3 12.5 12.7 12.5
Experiment 2 13 15 17 15
Results TablesWhen drawing a results table the following things are good practice::1. Show all repeat measurements2. Include the units in the headings 3. When calculating means ensure you quote to an appropriate number of significant
figures4. Circle anomalies and discount these when calculating a meanFor example:
The table above shows how a results tables should be drawn. However, there is one mistake. If you look at the mean in the row for 0.3 M, you will see it has been calculated to 9 significant figures , however the equipment we used only had a resolution to 3 significant figures. You can not quote a mean to greater level of accuracy than you measured it to in the experiment. Therefore this mean would need to be rounded 66.9, this causes uncertainty in results. See later for how to calculate uncertainty.
Concentrationof acid (M)
Time taken for reaction to complete (s) Mean (s)
0.1 102.1 105.6 103.4 103.7
0.2 88.8 86.5 87.2 87.5
0.3 69.1 67.3 64.2 66.866667
0.4 56.2 40.1 53.3 54.8
0.5 32.1 30.1 33.2 31.8
Mean, mode and medianFor some sets of data it is appropriate to calculate the mean, mode and median.To calculate the mean you add all the values in the data and then divide by the number of values. For example in the table above for 0.1 M the mean was calculated by (102.1+105.6+103.4)/3.The mode is the most commonly occurring value in a data set.The median is the middle value in a data set.
10

Practical Methods Knowledge OrganiserProcessing Data – Types of Data and Correlation
Key Terms Definitions
Continuous Data which take any value for example temperature
Discontinuous Data which can only take certain values for example blood group
Correlation The relationship between 2 variablesContinuous vs Discontinuous dataDiscontinuous data can only take certain values for example eye colour and blood group, these should be plotted on a bar graph.
Continuous data can take any value ,for example height or temperature. This should be plotted on a line graph.
In an exam you will be expected to select and plot the correct graph as well as drawing a line of best fit (if it is a line graph). Your line should go through the middle of the points. It is very important to not that lines of best fit can be curves also. Any anomalies i.e points that are a long way from the line of best should be circled.
CorrelationYou can describe the relationship between 2 variables in terms of their correlation (how they are related to each other). There are three types of correlation :1. Positive correlation- as one variable increases so does the other one2. Negative correlation -as one variable increase the other decreases3. No correlation- there is no relationship between the variables
Correlation does not however mean causation. Just because two variables are linked does not mean that one variable causes the other . For example the number of pirates has decreased as global temperatures have increased. This does not mean that pirates were keeping the Earth cool! Just because data is correlated does not mean one variable caused the change in the other.
Correlation could also be down to:1. Chance
2. A third variable
You can only be sure one variable causes a change in another variable, if all the other possible variables are controlled. 11

Practical Methods Knowledge OrganiserProcessing Data - Graphs
Drawing good graphsThis is an excellent example of a good graph by a Nova student. When drawing a graph, you should plot the dependent variable on the y axis and independent variable on the x axis. To calculate the gradient you on a straight line need to select two points on the line and divide the change in y by the change in x. To calculate the gradient on a curve, you need to draw a tangent to the curve, see topic 15 knowledge organiser.
Labels for axes, with units given in brackets Neat, accurately
placed plots. Marked with a small x.
Both axes have suitable scales (equal intervals)
Anomaly recognised and highlighted on the graph
Accurate line of best fit, passing through most points, excluding anomalies. Remember this could be a curve of best fit if appropriate
Equation
Gradient=𝐶ℎ𝑎𝑛𝑔𝑒 𝑖𝑛 𝑦
𝐶 ℎ𝑎𝑛𝑔𝑒 𝑖𝑛 𝑥
12

13
Notes

14
Notes