Knowledge Graphs - Deloitte United StatesKnowledge Graphs can statistically analyze root causes by...
18
Wisdom of Enterprise Knowledge Graphs The path to collective intelligence within your company
Transcript of Knowledge Graphs - Deloitte United StatesKnowledge Graphs can statistically analyze root causes by...

Wisdom of Enterprise Knowledge Graphs The path to collective intelligence within your company
Wisdom of Enterprise Knowledge Graphs | The path to collective intelligence within your company
02
“ Intelligence is the ability to adapt to change.” Stephen Hawking

Wisdom of Enterprise Knowledge Graphs | The path to collective intelligence within your company
03
Preface 04
Use Cases 06
Impact analysis 06
AI-based decision-making 07
Product DNA and root-cause analysis 08
Intelligent data governance 09
Context based knowledge transformation 10
Leverage knowledge from external sources 11
What are Knowledge Graphs? 12
The foundation for Knowledge Graphs 14
Conclusion 15
Contact 16

Wisdom of Enterprise Knowledge Graphs | The path to collective intelligence within your company
04
Preface
Unleashing the power of knowledge is one of the most crucial tasks for enterprises striving to stay competitive. Knowledge, however, is not just data thrown into a database. It is a complex, dynamic model that puts every piece of information into a larger frame, builds a world around it and reveals its connections and meaning in a specific context.
In reality,a database can only accommo-date a small fraction of a company’s know-ledge, much less the combined knowledge of a group of experts. A lot of vital informa-tion is stored in unstructured documents, images and people’s minds.
For decades, companies have been trying to figure out an intelligent way to integrate all expert knowledge in one magic place, driven by a belief in the power concen-trated in the combined experience of thousands of employees.
Today, companies are relying more and more on artificial intelligence in their decision-making processes. Semantic AI enables machines to solve complex problems and explain to users how their recommendations were derived. It is the key to collective intelligence within a company – manifested in Knowledge Graphs.
That said, it is extremely time consuming to share your domain knowledge. First you have to structure and adapt the informa-tion to fit into a pre-defined data model.
Knowledge Graphs connect knowledge from different domains, data models and heterogeneous data formats without changing their initial form. They enable industrial enterprises to harness the poten-tial of collective intelligence.
By design, an Enterprise Knowledge Graph will easily connect all knowledge sources within a company, thereby enabling their AI technologies to go beyond conventional Machine Learning.
The search for information takes 14–30 percent of the engineers’ time.

Wisdom of Enterprise Knowledge Graphs | The path to collective intelligence within your company
05
Fig. 1 – Knowledge Graphs support highly complex decision-making by considering expert knowledge from different domains. Real world dependencies and cross-correlations are taken into account before recommendations are derived and explained to humans.
Which product variants are affected by new EU regulations?
What happened historically with price of this sub-part when the crude oil went up?
How could competitors disrupt our supply chain by buying up every producer of this chip?
Which parts produced by a (sub-sub-) supplier will be in short supply due to China's floods?

Wisdom of Enterprise Knowledge Graphs | The path to collective intelligence within your company
06
Use Cases
There are literally thousands of decisions being made across a company every day in areas like product modifications, production plans or the supply chain, but even small decisions can have huge con-sequences. Though science has effectively debunked the well-known butterfly effect, it is an undisputed fact that business deci-sions can have a far-reaching impact.
Our ability to grasp the range of risks arising from a decision may, however, be limited when we use an opportunistic mindset. It is much too complex for us to
imagine all of the possible future scenarios arising from every single factor across an enterprise in our intuitive risk calculations, and we may fail to take key issues into account in our decision-making.
An Enterprise Knowledge Graph can assess the far-reaching impacts of decisions and their consequences for any area of the company. It combines the human understanding of the real-world interde-pendencies with the power of computation. As a result, the system can detect cross correlations that humans cannot.
ExampleTo reduce internal friction in a com-bustion engine, the engineer reduces the surface roughness by 10 μm without realizing that the n-tier sup-plier does not have the machinery required to produce this tolerance. The result: a massive investment and a delayed start of production.
Using a Knowledge Graph to connect the engineering information with the manufacturing information across the value chain alerts companies to all possible risks arising from a change of tolerance particularly in terms of the supplier’s production capability. An AI-based analysis of internal and external sources can also assess the risk of sub-suppliers going out of business and how that would impact requirements. Even though this is common practice for OEMs – the only way to achieve truly exhaustive results is to make the connection with technical product information.
Fig. 2 – The Butterfly Effect after a seemingly small decision: Knowledge Graphs reveal the far-reaching consequences of a product change.
The Enterprise Knowledge Graphs reveal the far-reaching impacts of seemingly small decisions.
Impact analysis

Wisdom of Enterprise Knowledge Graphs | The path to collective intelligence within your company
07
Use Cases
Today’s companies are relying more and more on artificial intelligence in their decision-making process. Too often, these systems do not allow users to determine why the AI recommends a certain course of action – even though traceability can be essential for critical cases like product liability provided by the AI.
A Knowledge Graph is a new form of AI that allows us to answer the question "Why". It contains all of a company’s business logic and allows to question, backtrack and explain any recommendation proposed by the AI.
ExampleComplex mechatronic products such as cars, airplanes and engineering machinery. usually have a large number of variants. Each variant has its own set of configuration rules. In cars, for example, a single component can impact 90% of the other roughly 50,000 components on average. It takes tens of thousands of such configuration rules to map these relationships.
The components within the config-urations are described by a limited list of structured attributes. Human intelligence can associate thousands of partially unstructured pieces of context information on each part in terms of its function, geometry, logis-tics, quality and many more areas. This further increases the complexity of the product structure.
A knowledge-based representation of configuration rules allows us to automate our analysis of the consist-ency, completeness and redundancy within the configuration rule set. The system also automatically recom-mends how to resolve a conflict. As it is visualized in an intuitive graph, the information is easily accessible for human workers. Even unskilled users can trace back any recommendation to individual rules and conflicts. Being able to enrich the configuration knowledge with information about logistics, finance and production ena-bles AI powered systems to derive even more complex recommenda-tions, such as removing a configu-ration from the product portfolio or reorganising the assembly plan.
Fig. 3 – A knowledge-based representation of real-world interdependencies enables machines to solve complex problems and explain to users how it derived its recommendations.
Integration of all product data within a knowledge graph leads to process cost savings of up to 65 percent and enables managers to make well-founded decisions.
AI-based decision-making

Wisdom of Enterprise Knowledge Graphs | The path to collective intelligence within your company
08
The Enterprise Knowledge Graph not only connects information using enterprise business logic but also adds temporal con-text. Thus, any part, service, money trans-fer or test result can be traced back in time through the different versions, transforma-
tions and operations that caused them. We can create – in milliseconds – a complete DNA profile for any object that comprises all of the data associated with it throughout its lifecycle, including the resolution of the entire production structure.
ExampleWhere product failure is caused by a combination of ambient conditions, the batch of raw materials used or the supplier production site, a classic root-cause analysis can be very time consuming and may only produce limited results.
Knowledge Graphs can statistically analyze root causes by connecting data from different domains without creating a hypothesis in advance. The statistical analysis uses the intelli-gence within the Knowledge Graph to avoid spurious correlations.
Fig. 4 – Semantic root-cause analysis based on a Knowledge Graph.
WIthin seconds, we can resolve complex product structures that are configurable on many levels and compare different states.
Product DNA and root-cause analysis
Use Cases
Wisdom of Enterprise Knowledge Graphs | The path to collective intelligence within your company
09
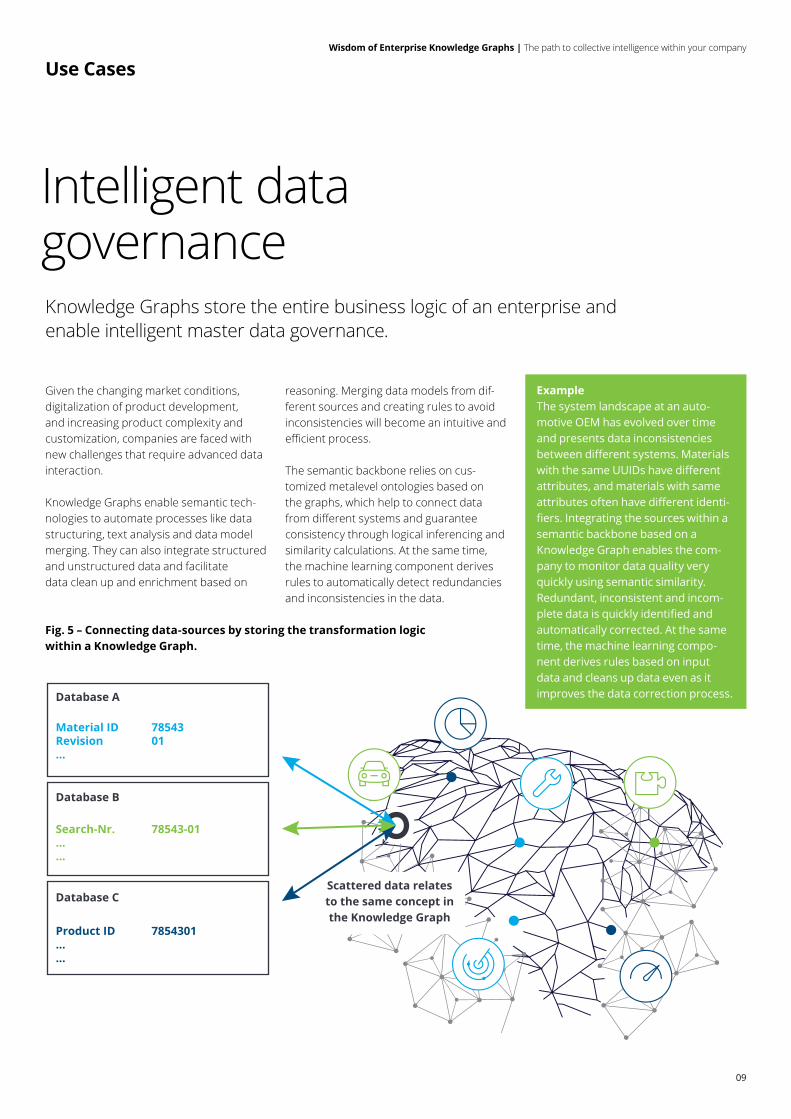
Given the changing market conditions, digitalization of product development, and increasing product complexity and customization, companies are faced with new challenges that require advanced data interaction.
Knowledge Graphs enable semantic tech-nologies to automate processes like data structuring, text analysis and data model merging. They can also integrate structured and unstructured data and facilitate data clean up and enrichment based on
reasoning. Merging data models from dif-ferent sources and creating rules to avoid inconsistencies will become an intuitive and efficient process.
The semantic backbone relies on cus-tomized metalevel ontologies based on the graphs, which help to connect data from different systems and guarantee consistency through logical inferencing and similarity calculations. At the same time, the machine learning component derives rules to automatically detect redundancies and inconsistencies in the data.
ExampleThe system landscape at an auto-motive OEM has evolved over time and presents data inconsistencies between different systems. Materials with the same UUIDs have different attributes, and materials with same attributes often have different identi-fiers. Integrating the sources within a semantic backbone based on a Knowledge Graph enables the com-pany to monitor data quality very quickly using semantic similarity. Redundant, inconsistent and incom-plete data is quickly identified and automatically corrected. At the same time, the machine learning compo-nent derives rules based on input data and cleans up data even as it improves the data correction process.
Fig. 5 – Connecting data-sources by storing the transformation logic within a Knowledge Graph.
Knowledge Graphs store the entire business logic of an enterprise and enable intelligent master data governance.
Intelligent data governance
Database A
Material ID 78543Revision 01…
Search-Nr. 78543-01……
Product ID 7854301……
Database C
Database B
Scattered data relatesto the same concept inthe Knowledge Graph
Use Cases

Wisdom of Enterprise Knowledge Graphs | The path to collective intelligence within your company
10
Information can only evolve into knowledge by adding context to it. The act of simply retrieving information on its own is basi-cally useless without a deep understanding of the context, which may vary strongly depending on what the information will ultimately be used for. A mechanical part is associated with, among other things, finan-
cial data, engineering data, manufacturing data and procurement data. Depending on their tasks, users access the same data with a different point of view that serves their respective purpose. Storing product structure data and transformation infor-mation within a Knowledge Graph allows the user to explore the database within the required context.
ExampleA very common example is the dif-ference between how engineers and manufacturing teams perceive the product structure. A Bill-Of-Materials (BOM) is a structured list of product assemblies, subassemblies, parts, etc. included in the product. The BOM can have different levels of maturity depending on when it is used during the product lifecycle (development, production, after-sales/maintenance). The engineering BOM (E-BOM) contains the hier-archical structure of a product as designed by the engineer. However, when drafting the E-BOM, engineers don’t factor in how and where the product will be manufactured. Depending on the component inter-faces specified in the CAD model, we can create a site-specific manufactur-ing BOM (M-BOM) for specific manu-facturing processes at the production site or the suppliers. This may entail replacing certain materials, restruc-turing the production process based on physical limitations or adding non-design items like oil or glue that are not mentioned in the E-BOM.
Fig. 6 – Context based views on data within the Knowledge Graph.
Knowledge Graphs automatically transform and represent knowledge in the required context for any user.
Context-based knowledge transformation
The Knowledge Graph can be regarded as a cloudof data points watched form different perspectives
und thus presenting the same object in different contexts.
As maintained
As designed
As built
Use Cases
Wisdom of Enterprise Knowledge Graphs | The path to collective intelligence within your company
11
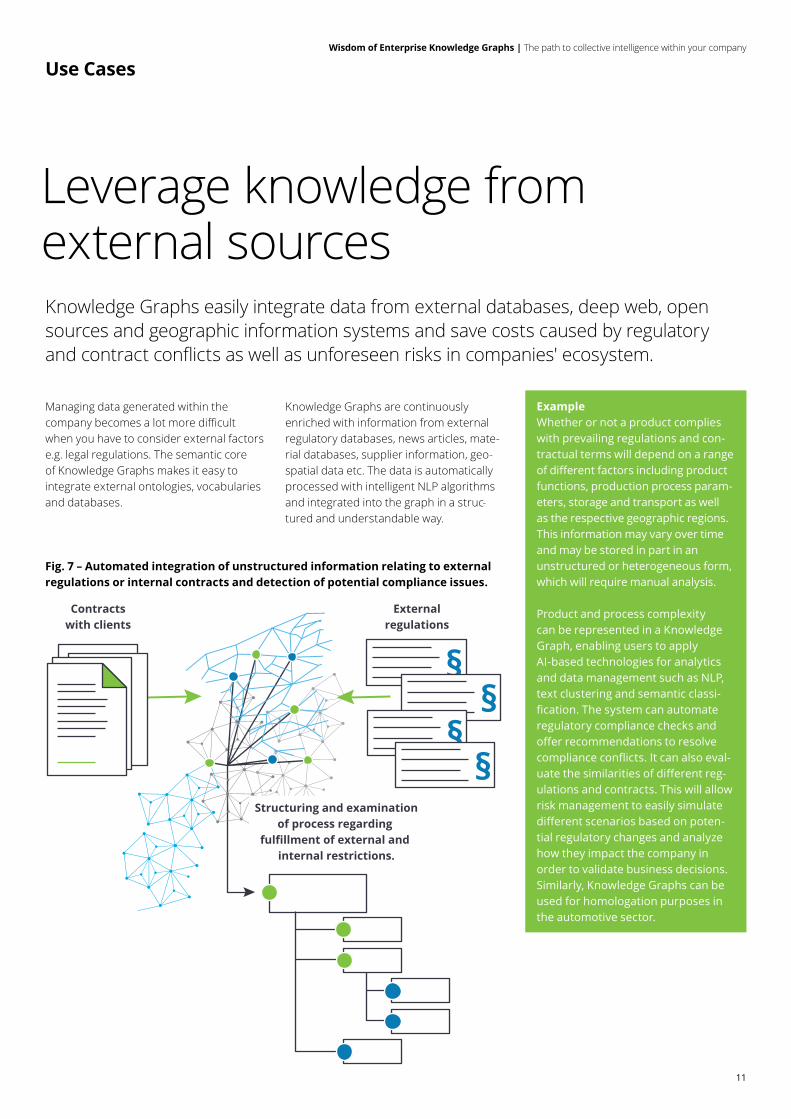
Managing data generated within the company becomes a lot more difficult when you have to consider external factors e.g. legal regulations. The semantic core of Knowledge Graphs makes it easy to integrate external ontologies, vocabularies and databases.
Knowledge Graphs are continuously enriched with information from external regulatory databases, news articles, mate-rial databases, supplier information, geo-spatial data etc. The data is automatically processed with intelligent NLP algorithms and integrated into the graph in a struc-tured and understandable way.
ExampleWhether or not a product complies with prevailing regulations and con-tractual terms will depend on a range of different factors including product functions, production process param-eters, storage and transport as well as the respective geographic regions. This information may vary over time and may be stored in part in an unstructured or heterogeneous form, which will require manual analysis.
Product and process complexity can be represented in a Knowledge Graph, enabling users to apply AI-based technologies for analytics and data management such as NLP, text clustering and semantic classi-fication. The system can automate regulatory compliance checks and offer recommendations to resolve compliance conflicts. It can also eval-uate the similarities of different reg-ulations and contracts. This will allow risk management to easily simulate different scenarios based on poten-tial regulatory changes and analyze how they impact the company in order to validate business decisions. Similarly, Knowledge Graphs can be used for homologation purposes in the automotive sector.
Fig. 7 – Automated integration of unstructured information relating to external regulations or internal contracts and detection of potential compliance issues.
Knowledge Graphs easily integrate data from external databases, deep web, open sources and geographic information systems and save costs caused by regulatory and contract conflicts as well as unforeseen risks in companies' ecosystem.
Leverage knowledge from external sources
Contractswith clients
Externalregulations
Structuring and examinationof process regarding
fulfillment of external and internal restrictions.
Use Cases

Wisdom of Enterprise Knowledge Graphs | The path to collective intelligence within your company
12
What are Knowledge Graphs?
Experiment: Think of something blue!You probably thought of the sky, a car, a shirt or some other object with the color blue that you have recently seen. You brain directly associates all of these things with the named color. It behaves like a graph, a network of entities where the entity “blue” clas-sified as a color is directly connected to cars and shirts that are blue. If our brain worked the same way a traditional relational database does, it would have to look at every item in the entire closet and check the value of the attribute “color”. Obviously, that would be a lot more time con-suming – both for our brains and for an enterprise database.
A Knowledge Graph combines sophisti-cated AI and graph technologies. It is a complex network that accesses data from databases, silos and unstructured sources, bringing it into context. A Knowledge Graph connects different domain knowledge models without altering them and evolves over time with no need to resstructure the models. A Knowledge Graph is able to store complex models and interdepend-encies that exist in the real world (process instructions of a chemical productions process, configuration rules of a complex mechatronic product, etc.).
A Knowledge Graph is a close-to-reality model that represents a company’s business logic and serves as its central knowledge platform. You could say it is the brain of a company, as its architecture is very similar to that of our brains – unlike traditional databases and data lakes. Both connect objects directly with each other rather than storing data in different tables and then connecting them via JOIN-tables.
Blue
Wisdom of Enterprise Knowledge Graphs | The path to collective intelligence within your company
13
Knowledge Graphs connect, structure and simplify knowledge within organizations, creating transparency by bridging data silos.
Wisdom of Enterprise Knowledge Graphs | The path to collective intelligence within your company
14
The foundation for Knowledge Graphs
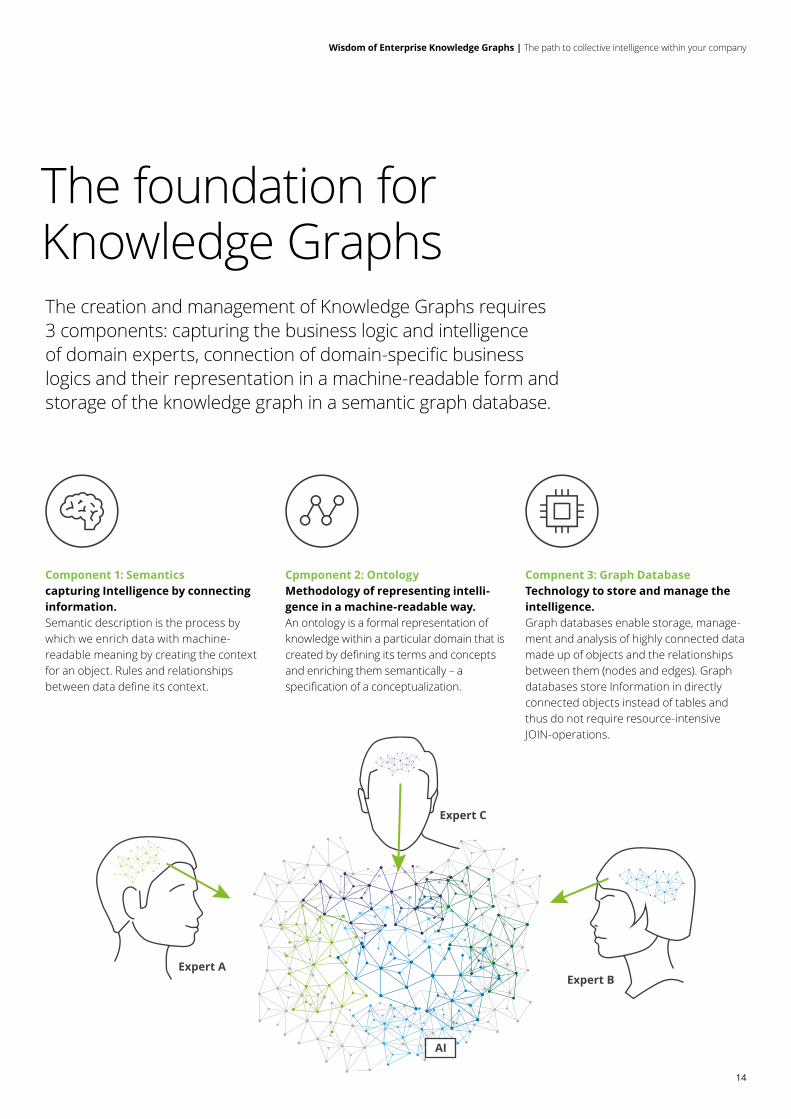
Compnent 3: Graph DatabaseTechnology to store and manage the intelligence.Graph databases enable storage, manage-ment and analysis of highly connected data made up of objects and the relationships between them (nodes and edges). Graph databases store Information in directly connected objects instead of tables and thus do not require resource-intensive JOIN-operations.
Component 1: Semanticscapturing Intelligence by connecting information. Semantic description is the process by which we enrich data with machine- readable meaning by creating the context for an object. Rules and relationships between data define its context.
Cpmponent 2: OntologyMethodology of representing intelli-gence in a machine-readable way. An ontology is a formal representation of knowledge within a particular domain that is created by defining its terms and concepts and enriching them semantically – a specification of a conceptualization.
Expert AExpert B
Expert C
AI
The creation and management of Knowledge Graphs requires 3 components: capturing the business logic and intelligence of domain experts, connection of domain-specific business logics and their representation in a machine-readable form and storage of the knowledge graph in a semantic graph database.

Wisdom of Enterprise Knowledge Graphs | The path to collective intelligence within your company
15
ConclusionKnowledge is every company’s most valuable asset, but it remains hard to grasp at the same time, because it is scattered across different systems and human minds. The key to integrating knowledge efficiently among systems and human users is to pro-vide representation in machine-readable form.
Creating a Knowledge Graph with seman-tic description of information context allows users to access a machine-readable representation of complex interdepend- encies that form a real-world model of the knowledge domain.
Knowledge Graphs integrate data across the whole enterprise, support complex decisions and reveal the origin of every correlation within milliseconds. It forms the foundation for AI technologies that are more intelligent than artificial.
The Enterprise Knowledge Graph is a close-to-reality data model that contains the business logic of an enterprise and is stored in a graph database.
Wisdom of Enterprise Knowledge Graphs | The path to collective intelligence within your company
16
Contact
Ulrich SchoofSenior Manager | Strategy & OperationsPhone: +49 (0)151 5807 0972 [email protected]
Philipp ObenlandDirector | Strategy & OperationsPhone: +49 (0)89 29036 [email protected]
Boris ShalumovSenior Consultant | Strategy & OperationsPhone: +49 (0)151 5807 [email protected]

Wisdom of Enterprise Knowledge Graphs | The path to collective intelligence within your company
17
Live Enterprise – a paradigm change for companies
Dynamic leadership based on real time data: this approach realizes the potential of new digital technologies.
Welcome in the Here and Now! Digitaliza-tion makes this possible. Today more and especially more actual data are available than ever before. Thus, companies are gaining more precise fundamentals for their actions.
They become a Live Enterprise: The Internet of Things is the new data supplier and allows the generation of consistent
data pools, which enable continuous eval-uations in near real time with innovative analytical methods and Machine Learning. The time lag between analyzing the cur-rent state and implementing it into con-crete action shrinks potentially towards zero. The result: Relevant data, adaptive processes, agile decision making – a new form of leadership. Live Enterprise is more than just an IT project.
This publication is one of our building blocks how to structure and connect data on the journey to a live enterprise.
Wisdom of Enterprise Knowledge Graphs | The path to collective intelligence within your company
18
This communication contains general information only not suitable for addressing the particular circumstances of any individual case and is not intended to be used as a basis for commercial decisions or decisions of any other kind. None of Deloitte Consulting GmbH or Deloitte Touche Tohmatsu Limited, its member firms, or their related entities (collectively, the “Deloitte network”) is, by means of this communication, rendering professional advice or services. No entity in the Deloitte network shall be responsible for any loss whatsoever sustained by any person who relies on this communication.
Deloitte refers to one or more of Deloitte Touche Tohmatsu Limited, a UK private company limited by guarantee (“DTTL”), its network of member firms, and their related entities. DTTL and each of its member firms are legally separate and independent entities. DTTL (also referred to as “Deloitte Global”) does not provide services to clients. Please see www.deloitte.com/de/UeberUns for a more detailed description of DTTL and its member firms.
Deloitte provides audit, risk advisory, tax, financial advisory and consulting services to public and private clients spanning multiple industries; legal advisory services in Germany are provided by Deloitte Legal. With a globally connected network of member firms in more than 150 countries, Deloitte brings world-class capabilities and high-quality service to clients, delivering the insights they need to address their most complex business challenges. Deloitte’s approximately 286,000 professionals are committed to making an impact that matters.
Issue 07/2019