KNOWING WHICH TYPE OF GRAPH TO USE IN RESEARCH A foolproof guide to selecting the right image to...
13
KNOWING WHICH TYPE OF GRAPH TO USE IN RESEARCH A foolproof guide to selecting the right image to convey your important message!
-
Upload
loren-thane -
Category
Documents
-
view
219 -
download
0
Transcript of KNOWING WHICH TYPE OF GRAPH TO USE IN RESEARCH A foolproof guide to selecting the right image to...
KNOWING WHICH TYPE OF GRAPH TO USE IN
RESEARCHA foolproof guide to selecting the right image to convey
your important message!
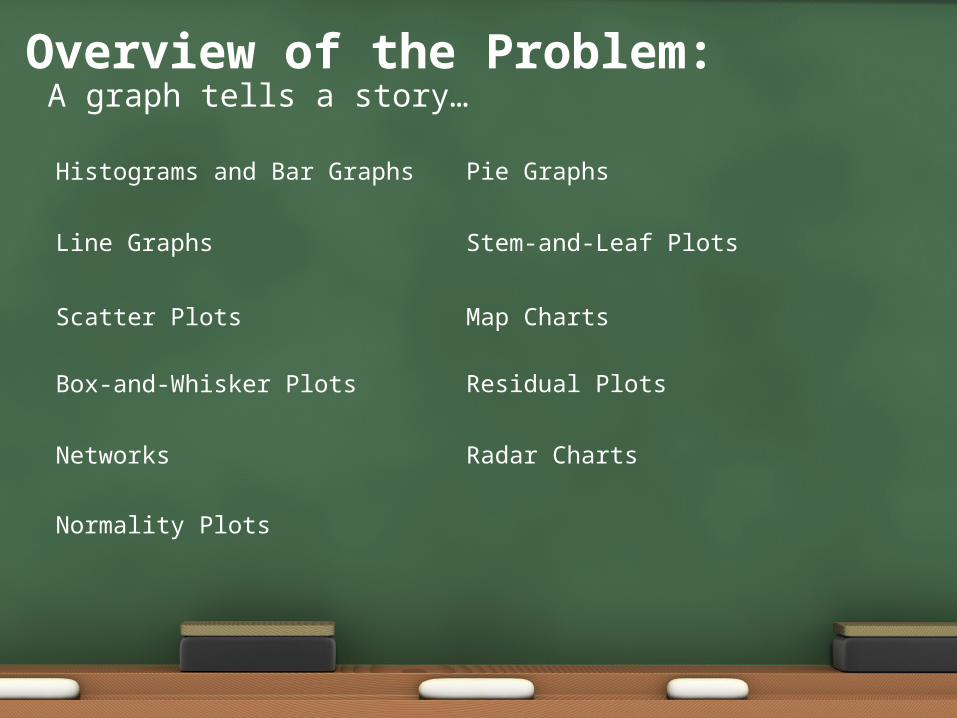
Overview of the Problem:A graph tells a story…
Scatter Plots
Histograms and Bar Graphs
Line Graphs
Box-and-Whisker Plots
Networks
Normality Plots
Residual Plots
Pie Graphs
Stem-and-Leaf Plots
Map Charts
Radar Charts
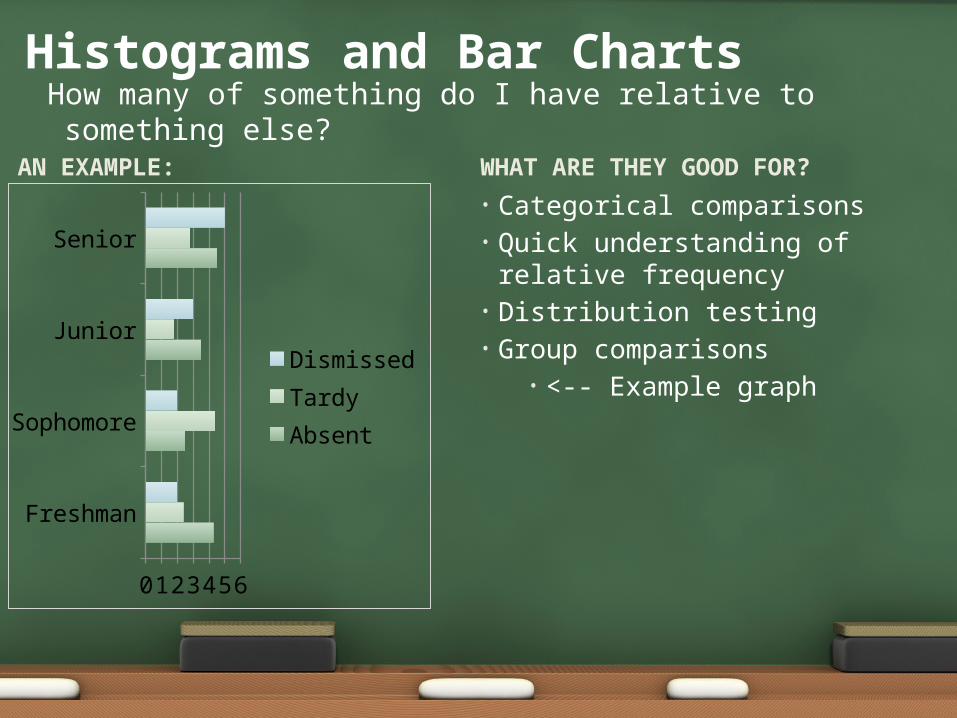
AN EXAMPLE:
Freshman
Sophomore
Junior
Senior
0 1 2 3 4 5 6
DismissedTardyAbsent
• Categorical comparisons• Quick understanding of
relative frequency• Distribution testing• Group comparisons
• <-- Example graph
WHAT ARE THEY GOOD FOR?
Histograms and Bar ChartsHow many of something do I have relative to something else?
AN EXAMPLE:
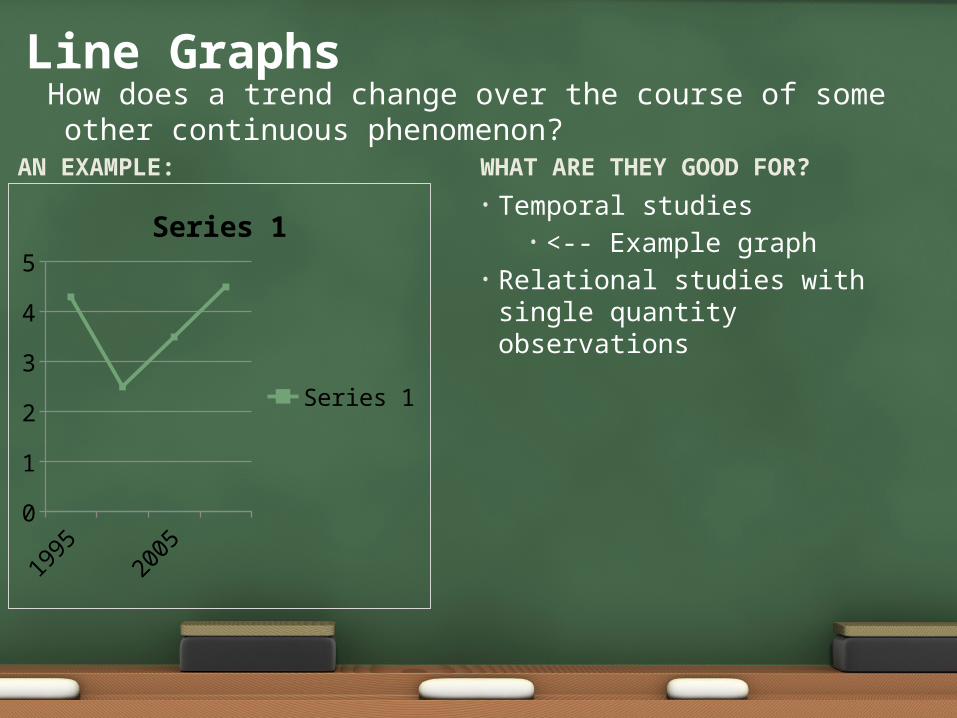
• Temporal studies• <-- Example graph
• Relational studies with single quantity observations
WHAT ARE THEY GOOD FOR?
Line GraphsHow does a trend change over the course of some other continuous phenomenon?
1995 2000 2005 20100
0.51
1.52
2.53
3.54
4.55
Series 1
Series 1
AN EXAMPLE:
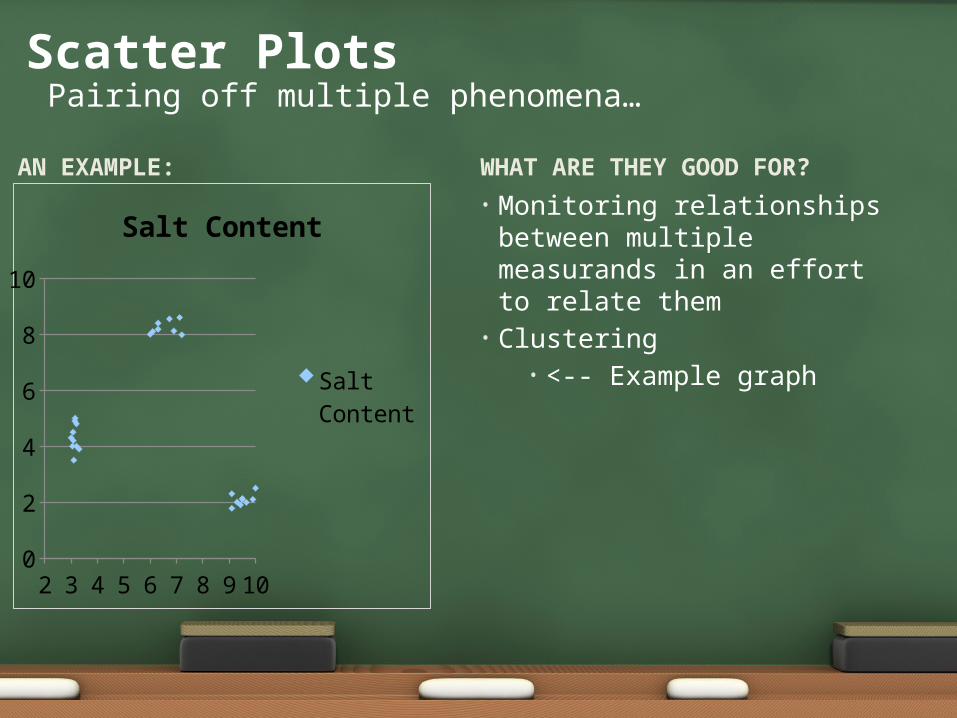
• Monitoring relationships between multiple measurands in an effort to relate them
• Clustering• <-- Example graph
WHAT ARE THEY GOOD FOR?
Scatter PlotsPairing off multiple phenomena…
2 3 4 5 6 7 8 9 100123456789
10
Salt Content
Salt Content
AN EXAMPLE:
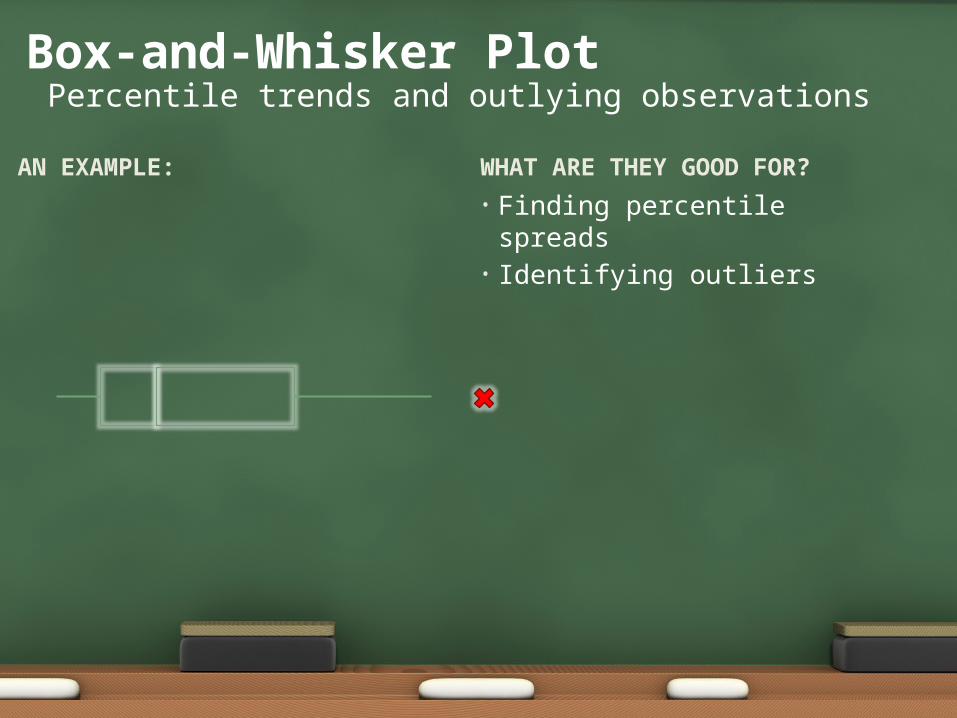
• Finding percentile spreads• Identifying outliers
WHAT ARE THEY GOOD FOR?
Box-and-Whisker PlotPercentile trends and outlying observations
AN EXAMPLE:
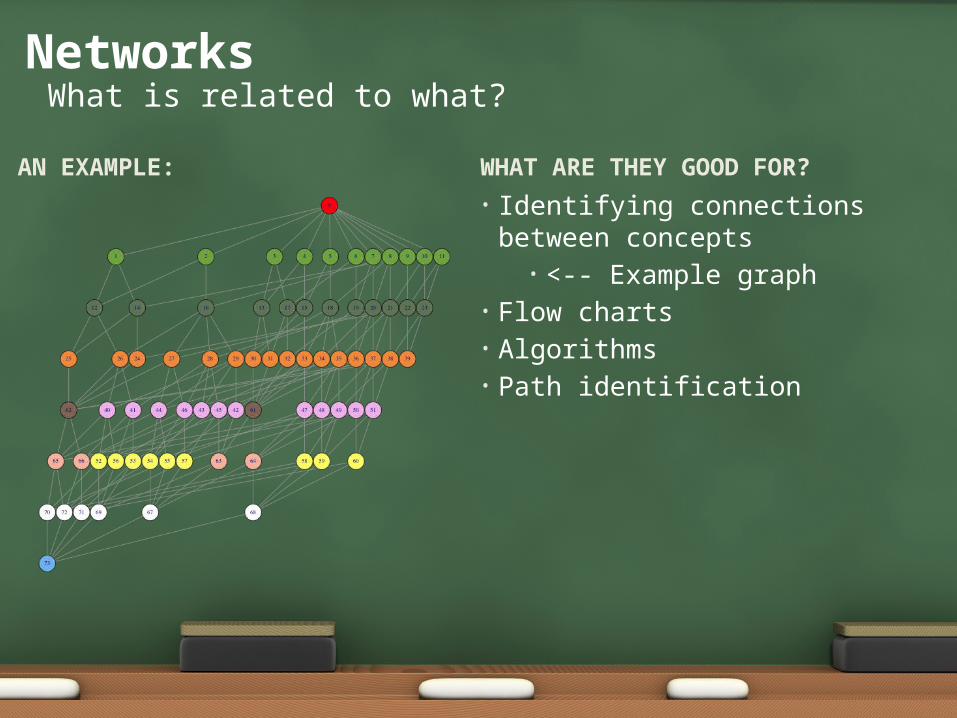
• Identifying connections between concepts
• <-- Example graph• Flow charts• Algorithms• Path identification
WHAT ARE THEY GOOD FOR?
NetworksWhat is related to what?
AN EXAMPLE:
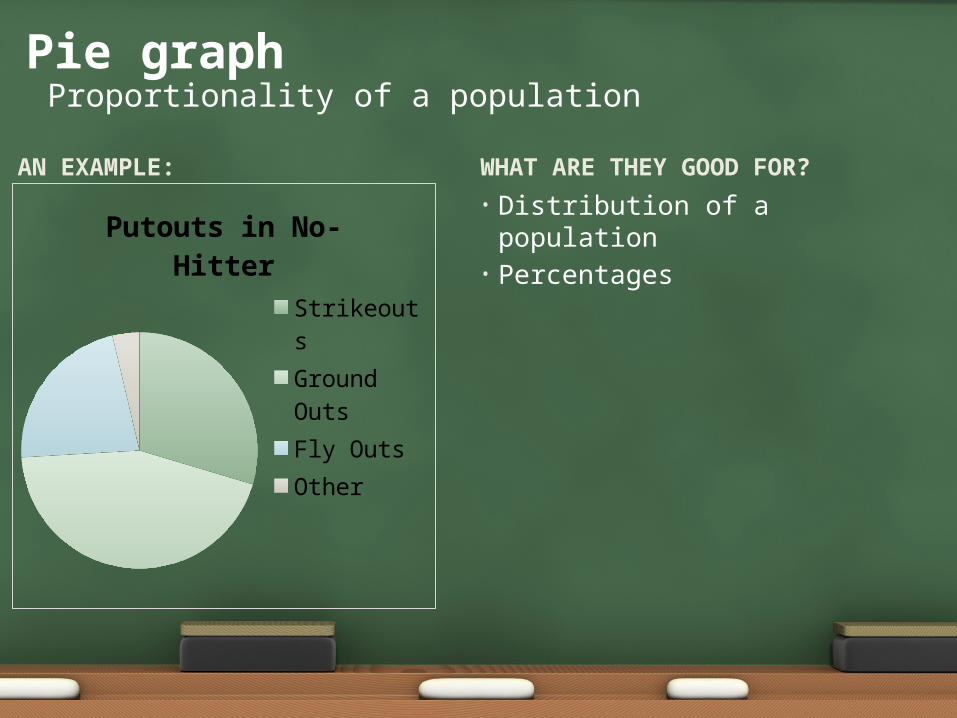
• Distribution of a population• Percentages
WHAT ARE THEY GOOD FOR?
Pie graphProportionality of a population
Putouts in No-Hitter
StrikeoutsGround OutsFly OutsOther
AN EXAMPLE:
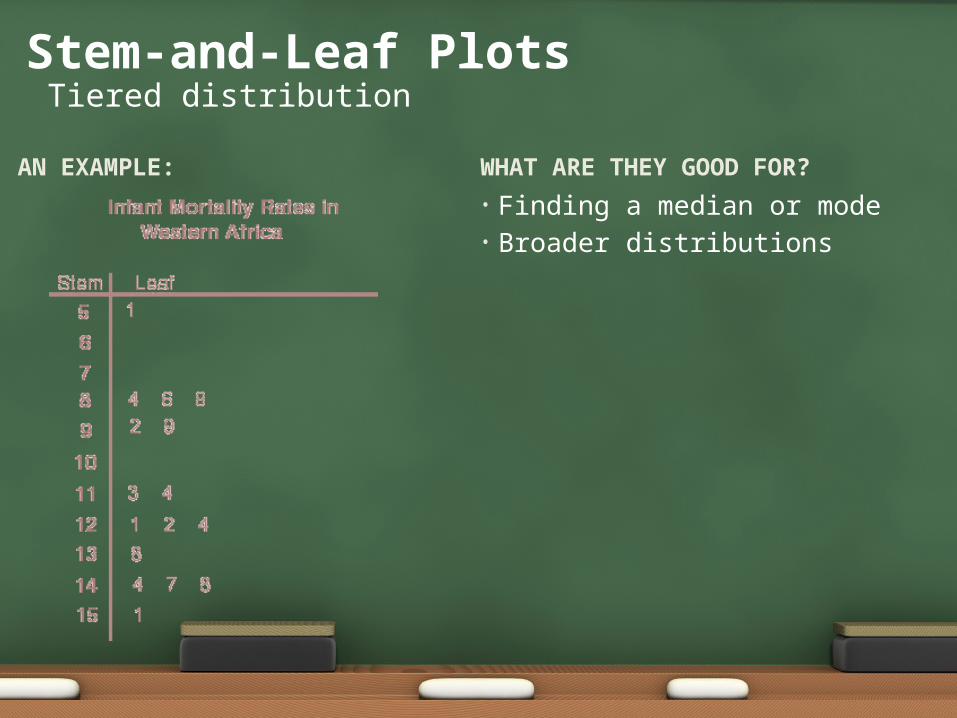
• Finding a median or mode• Broader distributions
WHAT ARE THEY GOOD FOR?
Stem-and-Leaf PlotsTiered distribution
AN EXAMPLE:
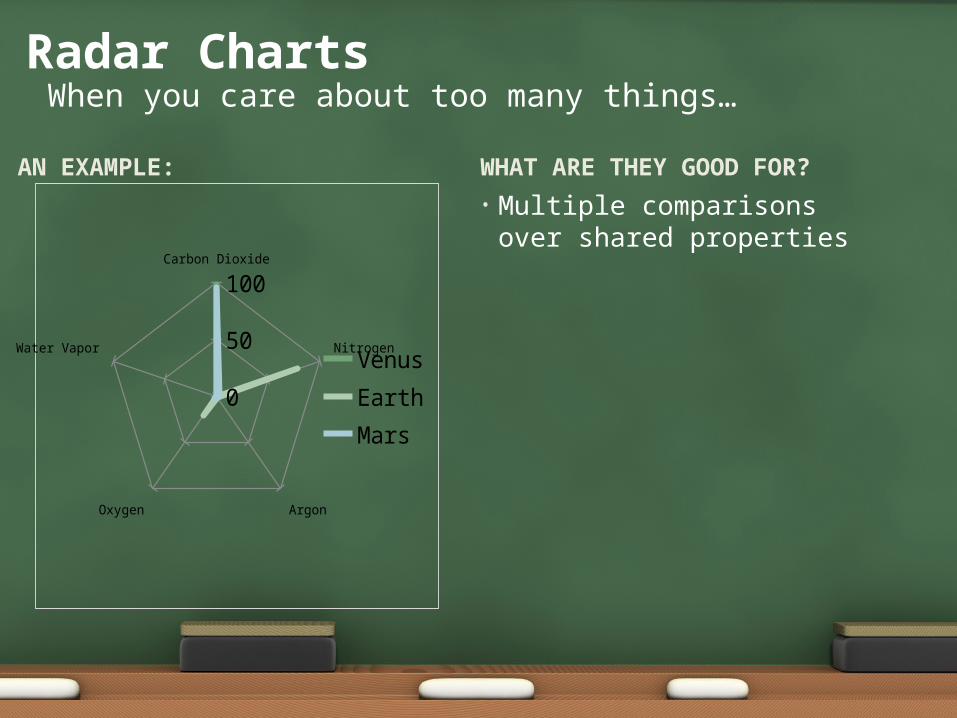
• Multiple comparisons over shared properties
WHAT ARE THEY GOOD FOR?
Radar ChartsWhen you care about too many things…
Carbon Dioxide
Nitrogen
ArgonOxygen
Water Vapor
0
50
100
VenusEarthMars
AN EXAMPLE:
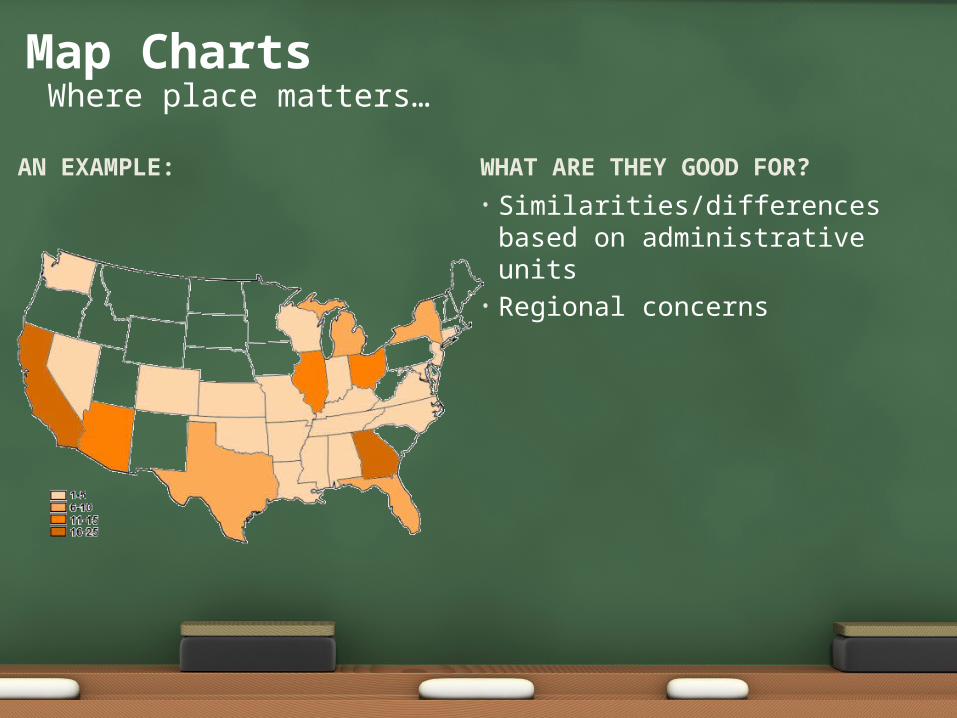
• Similarities/differences based on administrative units
• Regional concerns
WHAT ARE THEY GOOD FOR?
Map ChartsWhere place matters…
AN EXAMPLE:
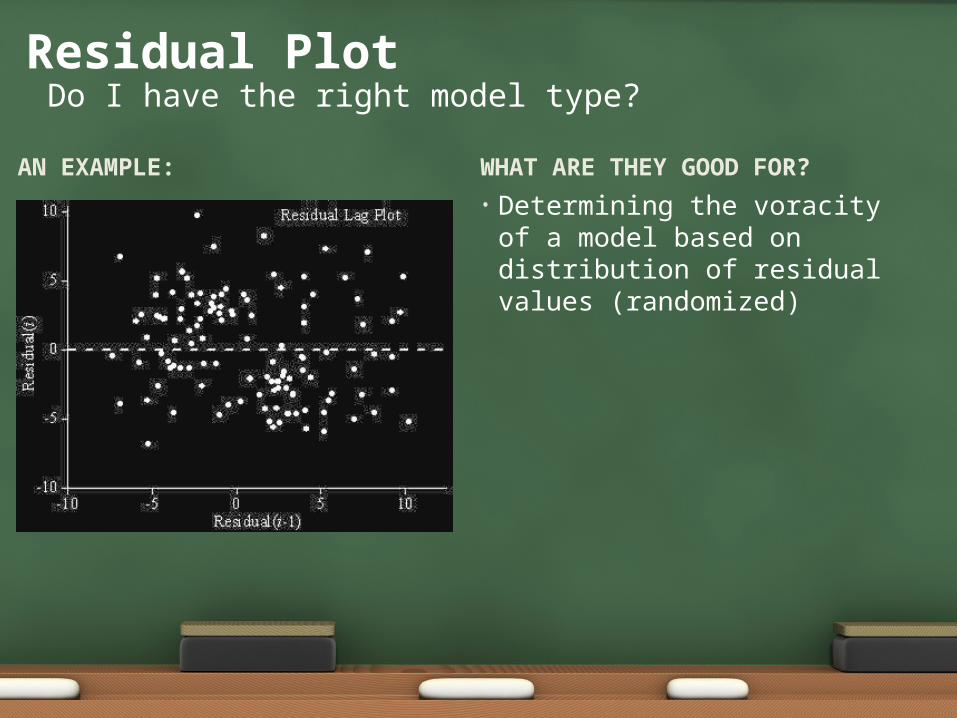
• Determining the voracity of a model based on distribution of residual values (randomized)
WHAT ARE THEY GOOD FOR?
Residual PlotDo I have the right model type?
AN EXAMPLE:
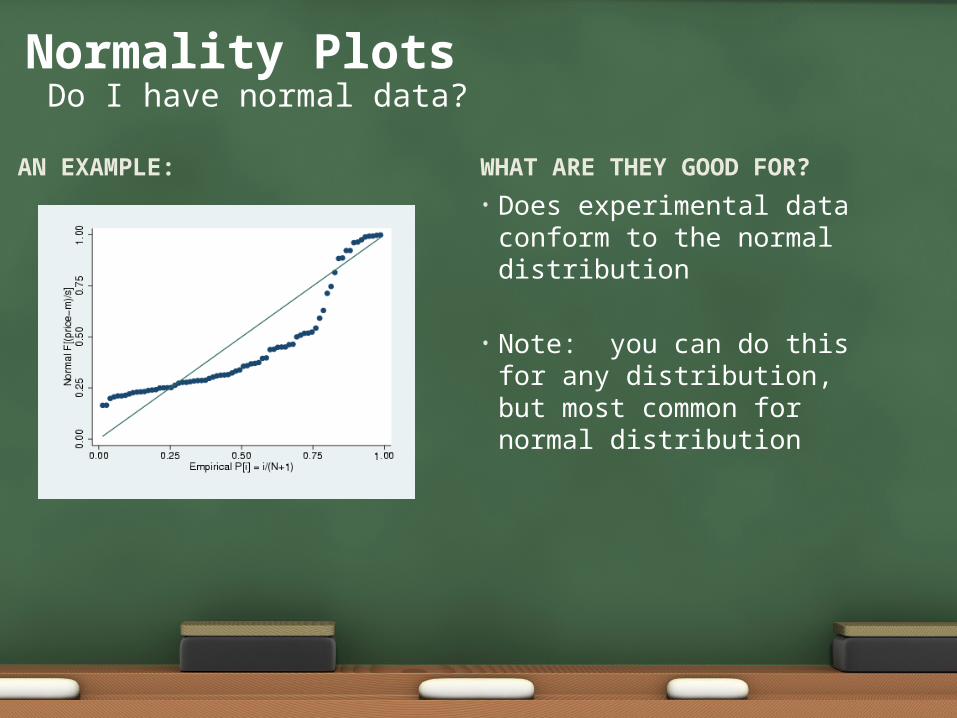
• Does experimental data conform to the normal distribution
• Note: you can do this for any distribution, but most common for normal distribution
WHAT ARE THEY GOOD FOR?
Normality PlotsDo I have normal data?