Know Your Mycotoxin Risk - Vinfeed€¦ · Mycotoxins Special Issue Mycotoxins A magazine of Latest...
12
Mycotoxins Special Issue Mycotoxins A magazine of Latest BIOMIN Mycotoxin Survey Results The Right Detection Tools Photo: ChuckieEgg Know Your Mycotoxin Risk
Transcript of Know Your Mycotoxin Risk - Vinfeed€¦ · Mycotoxins Special Issue Mycotoxins A magazine of Latest...
Myc
oto
xin
sSpecial Issue Mycotoxins
A magazine of
Latest BIOMIN Mycotoxin Survey Results
The Right Detection Tools
Pho
to: C
hu
ckie
Egg
Know YourMycotoxin Risk

Editorial
S c i e n c e & S o l u t i o n s • S p e c i a l I s s u e M T X
Know Your Mycotoxin Threat
Early in his entrepreneurial career, Erich Erber, founder of BIOMIN and Erber Group, noticed regional variation in customers’ experience with mycotoxins. He immediately recognized the implications for food, feed and livestock and set a course to address the issue. In 1988 BIOMIN began to build longstanding ties to the global research community to better understand and counteract mycotoxins. Research bore fruits. BIOMIN launched the mycotoxin deactivator Mycofix® in 1991. The first service lab in Austria came online in the late 1990s. The group’s acquisition of Romer Labs® in 1999 brought further expertise in analytical methods on a global scale. In 2004 the first annual BIOMIN Mycotoxin Survey report was published.
Now, looking back over more than 30 years, we have a much clearer picture of the extent and magnitude of the global mycotoxin problem. The companies of the Erber Group contribute to disseminating research through seminars, books and scientific papers and bring new technology to bear for clients in over 100 countries.
In this issue of Science & Solutions we detail the latest annual survey results and explore mycotoxin detection methods available to you. Decades of research, a track record of innovation and a strong commitment to clients by Erber Group companies come together to bring you the tools for cutting-edge mycotoxin risk management. It is a trail that we will continue to blaze far into the future.
Eva Maria BINDERChief Research Officer Erber Group

Science & Solutions is a monthly publication of BIOMIN Holding GmbH, distributedfree-of-charge to our customers and partners. Each issue of Science & Solutionspresents topics on the most current scientific insights in animal nutrition and health witha focus on one species (aquaculture, poultry, swine or ruminant) per issue.ISSN: 2309-5954
For a digital copy and details, visit: http://magazine.biomin.netFor article reprints or to subscribe to Science & Solutions, please contact us: [email protected]
Editor: Ryan HinesContributors: Eva Maria Binder, Philipp Gruber, Sabine Masching, Michele Muccio, Karin NährerMarketing: Herbert KneisslGraphics: Reinhold Gallbrunner, Michaela HössingerResearch: Franz Waxenecker, Ursula HofstetterPublisher: BIOMIN Holding GmbH Erber Campus, 3131 Getzersdorf, Austria Tel: +43 2782 8030 www.biomin.net
©Copyright 2016, BIOMIN Holding GmbHAll rights reserved. No part of this publication may be reproduced in any material form for commercial purposes without the written permission of the copyright holder except in accordance with the provisions of the Copyright, Designs and Patents Act 1998.
All photos herein are the property of BIOMIN Holding GmbH or used with license.Printed on eco-friendly paper: Austrian Ecolabel (Österreichisches Umweltzeichen)
Contents
A m a g a z i n e o f B I O M I N 1
2015 BIOMIN Mycotoxin Survey Results Latest findings from the most comprehensive and longest-running mycotoxin survey.
By Michele Muccio, MSc and Sabine Masching, MSc
2
6Find the Right Mycotoxin Testing ToolConsiderations to fit your situation.
By Philipp Gruber, DI
Pho
to: t
ypss
iao
d

2 S c i e n c e & S o l u t i o n s • S p e c i a l I s s u e M T X
By Michele Muccio and Sabine Masching, Mycotoxin Risk Management Product Managers
The latest edition of the annual survey, covering 8271 agricultural commodity samples from 75 countries with over 31000 analyses, highlights the main dangers from the most important mycotoxins in primary feedstuffs and their potential risk to livestock animal production.
2015 BIOMIN Mycot oxin Survey Results
No
rth
Am
eric
a
Afla 2%ZEN 30%DON 67%T-2 3%FUM 39%OTA 2%
Afla 18%ZEN 34%DON 32%T-2 11%FUM 70%OTA 4%So
uth
Am
eric
a
Afla 2%ZEN 75%DON 84%T-2 57%FUM 52%OTA 13%C
entr
al E
uro
pe
Afla 20%ZEN 61%DON 66%T-2 19%FUM 72%OTA 35%So
uth
ern
Eu
rop
e
Afla 33%ZEN 91%DON 56%T-2 24%FUM 88%OTA 2%A
fric
a
Afla 0%ZEN 27%DON 76%T-2 38%FUM 23%OTA 4%N
ort
her
n E
uro
pe
Afla 18%ZEN 54%DON 53%T-2 8%FUM 84%OTA 62%M
idd
le E
ast
Afla 6%ZEN 94%DON 86%T-2 0%FUM 76%OTA 0%So
uth
Afr
ica
The survey results provide an insight on the incidence of aflatoxins (Afla), zearalenone (ZEN), deoxynivalenol (DON), T-2 toxin (T-2), fumonisins (FUM) and ochratoxin A (OTA) in the primary components used
for feed which include corn (maize), wheat, barley, rice, soybean meal, corn gluten meal, dried distillers grains (DDGS) and silage, among others.
Risk levelsBecause of the powerful sensitivity of state-of-
the-art detection tools (e.g. using LC-MS/MS based
Afla 0%ZEN 14%DON 100%T-2 0%FUM 76%OTA 76%C
entr
al A
mer
ica

A m a g a z i n e o f B I O M I N 3
2015 BIOMIN Mycot oxin Survey Results
Afla 97%ZEN 24%DON 20%T-2 1%FUM 90%OTA 81%So
uth
Asi
a
Afla 35%ZEN 27%DON 24%T-2 1%FUM 40%OTA 11%O
cean
iaAfla 24%ZEN 39%DON 51%T-2 33%FUM 32%OTA 55%Ea
ster
n E
uro
pe
Afla 13%ZEN 59%DON 88%T-2 3%FUM 65%OTA 18%N
ort
h A
sia
Afla 47%ZEN 63%DON 60%T-2 1%FUM 83%OTA 16%So
uth
-Eas
t A
sia
multi-mycotoxin analysis Spectrum 380®, it is no longer sufficient to talk about the mere presence of mycotoxins; concentration levels must be considered. Consequently, the latest results feature a mycotoxin risk map based upon both the presence of mycotoxins and their potential harm to livestock depending on concen-tration levels associated with known health risks.
Figure 1 shows mycotoxin occurrence data for each region as a percentage of all samples tested. The overall risk level for a particular region (indicated by color according to legend) is determined by the number of single mycotoxins with average contamination levels measured in parts per billion (ppb) which exceed the maximum risk threshold levels for livestock.
The risk thresholds are based on worldwide practical experience in the field and in scientific trials that were conducted to reflect as closely as possible field situations and take into account the most sensitive species for each mycotoxin.
The average risk levels used as a basis do not preclude specific, severe instances of mycotoxin contamination in farm or fields locally, nor do they account for the negative impacts of multiple mycotoxin presence.
Squares indicate the percentage of analyzed samples contaminated by mycotoxins per region. Risk was calculated per region on the number of different average values of mycotoxin contamination above threshold. Colors indicate different risk levels according to the legend below.
Recommended risk threshold of major mycotoxins in ppb
Afla ZEN DON T-2 FUM OTA
2 50 150 50 500 10
Legend
n Moderate risk = 1 or 2 mycotoxins above recommended thresholds
n High risk = 3 or 4 mycotoxins above recommended thresholds
n Severe risk = 5 or 6 mycotoxins above recommended thresholds
n No samples tested
Figure 1. Global map of mycotoxin occurrence and risk in different regions.

4 S c i e n c e & S o l u t i o n s • S p e c i a l I s s u e M T X
Low risk indicates that average levels of single mycotoxin presence for a given zone do not exceed minimum recommended thresholds for livestock. Moderate risk indicates the presence of one to two major mycotoxins at levels known to cause harm in animals. High risk indicates the presence of three to four major mycotoxins at levels known to cause harm in animals. Severe risk indicates the presence of five or more major mycotoxins at levels known to cause harm in animals.
The mycotoxin risk map relies upon single myco -toxin occurrence which may understate the threat posed by mycotoxins to animals given their known synergistic effects (the presence of multiple mycotoxins compounds the potential harm) and subclinical effects (even low levels of mycotoxin contamination can impair animal health and performance).
Regional insightsNorth America and North Asia faces the most
severe threat of mycotoxin-related risks to livestock. Both regions registered at least five major mycotoxins at average concentration levels above risk threshold levels.
Table 1 provides an overview on the number of samples tested, occurrence, average contamination levels and maximum contamination values. Fumonisins and deoxynivalenol are the top threats in all regions except for Africa where zearalenone constitutes the major threat to livestock.
EuropeEurope ranked as a high risk region, with 4 myco-
toxins at average concentrations above risk threshold levels. Samples from Europe showed the highest
incidence of DON at 77% and a high average of 1288 ppb, the latter figure being the highest found worldwide. The highest European level of DON was detected in an Austrian corn silage sample at 34861 ppb. Second most occurring mycotoxin was ZEN, present in 64% of the samples. The highest ZEN level in Europe was observed in a German corn sample at 8888 ppb. Samples from Europe showed again the highest incidence of T-2 toxin, close to double compared to past years, at 42%. The highest level of T-2 toxin, 685 ppb, was detected in a corn silage sample from France. FUM occurred in 54% of the samples, with the highest single level from Europe observed in an Italian corn sample (15383 ppb).
AsiaAsia is at a high risk for mycotoxin-related risks to
livestock with 4 mycotoxins present at average concen-trations above risk threshold levels. DON prevalence and average concentration in Asia were 74% and 857 ppb, respectively. The highest singly occurring DON concentration worldwide was detected in a Chinese DDGS sample (84860 ppb).The second highest occurring mycotoxin was FUM, detected in 67% of the samples at an average concentration of 1032 ppb. The highest occurrence of FUM in Asia was detected in a Thai corn sample (16258 ppb). ZEN was the third highest occurring mycotoxin in Asian samples, detected in 55% of tested samples at an average concentration of 368 ppb.
In Asia, the highest ZEN value was detected in a Chinese finished feed sample (9432 ppb). Afla was found in 25% of the samples at the highest average concentration worldwide (59 ppb). The highest worldwide value for aflatoxins was detected in a Chinese cotton seed sample (9404 ppb).
North AmericaNorth America faces again a severe risk for mycotox-
in-related threats to livestock with 5 mycotoxins present at average concentrations above risk threshold levels.
2015 BIOMIN Mycotoxin Survey Results
For the second year, the survey includes results of multiple
mycotoxin analysis of more than 380 mycotoxins and metabolites,
Spectrum 380®, using state-of-the-art liquid chromatography-mass
spectrometry/mass spectrometry (LC-MS/MS) in a single analysis step.
It is no longer sufficient to talk about the mere presence of mycotoxins; concentration levels must be considered.

A m a g a z i n e o f B I O M I N 5
Michele Muccio Sabine Masching
Mycotoxin Risk Management Product Managers
The most frequently occurring mycotoxin is DON, detected in 67% of the samples at an average concen-tration of 1132 ppb. The highest DON level in North America was detected in a US oat sample (26294 ppb). FUM, ZEN, Afla and OTA were detected in 39%, 30%, 2% and 2% of samples respectively, at average levels of 974, 244, 16 and 32 ppb respectively.
South AmericaSouth America faces high mycotoxin-related risks
to livestock, having 4 mycotoxins present at average concentrations above risk threshold levels. Fumonisins were present in 70% of the samples at an average concen-tration of 2235 ppb. The highest FUM value worldwide was detected in a Brazilian corn sample (36489 ppb). Prevalence of DON doubled in comparison to last year, with 32% of samples testing positive.
Middle EastThe Middle East registered high mycotoxin-related
risks to livestock with 3 mycotoxins present at average
concentrations above risk threshold levels. Samples from the Middle East showed high occurrence of FUM, OTA, ZEN and DON, detected in 84%, 62%, 54% and 53% of samples respectively. With the exception of OTA, the average concentrations of these mycotoxins were all above the risk threshold.
AfricaAfrican samples showed the highest prevalence of
zearalenone at 93%.The second highest average values of Afla were detected in this region as well. Both deoxynivalenol and fumonisins were detected in 79% of the samples analyzed.
ConclusionThe analysis of the 8271 samples in this survey
indicates that constant monitoring of mycotoxins is important. An effective mycotoxin risk management program is essential in order to protect animals from the negative impacts of mycotoxins on animals’ health and performance.
Table 1. Detailed results of mycotoxin occurrence by region.
Afla ZEN DON T-2 FUM OTA
Euro
pe
Number of samples tested 1,163 2,894 3,684 2,051 1,543 1,188
% of contaminated samples 11% 64% 77% 42% 54% 26%
Average of positives (ppb) 6 213 1,288 25 898 7
Maximum (ppb) 153 8,888 34,861 685 15,383 150
Asi
a
Number of samples tested 2,360 2,357 2,420 1,077 1,824 1,454
% of contaminated samples 25% 55% 74% 2% 67% 20%
Average of positives (ppb) 59 368 857 39 1,032 7
Maximum (ppb) 9,404 9,432 84,860 171 16,258 259
N. A
mer
ica Number of samples tested 484 495 359 354 481 423
% of contaminated samples 2% 30% 67% 3% 39% 2%
Average of positives (ppb) 16 244 1,132 44 974 32
Maximum (ppb) 108 12,900 26,294 223 16,300 200
S. A
mer
ica Number of samples tested 995 668 333 411 444 202
% of contaminated samples 18% 34% 32% 11% 70% 4%
Average of positives (ppb) 6 131 545 28 2,235 2
Maximum (ppb) 138 2,593 4,195 65 36,489 12
Mid
dle
Eas
t Number of samples tested 94 115 117 40 80 26
% of contaminated samples 18% 54% 53% 8% 84% 62%
Average of positives (ppb) 1 62 446 20 513 3
Maximum (ppb) 8 367 1,983 45 2,534 9
Afr
ica
Number of samples tested 182 183 182 182 183 182
% of contaminated samples 13% 93% 79% 5% 79% 1%
Average of positives (ppb) 43 41 486 8 599 0
Maximum (ppb) 258 858 4,974 47 4,368 0
Source: 2015 BIOMIN Mycotoxin Survey

6 S c i e n c e & S o l u t i o n s • S p e c i a l I s s u e M T X
A m a g a z i n e o f B I O M I N 7
By Philipp Gruber, Product Manager at Romer Labs
Feed millers and livestock producers have more choice than in the past when it comes to testing for the presence of mycotoxins in commodity raw materials and finished feed. Here’s how to select the appropriate method for your situation.
Find the Right Mycotoxin Testing Tool
Find the Right Mycotoxin Testing Tool
For decades, taking samples and sending them to an analytical service provider has been the main method for determining the presence of mycotoxins. In recent years on-site
rapid test methods have become widely available, offering simplicity and ease- of-use to quickly detect mycotoxins on site. With more options to choose from, finding the right tool has gained impor-tance.
On-site testing vs. analytical service
The first step in finding the right testing solution is to decide whether to conduct the test yourself on-site (e.g. in the field or at the production facility), or send the samples to an analytical service laboratory. That decision depends on three main considerations:
Required testing throughput
For high volume or frequent testing (high throughput), it might be worth conducting on-site tests, since costs are generally low. If you only perform occasional testing or have low throughput, sending your samples to an analytical service lab could be more convenient.
Acceptable time to results
On-site rapid tests will deliver results within an hour. This makes rapid tests a useful tool when decision time is short, e.g. when deciding whether to accept a truck delivery. From start to finish, analytical service results take on average one week.
Quality of results
On-site testing can be categorized as a screening tool in that it provides a quick indication as to the presence of one analyte per test. Reference methods available at an analytical service laboratory are much more robust, offering greater reliability on a larger number of analytes.
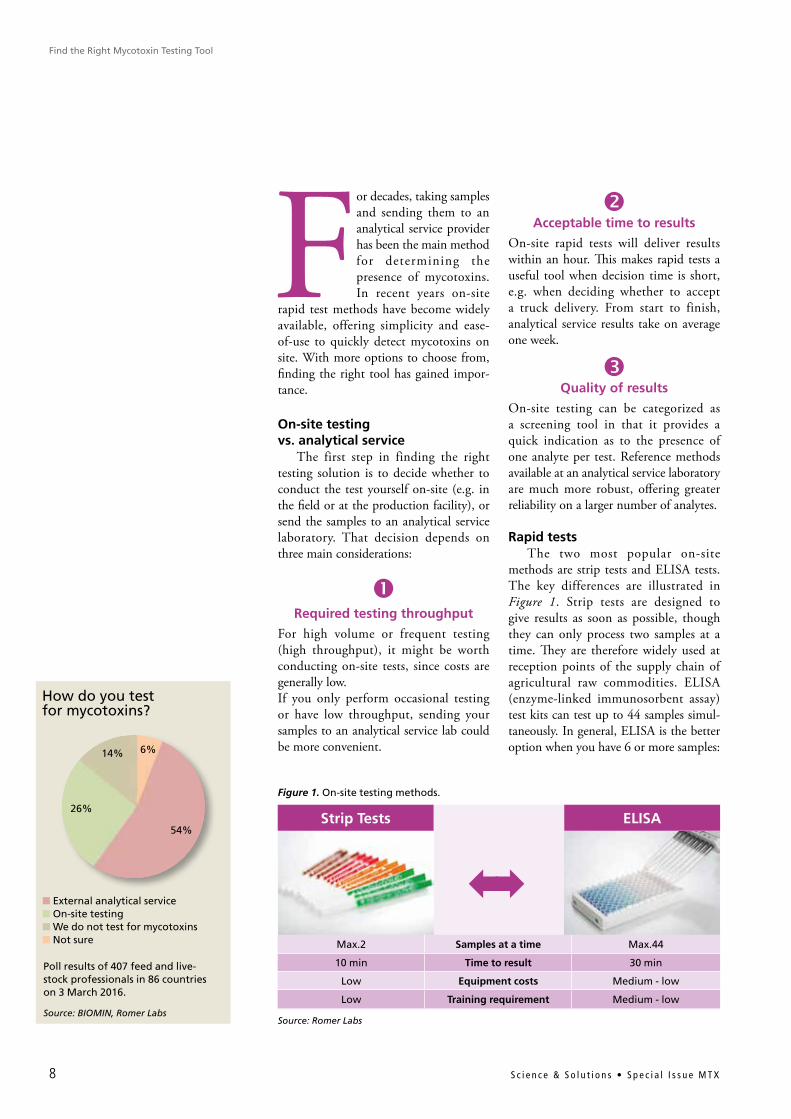
Rapid testsThe two most popular on-site
methods are strip tests and ELISA tests. The key differences are illustrated in Figure 1. Strip tests are designed to give results as soon as possible, though they can only process two samples at a time. They are therefore widely used at reception points of the supply chain of agricultural raw commodities. ELISA (enzyme-linked immunosorbent assay) test kits can test up to 44 samples simul-taneously. In general, ELISA is the better option when you have 6 or more samples:
8 S c i e n c e & S o l u t i o n s • S p e c i a l I s s u e M T X
Figure 1. On-site testing methods.
Source: Romer Labs
Strip Tests ELISA
Max.2 Samples at a time Max.44
10 min Time to result 30 min
Low Equipment costs Medium - low
Low Training requirement Medium - low
How do you testfor mycotoxins?
6%
54%
26%
14%
n External analytical servicen On-site testingn We do not test for mycotoxinsn Not sure
Poll results of 407 feed and live-stock professionals in 86 countries on 3 March 2016.
Source: BIOMIN, Romer Labs
Philipp GruberProduct Manager at Romer Labs
the price difference is quickly recuperated due to the need to buy fewer kits and it saves time.
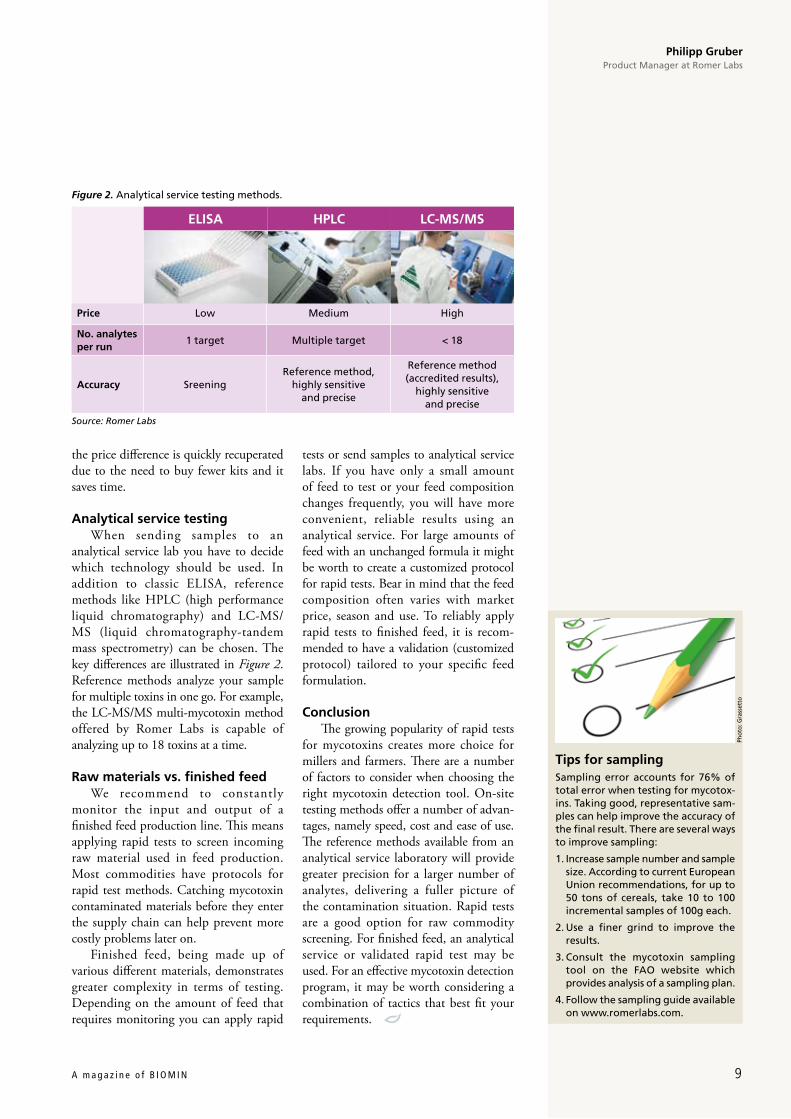
Analytical service testing When sending samples to an
analytical service lab you have to decide which technology should be used. In addition to classic ELISA, reference methods like HPLC (high performance liquid chromatography) and LC-MS/MS (liquid chromatography-tandem mass spectrometry) can be chosen. The key differences are illustrated in Figure 2. Reference methods analyze your sample for multiple toxins in one go. For example, the LC-MS/MS multi-mycotoxin method offered by Romer Labs is capable of analyzing up to 18 toxins at a time.
Raw materials vs. finished feedWe recommend to constantly
monitor the input and output of a finished feed production line. This means applying rapid tests to screen incoming raw material used in feed production. Most commodities have protocols for rapid test methods. Catching mycotoxin contaminated materials before they enter the supply chain can help prevent more costly problems later on.
Finished feed, being made up of various different materials, demonstrates greater complexity in terms of testing. Depending on the amount of feed that requires monitoring you can apply rapid
tests or send samples to analytical service labs. If you have only a small amount of feed to test or your feed composition changes frequently, you will have more convenient, reliable results using an analytical service. For large amounts of feed with an unchanged formula it might be worth to create a customized protocol for rapid tests. Bear in mind that the feed composition often varies with market price, season and use. To reliably apply rapid tests to finished feed, it is recom-mended to have a validation (customized protocol) tailored to your specific feed formulation.
ConclusionThe growing popularity of rapid tests
for mycotoxins creates more choice for millers and farmers. There are a number of factors to consider when choosing the right mycotoxin detection tool. On-site testing methods offer a number of advan-tages, namely speed, cost and ease of use. The reference methods available from an analytical service laboratory will provide greater precision for a larger number of analytes, delivering a fuller picture of the contamination situation. Rapid tests are a good option for raw commodity screening. For finished feed, an analytical service or validated rapid test may be used. For an effective mycotoxin detection program, it may be worth considering a combination of tactics that best fit your requirements.
Tips for samplingSampling error accounts for 76% of total error when testing for mycotox-ins. Taking good, representative sam-ples can help improve the accuracy of the final result. There are several ways to improve sampling:
1. Increase sample number and sample size. According to current European Union recommendations, for up to 50 tons of cereals, take 10 to 100 incremental samples of 100g each.
2. Use a finer grind to improve the results.
3. Consult the mycotoxin sampling tool on the FAO website which provides analysis of a sampling plan.
4. Follow the sampling guide available on www.romerlabs.com.
Figure 2. Analytical service testing methods.
Source: Romer Labs
ELISA HPLC LC-MS/MS
Price Low Medium High
No. analytesper run
1 target Multiple target < 18
Accuracy SreeningReference method,
highly sensitive and precise
Reference method(accredited results),
highly sensitive and precise
A m a g a z i n e o f B I O M I N 9
Pho
to: G
rass
etto

mycofix.biomin.net
* Authorized by EU Regulations No 1115/2014, 1060/2013 and 1016/2013 for the reduction of contamination with fumonisins, aflatoxins and trichothecenes.
ADSORPTION
BIOTRANSFORMATION
BIOPROTECTION
Powered by science to actively defend against multiple mycotoxins*
With 3 combined strategies
Mycofix® 5.0Absolute Protection
MYCOFIX
Naturally ahead
Your copy of Science & Solutions
WATCH
THE NEW
VIDEO