Klöckner & Co SE Press Conference Presentation Q2 2016 results
24
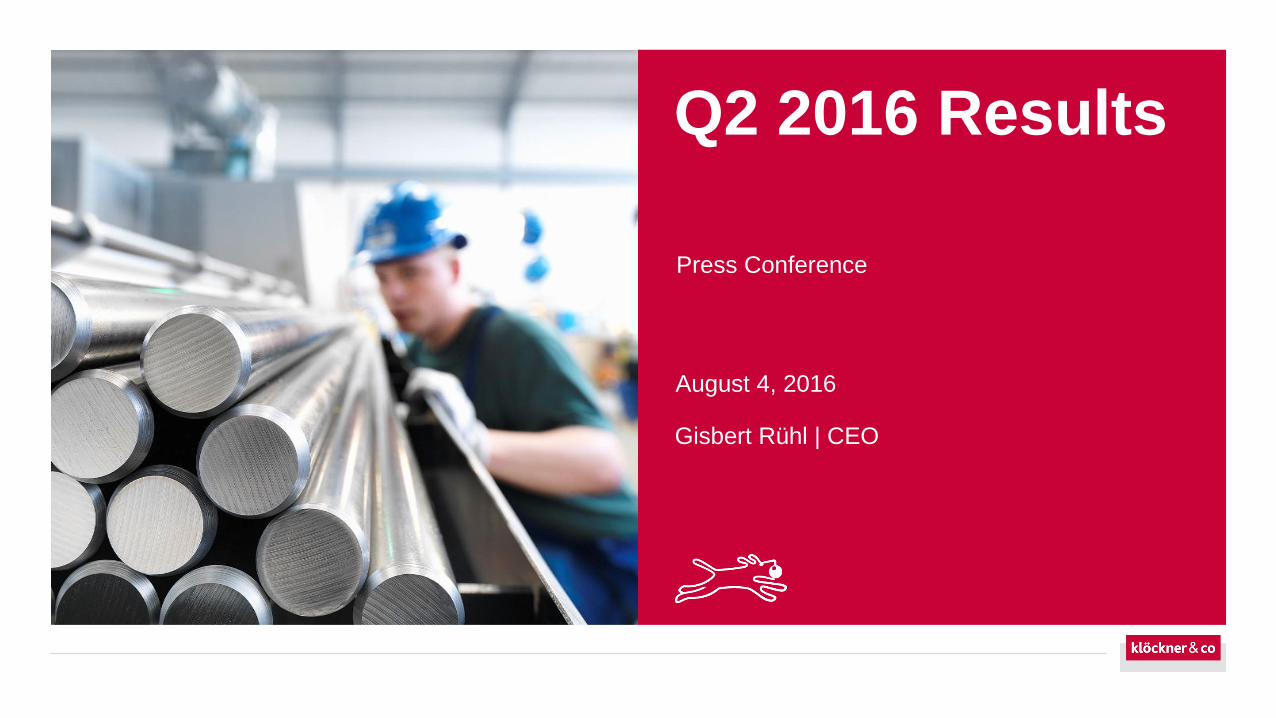
Q2 2016 Results Press Conference August 4, 2016 Gisbert Rühl | CEO
-
Upload
kloeckner-co-se -
Category
Investor Relations
-
view
179 -
download
0
Transcript of Klöckner & Co SE Press Conference Presentation Q2 2016 results
Q2 2016 Results
Press Conference
August 4, 2016
Gisbert Rühl | CEO
No.2 Q2 2016 Results | Press Conference | Klöckner & Co SE
Disclaimer
This presentation contains forward-looking statements which reflect the current views of the management of Klöckner & Co SE with respect to
future events. They generally are designated by the words “expect”, “assume”, “presume”, “intend”, “estimate”, “strive for”, “aim for”, “plan”,
“will”, “endeavor”, “outlook” and comparable expressions and generally contain information that relates to expectations or goals for economic
conditions, sales proceeds or other yardsticks for the success of the enterprise. Forward-looking statements are based on currently valid
plans, estimates and expectations. You therefore should view them with caution. Such statements are subject to risks and factors of
uncertainty, most of which are difficult to assess and which generally are outside of the control of Klöckner & Co SE. The relevant factors
include the effects of significant strategic and operational initiatives, including the acquisition or disposition of companies. If these or other
risks and factors of uncertainty occur or if the assumptions on which the statements are based turn out to be incorrect, the actual results of
Klöckner & Co SE can deviate significantly from those that are expressed or implied in these statements. Klöckner & Co SE cannot give any
guarantee that the expectations or goals will be attained. Klöckner & Co SE – notwithstanding existing obligations under laws pertaining to
capital markets – rejects any responsibility for updating the forward-looking statements through taking into consideration new information or
future events or other things.
In addition to the key data prepared in accordance with International Financial Reporting Standards, Klöckner & Co SE is presenting non-
GAAP key data such as EBITDA, EBIT, Net Working Capital and net financial liabilities that are not a component of the accounting
regulations. These key data are to be viewed as supplementary to, but not as a substitute for data prepared in accordance with International
Financial Reporting Standards. Non-GAAP key data are not subject to IFRS or any other generally applicable accounting regulations. Other
companies may base these concepts upon other definitions.

No.3
1. Highlights and update on strategy
2. Financials
3. Outlook
4. Appendix
Agenda
Q2 2016 Results | Press Conference | Klöckner & Co SE
No.4
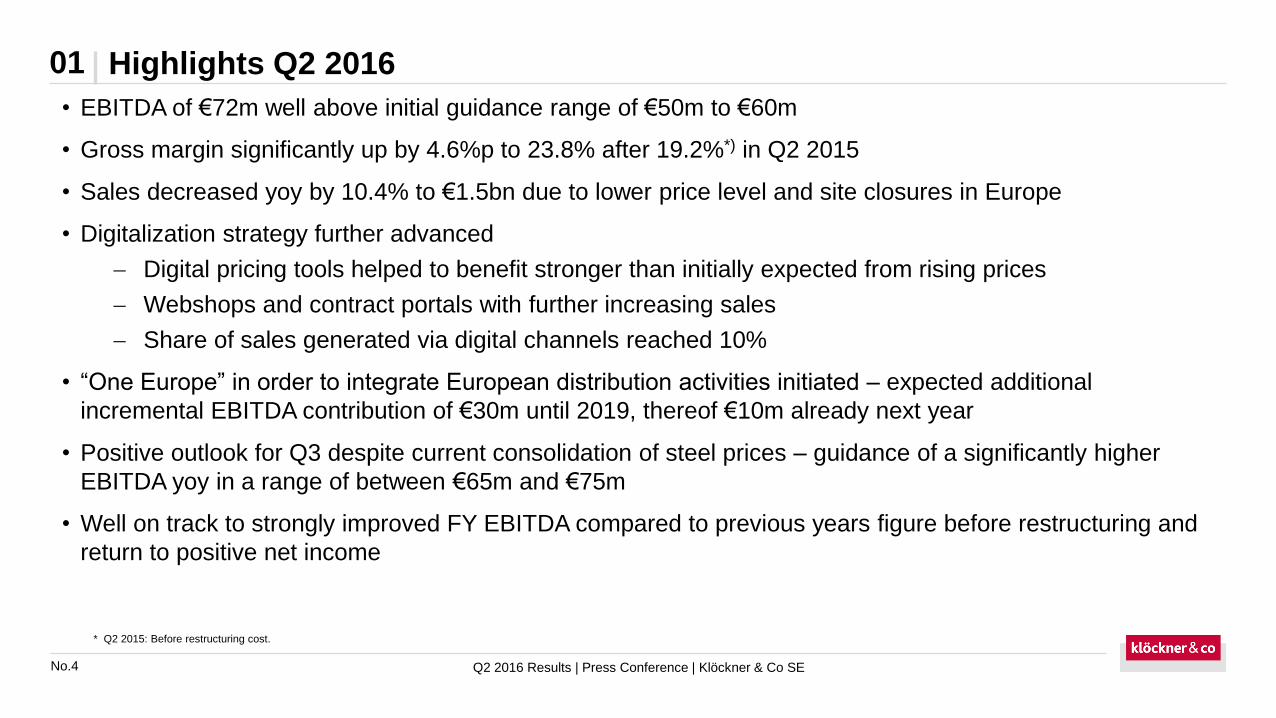
Highlights Q2 201601
• EBITDA of €72m well above initial guidance range of €50m to €60m
• Gross margin significantly up by 4.6%p to 23.8% after 19.2%*) in Q2 2015
• Sales decreased yoy by 10.4% to €1.5bn due to lower price level and site closures in Europe
• Digitalization strategy further advanced
Digital pricing tools helped to benefit stronger than initially expected from rising prices
Webshops and contract portals with further increasing sales
Share of sales generated via digital channels reached 10%
• “One Europe” in order to integrate European distribution activities initiated – expected additional
incremental EBITDA contribution of €30m until 2019, thereof €10m already next year
• Positive outlook for Q3 despite current consolidation of steel prices – guidance of a significantly higher
EBITDA yoy in a range of between €65m and €75m
• Well on track to strongly improved FY EBITDA compared to previous years figure before restructuring and
return to positive net income
Q2 2016 Results | Press Conference | Klöckner & Co SE
* Q2 2015: Before restructuring cost.
No.5 Q2 2016 Results | Press Conference | Klöckner & Co SE
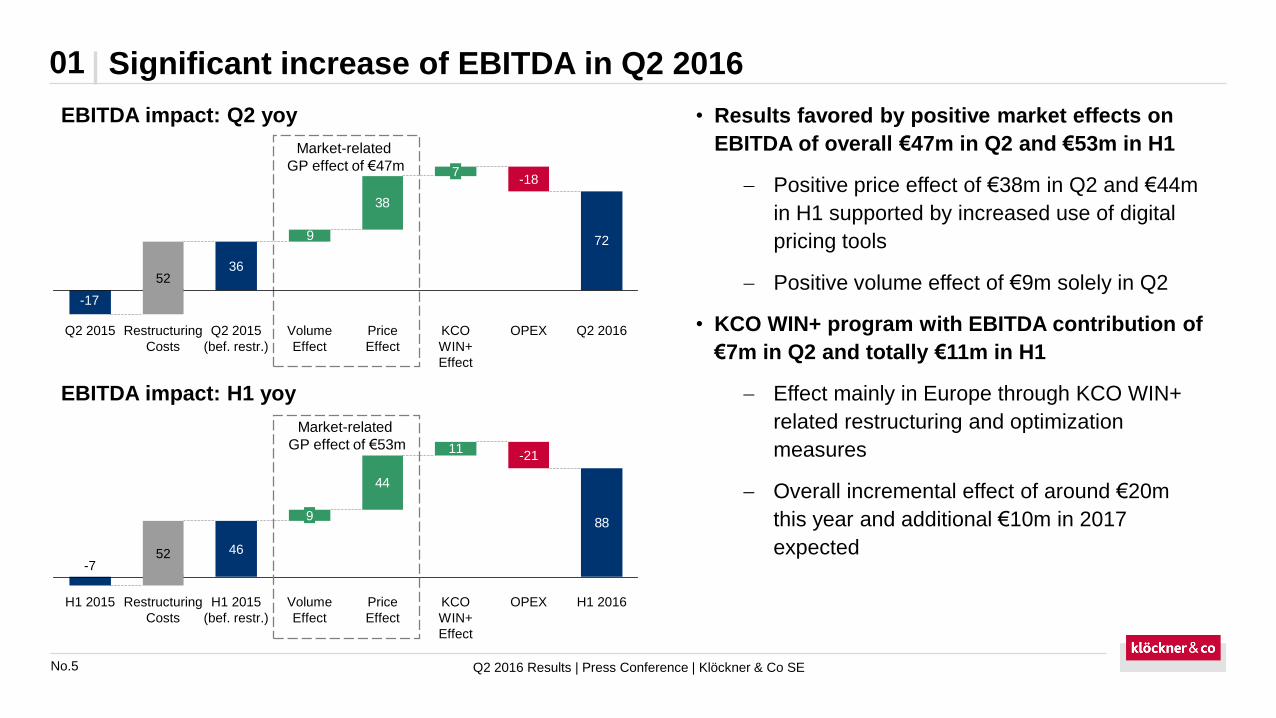
Significant increase of EBITDA in Q2 201601
EBITDA impact: Q2 yoy
Market-related
GP effect of €47m
• Results favored by positive market effects on
EBITDA of overall €47m in Q2 and €53m in H1
Positive price effect of €38m in Q2 and €44m
in H1 supported by increased use of digital
pricing tools
Positive volume effect of €9m solely in Q2
• KCO WIN+ program with EBITDA contribution of
€7m in Q2 and totally €11m in H1
Effect mainly in Europe through KCO WIN+
related restructuring and optimization
measures
Overall incremental effect of around €20m
this year and additional €10m in 2017
expected
38
9
36
Q2 2015
(bef. restr.)
Volume
Effect
Restructuring
Costs
52
Q2 2015
7
Q2 2016KCO
WIN+
Effect
-18
OPEXPrice
Effect
-17
88
11
44
H1 2015 Restructuring
Costs
52
H1 2015
(bef. restr.)
46
9
KCO
WIN+
Effect
Volume
Effect
Price
Effect
OPEX
-21
H1 2016
-7
72
Market-related
GP effect of €53m
EBITDA impact: H1 yoy

No.6 Q2 2016 Results | Press Conference | Klöckner & Co SE
Implementation of digitalization strategy is progressing further01
• Strengthening of ties to Contorion via financial investment
• Marketing for Klöckner version of SAGE ERP System has started
• User can order steel and manage their orders directly out of the ERP System
Digital
Partnerships
• Former Rocket Internet manager Franziska Leonhardt hired as COO of
kloeckner.i and kloeckner.v starting in September
• Excellent addition to management team due to in-depth expertise in launching
and scaling digital business models
Internal
Organization
• Intensified use of digital tools to support salesforce in optimizing prices
• As a consequence stronger than expected benefits from rising prices in Q2
• Further development and refining of pricing tools intended
Digital Tools
• Webshops and contract portals with further increasing sales
• Overall already around 10% of Group sales achieved via digital channels in Q2
• Well on track to achieve ambitious digitalization targets
Digital Sales

No.7 Q2 2016 Results | Press Conference | Klöckner & Co SE
For Klöckner & Co digital transformation is more than online retail01
• Shift of business design from linear value-chains to interactive platforms
• The development of platforms will be driven through increasing connectiveness, decentralization of production, and the enormous progress in artificial intelligence
• Interactions will be facilitated and orchestrated by platforms which create value not through physical resources but through leveraging data
• Precondition is an open, plug-and-play infrastructure and a clear governance for the platform
No.8
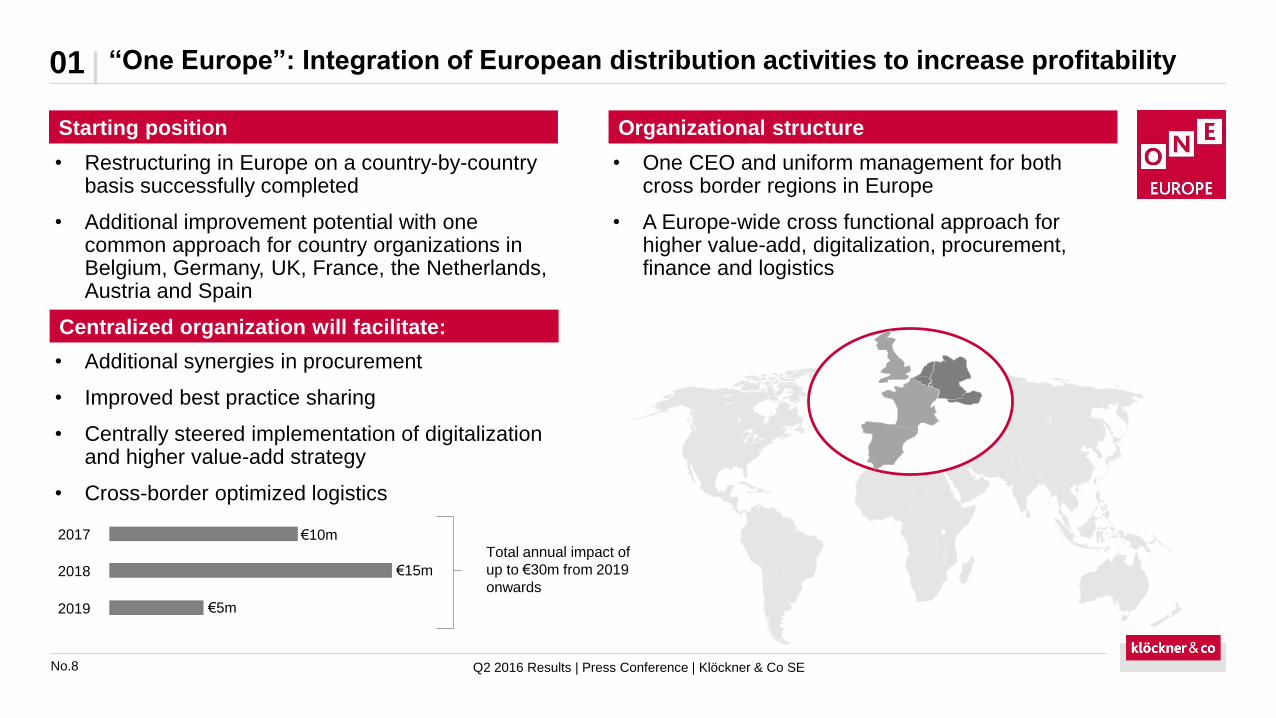
01 “One Europe”: Integration of European distribution activities to increase profitability
Q2 2016 Results | Press Conference | Klöckner & Co SE
• Additional synergies in procurement
• Improved best practice sharing
• Centrally steered implementation of digitalization and higher value-add strategy
• Cross-border optimized logistics
2017
2018 €15m
Total annual impact of
up to €30m from 2019
onwards
2019 €5m
€10m
Centralized organization will facilitate:
• One CEO and uniform management for both cross border regions in Europe
• A Europe-wide cross functional approach for higher value-add, digitalization, procurement, finance and logistics
Organizational structureStarting position
• Restructuring in Europe on a country-by-country basis successfully completed
• Additional improvement potential with one common approach for country organizations in Belgium, Germany, UK, France, the Netherlands, Austria and Spain

No.9
1. Highlights and update on strategy
2. Financials
3. Outlook
4. Appendix
Agenda
Q2 2016 Results | Press Conference | Klöckner & Co SE
No.10 Q2 2016 Results | Press Conference | Klöckner & Co SE
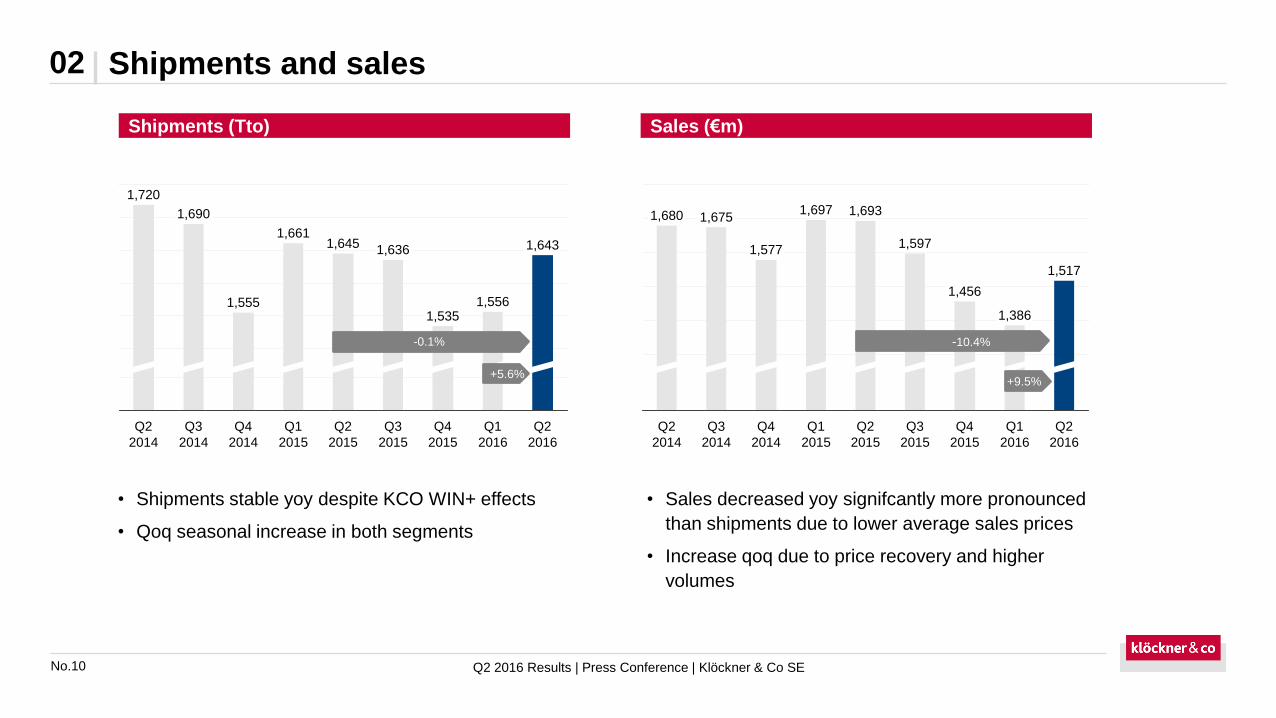
Shipments and sales02
• Shipments stable yoy despite KCO WIN+ effects
• Qoq seasonal increase in both segments
• Sales decreased yoy signifcantly more pronounced
than shipments due to lower average sales prices
• Increase qoq due to price recovery and higher
volumes
1,556
Q4
2015
1,535
1,690
Q3
2014
1,555
Q4
2014
1,661
Q1
2015
1,6451,636
Q3
2015
Q2
2014
Q1
2016
Q2
2015
1,643
Q2
2016
1,720
Q2
2015
Q1
2016
1,597
1,693
Q2
2016
1,517
Q1
2015
Q3
2015
Q4
2014
1,577
Q3
2014
1,6751,6971,680
1,386
Q4
2015
1,456
Q2
2014
-0.1%
+5.6%
-10.4%
+9.5%
Shipments (Tto) Sales (€m)

No.11 Q2 2016 Results | Press Conference | Klöckner & Co SE
Gross profit and EBITDA02
* Before restructuring cost.
** 2014 amounts restated due to the initial application of IFRIC 21 (Levies).
72
11
30
10
33
61
Q4
2014
Q3
2014
Q2
2014
58
Q2
2016
Q1
2016
16
Q4
2015
Q3
2015
Q2
2015
36
Q1
2015
4.8
1.20.7
1.92.1
0.6
2.1
3.63.5
325
Q2
2016
362
Q4
2015
297
Q3
2015
311
Q2
2015
325
Q1
2016
304
Q3
2014
309
Q4
2014
310
Q1
2015
Q2
2014
325
22.020.4
19.419.2
18.219.619.419.3
23.8
• Continued margin improvement from 18.2% in
Q1 2015 to 23.8% in Q2 2016
• EBITDA in Q2 improved yoy by €36m and qoq by €56m
• EBITDA margin recovered by 2.7%p to 4.8% yoy and qoq by
3.6%p
Gross profit* (€m) / Gross margin* (%) EBITDA*,** (€m) / EBITDA margin*,** (%)

No.12 Q2 2016 Results | Press Conference | Klöckner & Co SE
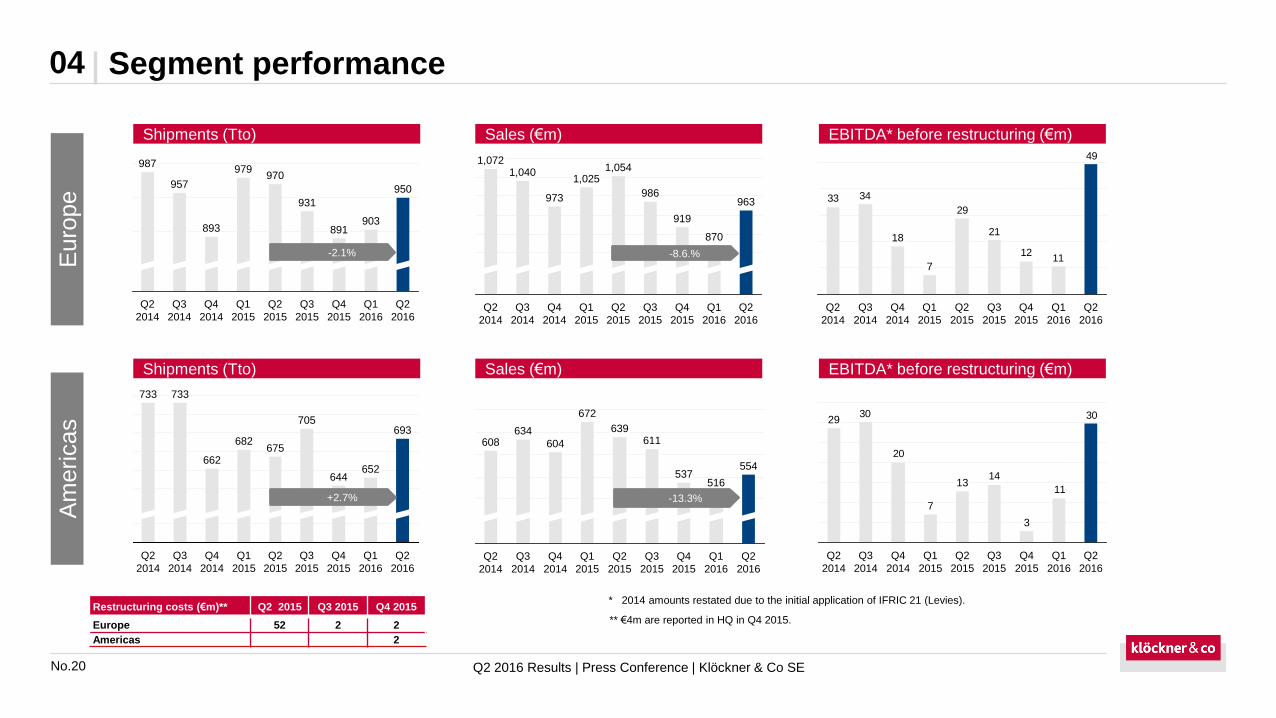
Segment performance Q202
• Europe
• EBITDA up from €29m before restructuring by €20m
to €49m
• Significant positive price effect (€17m)
• KCO WIN+ contributes €5m to EBITDA improvement
CommentsEurope (€m)
Americas (€m)
13
Q2 2016
Actual
30
Net f/x
Effect
0
OPEX
-10
KCO
WIN+
Effect
2
Price
Effect
21
Volume
Effect
4
Q2 2015
Actual
5
17
549
Q2 2016
Actual
Net f/x
Effect
-23
Q2 2015
Actual
(reported)
-1
OPEX
-6
KCO
WIN+
Effect
Price
Effect
Volume
Effect
Q2 2015
Actual
(before
restruct.)
29
Restruct.
2015
52
• Americas
• EBITDA up by €17m to €30m
• Similar to Europe strong positive price effect (€21m)

No.13 Q2 2016 Results | Press Conference | Klöckner & Co SE
Cash flow and net debt development02
36
• Limited seasonal NWC build-up of €33m
• “Other” includes changes in other provisions and other
operating assets/liabilities as well as non-cash items
22
-972
-33
EBITDA
Q2 2016
Change
in NWC
Free cash
flow Q2
2016
4
-4
TaxesInterest
-18
Other Cash
flow from
operating
activities
-4
Capex
CommentsCash flow reconciliation in Q2 2016 (€m)
• Net financial debt mainly increased due to payments
under derivative financial instruments used as hedges
for intercompany debt
Net financial debt 06/2016 vs. 03/2016 (€m)
22
Hedging
Derivatives Other
3
Net Debt
Q2 2016
435
-55
F/X
-4
Capex
-18
CF from
operating
activities
Net Debt
Q1 2016
383
,-4
No.14 Q2 2016 Results | Press Conference | Klöckner & Co SE
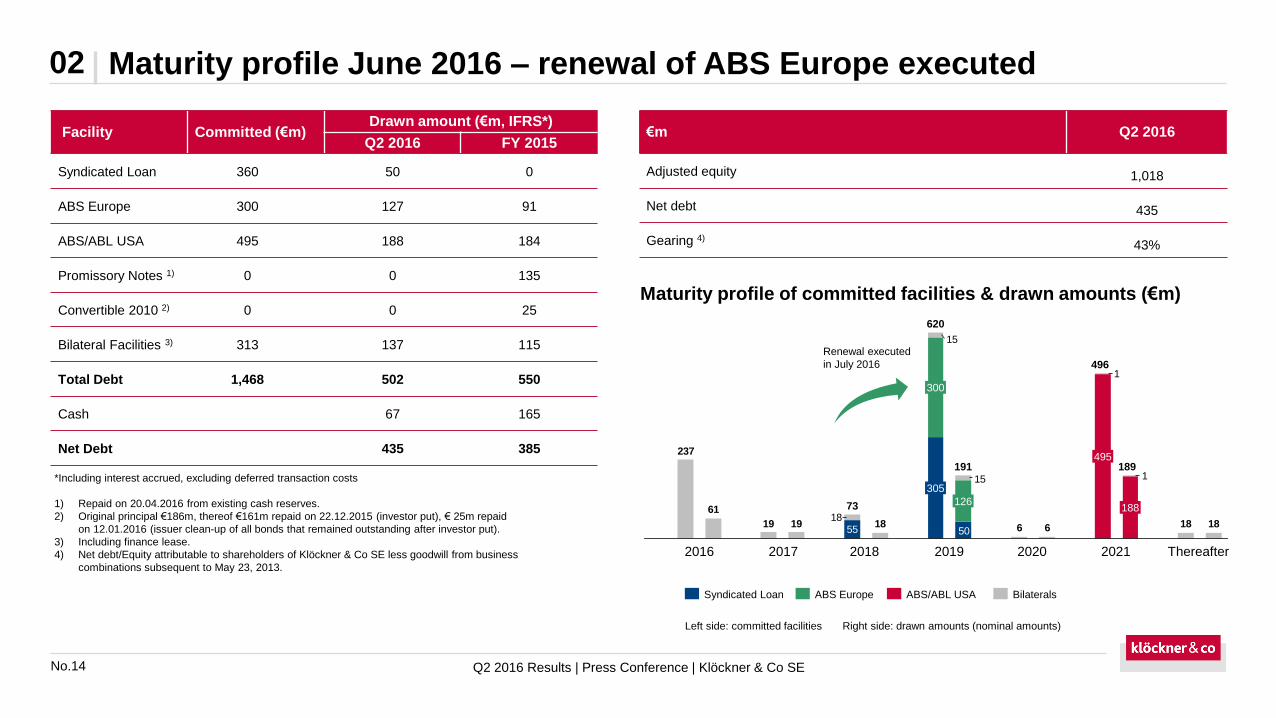
Maturity profile June 2016 – renewal of ABS Europe executed 02
Facility Committed (€m)Drawn amount (€m, IFRS*)
Q2 2016 FY 2015
Syndicated Loan 360 50 0
ABS Europe 300 127 91
ABS/ABL USA 495 188 184
Promissory Notes 1) 0 0 135
Convertible 2010 2) 0 0 25
Bilateral Facilities 3) 313 137 115
Total Debt 1,468 502 550
Cash 67 165
Net Debt 435 385
€m Q2 2016
Adjusted equity 1,018
Net debt 435
Gearing 4)43%
Maturity profile of committed facilities & drawn amounts (€m)
Left side: committed facilities Right side: drawn amounts (nominal amounts)
ABS/ABL USA BilateralsSyndicated Loan ABS Europe
*Including interest accrued, excluding deferred transaction costs
1) Repaid on 20.04.2016 from existing cash reserves.
2) Original principal €186m, thereof €161m repaid on 22.12.2015 (investor put), € 25m repaid
on 12.01.2016 (issuer clean-up of all bonds that remained outstanding after investor put).
3) Including finance lease.
4) Net debt/Equity attributable to shareholders of Klöckner & Co SE less goodwill from business
combinations subsequent to May 23, 2013.
5055181866181919
61
237
1
1
15
15
18
189
620
305
73
191
496
126
300
495
188
Renewal executed
in July 2016
2016 2017 2018 2019 2020 2021 Thereafter

No.15
1. Highlights and update on strategy
2. Financials
3. Outlook
4. Appendix
Agenda
Q2 2016 Results | Press Conference | Klöckner & Co SE

No.16
Shipbuilding
Q2 2016 Results | Press Conference | Klöckner & Co SE
Segment specific business outlook 201603
Energy
industry
Real steel
demand
Europe
~ +3%
Construction
industry
Manufacturing,
machinery and
mechanical
engineering, etc.
Automotive
industry
US
~ -3%

No.17 Q2 2016 Results | Press Conference | Klöckner & Co SE
Outlook 03
Q3 2016
• Sales expected to be sequentially down
• Significantly higher operating EBITDA anticipated yoy in a range between €65m and €75m
FY 2016
• Lower sales anticipated due to continued exit of low margin business and on average lower sales prices
• EBITDA expected to rise significantly compared to previous years figure adjusted for restructuring
expenses
• Positive net income supported by lower financing expenses and the expected absence of further
goodwill impairments

No.18
1. Highlights and update on strategy
2. Financials
3. Outlook
4. Appendix
Agenda
Q2 2016 Results | Press Conference | Klöckner & Co SE

No.19 Q2 2016 Results | Press Conference | Klöckner & Co SE
Quarterly and FY results04
(€m)Q2
2016
Q1
2016
Q4
2015
Q3
2015
Q2
2015
Q1
2015
Q4
2014*
Q3
2014*
Q2
2014*
FY
2015
FY
2014
FY
2013
FY
2012**
Shipments (Tto) 1,643 1,556 1,535 1,636 1,645 1,661 1,555 1,690 1,720 6,476 6,598 6,445 7,068
Sales 1,517 1,386 1,456 1,597 1,693 1,697 1,577 1,675 1,680 6,444 6,504 6,378 7,388
Gross profit 362 304 297 311 320 310 309 325 325 1,237 1,261 1,188 1,288
% margin 23.8 22.0 20.4 19.4 18.9 18.2 19.6 19.4 19.3 19.2 19.4 18.6 17.4
EBITDA rep. 72 16 2 28 -17 10 33 61 58 24 191 124 60
% margin 4.8 1.2 0.2 1.8 -1.0 0.6 2.1 3.6 3.5 0.4 2.9 2.0 0.8
EBIT 49 -8 -297 5 -44 -15 8 38 36 -350 98 -6 -105
Financial result -7 -8 -12 -12 -13 -12 -13 -14 -16 -49 -59 -73 -80
Income before taxes 42 -16 -309 -7 -56 -27 -4 24 19 -399 39 -79 -185
Income taxes -9 2 45 -2 1 6 1 -8 -7 50 -17 -12 -18
Net income 33 -14 -263 -9 -55 -22 -4 16 12 -349 22 -90 -203
Minority interests 1 0 -1 0 -1 0 -1 0 0 -2 0 -6 -3
Net income KlöCo 32 -14 -263 -9 -54 -21 -4 16 12 -347 22 -85 -200
EPS basic (€) 0.32 -0.14 -2.63 -0.09 -0.54 -0.22 -0.04 0.16 0.12 -3.48 0.22 -0.85 -2.00
EPS diluted (€) 0.32 -0.14 -2.63 -0.09 -0.54 -0.22 -0.04 0.16 0.12 -3.48 0.22 -0.85 -2.00
* Restated due to initial application of IFRIC 21.
** Restated due to initial application IAS 19 revised 2011.
No.20 Q2 2016 Results | Press Conference | Klöckner & Co SE
Segment performance04
* 2014 amounts restated due to the initial application of IFRIC 21 (Levies).
931
Q2
2015
970
Q1
2015
979
Q4
2014
893
Q3
2014
957
Q2
2014
987
Q2
2016
950
Q1
2016
903
Q4
2015
891
Q3
2015
963
Q1
2016
870
Q4
2015
919
Q3
2015
986
Q2
2015
1,054
Q1
2015
1,025
Q4
2014
973
Q3
2014
1,040
Q2
2014
1,072
Q2
2016
12
2933
49
11
21
34
Q2
2016
Q1
2016
Q4
2015
Q3
2015
Q2
2015
Q1
2015
7
Q4
2014
18
Q3
2014
Q2
2014
Q2
2016
693
Q1
2016
652
Q4
2015
644
Q3
2015
705
Q2
2015
675
Q1
2015
682
Q4
2014
662
Q3
2014
733
Q2
2014
733
Q2
2016
554
Q1
2016
516
Q4
2015
537
Q3
2015
611
Q2
2015
639
Q1
2015
672
Q4
2014
604
Q3
2014
634
Q2
2014
608
30
11
14
20
30
Q4
2015
3
Q3
2015
Q2
2015
13
Q1
2015
7
Q4
2014
Q3
2014
Q2
2016
Q1
2016
Q2
2014
29
-2.1%
+2.7%
-8.6.%
-13.3%
Euro
pe
Am
ericas
Restructuring costs (€m)** Q2 2015 Q3 2015 Q4 2015
Europe 52 2 2
Americas 2
Shipments (Tto) Sales (€m) EBITDA* before restructuring (€m)
Shipments (Tto) Sales (€m) EBITDA* before restructuring (€m)
** €4m are reported in HQ in Q4 2015.
No.21 Q2 2016 Results | Press Conference | Klöckner & Co SE
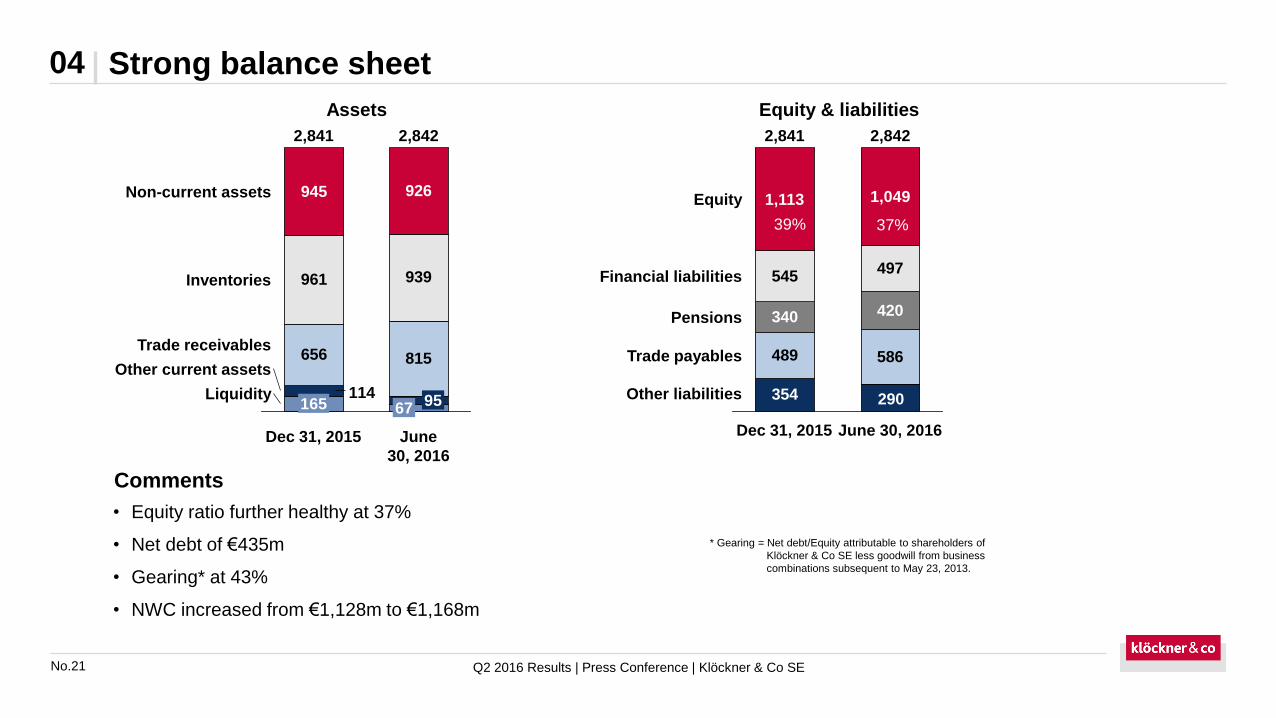
Strong balance sheet04
• Equity ratio further healthy at 37%
• Net debt of €435m
• Gearing* at 43%
• NWC increased from €1,128m to €1,168m
* Gearing = Net debt/Equity attributable to shareholders of
Klöckner & Co SE less goodwill from business
combinations subsequent to May 23, 2013.
Comments
Assets Equity & liabilities
39% 39%
656 815
961 939
945 926
114
June
30, 2016
2,842
6795
Dec 31, 2015
2,841
165Liquidity
Other current assets
Trade receivables
Inventories
Non-current assets
354
489 586
340 420
545497
290
2,841
1,113
Other liabilities
Trade payables
Pensions
Financial liabilities
Equity
June 30, 2016
2,842
1,049
Dec 31, 2015
39% 37%

No.22 Q2 2016 Results | Press Conference | Klöckner & Co SE
Sales by markets, products and industries04
As of December 31, 2015.
Sales by markets Sales by industry
Sales by product
5%UK
<1%Brazil/China
11%France/Belgium
16%Switzerland
24%Germany
38%USA
3%Netherlands
2%Spain
6%Tubes
7%Aluminum
9%Quality steel/
Stainless steel
22%Long products
43%Flat products
13%Others
12%Automotive
industry
5%Miscellaneous6%
Local dealers
33%Machinery/mechanical
engineering
37%Construction
industry
7%Household appl./Consumer goods
No.23 Q2 2016 Results | Press Conference | Klöckner & Co SE
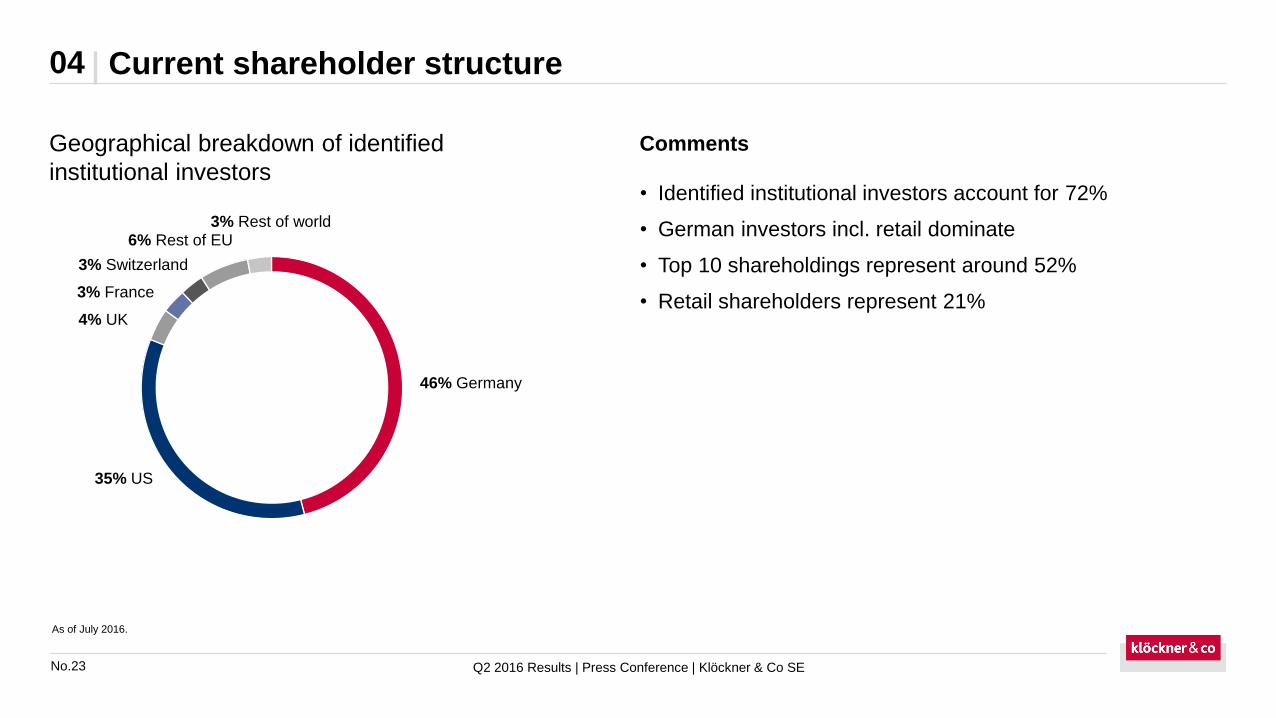
Current shareholder structure04
Geographical breakdown of identified
institutional investors• Identified institutional investors account for 72%
• German investors incl. retail dominate
• Top 10 shareholdings represent around 52%
• Retail shareholders represent 21%
Comments
As of July 2016.
6% Rest of EU
35% US
3% Rest of world
3% Switzerland
4% UK
3% France
46% Germany
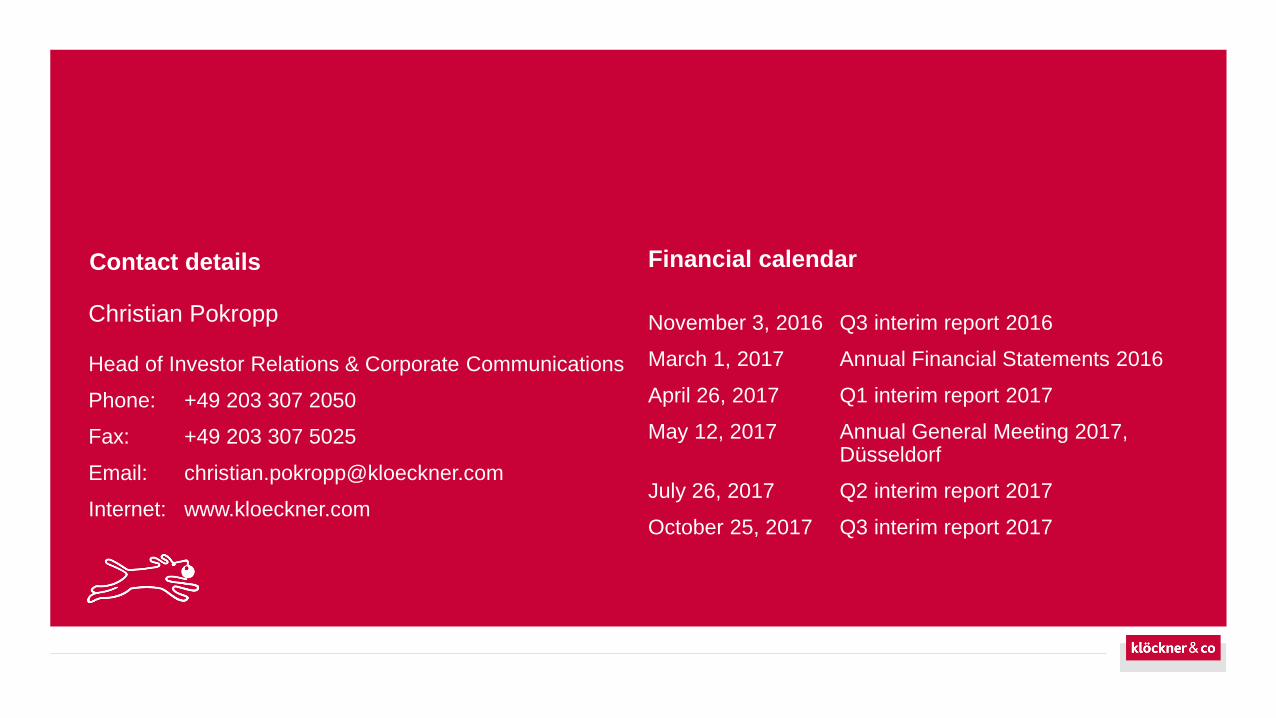
Financial calendar
Christian Pokropp
Head of Investor Relations & Corporate Communications
Phone: +49 203 307 2050
Fax: +49 203 307 5025
Email: [email protected]
Internet: www.kloeckner.com
November 3, 2016 Q3 interim report 2016
March 1, 2017 Annual Financial Statements 2016
April 26, 2017 Q1 interim report 2017
May 12, 2017 Annual General Meeting 2017, Düsseldorf
July 26, 2017 Q2 interim report 2017
October 25, 2017 Q3 interim report 2017
Contact details