Klöckner & Co - Roadshow Presentation February 2009
37
Klöckner & Co SE A Leading Multi Metal Distributor February 2009 Gisbert Rühl CFO
-
Upload
kloeckner-co-se -
Category
Investor Relations
-
view
34 -
download
0
Transcript of Klöckner & Co - Roadshow Presentation February 2009
Klöckner & Co SE
A Leading Multi Metal Distributor
February 2009
Gisbert RühlCFO
2
Agenda
2.
Preliminary results FY 2008
Appendix
3.
Market update
4.
Strategy update
5.
General targets and outlook
1.
Overview

3
Klöckner & Co at a glanceKlöckner & Co
Leading producer-independent steel and metal distributor in the European and North American markets combined
Network with more than 260 distribution locations in Europe and North America
More than 10,000 employees
GB
24%
21%
14%
7%
5%
9%
20%Germany
France Spain
Nether-lands
Switzerland
Sales split by markets
As of September 2008
Steel-flat Products
Steel-long Products
Special and
Quality Steel
Aluminum
Other Products
31%
31%
10%
9%
6%
13%
Sales split by product
As of September 2008
Other
Machinery/Manufacturing
Auto-
motive*
42%
25%
6%
27%
Sales split by industry
As of December 2007
Construction USA
Tubes
*
Since
deconsolidation
of Namasco Ltd. <3%
4
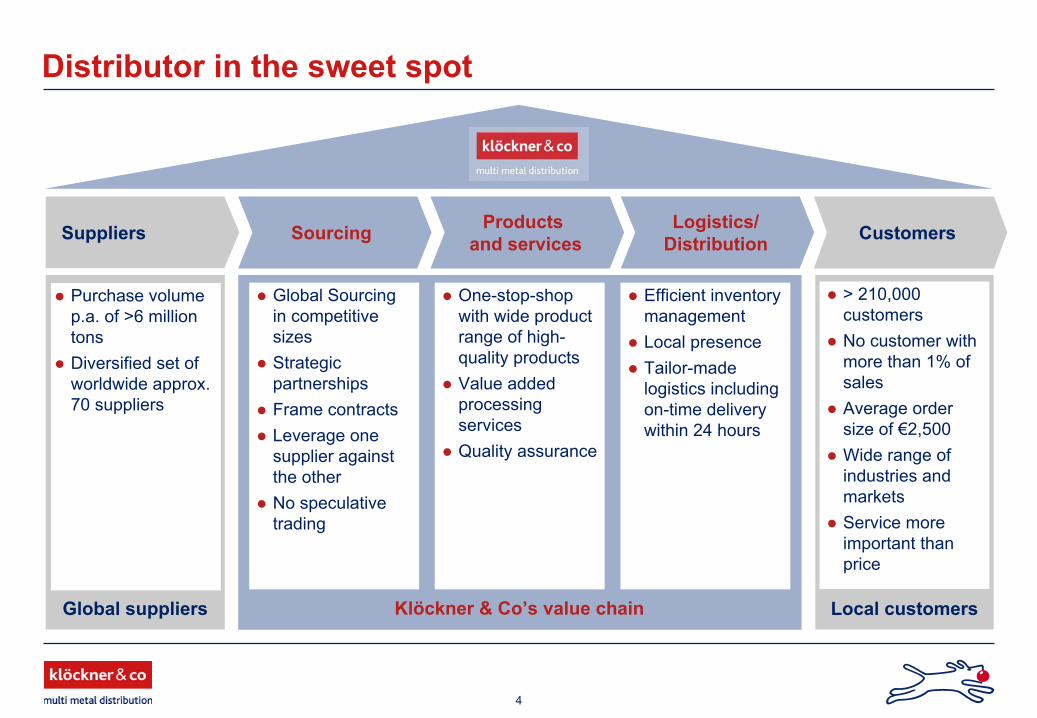
Distributor in the sweet spot
Local customersGlobal suppliers
Suppliers Sourcing Products and services
Logistics/
Distribution Customers
Global Sourcing in competitive sizesStrategic partnershipsFrame contractsLeverage one supplier against the otherNo speculative trading
One-stop-shop with wide product range of high-quality productsValue added processing services Quality assurance
Efficient inventory managementLocal presenceTailor-made logistics including on-time delivery within 24 hours
> 210,000 customersNo customer with more than 1% of salesAverage order size of €2,500Wide range of industries and marketsService more important than price
Purchase volume p.a. of >6 million tonsDiversified set of worldwide approx. 70 suppliers
Klöckner & Co’s value chain
5
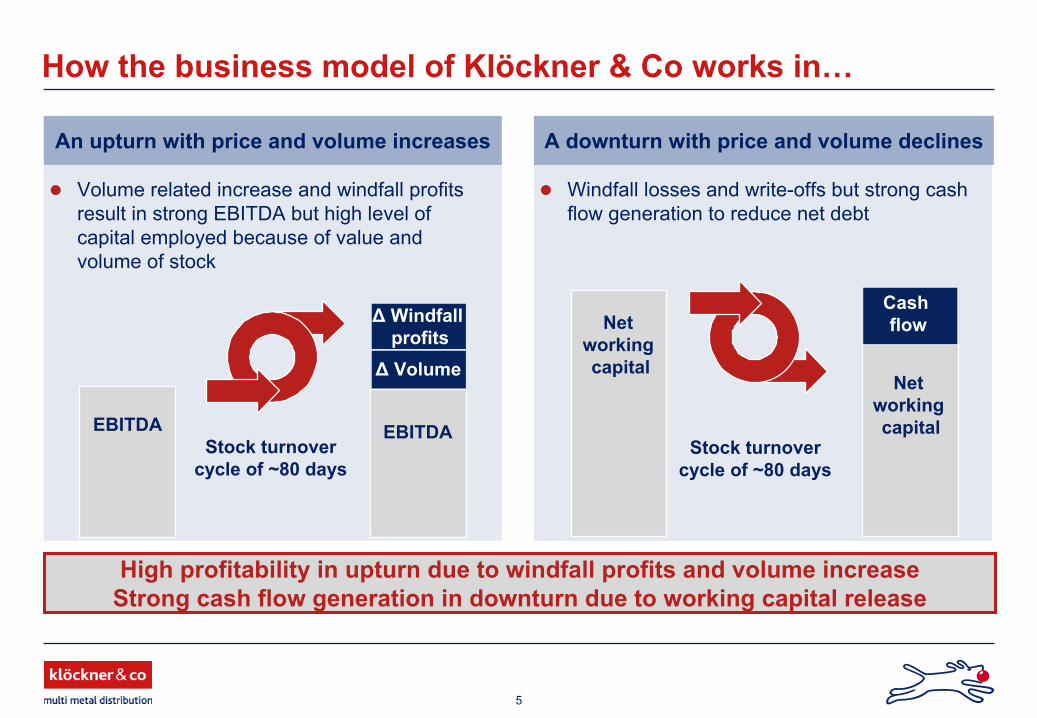
Volume related increase and windfall profits result in strong EBITDA but high level of capital employed because of value and volume of stock
How the business model of Klöckner & Co works in…
High profitability in upturn due to windfall profits and volume increaseStrong cash flow generation in downturn due to working capital release
An upturn with price and volume increases
EBITDAStock turnover
cycle
of ~80 days
EBITDA
Δ
Windfall
profits
Δ
Volume
Windfall losses and write-offs but strong cash flow generation to reduce net debt
A downturn with price and volume declines
Net working
capital
Stock turnover
cycle
of ~80 days
Net working
capital
Cash flow
6
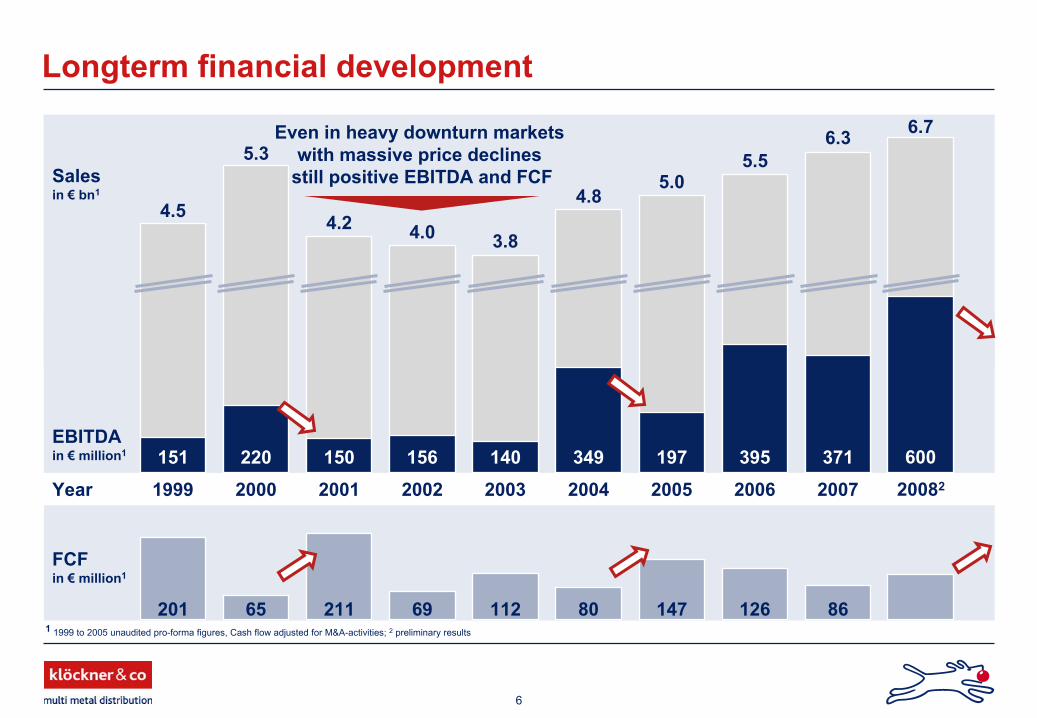
Longterm
financial development
1
1999 to 2005 unaudited
pro-forma
figures, Cash flow
adjusted
for
M&A-activities; 2
preliminary
results
Sales in €
bn1
EBITDA in €
million1
Year
FCF in €
million1
201 65 211 69 112 80 147 126 86
4.5
5.3
4.2 4.0 3.8
4.85.0
1999 2000 2001 2002 2003 2004 2005
151 220 150 156 140 349 197
Even in heavy
downturn
markets
with
massive price
declines
still positive EBITDA and FCF
5.5
2006
395
6.3
2007
371
6.7
20082
600
7
Agenda
2.
Preliminary results FY 2008
Appendix
3.
Market update
4.
Strategy update
5.
General targets and outlook
1.
Overview
8
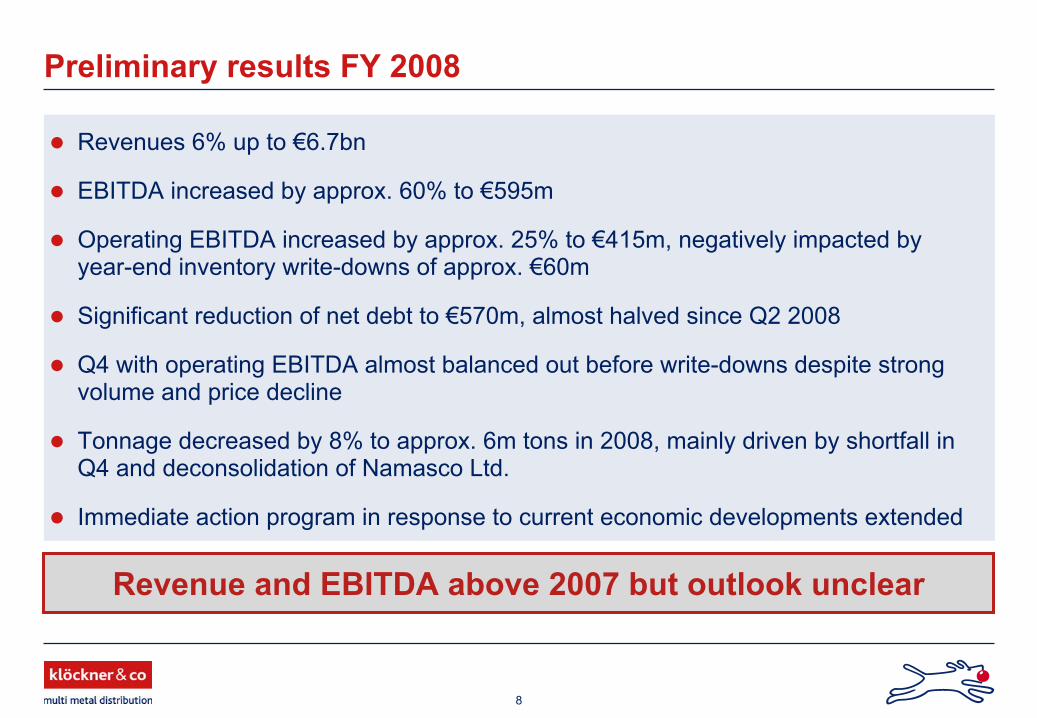
Revenue and EBITDA above 2007 but outlook unclear
Preliminary results FY 2008
Revenues 6% up to €6.7bn
EBITDA increased by approx. 60% to €595m
Operating EBITDA increased by approx. 25% to €415m, negatively impacted by year-end inventory write-downs of approx. €60m
Significant reduction of net debt to €570m, almost halved since Q2 2008
Q4 with operating EBITDA almost balanced out before write-downs despite strong volume and price decline
Tonnage decreased by 8% to approx. 6m tons in 2008, mainly driven by shortfall in Q4 and deconsolidation of Namasco Ltd.
Immediate action program in response to current economic developments extended
9
Agenda
2.
Preliminary results FY 2008
Appendix
3.
Market update
4.
Strategy update
5.
General targets and outlook
1.
Overview
10
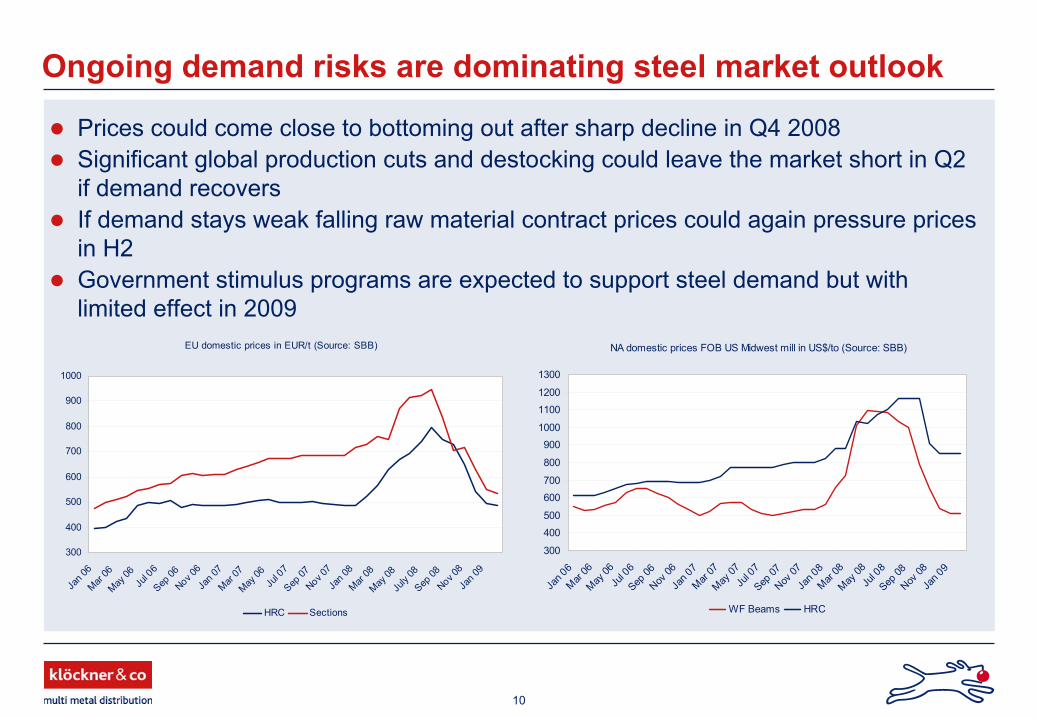
Prices could come close to bottoming out after sharp decline in Q4 2008Significant global production cuts and destocking could leave the market short in Q2 if demand recoversIf demand stays weak falling raw material contract prices could again pressure prices in H2Government stimulus programs are expected to support steel demand but with limited effect in 2009
Ongoing demand risks are dominating steel market outlook
e
EU domestic prices in EUR/t (Source: SBB)
300
400
500
600
700
800
900
1000
Jan 0
6Mar
06May
06Ju
l 06
Sep 06
Nov 06
Jan 0
7Mar
07May
06Ju
l 07
Sep 07
Nov 07
Jan 0
8Mar
08May
08Ju
ly 08
Sep 08
Nov 08
Jan 0
9
HRC Sections
NA domestic prices FOB US Midwest mill in US$/to (Source: SBB)
300
400
500
600
700
800
900
1000
1100
1200
1300
Jan 0
6Mar
06May
06Ju
l 06
Sep 06
Nov 06
Jan 0
7Mar
07May
07Ju
l 07
Sep 07
Nov 07
Jan 0
8Mar
08May
08Ju
l 08
Sep 08
Nov 08
Jan 0
9
WF Beams HRC
11
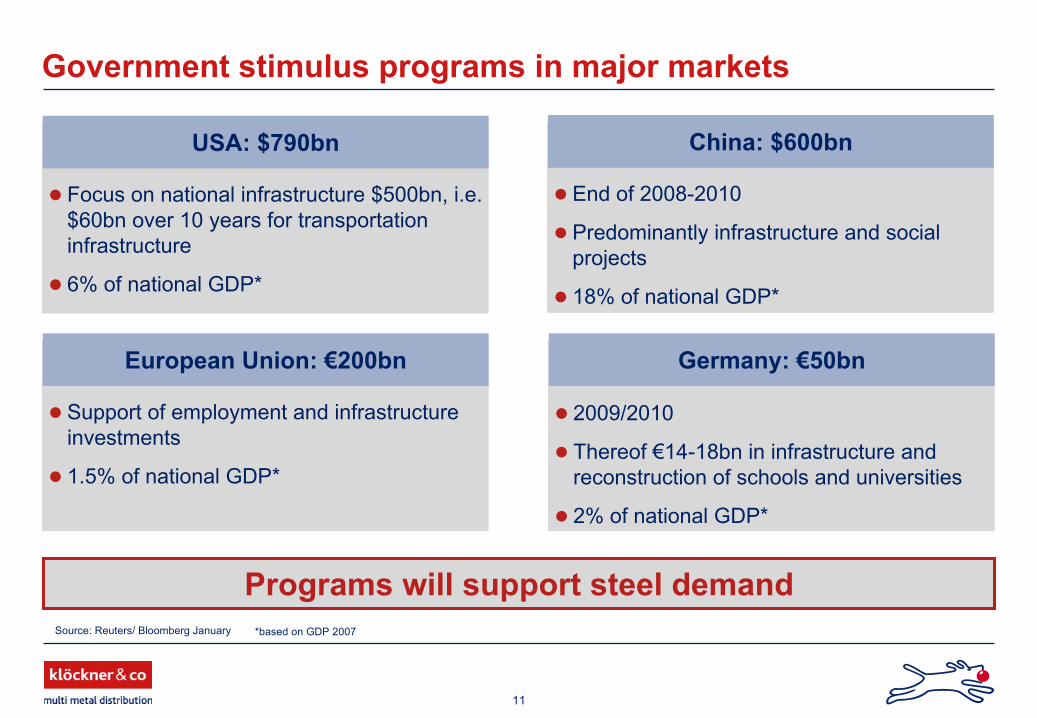
Government stimulus programs in major markets
USA: $790bn
Focus on national infrastructure $500bn, i.e. $60bn over 10 years for transportation infrastructure
6% of national GDP*
Programs will support steel demand
China: $600bn
End of 2008-2010
Predominantly infrastructure and social projects
18% of national GDP*
European Union: €200bn
Support of employment and infrastructure investments
1.5% of national GDP*
Germany: €50bn
2009/2010
Thereof €14-18bn in infrastructure and reconstruction of schools and universities
2% of national GDP*
*based on GDP 2007Source: Reuters/ Bloomberg January

12
Agenda
2.
Preliminary results FY 2008
Appendix
3.
Market update
4.
Strategy update
5.
General targets and outlook
1.
Overview
13
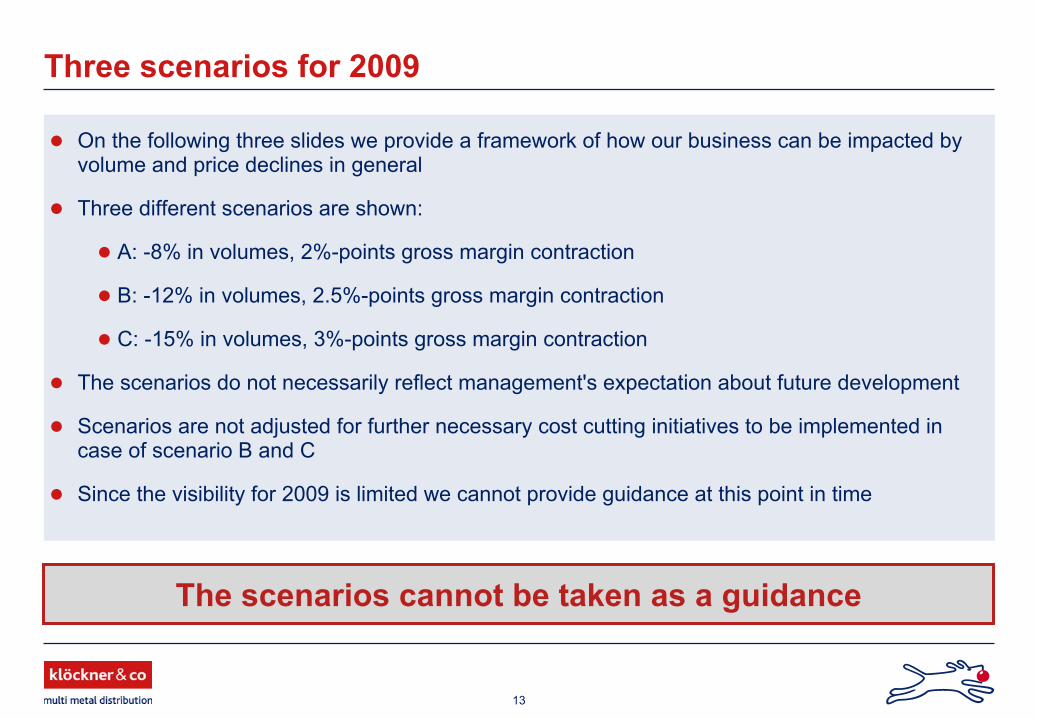
Three scenarios for 2009
On the following three slides we provide a framework of how our business can be impacted by volume and price declines in general
Three different scenarios are shown:
A: -8% in volumes, 2%-points gross margin contraction
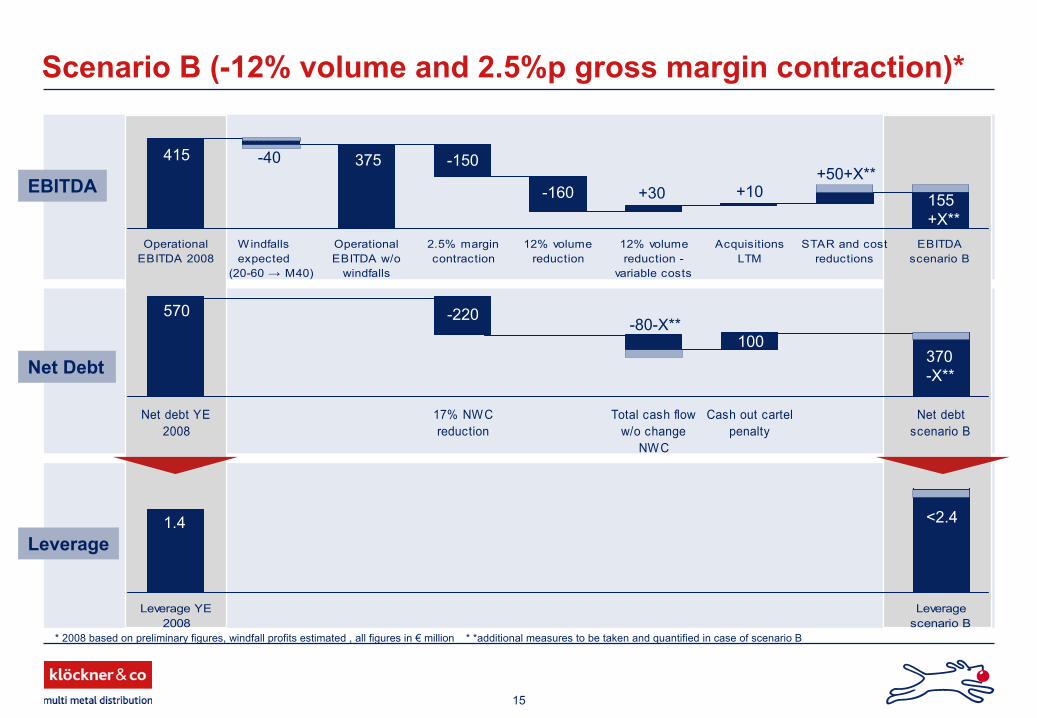
B: -12% in volumes, 2.5%-points gross margin contraction
C: -15% in volumes, 3%-points gross margin contraction
The scenarios do not necessarily reflect management's expectation about future development
Scenarios are not adjusted for further necessary cost cutting initiatives to be implemented in case of scenario B and C
Since the visibility for 2009 is limited we cannot provide guidance at this point in time
The scenarios cannot be taken as a guidance
14
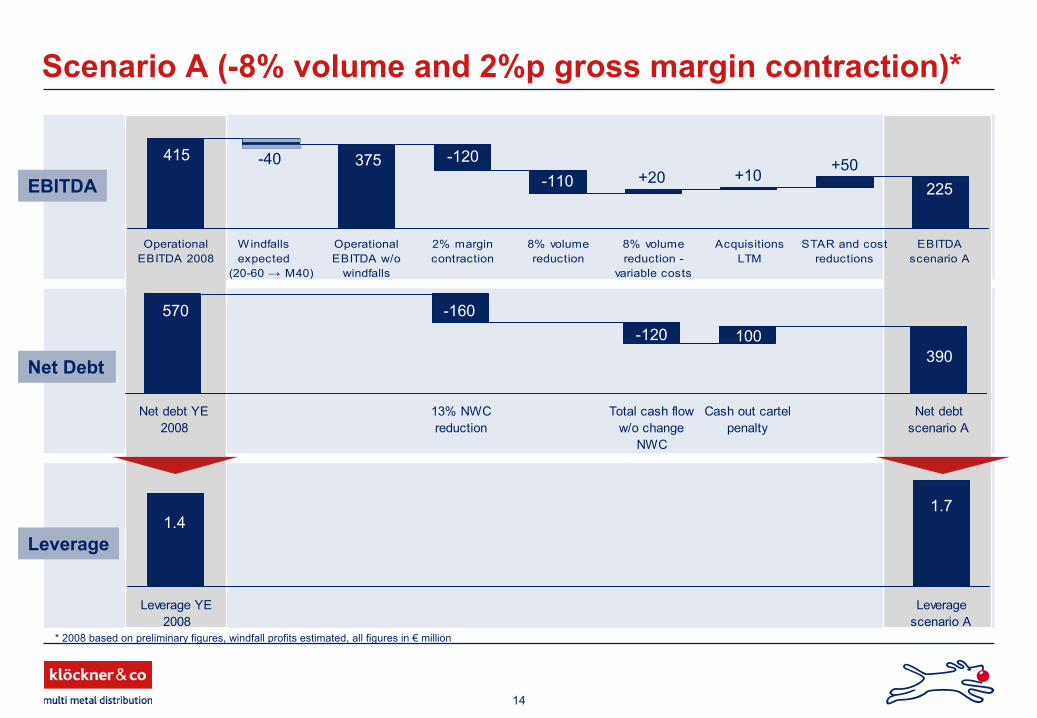
Scenario A (-8% volume and 2%p gross margin contraction)*
OperationalEBITDA 2008
Windfalls expected
(20-60 → M40)
OperationalEBITDA w/o
windfalls
2% margincontraction
8% volumereduction
8% volumereduction -
variable costs
AcquisitionsLTM
STAR and costreductions
EBITDAscenario A
EBITDA
415 -40 375 -120-110 +20
+50225
Leverage
Net Debt
+10
Net debt YE2008
13% NWCreduction
Total cash floww/o change
NWC
Cash out cartelpenalty
Net debtscenario A
570 -160-120
390
Leverage YE2008
Leveragescenario A
1.41.7
100
* 2008 based
on preliminary
figures, windfall
profits
estimated, all figures
in €
million
15
Scenario B (-12% volume and 2.5%p gross margin contraction)*
OperationalEBITDA 2008
Windfalls expected
(20-60 → M40)
OperationalEBITDA w/o
windfalls
2.5% margincontraction
12% volumereduction
12% volumereduction -
variable costs
AcquisitionsLTM
STAR and costreductions
EBITDAscenario B
EBITDA
415 -40 375 -150
-160 +30 155
+X**
Leverage
Net Debt
+10
Net debt YE2008
17% NWCreduction
Total cash floww/o change
NWC
Cash out cartelpenalty
Net debtscenario B
570 -220 -80-X**
370
-X**
Leverage YE2008
Leveragescenario B
1.4 <2.4
100
* 2008 based
on preliminary
figures, windfall
profits
estimated
, all figures
in €
million
+50+X**
* *additional measures
to be
taken
and quantified
in case
of scenario
B

16
Scenario C (-15% volume and 3%p gross margin contraction)*
OperationalEBITDA 2008
Windfalls expected
(20-60 → M40)
OperationalEBITDA starting
point w/owindfalls
3% margincontraction
15% volumereduction
15% volumereduction -
variable costs
AcquisitionsLTM
STAR and costreductions
EBITDAscenario C
EBITDA
415 -40 375 -180
-205 +3585+X**
Leverage
Net Debt
+10
Net debt YE2008
20% NWCreduction
Total cash floww/o change
NWC
Cash out cartelpenalty
Net debtscenario C
570 -260-50-X**
360
-X**
Leverage YE2008
Leveragescenario C
1.4 <4.2
100
* 2008 based
on preliminary
figures, windfall
profits
estimated, all figures
in €
million
+50+X**
* *additional measures
to be
taken
and quantified
in case
of scenario
C

17
Measures beyond in case of further volume decline
Immediate action program executed to be prepared for recession –
Personnel costs are key
Measures taken so far
Reduction of around 800 jobs with about 400 already achieved will reduce OPEX in 2009 by more than €20mStrong focus on NWC management with stock and inventory as key lever for debt reductionAcquisitions are postponed for the time beingNon-essential investments postponed
Further personnel measures according to volume declineKey priority is liquidity and NWC managementCapex to be reduced to minimumClosure of non-profitable sites
Cost structure
0%
10%
20%
30%
40%
50%
60%
70%
80%
90%
100%
Total expenses
~€1bn
55% Personnel
expensesapp. 10% variable
45% Other
expensesapp. 40% variable
App. 25% of total expenses
are
variable

18
Phase II (2008 onwards)
STAR Program on track
Phase I (2005 -
2008)
Overall targets:Central purchasing on country level, especially in GermanyImprovement of distribution networkImprovement of inventory management
2006:
~ €20 million2007:
~ €40 million2008:
~ €20 million~ €80 million
Upside potential
Overall targets:European sourcingOngoing improvement of distribution network
Upside potential
2008
~ €10 million2009:
~ €30 million2010:
~ €20 million~ €60 million
€27 million realized until Q3
19
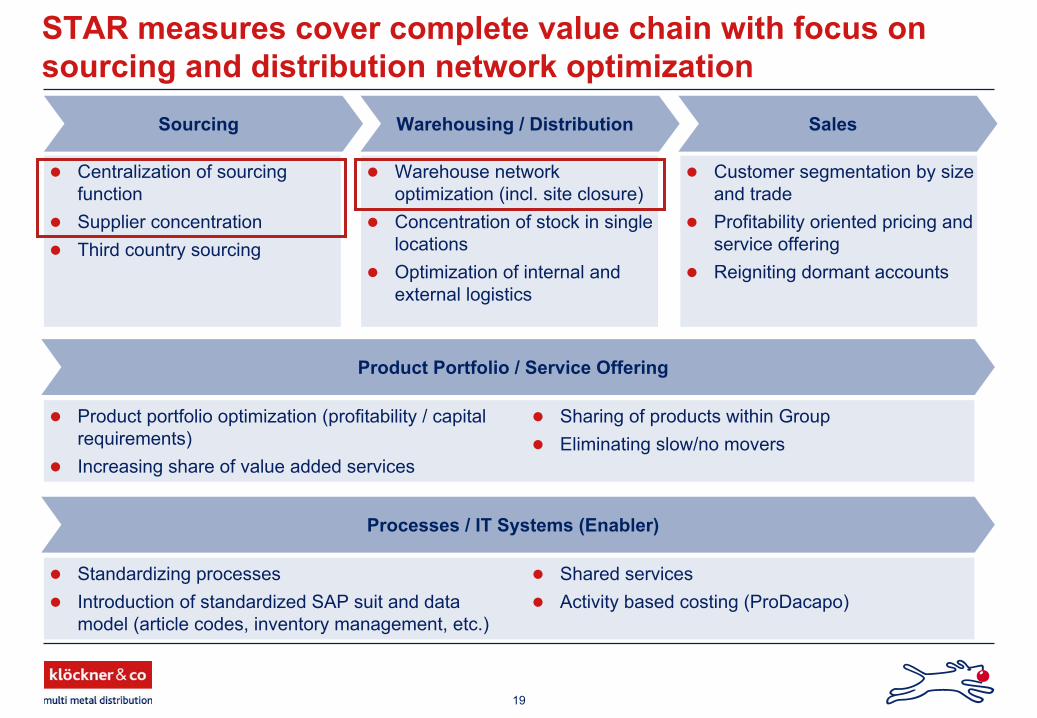
STAR measures cover complete value chain with focus on sourcing and distribution network optimization
SalesSourcing Warehousing / Distribution
Centralization of sourcing functionSupplier concentrationThird country sourcing
Warehouse network optimization (incl. site closure)Concentration of stock in single locationsOptimization of internal and external logistics
Customer segmentation by size and tradeProfitability oriented pricing and service offeringReigniting dormant accounts
Product Portfolio / Service Offering
Product portfolio optimization (profitability / capital requirements)Increasing share of value added services
Sharing of products within GroupEliminating slow/no movers
Processes / IT Systems (Enabler)
Standardizing processesIntroduction of standardized SAP suit and data model (article codes, inventory management, etc.)
Shared servicesActivity based costing (ProDacapo)

20
High financial flexibility
Comments
*Europe and USA
in €
million
Strong financial position0
100
200
300
400
500
600
ABS* Syn Loan Bilateral Credits Convertible
used line unused line equity
portion
Net indebtedness of €570m by end of 2008
Total credit facilities of €1.8bn
Utilization of around 50%
High cash reserve
21
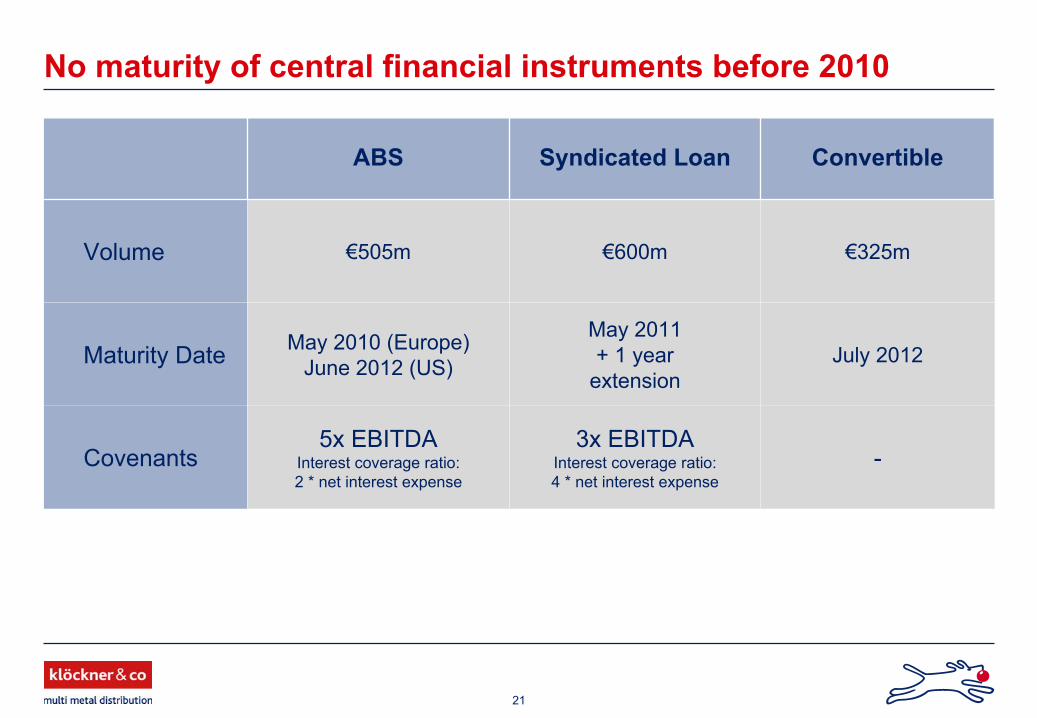
No maturity of central financial instruments before 2010
ABS Syndicated Loan Convertible
Volume €505m €600m €325m
Maturity Date May 2010 (Europe)June
2012 (US)
May 2011 + 1 year
extensionJuly
2012
Covenants5x EBITDA
Interest coverage ratio: 2 * net interest expense
3x EBITDA Interest coverage ratio: 4 * net interest expense
-
22
Agenda
2.
Preliminary results FY 2008
Appendix
3.
Market update
4.
Strategy update
5.
General targets and outlook
1.
Overview
23
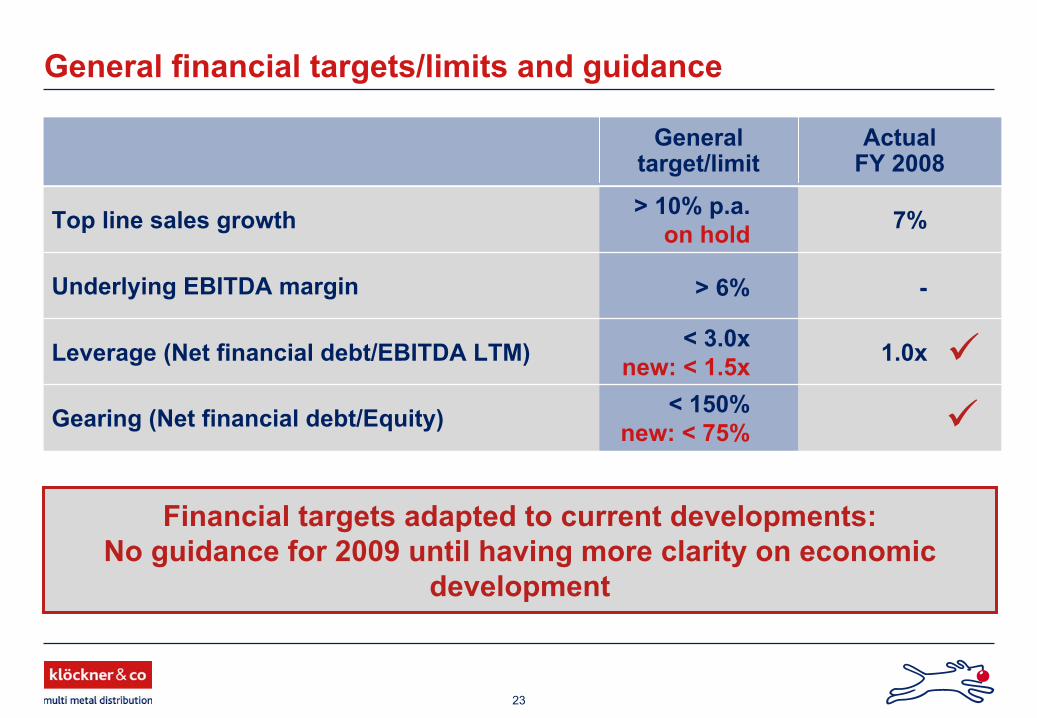
General financial targets/limits and guidance
< 150%new: < 75%Gearing (Net financial debt/Equity)
1.0x< 3.0x new: < 1.5xLeverage (Net financial debt/EBITDA LTM)
-> 6%Underlying EBITDA margin
7%> 10% p.a.on holdTop line sales growth
ActualFY 2008
Generaltarget/limit
Financial targets adapted to current developments: No guidance for 2009 until having more clarity on economic
development

24
Appendix
Table of contents
Financial calendar 2009 and contact details
Largest independent multi metal distributor
Quarterly results and FY results 2008/2007/2006/2005
Current shareholder structure
Acquisitions 2007/2008
Financial results Q3/9M 2008
25
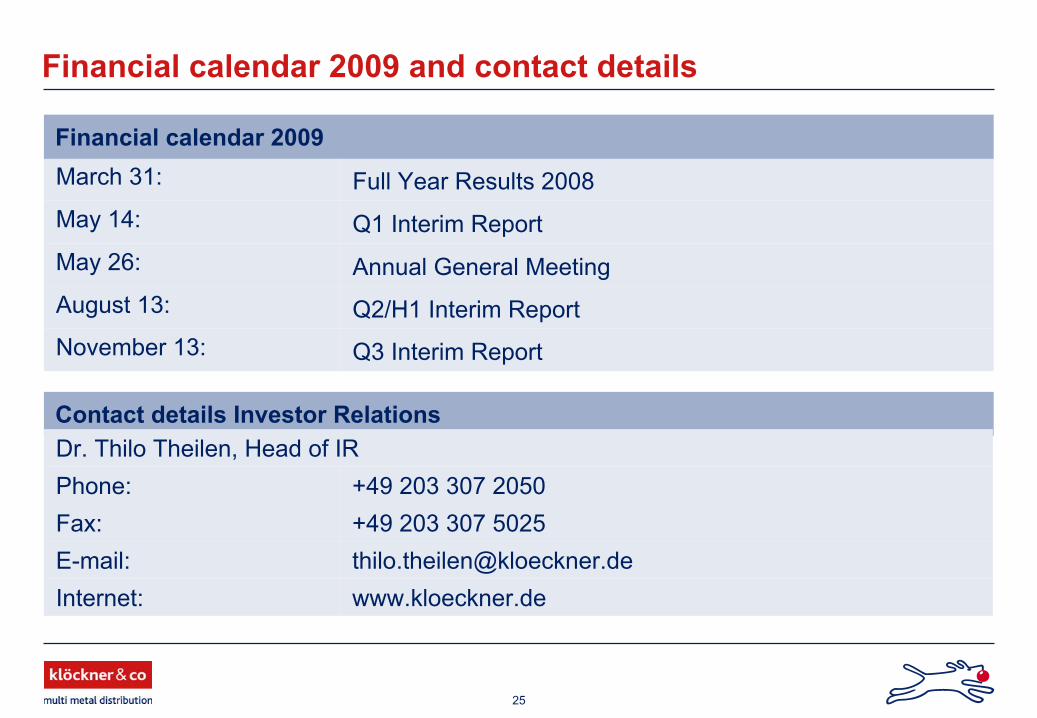
March 31: Full Year Results 2008May 14: Q1 Interim ReportMay 26: Annual General MeetingAugust 13: Q2/H1 Interim ReportNovember 13: Q3 Interim Report
Financial calendar 2009 and contact details
Financial calendar 2009
Contact details Investor Relations Dr. Thilo
Theilen, Head of IR
Phone: +49 203 307 2050Fax: +49 203 307 5025E-mail: [email protected]: www.kloeckner.de

26
Financial highlights Q3/9M 2008
(€m) Q3 2008
Q3 2007 Δ% 9M
20089M
2007 Δ%
Volume (Ttons) 1,348 1,601 -15.8 4,823 4,893 -1.4
Sales 1,773 1,583 12.0 5,355 4,783 12.0
EBITDA 413 93 343.2 735 288 155.1
EBIT 395 76 419.2 685 242 183.5
27
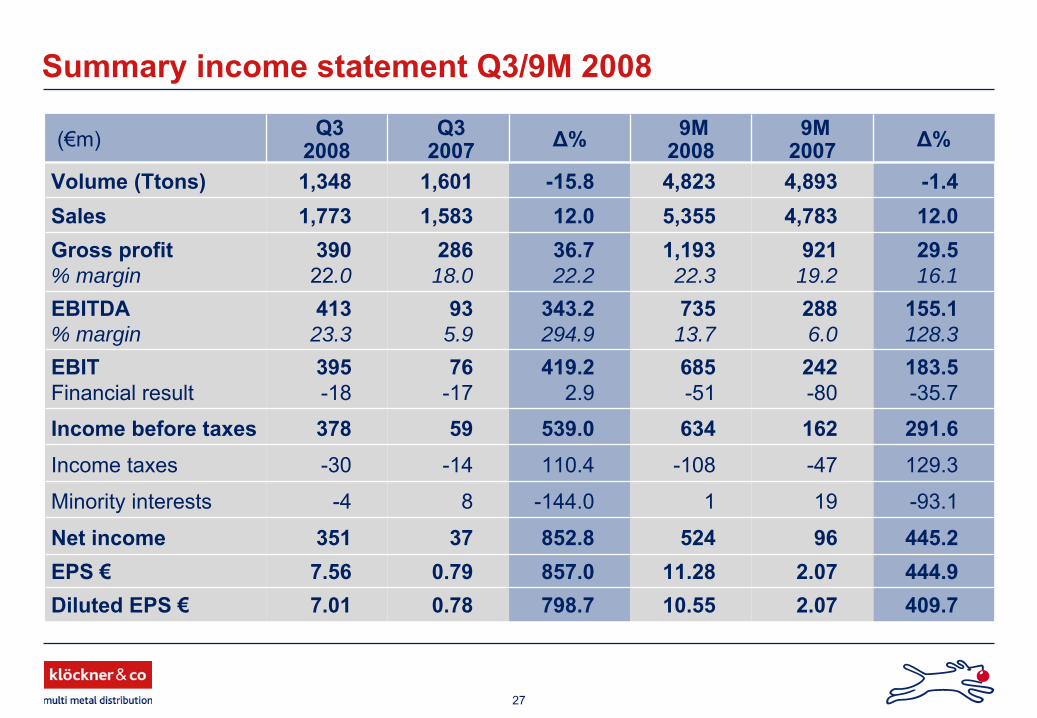
Summary income statement Q3/9M 2008
(€m) Q32008
Q32007 Δ% 9M
20089M
2007 Δ%
Volume
(Ttons) 1,348 1,601 -15.8 4,823 4,893 -1.4Sales 1,773 1,583 12.0 5,355 4,783 12.0Gross profit% margin
390 22.0
28618.0
36.7 22.2
1,193 22.3
92119.2
29.5 16.1
EBITDA% margin
413 23.3
935.9
343.2 294.9
735 13.7
2886.0
155.1 128.3
EBITFinancial result
395 -18
76-17
419.2 2.9
685 -51
242-80
183.5 -35.7
Income before
taxes 378 59 539.0 634 162 291.6Income taxes -30 -14 110.4 -108 -47 129.3
Minority interests -4 8 -144.0 1 19 -93.1
Net income 351 37 852.8 524 96 445.2EPS € 7.56 0.79 857.0 11.28 2.07 444.9Diluted EPS
€ 7.01 0.78 798.7 10.55 2.07 409.7
28
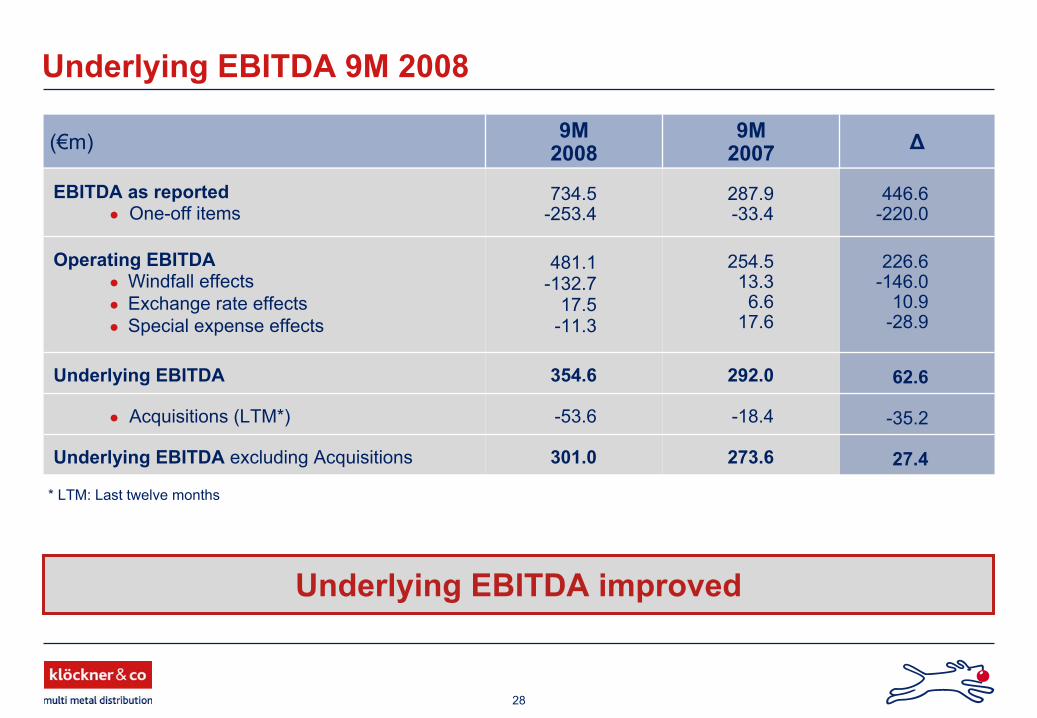
Underlying EBITDA 9M 2008
Underlying EBITDA improved
27.4
-35.2
62.6
226.6-146.0
10.9-28.9
446.6-220.0
Δ
273.6
-18.4
292.0
254.513.36.6
17.6
287.9-33.4
9M2007
301.0
-53.6
354.6
481.1-132.7
17.5-11.3
734.5-253.4
9M2008
Underlying EBITDA excluding Acquisitions
●
Acquisitions (LTM*)
Operating EBITDA●
Windfall effects●
Exchange rate effects●
Special expense effects
Underlying EBITDA
EBITDA as reported●
One-off items
(€m)
* LTM: Last twelve months
29
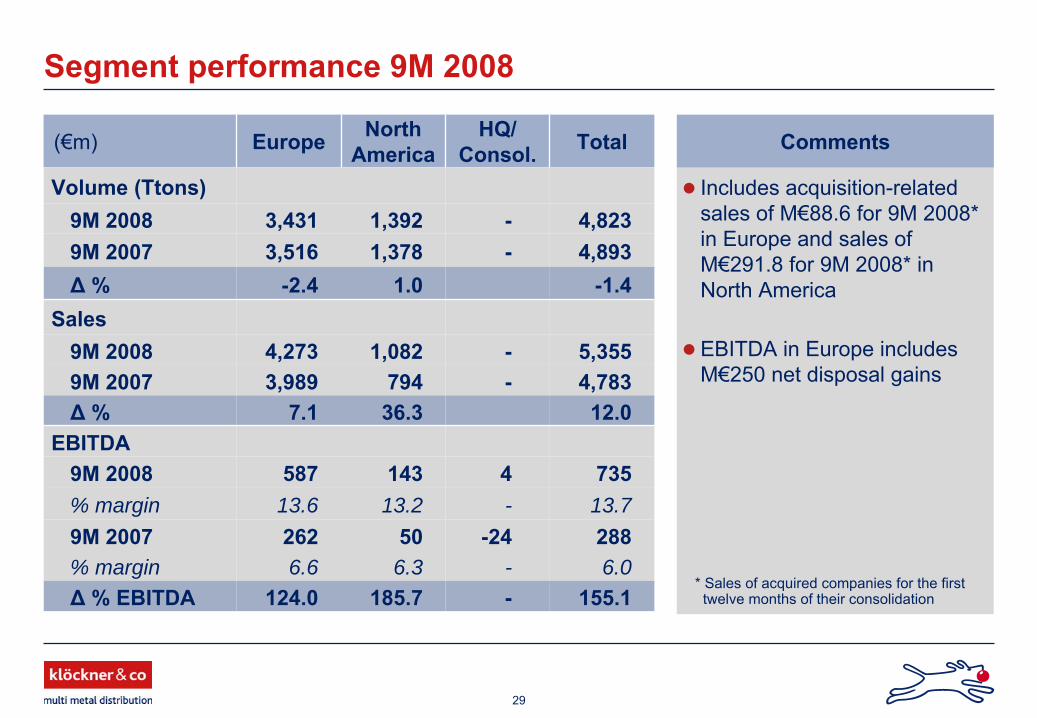
Includes acquisition-related sales of M€88.6 for 9M 2008* in Europe and sales of M€291.8 for 9M 2008* in North America
EBITDA in Europe includes M€250 net disposal gains
Segment performance 9M 2008
Comments(€m) Europe North America
HQ/Consol. Total
Volume
(Ttons)9M 2008 3,431 1,392 - 4,8239M 2007 3,516 1,378 - 4,893Δ
% -2.4 1.0 -1.4Sales
9M 2008 4,273 1,082 - 5,3559M 2007 3,989 794 - 4,783Δ
% 7.1 36.3 12.0EBITDA
9M 2008 587 143 4 735% margin 13.6 13.2 - 13.79M 2007 262 50 -24 288% margin 6.6 6.3 - 6.0Δ
% EBITDA 124.0 185.7 - 155.1* Sales of acquired companies for the first
twelve months of their consolidation

30
Balance sheet as of Sept. 30, 2008
(€m) September 30, 2008
December 31, 2007
Long-term assets 782 735Inventories 1,328 956Trade receivables 1,138 930Cash & Cash equivalents 241 154Other assets 70 191Total assets 3,559 2,966Equity 1,221 845Total long-term liabilities 1,223 1,152
-
thereof financial liabilities 874 813Total short-term liabilities 1,115 969
-
thereof trade payables 747 610Total equity and liabilities 3,559 2,966Net working capital 1,720 1,323Net financial debt 690 746
Comments
Shareholders’
equity:Increased from 28% to 34%
Financial debt:Leverage reduced from 2.0x to 0.8x EBITDAGearing reduced from 88% to 57%
Net Working Capital:Increase sales- and price-driven
31
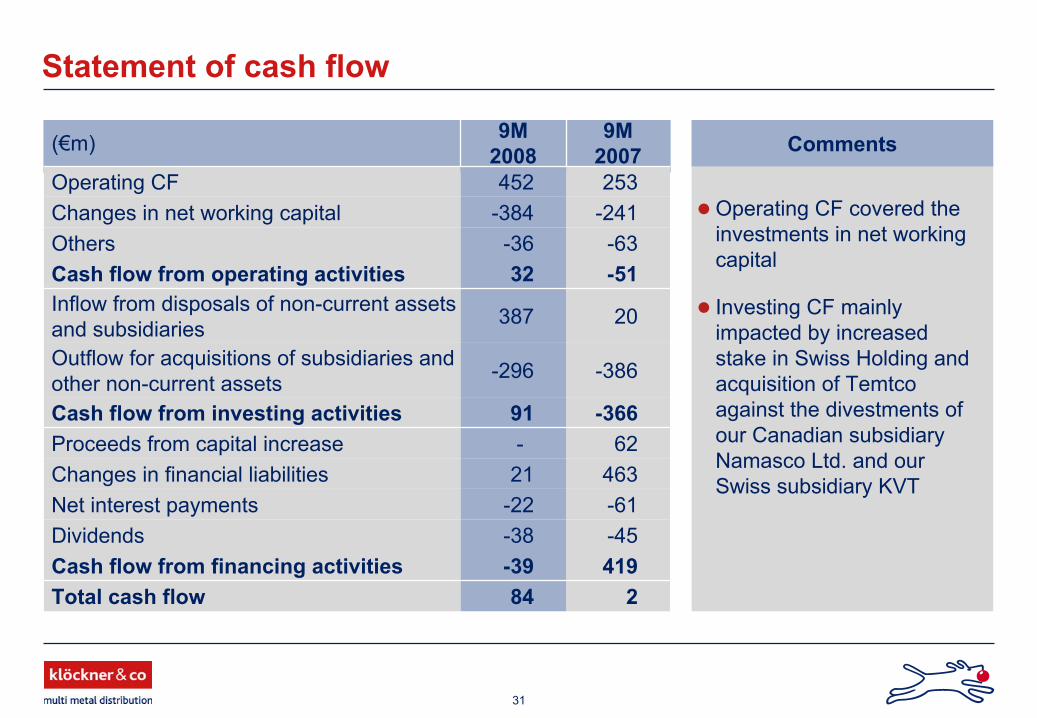
Statement of cash flow
Comments
62-Proceeds from capital increase
-63-36Others-5132Cash flow from operating activities
20387Inflow from disposals of non-current assets and subsidiaries
-386-296Outflow for acquisitions of subsidiaries and other non-current assets
-36691Cash flow from investing activities
-241-384Changes in net working capital
46321Changes in financial liabilities
253452Operating CF
284Total cash flow419-39Cash flow from financing activities-45-38Dividends-61-22Net interest payments
9M2007
9M2008(€m)
Operating CF covered the investments in net working capital
Investing CF mainly impacted by increased stake in Swiss Holding and acquisition of Temtco against the divestments of our Canadian subsidiary Namasco Ltd. and our Swiss subsidiary KVT

32
(€m) Q3 2008
Q22008
Q1 2008
Q4 2007
Q3
2007
Q22007
Q12007
Q42006
Q32006
Q22006
Q12006
FY2007
FY2006
FY2005*
Volume (Ttons) 1,348 1,755 1,720 1,585 1,601 1,663 1,629 1,453 1,467 1,605 1,601 6,478 6,127 5,868
Sales 1.773 1,922 1,660 1,492 1,583 1,650 1,550 1,398 1,394 1,418 1,323 6,274 5,532 4,964
Gross profit 390 462 340 300 286 328 307 294 313 316 285 1,221 1,208 987
% margin 22.0 24.0 20.5 20.1 18.0 19.8 19.8 21.0 22.5 22.3 21.5 19.5 21.8 19.9
EBITDA 413 212 109 83 93 103 92 70 143 104 79 371 395 197
% margin 23.3 11.0 6.6 5.6 5.9 6.2 5.9 4.9 10.3 7.3 6.0 5.9 7.1 4.0
EBIT 395 197 93 65 76 87 78 55 128 89 64 307 337 135
Financial result -18 -17 -17 -17 -17 -52 -10 -12 -24 -14 -14 -97 -64 -54
Income before taxes 378 180 76 48 59 35 68 43 105 75 50 210 273 81
Income taxes -30 -55 -24 -6 -14 -12 -22 16 -20 -22 -13 -54 -39 -29
Minority interests -4 3 2 4 8 4 6 5 8 9 6 23 28 16
Net income 351 122 51 37 37 19 40 54 76 45 31 133 206 36
EPS basic (€) 7.56 2.63 1.09 0.80 0.79 0.41 0.86 1.16 1.64 0.97 - 2.87 4.44 -
EPS diluted (in €) 7.01 2.48 1.06 0.80 0.78 0.41 0.86 1.16 1.64 0.97 - 2.87 4.44 -
Quarterly results and FY results 2008/2007/2006/2005
*
Pro-forma consolidated figures for FY 2005, without release of negative goodwill of €139 million and without transaction costs of €39 million, without restructuring expenses of €17 million (incurred Q4) and without activity disposal of €1,9 million (incurred Q4).

33
Largest independent multi metal distributor
Europe (2007)
Source:
company reports, own estimates
ArcelorMittal
(Distribution approx. 5%)
ThyssenKrupp
BE Group
Other
mill-tied
and independent distributors
11.1%
9.8%
6.4%
1.0%71.7%
Klöckner & Co
Source:
Purchasing Magazine (May 2008), own estimates
North America (2007)
Steel Technologies
Namasco (Klöckner & Co)
Ryerson Reliance Steel
Samuel, Son & Co
ThyssenKrupp Materials NA
Worthington Steel
Carpenter Technology
McJunkin
O'Neal Steel
Mac-Steel
A.M. Castle
4.2%
2.8%
2.2%
2.2%
1.0%1.0%0.9%
1.3%
1.2%1.1%
1.3%
1.8%
1.7%
1.0%
5.1%
Other
71.2%
Russel
Metals
Metals USA
Structure: 67% through distribution, service centersSize in value: ~€71–91bnCompanies: ~3,000 few mill-tied, most independent
PNA Group
Structure: 50-60% through distribution, service centersSize in value: ~€100bnCompanies: ~1,300 only independent distributors
34
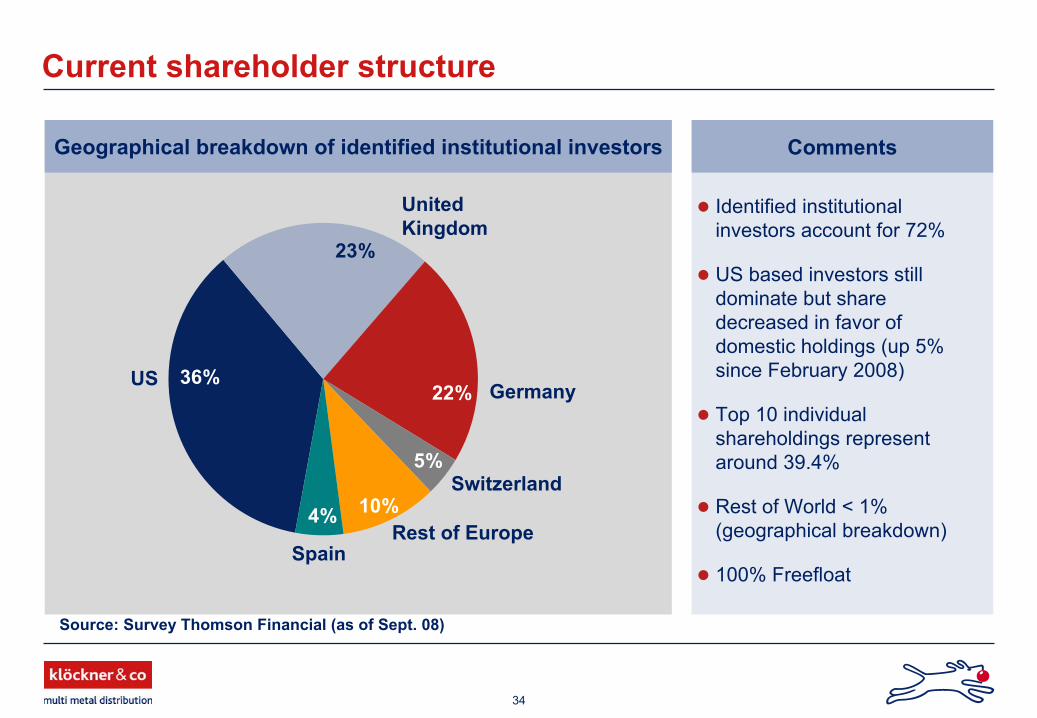
Geographical breakdown of identified institutional investors
Current shareholder structure
Comments
Identified institutional investors account for 72%
US based investors still dominate but share decreased in favor of domestic holdings (up 5% since February 2008)
Top 10 individual shareholdings represent around 39.4%
Rest of World < 1% (geographical breakdown)
100% Freefloat
Rest of Europe
US
United Kingdom
Germany
Spain
Source: Survey
Thomson Financial (as of Sept. 08)
22%
4%
23%
36%
10%
5%Switzerland
35
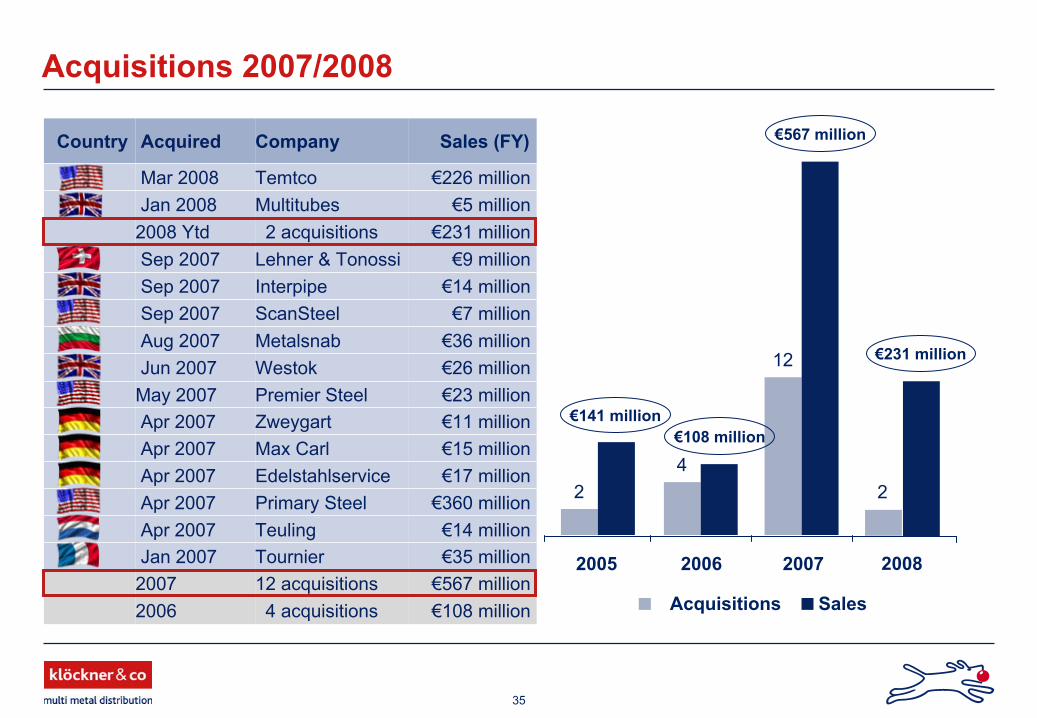
Country Acquired Company Sales (FY)
Mar 2008 Temtco €226 millionJan 2008 Multitubes €5 million
2008 Ytd 2 acquisitions €231 millionSep 2007 Lehner
& Tonossi €9 millionSep 2007 Interpipe €14 millionSep 2007 ScanSteel €7 millionAug 2007 Metalsnab €36 millionJun
2007 Westok €26 millionMay 2007 Premier Steel €23 millionApr
2007 Zweygart €11 millionApr 2007 Max Carl €15 millionApr 2007 Edelstahlservice €17 millionApr 2007 Primary Steel €360 millionApr 2007 Teuling €14 millionJan 2007 Tournier €35 million
2007 12 acquisitions €567 million2006 4 acquisitions €108 million
€141 million
€567 million
Acquisitions 2007/2008
12
42
2005 2006 2007
Acquisitions Sales
€231 million
2008
€108 million
2

36
Our symbol
the earsattentive to customer needs
the eyeslooking forward to new developments
the nosesniffing out opportunities
to improve performance
the ballsymbolic of our role to fetch
and carry for our customers
the legsalways moving fast to keep up with
the demands of the customers
37
Disclaimer
This presentation contains forward-looking statements. These statements use words like "believes, "assumes," "expects" or similar formulations. Various known and unknown risks, uncertainties and other factors could lead to material differences between the actual future results, financial situation, development or performance of our company and those either expressed or implied by these statements. These factors include, among other things:
Downturns in the business cycle of the industries in which we compete;Increases in the prices of our raw materials, especially if we are unable to pass these costs along to customers;Fluctuation in international currency exchange rates as well as changes in the general economic climate
and other factors identified in this presentation.In view of these uncertainties, we caution you not to place undue reliance on these forward-looking statements. We assume no liability whatsoever to update these forward-looking statements or to conform them to future events or developments.