Klöckner & Co - Full Year 2010 Results
30
Klö k &C SE Klöckner & Co SE A Leading Multi Metal Distributor FY 2010 Results Gisbert Rühl CEO/CFO Analysts’ and Investors’ Conference CEO/CFO March 8, 2011
-
Upload
kloeckner-co-se -
Category
Investor Relations
-
view
108 -
download
0
Transcript of Klöckner & Co - Full Year 2010 Results
Klö k & C SEKlöckner & Co SEA Leading Multi Metal Distributor
FY 2010 ResultsGisbert RühlCEO/CFO Analysts’ and Investors’ ConferenceCEO/CFO
March 8, 2011
00 Disclaimer
This presentation contains forward-looking statements. The statements use words like “believe”, “assume”, “expect” or similar formulations. Various known and unknown risks, uncertainties and other factors could lead to material differences between the actual results financial situation development or performance of our company and those either expressedbetween the actual results, financial situation, development or performance of our company and those either expressed or implied in these statements. The factors include, among other things:
• Downturns in the business cycle of the industries we compete in;
• Increases in our raw material prices, especially if we are unable to pass these costs p , p y palong to customers;
• Fluctuations in international currency exchange rates as well as changes in the general economic climate
• d th f t id tifi d i thi t ti• and other factors identified in this presentation.
In view of these uncertainties, we caution you not to place undue reliance on these forward-looking statements. We assume no liability whatsoever to update these forward-looking statements or to have them conform with to future events or developments.
This presentation is not an offer for sale or a solicitation of an offer to purchase any securities of Klöckner & Co SE or any of its affiliates ("Klöckner & Co").
Klöckner & Co securities, including, but not limited to, rights, shares and bonds, may not be offered or sold in the United States or to or for the account or benefit of U S citizens (as such term is defined in Regulation S under the U SStates or to or for the account or benefit of U.S. citizens (as such term is defined in Regulation S under the U.S. Securities Act of 1933, as amended (the "Securities Act")) unless registered under the Securities Act or have an exemption from such registration.
2
Agenda
Highlights01
Financials Q4/FY 201002
Klöckner & Co 202003
Outlook04 Outlook04
Appendix05
3
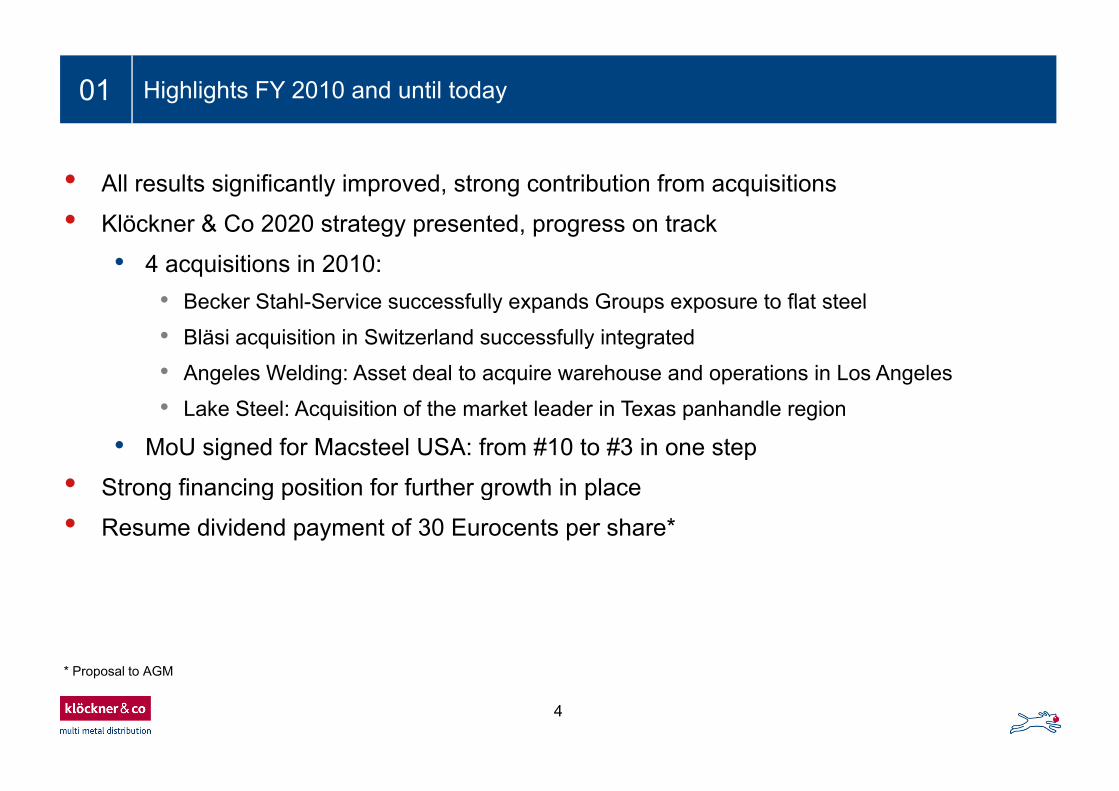
01 Highlights FY 2010 and until today
• All results significantly improved, strong contribution from acquisitions
• Klö k & C 2020 t t t d t k• Klöckner & Co 2020 strategy presented, progress on track
• 4 acquisitions in 2010: • Becker Stahl-Service successfully expands Groups exposure to flat steelBecker Stahl Service successfully expands Groups exposure to flat steel
• Bläsi acquisition in Switzerland successfully integrated
• Angeles Welding: Asset deal to acquire warehouse and operations in Los Angeles
• Lake Steel: Acquisition of the market leader in Texas panhandle region
• MoU signed for Macsteel USA: from #10 to #3 in one step
• Strong financing position for further growth in place• Strong financing position for further growth in place
• Resume dividend payment of 30 Eurocents per share*
4
* Proposal to AGM
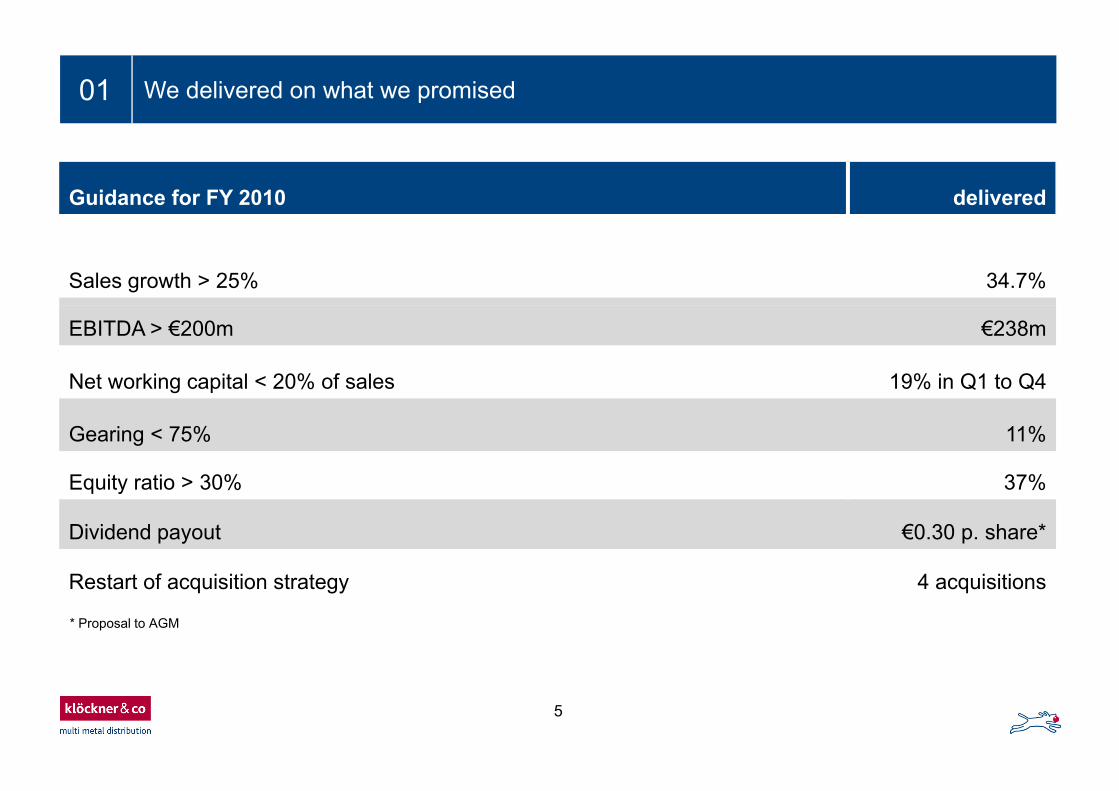
01 We delivered on what we promised
Guidance for FY 2010 delivered
Sales growth > 25% 34.7%
EBITDA > €200m €238m
Net working capital < 20% of sales 19% in Q1 to Q4
Gearing < 75% 11%
Equity ratio > 30% 37%Equity ratio > 30% 37%
Dividend payout €0.30 p. share*
R t t f i iti t t 4 i itiRestart of acquisition strategy 4 acquisitions
* Proposal to AGM
5
01 22 acquisitions since the IPO, 4 in 2010
Acquisitions1) Acquired sales1),2)€~712m
Country Acquired 1) Company Sales (FY)2)
USA Dec 2010 Lake Steel €~50m
USA S 2010 A l W ldi € 30
€567m
GER Mar 2010 Becker Stahl-Service €~600m
CH Jan 2010 Bläsi €32m
2010 4 acquisitions €~712m
US M 2008 T t €226
USA Sep 2010 Angeles Welding €~30m
US Mar 2008 Temtco €226m
UK Jan 2008 Multitubes €5m
2008 2 acquisitions €231m
CH Sep 2007 Lehner & Tonossi €9m
UK Sep 2007 Interpipe €14m
€231
UK Sep 2007 Interpipe €14m
US Sep 2007 ScanSteel €7m
BG Aug 2007 Metalsnab €36m
UK Jun 2007 Westok €26m
US May 2007 Premier Steel €23m
€141m
12 €231mUS May 2007 Premier Steel €23m
GER Apr 2007 Zweygart €11m
GER Apr 2007 Max Carl €15m
GER Apr 2007 Edelstahlservice €17m
US Apr 2007 Primary Steel €360m€108m
2
4
24
US Apr 2007 Primary Steel €360m
NL Apr 2007 Teuling €14m
F Jan 2007 Tournier €35m
2007 12 acquisitions €567m
2006 4 acquisitions €108m
6¹ Date of announcement 2 Sales in the year prior to acquisitions
2005 2006 2007 2008 2009 2010
2006 4 acquisitions €108m

01 BSS shifts exposure of customer industries
Sales by industry
• Exposure to construction industry declined by 3.8% as intended
• Automotive rose by 4.2% due to BSS
• Diversification in customer industries will go on
Sales by marketsSales by product
7
Agenda
Highlights01
Financials Q4/FY 201002
Klöckner & Co 202003
Outlook04 Outlook04
Appendix05
8
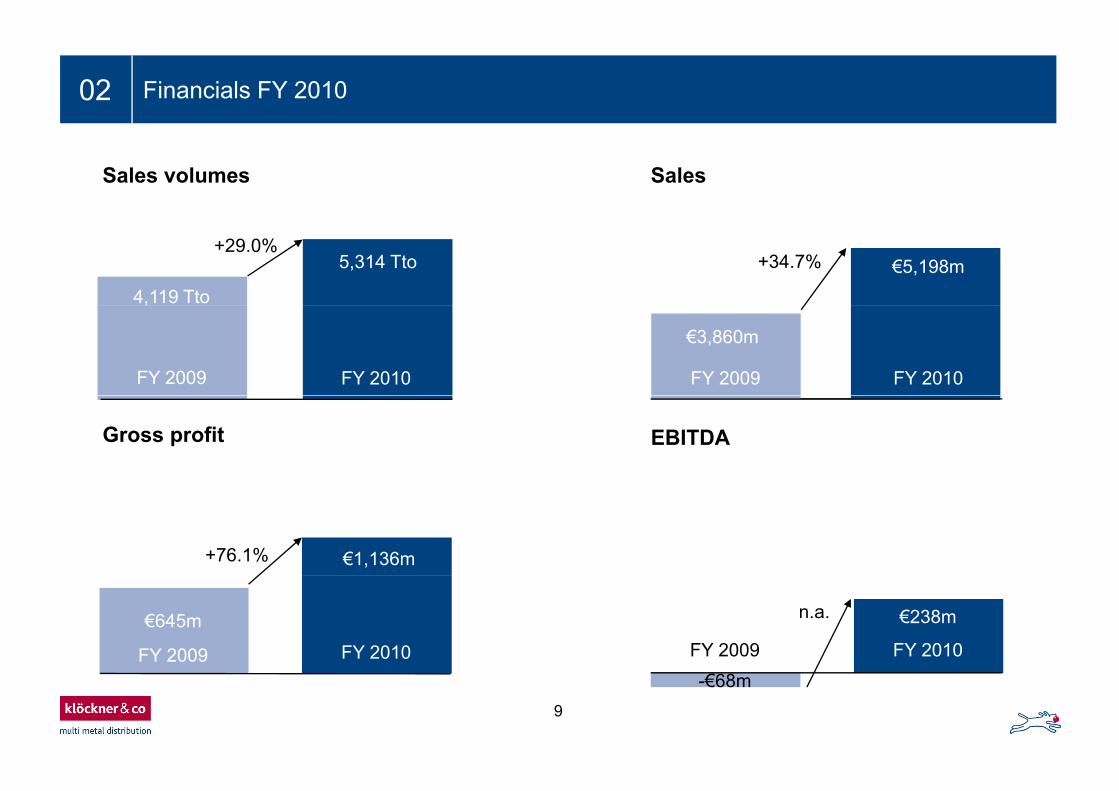
02 Financials FY 2010
SalesSales volumes
€5,198m+34.7%
4,119 Tto
+29.0%5,314 Tto
€3,860m
FY 2010FY 2009FY 2009 FY 2010
EBITDAGross profit
€1,136m+76.1%
€238mn.a.
FY 2010FY 2009€645m
FY 2010FY 2009
9
-€68m
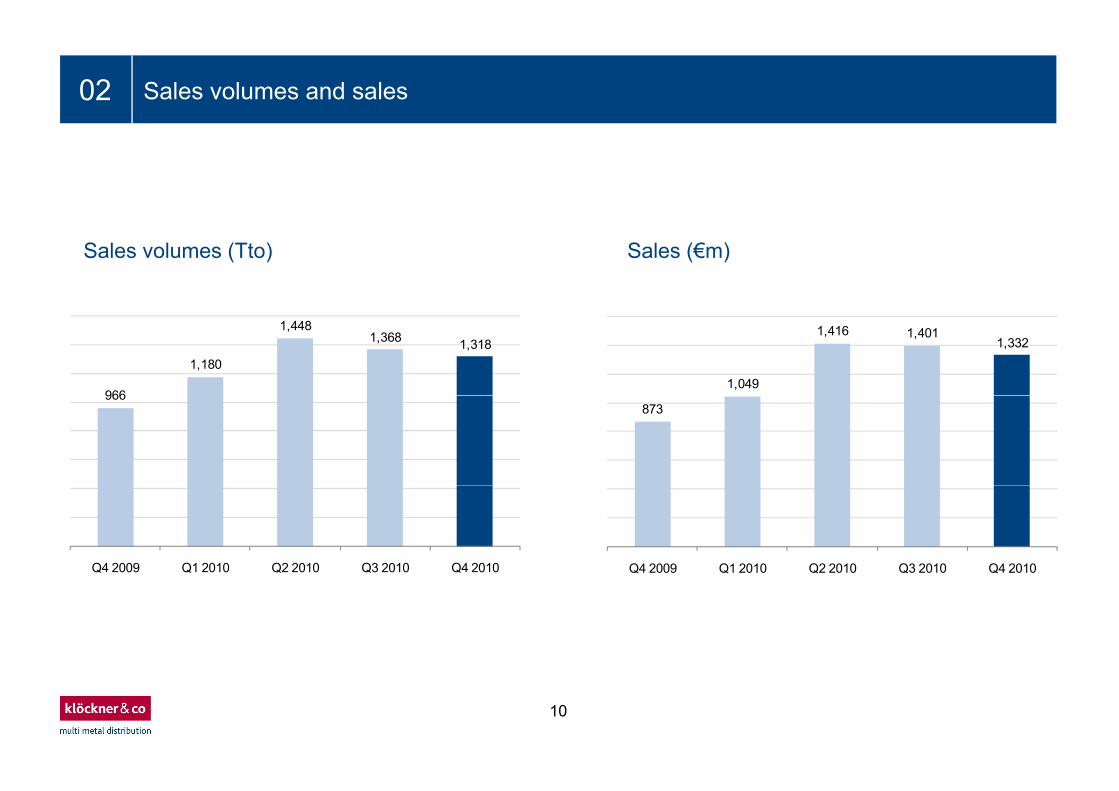
02 Sales volumes and sales
Sales (€m)Sales volumes (Tto)
966
1,180
1,4481,368 1,318
1,049
1,416 1,4011,332
966873
Q4 2009 Q1 2010 Q2 2010 Q3 2010 Q4 2010 Q4 2009 Q1 2010 Q2 2010 Q3 2010 Q4 2010
10
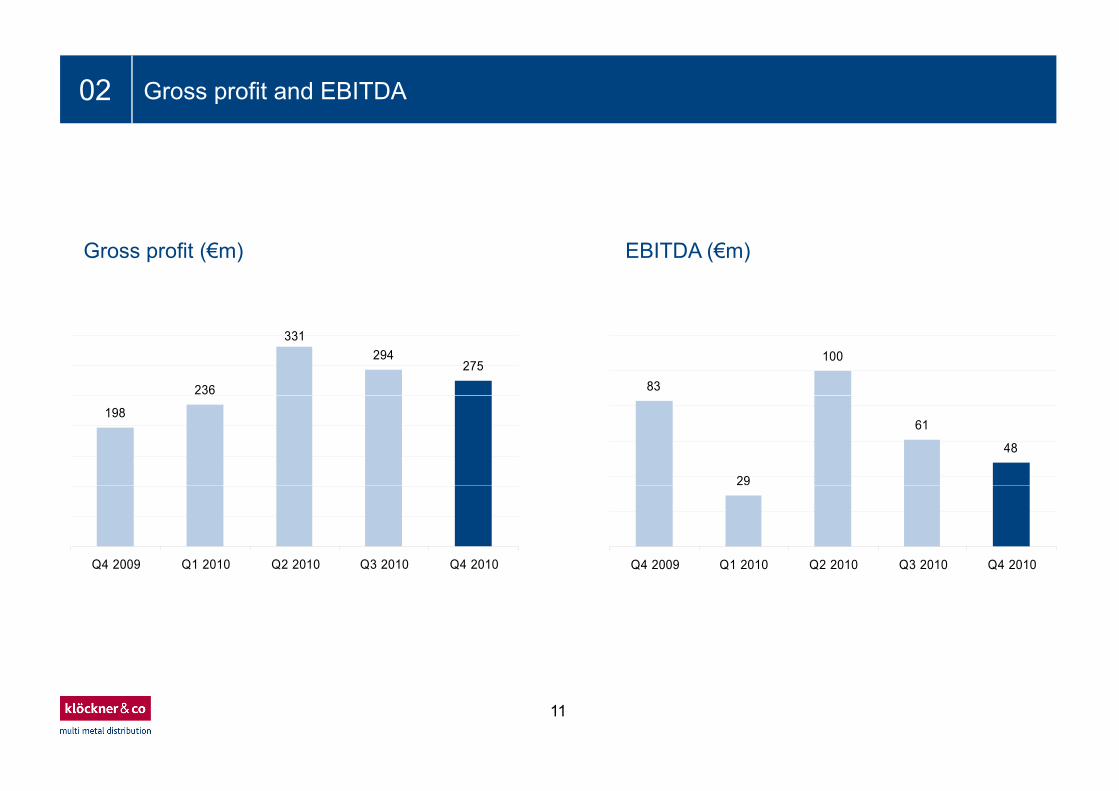
02 Gross profit and EBITDA
EBITDA (€m)Gross profit (€m)
83
100
236
331294
275
29
61
48
198
Q4 2009 Q1 2010 Q2 2010 Q3 2010 Q4 2010Q4 2009 Q1 2010 Q2 2010 Q3 2010 Q4 2010
11
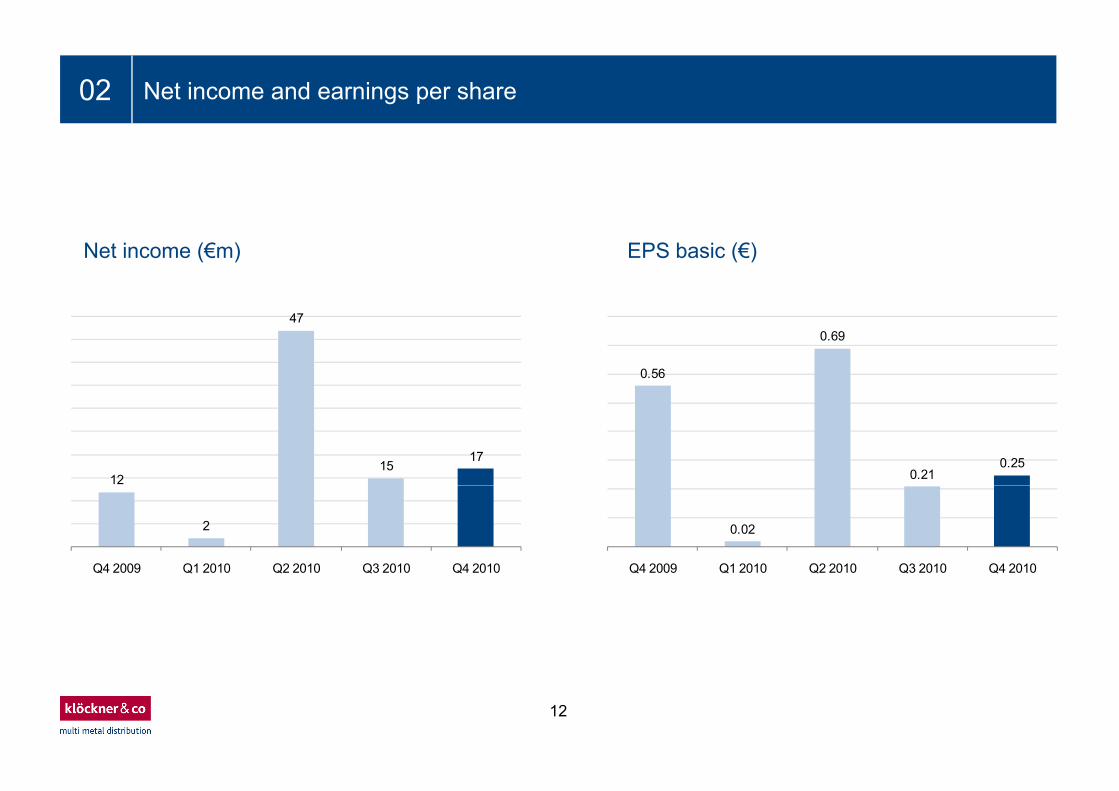
02 Net income and earnings per share
EPS basic (€)Net income (€m)
47
0.56
0.69
1215
170.21
0.25
2
Q4 2009 Q1 2010 Q2 2010 Q3 2010 Q4 2010
0.02
Q4 2009 Q1 2010 Q2 2010 Q3 2010 Q4 2010
12
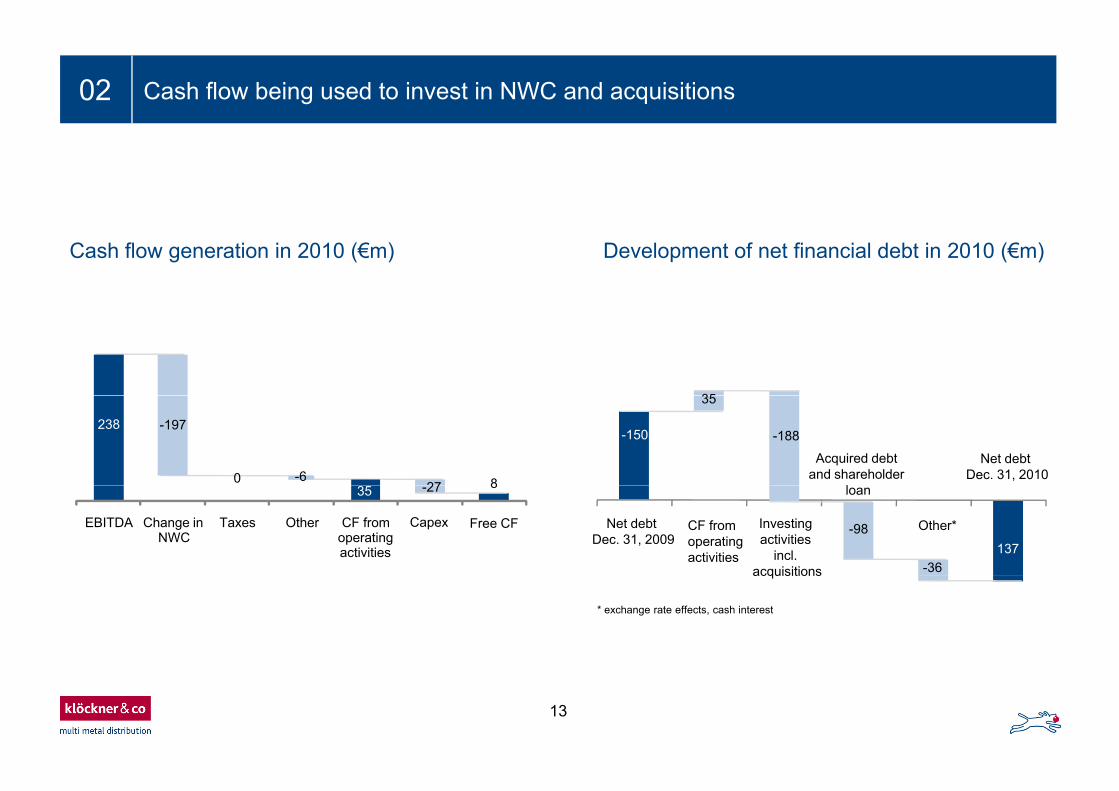
02 Cash flow being used to invest in NWC and acquisitions
Development of net financial debt in 2010 (€m)Cash flow generation in 2010 (€m)
3535
Acquired debt and shareholder
l
Net debt Dec. 31, 2010
-150 -188238 -197
-6
117
027 8
137-98CF from
operating activities
loan
Other*Investing activities
incl. acquisitions
Net debt Dec. 31, 2009
-36
EBITDA Change in NWC
Taxes Other CF from operating activities
Capex Free CF
35 -27 8
* exchange rate effects, cash interest
acquisitions
13
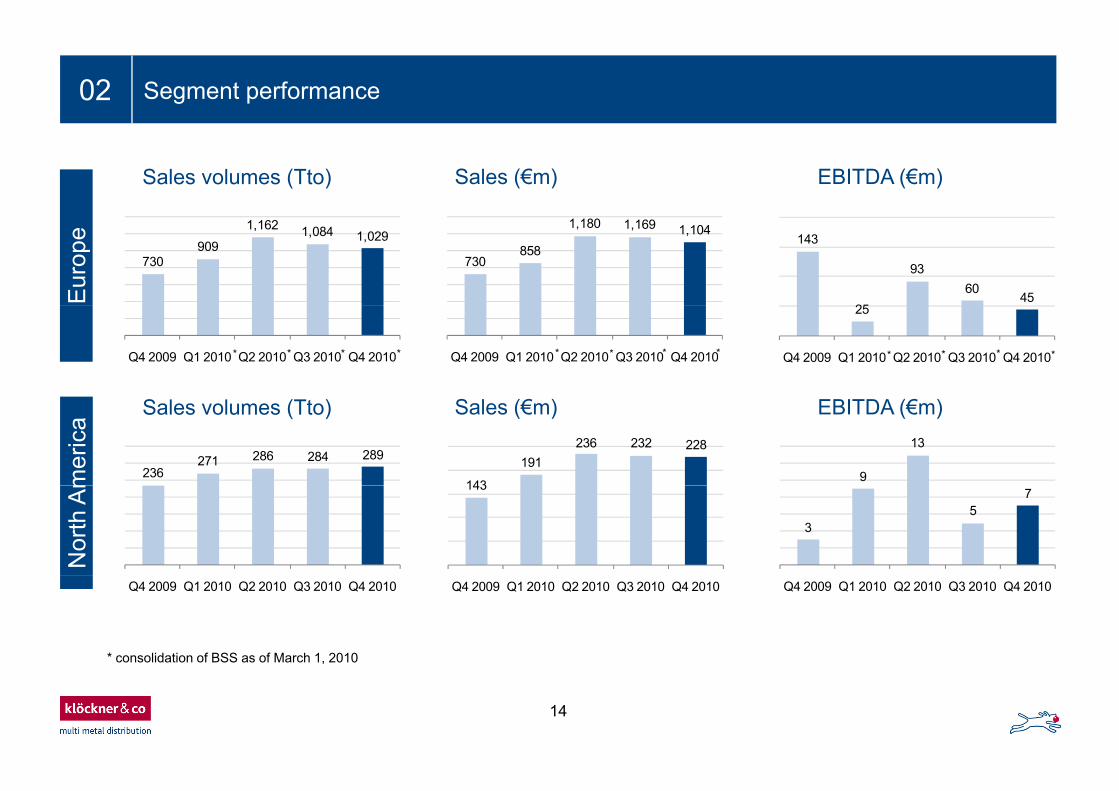
02 Segment performance
Sales volumes (Tto) Sales (€m) EBITDA (€m)
730909
1,162 1,084 1,029 143
25
9360
45Eur
ope
730858
1,180 1,169 1,104
Q4 2009 Q1 2010 Q2 2010 Q3 2010 Q4 2010
25
Q4 2009 Q1 2010 Q2 2010 Q3 2010 Q4 2010** * ** * ** ** *Q4 2009 Q1 2010 Q2 2010 Q3 2010 Q4 2010 *
Sales volumes (Tto) Sales (€m) EBITDA (€m)
mer
ica
236271 286 284 289
143
191236 232 228
9
13
Nor
th A
m 143
35
7
* consolidation of BSS as of March 1, 2010
Q4 2009 Q1 2010 Q2 2010 Q3 2010 Q4 2010 Q4 2009 Q1 2010 Q2 2010 Q3 2010 Q4 2010 Q4 2009 Q1 2010 Q2 2010 Q3 2010 Q4 2010
14
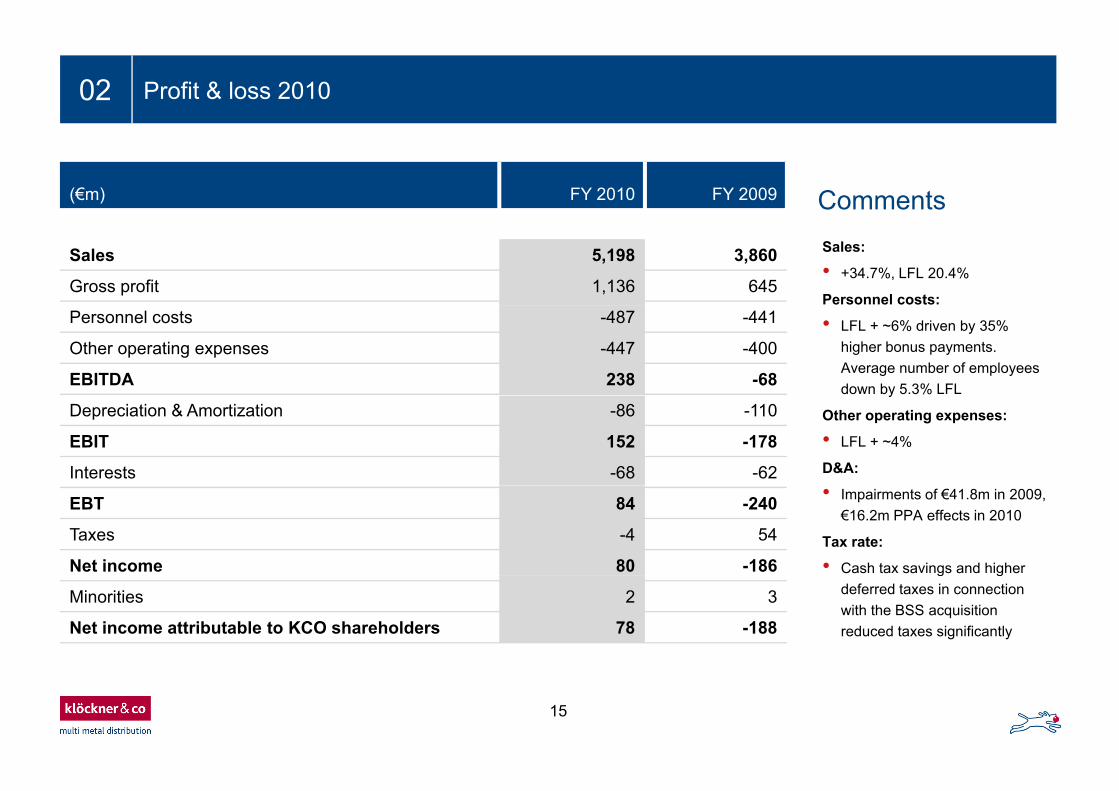
02 Profit & loss 2010
(€m) FY 2010 FY 2009 Comments
Sales 5,198 3,860
Gross profit 1,136 645
Sales:
• +34.7%, LFL 20.4%
Personnel costs:Personnel costs -487 -441
Other operating expenses -447 -400
EBITDA 238 -68
• LFL + ~6% driven by 35% higher bonus payments. Average number of employees down by 5.3% LFL
Depreciation & Amortization -86 -110
EBIT 152 -178
Interests -68 -62
y
Other operating expenses:
• LFL + ~4%
D&A:
EBT 84 -240
Taxes -4 54
Net income 80 -186
• Impairments of €41.8m in 2009, €16.2m PPA effects in 2010
Tax rate:
• Cash tax savings and higher
Minorities 2 3
Net income attributable to KCO shareholders 78 -188
g gdeferred taxes in connection with the BSS acquisition reduced taxes significantly
15
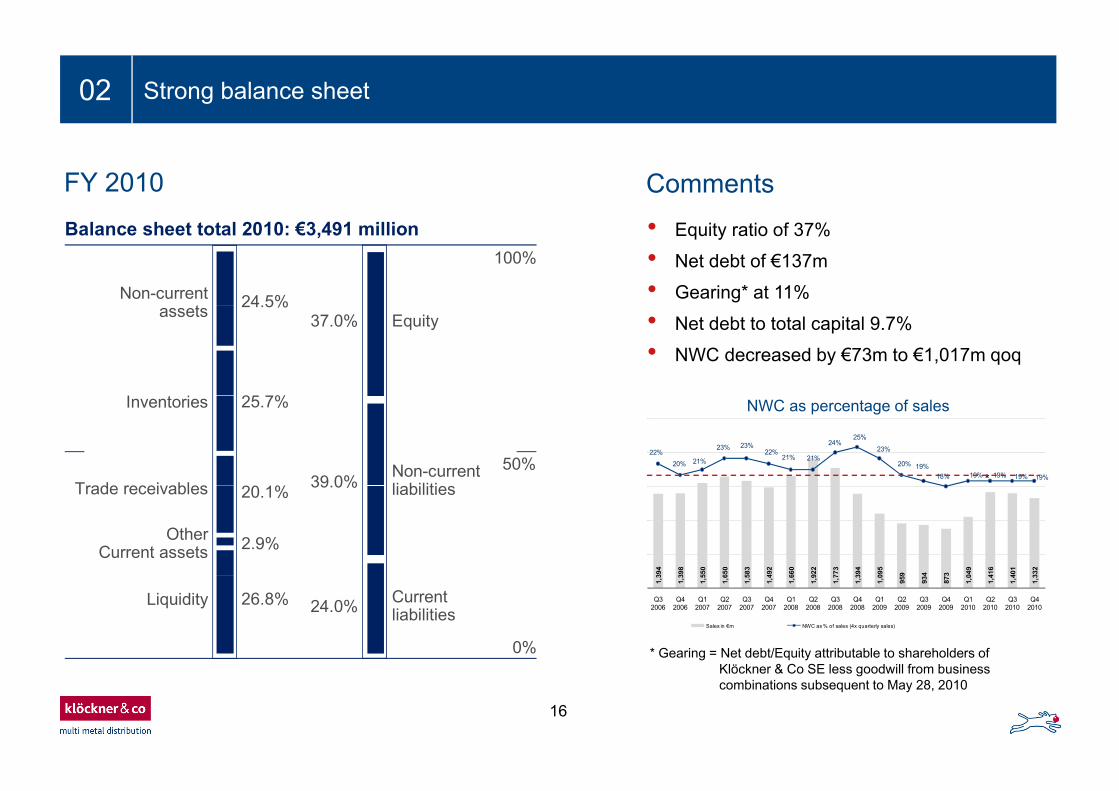
02 Strong balance sheet
FY 2010 Comments• Equity ratio of 37%
• Net debt of €137m
• Gearing* at 11%24.5%
Balance sheet total 2010: €3,491 million
Non-current t
100%
• Net debt to total capital 9.7%
• NWC decreased by €73m to €1,017m qoq
24.5%
25 7%
37.0%assets
I i
Equity
50%
25.7%
% 39 0%
Inventories
Trade recei ablesNon-currentli biliti
22%20% 21%
23% 23%22%
21% 21%
24%25%
23%
20% 19%18% 19% 19% 19% 19%*
NWC as percentage of sales
20.1%
2.9%
39.0%Trade receivables
OtherCurrent assets
liabilities
394
398
550
650
583
492
660
922
773
394
095
9 4 3 049
416
401
332
* Gearing = Net debt/Equity attributable to shareholders of Klö k & C SE l d ill f b i
26.8% 24.0%Liquidity Current liabilities
0%1,
3
1,3
1,5
1,6
1,5
1,4
1,6
1,9
1,7
1,3
1,0
959
934
873
1,0
1,4
1,4
1,3
Q32006
Q42006
Q12007
Q22007
Q32007
Q4 2007
Q12008
Q22008
Q32008
Q42008
Q12009
Q22009
Q32009
Q4 2009
Q1 2010
Q2 2010
Q3 2010
Q4 2010
Sales in €m NWC as % of sales (4x quarterly sales)
16
Klöckner & Co SE less goodwill from businesscombinations subsequent to May 28, 2010
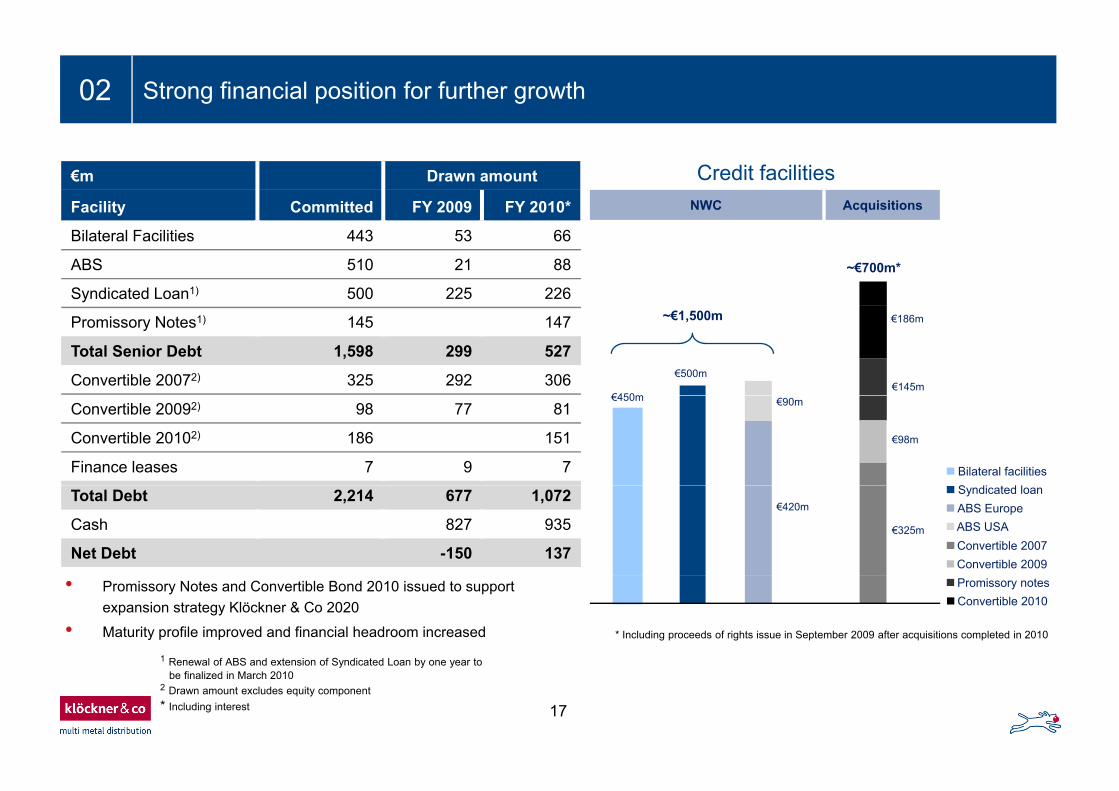
02 Strong financial position for further growth
€m Drawn amount
Facility Committed FY 2009 FY 2010*
Credit facilitiesAcquisitionsNWC
Bilateral Facilities 443 53 66
ABS 510 21 88
Syndicated Loan1) 500 225 226
~€700m*
Promissory Notes1) 145 147
Total Senior Debt 1,598 299 527
Convertible 20072) 325 292 306€450m
€500m€145m
~€1,500m €186m
Convertible 20092) 98 77 81
Convertible 20102) 186 151
Finance leases 7 9 7S di d lBilateral facilities
€450m €90m
€98m
Total Debt 2,214 677 1,072
Cash 827 935
Net Debt -150 137
Syndicated loan
Convertible 2009Convertible 2007
ABS EuropeABS USA
€420m
€325m
1 Renewal of ABS and extension of Syndicated Loan by one year to
• Promissory Notes and Convertible Bond 2010 issued to support expansion strategy Klöckner & Co 2020
• Maturity profile improved and financial headroom increased * Including proceeds of rights issue in September 2009 after acquisitions completed in 2010
Promissory notesConvertible 2010
17
Renewal of ABS and extension of Syndicated Loan by one year to be finalized in March 2010
2 Drawn amount excludes equity component* Including interest
Agenda
Highlights01
Financials Q4/FY 201002
Klöckner & Co 202003
Outlook04 Outlook04
Appendix05
18
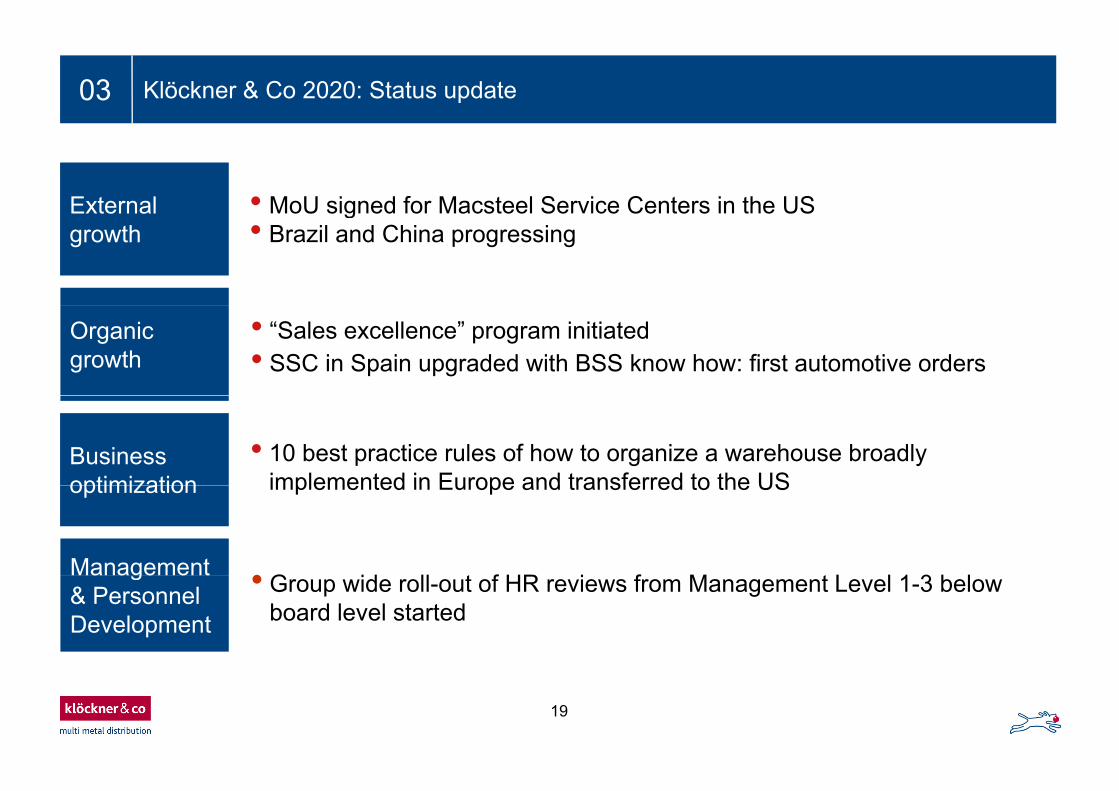
Klöckner & Co 2020: Status update03
External • MoU signed for Macsteel Service Centers in the USgrowth
g• Brazil and China progressing
Organic growth
• “Sales excellence” program initiated• SSC in Spain upgraded with BSS know how: first automotive orders
Business optimization
• 10 best practice rules of how to organize a warehouse broadly implemented in Europe and transferred to the US
Management • G id ll t f HR i f M t L l 1 3 b l
optimization implemented in Europe and transferred to the US
Management & Personnel Development
• Group wide roll-out of HR reviews from Management Level 1-3 below board level started
19
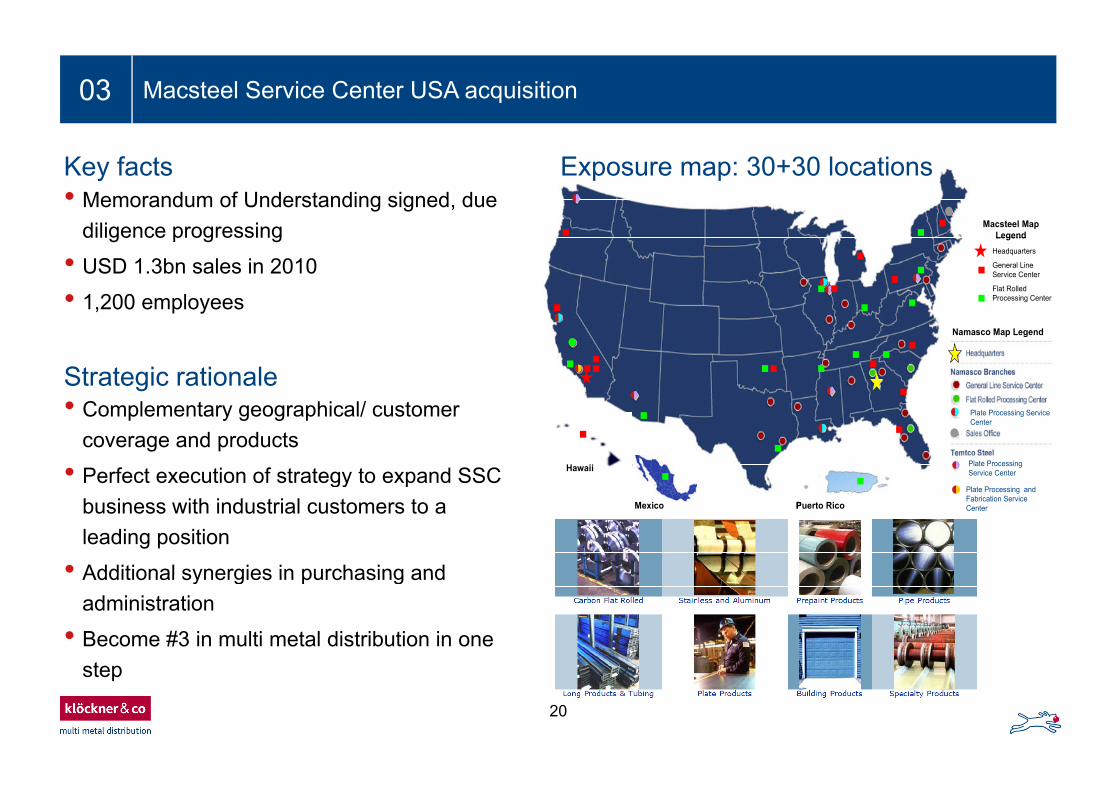
03 Macsteel Service Center USA acquisition
• Memorandum of Understanding signed, due Key facts Exposure map: 30+30 locations
Macsteel Map Legend
Headquarters
General Line Service Center
Flat Rolled Processing Center
Macsteel Map Legend
Headquarters
General Line Service Center
Flat Rolled Processing Center
diligence progressing
• USD 1.3bn sales in 2010
• 1 200 employeesNamasco Map LegendNamasco Map Legend
1,200 employees
Strategic rationale
Plate Processing Service Center
Plate Processing Service Center
Hawaii Plate Processing Service Center
Plate Processing Service Center
Hawaii
• Complementary geographical/ customer coverage and products
• Perfect execution of strategy to expand SSC Plate Processing and Fabrication Service CenterPuerto RicoMexico
Plate Processing and Fabrication Service CenterPuerto RicoMexico
gy pbusiness with industrial customers to a leading position
• Additional synergies in purchasing andAdditional synergies in purchasing and administration
• Become #3 in multi metal distribution in one t
20
step
Agenda
Highlights01
Financials Q4/FY 201002
Klöckner & Co 202003
Outlook04 Outlook04
Appendix05
21
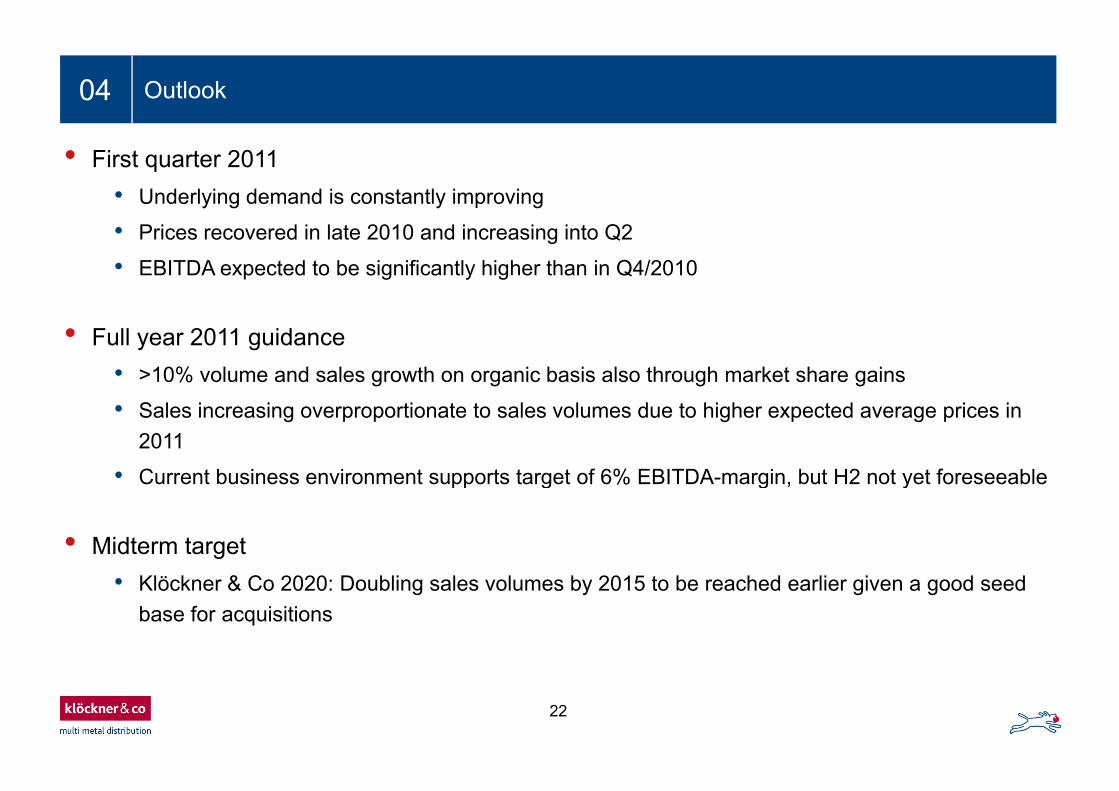
04 Outlook
• First quarter 2011• Underlying demand is constantly improving
• Prices recovered in late 2010 and increasing into Q2
• EBITDA expected to be significantly higher than in Q4/2010
• Full year 2011 guidance• >10% volume and sales growth on organic basis also through market share gains
• Sales increasing overproportionate to sales volumes due to higher expected average prices in 2011
• Current business environment supports target of 6% EBITDA-margin, but H2 not yet foreseeablepp g g , y
• Midterm target& C• Klöckner & Co 2020: Doubling sales volumes by 2015 to be reached earlier given a good seed
base for acquisitions
22
Agenda
Highlights01
Financials Q4/FY 201002
Klöckner & Co 202003
Outlook04 Outlook04
Appendix05
23
05 Appendix
Financial calendar 2011
May 11 Q1 interim report 2011May 11 Q1 interim report 2011
May 20 Annual General Meeting 2011
August 10 Q2 interim report 2011
November 9 Q3 interim report 2011
Contact detailsContact details
Dr. Thilo Theilen, Head of Investor Relations & Corporate Communications
Phone: +49 203 307 2050
Fax: +49 203 307 5025
E-mail: [email protected]
Internet: www.kloeckner.de
24
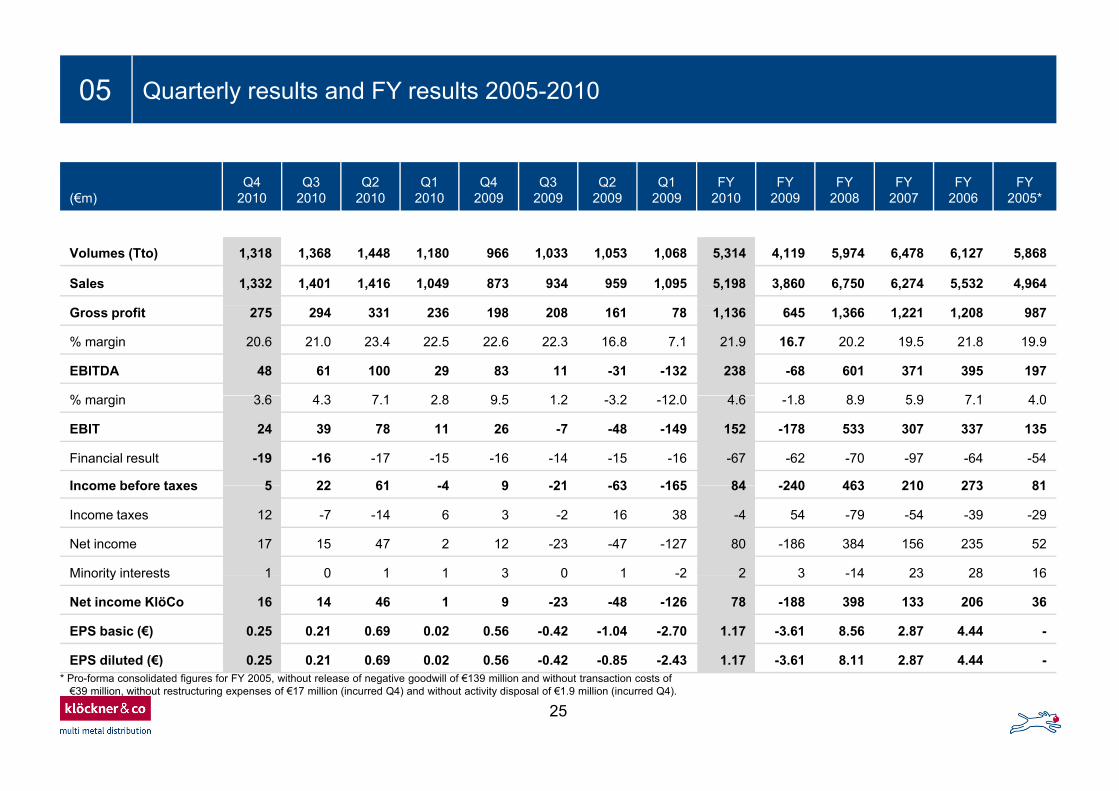
05 Quarterly results and FY results 2005-2010
(€m)Q4
2010Q3
2010Q2
2010Q1
2010Q4
2009Q3
2009Q2
2009Q1
2009FY
2010FY
2009FY
2008FY
2007FY
2006FY
2005*
Volumes (Tto) 1,318 1,368 1,448 1,180 966 1,033 1,053 1,068 5,314 4,119 5,974 6,478 6,127 5,868
Sales 1,332 1,401 1,416 1,049 873 934 959 1,095 5,198 3,860 6,750 6,274 5,532 4,964
Gross profit 275 294 331 236 198 208 161 78 1,136 645 1,366 1,221 1,208 987
% margin 20.6 21.0 23.4 22.5 22.6 22.3 16.8 7.1 21.9 16.7 20.2 19.5 21.8 19.9
EBITDA 48 61 100 29 83 11 -31 -132 238 -68 601 371 395 197
% i 3 6 4 3 7 1 2 8 9 5 1 2 3 2 12 0 4 6 1 8 8 9 5 9 7 1 4 0% margin 3.6 4.3 7.1 2.8 9.5 1.2 -3.2 -12.0 4.6 -1.8 8.9 5.9 7.1 4.0
EBIT 24 39 78 11 26 -7 -48 -149 152 -178 533 307 337 135
Financial result -19 -16 -17 -15 -16 -14 -15 -16 -67 -62 -70 -97 -64 -54
Income before taxes 5 22 61 4 9 21 63 165 84 240 463 210 273 81Income before taxes 5 22 61 -4 9 -21 -63 -165 84 -240 463 210 273 81
Income taxes 12 -7 -14 6 3 -2 16 38 -4 54 -79 -54 -39 -29
Net income 17 15 47 2 12 -23 -47 -127 80 -186 384 156 235 52
Minority interests 1 0 1 1 3 0 1 -2 2 3 -14 23 28 16Minority interests 1 0 1 1 3 0 1 2 2 3 14 23 28 16
Net income KlöCo 16 14 46 1 9 -23 -48 -126 78 -188 398 133 206 36
EPS basic (€) 0.25 0.21 0.69 0.02 0.56 -0.42 -1.04 -2.70 1.17 -3.61 8.56 2.87 4.44 -
EPS diluted (€) 0.25 0.21 0.69 0.02 0.56 -0.42 -0.85 -2.43 1.17 -3.61 8.11 2.87 4.44 -
25
( )* Pro-forma consolidated figures for FY 2005, without release of negative goodwill of €139 million and without transaction costs of
€39 million, without restructuring expenses of €17 million (incurred Q4) and without activity disposal of €1.9 million (incurred Q4).
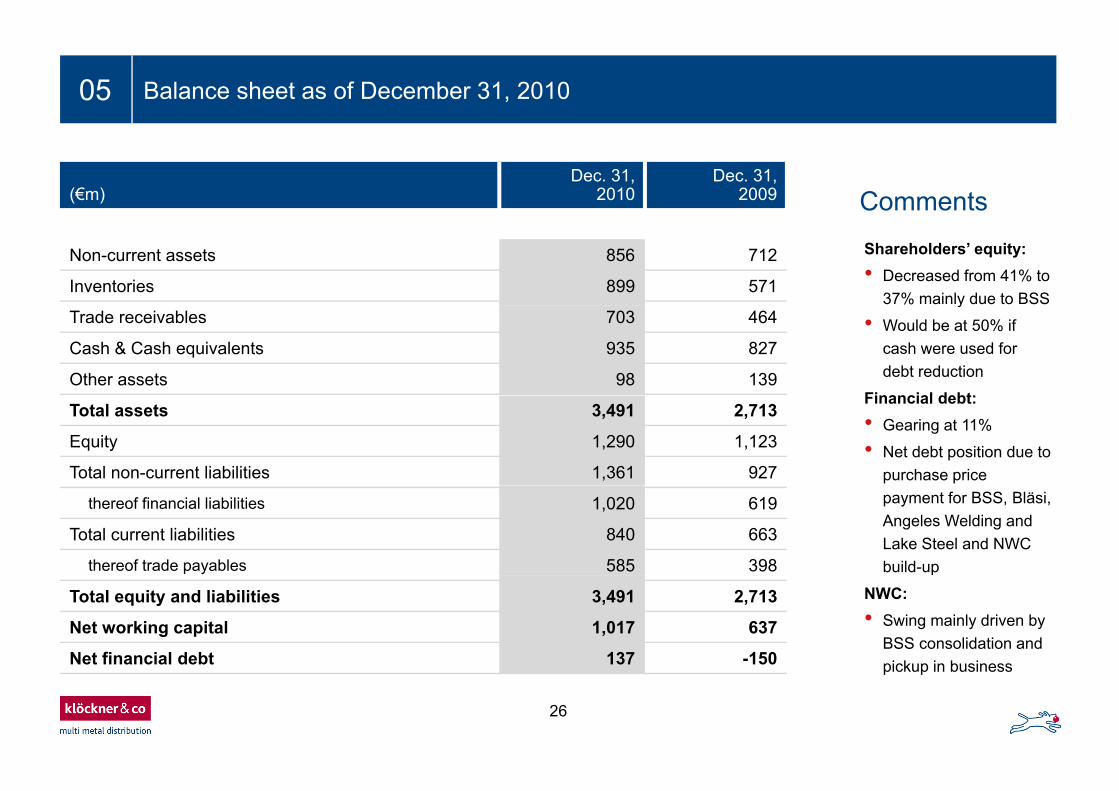
05 Balance sheet as of December 31, 2010
(€m)Dec. 31,
2010Dec. 31,
2009 Comments
Non-current assets 856 712
Inventories 899 571
Shareholders’ equity:• Decreased from 41% to
37% mainly due to BSSTrade receivables 703 464
Cash & Cash equivalents 935 827
Other assets 98 139
y
• Would be at 50% if cash were used for debt reduction
Financial debt:Total assets 3,491 2,713
Equity 1,290 1,123
Total non-current liabilities 1,361 927
Financial debt:• Gearing at 11%
• Net debt position due to purchase price
thereof financial liabilities 1,020 619
Total current liabilities 840 663
thereof trade payables 585 398
payment for BSS, Bläsi, Angeles Welding and Lake Steel and NWC build-up
Total equity and liabilities 3,491 2,713
Net working capital 1,017 637
Net financial debt 137 -150
p
NWC:• Swing mainly driven by
BSS consolidation and pickup in business
26
pickup in business
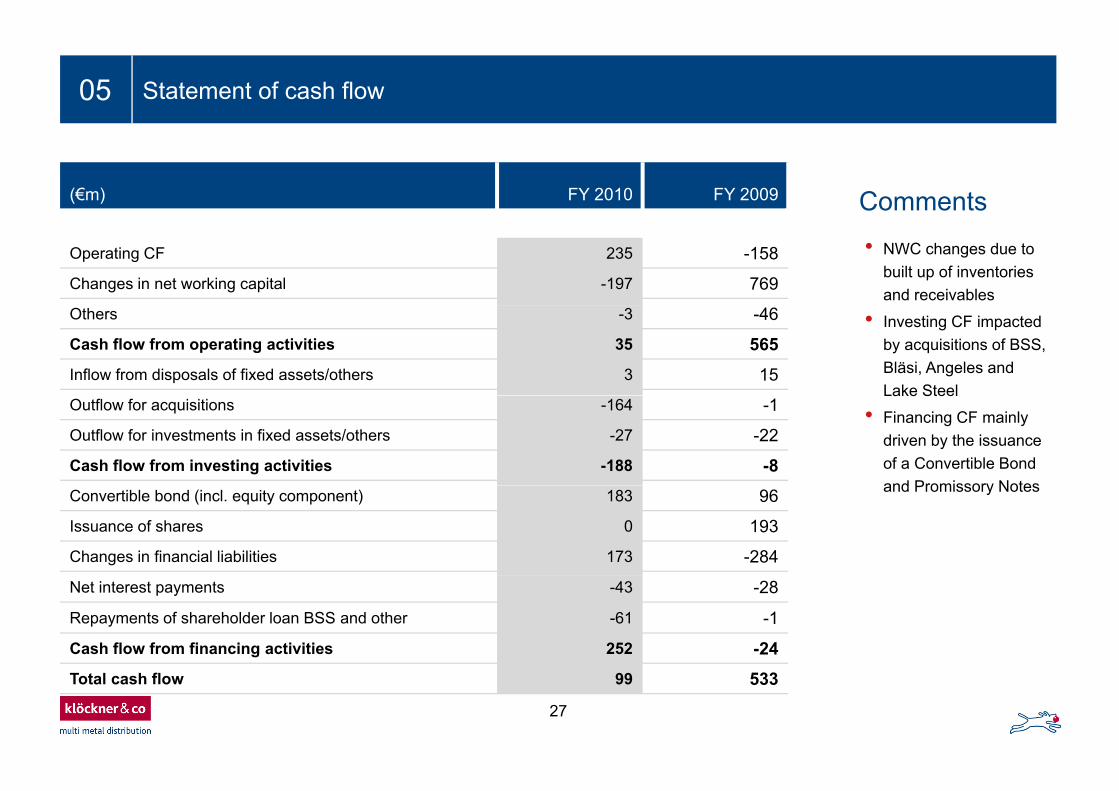
05 Statement of cash flow
Comments(€m) FY 2010 FY 2009
• NWC changes due to built up of inventories and receivables
Operating CF 235 -158
Changes in net working capital -197 769
• Investing CF impacted by acquisitions of BSS, Bläsi, Angeles and Lake Steel
Others -3 -46
Cash flow from operating activities 35 565Inflow from disposals of fixed assets/others 3 15
Lake Steel
• Financing CF mainly driven by the issuance of a Convertible Bond and Promissory Notes
Outflow for acquisitions -164 -1
Outflow for investments in fixed assets/others -27 -22
Cash flow from investing activities -188 -8and Promissory NotesConvertible bond (incl. equity component) 183 96
Issuance of shares 0 193
Changes in financial liabilities 173 -284
Net interest payments -43 -28
Repayments of shareholder loan BSS and other -61 -1
Cash flow from financing activities 252 -24
27
Total cash flow 99 533
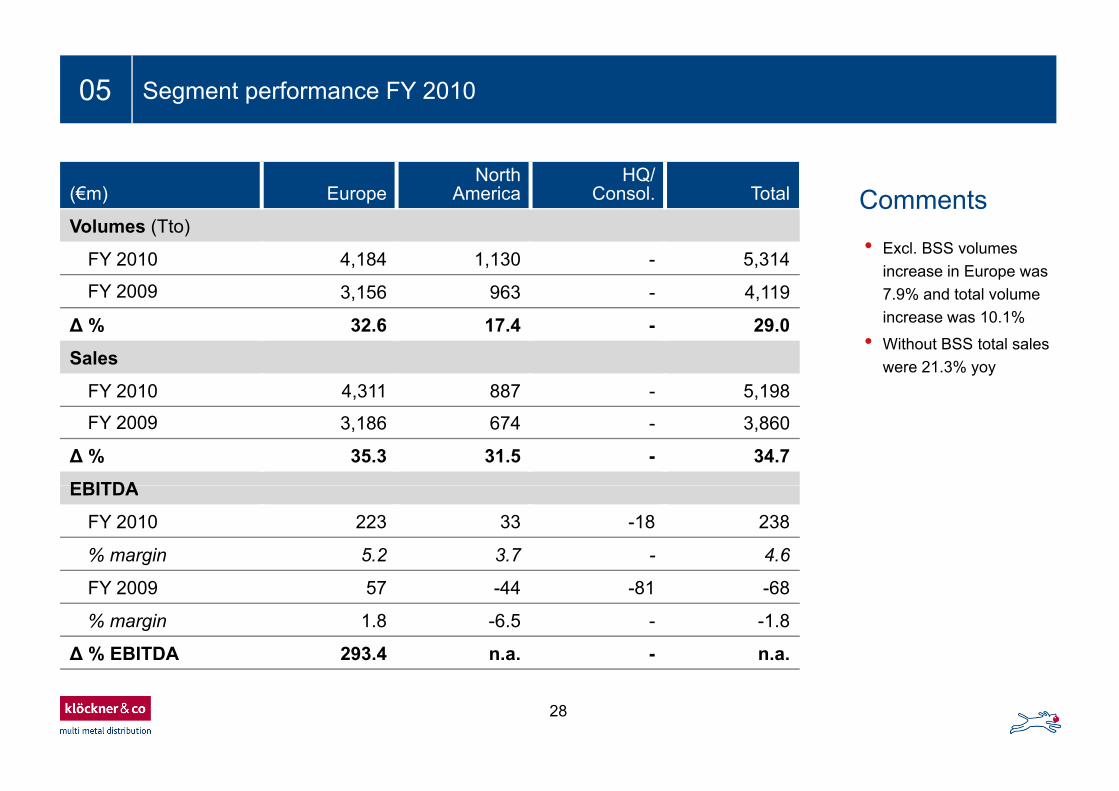
05 Segment performance FY 2010
(€m) EuropeNorth
AmericaHQ/
Consol. Total CommentsVolumes (Tto)
FY 2010 4,184 1,130 - 5,314
FY 2009 3,156 963 - 4,119
• Excl. BSS volumes increase in Europe was 7.9% and total volume
Δ % 32.6 17.4 - 29.0
Sales
FY 2010 4,311 887 - 5,198
increase was 10.1%
• Without BSS total sales were 21.3% yoy
FY 2010 4,311 887 5,198
FY 2009 3,186 674 - 3,860
Δ % 35.3 31.5 - 34.7
EBITDAEBITDA
FY 2010 223 33 -18 238
% margin 5.2 3.7 - 4.6
FY 2009 57 -44 -81 -68
% margin 1.8 -6.5 - -1.8
Δ % EBITDA 293.4 n.a. - n.a.
28
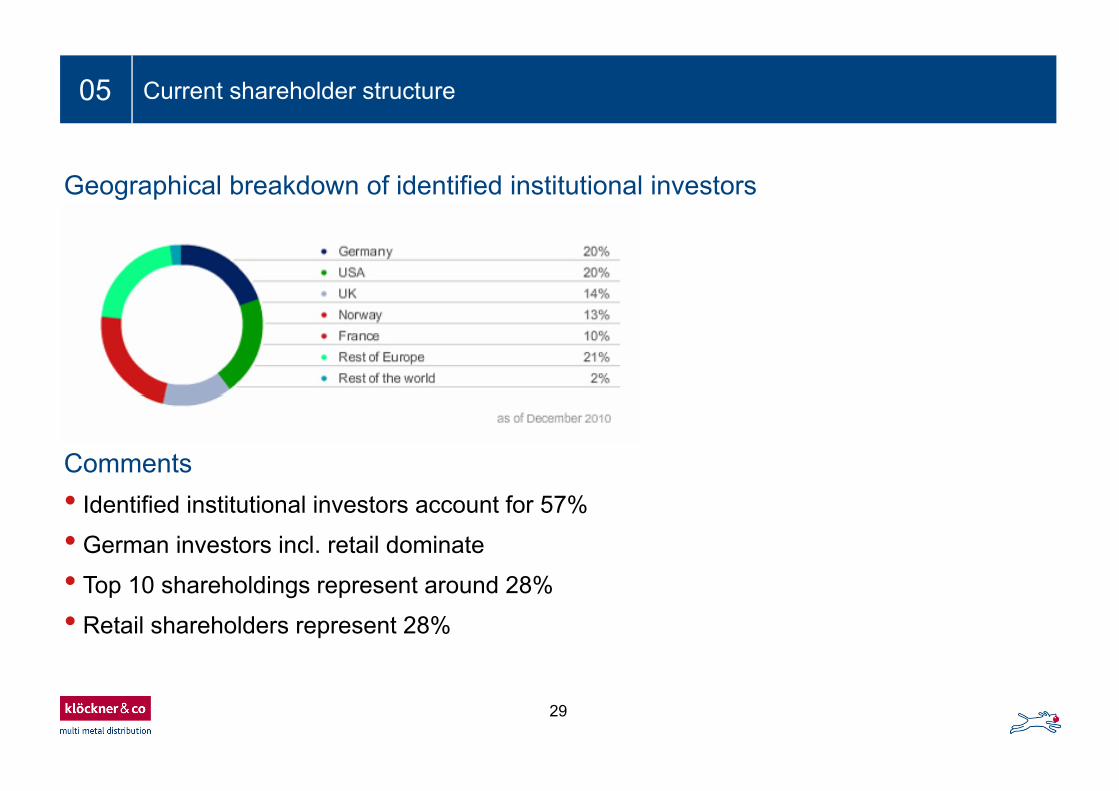
05 Current shareholder structure
Geographical breakdown of identified institutional investors
Comments• Identified institutional investors account for 57%
• German investors incl. retail dominate
• Top 10 shareholdings represent around 28%
• Retail shareholders represent 28%
29
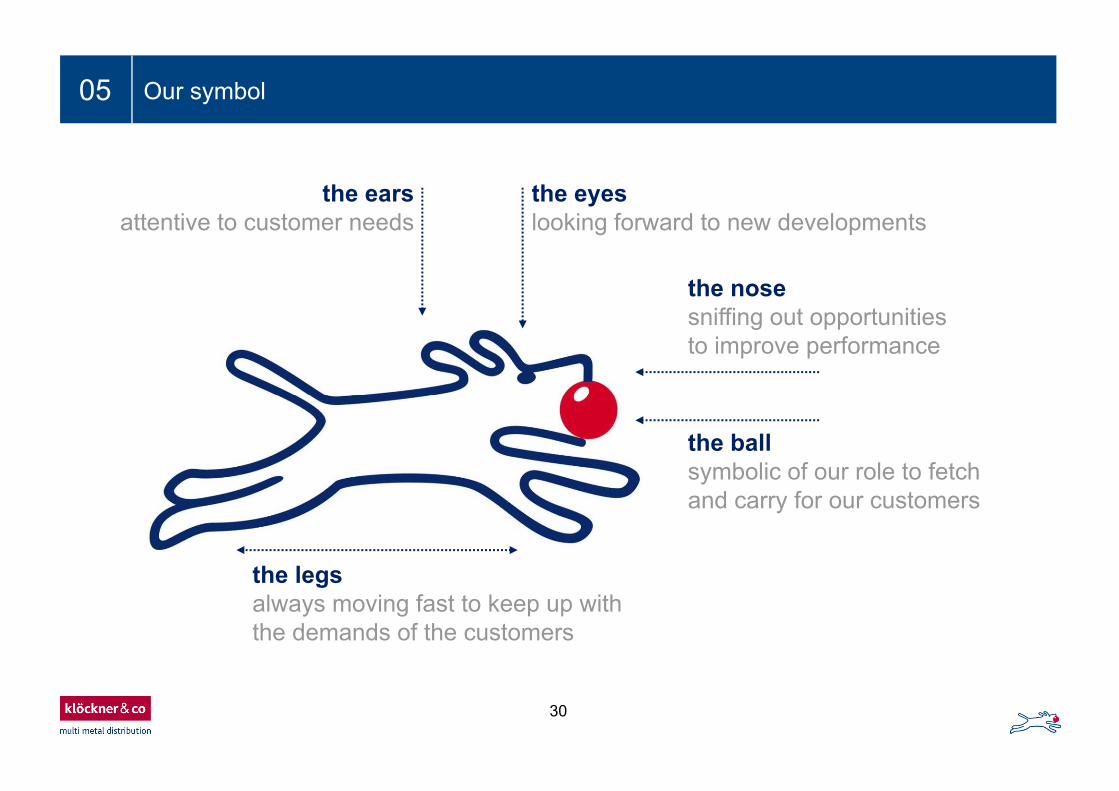
05 Our symbol
the earstt ti t t d
the eyesl ki f d t d l tattentive to customer needs looking forward to new developments
the nosesniffing out opportunitiesto improve performance
the ballsymbolic of our role to fetchand carry for our customers
the legsthe legsalways moving fast to keep up withthe demands of the customers
30