
Kirkpatrick Service Description and Manual
12
Kirkpatrick & Company, Inc. 1 www.charleskirkpatrick.com Kirkpatrick’s Market Strategist Description of Service Purpose of Service The Market Strategist subscription service provides market timing and stock selection based on a long series of studies by Charles D. Kirkpatrick II, CMT (co-author of Technical Analysis: The Complete Resource for Financial Market Technicians, 3 rd ed., Pearson Education as FT Press, New York, 2015.) The weekly and monthly reports offer investment managers timing signals for market trends, designed for the formulation of long-term investment strategies and short-term trading tactics. The reports also provide stock selection using relative price strength analysis, one of the only methods to statistically refute both the efficient markets hypothesis and random walk hypothesis in stock prices. The reports fully disclose the methods, formulas, variables, and parameters included in the timing and selection models. All models are derived through rigorous walk-forward optimizing analysis. Format of Service Weekly: The Weekly Market Strategist is sent to subscribers each weekend, and uses daily market price data to time trends in the U.S stock market, the U.S. long-term bond market, gold, crude oil, and emerging foreign stock markets. The report includes updated intermediate- term charts and a detailed analysis of those charts to derive market-timing signals. It also includes the Bargain List of stocks that have met proscribed relative strength purchase requirements, and a list of additions and deletions to and from the list for that week. The list includes ranks in relative price strength, relative earnings growth, the relative price-to-sales ratio, date and price when added to the list, profit or loss, and a suggested protective stop level for each security. Stock charts include a legend that describes the abbreviated symbols on each chart, and a table describes the Bargain List rules. Monthly: The Monthly Overview is a 9 to 12 page report that provides charts and analysis of intermediate- and long-term trends in the U.S. stock market, U.S bond market, gold, crude oil, industrial raw materials, agricultural product prices, foreign stock markets in aggregate and the Japanese stock market. It occasionally includes the timing results of three economic models that were the subject of the studies reported in my book (Time the Markets: Using Technical Analysis to Interpret Economic Data, Pearson Education as FT Press, 2012) and reports the annual performance of the Bargain List over the past three years. Investment Philosophy Disputing the concept of using diversification as a means of decreasing risk in stock portfolios, my investment philosophy encompasses two principle concepts: market timing and relative strength stock selection.
-
Upload
kirkpatrick-company-inc -
Category
Documents
-
view
244 -
download
4
description
Kirkpatrick & Company, Inc. publishes a weekly and monthly technical letter on trading markets. This publication describes the content, methods used, and performance.
Transcript of Kirkpatrick Service Description and Manual

Kirkpatrick & Company, Inc.
1
www.charleskirkpatrick.com
Kirkpatrick’s Market Strategist
Description of Service
Purpose of Service
The Market Strategist subscription service provides market timing and stock selection
based on a long series of studies by Charles D. Kirkpatrick II, CMT (co-author of Technical
Analysis: The Complete Resource for Financial Market Technicians, 3rd ed., Pearson
Education as FT Press, New York, 2015.) The weekly and monthly reports offer investment
managers timing signals for market trends, designed for the formulation of long-term investment
strategies and short-term trading tactics. The reports also provide stock selection using relative
price strength analysis, one of the only methods to statistically refute both the efficient markets
hypothesis and random walk hypothesis in stock prices. The reports fully disclose the methods,
formulas, variables, and parameters included in the timing and selection models. All models are
derived through rigorous walk-forward optimizing analysis.
Format of Service
Weekly: The Weekly Market Strategist is sent to subscribers each weekend, and uses
daily market price data to time trends in the U.S stock market, the U.S. long-term bond market,
gold, crude oil, and emerging foreign stock markets. The report includes updated intermediate-
term charts and a detailed analysis of those charts to derive market-timing signals. It also
includes the Bargain List of stocks that have met proscribed relative strength purchase
requirements, and a list of additions and deletions to and from the list for that week. The list
includes ranks in relative price strength, relative earnings growth, the relative price-to-sales ratio,
date and price when added to the list, profit or loss, and a suggested protective stop level for each
security. Stock charts include a legend that describes the abbreviated symbols on each chart, and
a table describes the Bargain List rules.
Monthly: The Monthly Overview is a 9 to 12 page report that provides charts and
analysis of intermediate- and long-term trends in the U.S. stock market, U.S bond market, gold,
crude oil, industrial raw materials, agricultural product prices, foreign stock markets in aggregate
and the Japanese stock market. It occasionally includes the timing results of three economic
models that were the subject of the studies reported in my book (Time the Markets: Using
Technical Analysis to Interpret Economic Data, Pearson Education as FT Press, 2012) and
reports the annual performance of the Bargain List over the past three years.
Investment Philosophy
Disputing the concept of using diversification as a means of decreasing risk in stock
portfolios, my investment philosophy encompasses two principle concepts: market timing and
relative strength stock selection.

Kirkpatrick & Company, Inc.
2
www.charleskirkpatrick.com
Market-timing is a controversial subject, rejected by many investment professionals for
its lack of preciseness. Assuming that precision is a hopeless task in any aspect of investment
management, I still can show successful models with simple formulas that manage to reduce
systemic risk through timing the major and minor waves in stock market prices. These models
use either 1) dual, filtered, moving-average crossovers, or 2) models based on Wilder’s DMI and
ADX. These models have all been derived and tested using walk-forward optimization analysis.
Once the market direction has been resolved, relative price strength is the basis for
selection of individual issues. Relative strength has been rigorously studied in academia and
elsewhere and is universally accepted by those who have investigated it as the best means of
selecting stocks. Different calculations of relative strength have been proposed and proven
useful, but I believe the Levy method using a ratio of the closing price to a simple moving
average of the price is the best. It is the basis for my studies and calculations and is one of the
subjects of my book on investment strategy (Kirkpatrick’s Investment and Trading Strategies,
Pearson Education as FT Press, 2014). A decade long track record of this selection method is
reported in the weekly report (see Figure 1).
Investment
Portfolio management requires two sets of decisions. The first decision is concerned with
the risk of capital loss to a general market decline when, regardless of selection method, most
investments lose value. The second decision is what and when to buy and what and when to sell
when the market or stock trend turns favorable. The purpose in all portfolio management should
be to make profits by reducing the risk of loss, not just to “beat the averages.” Beating the
averages during a decline by not losing as quickly as the averages is a ridiculous method of
investing. Protecting capital against loss is the most important aspect of any portfolio
management system. It not only reduces loss but also enhances performance when cash assets
are reinvested, especially at periods of minimum systemic risk.
Portfolio Management
Selection
After 50 years of studying and trading markets, especially the stock market, I’m
convinced that the most reliable method of selecting stocks for investment is the concept of
relative price strength. It is one of the only methods extensively and successfully tested, not only
by myself and other practitioners but also by finance professors in academia. One can make
money in the markets using other methods, some fundamental and some technical, but the best
method, in my opinion, is the use of relative price strength.
The principle selection criterion in my system is the relative price strength ratio. Other
screens having to do with price-to-sales ratios and earnings growth have been included at times
but neither is a profitable as using relative price strength. The stocks selected by this method are
reported weekly in the Bargain list (Blue line in Figure 1) in the Market Strategist letter. Other

Kirkpatrick & Company, Inc.
3
www.charleskirkpatrick.com
vendors calculate the proper ratios, the most reliable being HGSI, a web-based data provider that
can be reached for a free trial at www.highgrowthstock.com
The Bargain List
The Bargain List is the list of those stocks that meet the current ownership criteria. The
specific method by which stocks are added to or deleted from the Bargain list is described in
each weekly letter.
Two sets of performance of the list are graphed. One is the performance of the list itself
without market timing. The other is the list adjusted for market timing based on either a dual,
filtered, moving-average crossover system or the ADX/DMI trading method described below as
it is applied to a longer period. The second list is called the Bargain Portfolio. When the market
direction is bearish, the bargain portfolio liquidates all holdings and awaits a positive turn in the
timing system. Because moving averages lag behind prices, the timing system is always late at
tops and bottoms. It is used to confirm signals generated by the trading method described below
when applied to market averages over longer periods.
Selection Criteria
The universe of stocks that is used to find new additions to the Bargain List begins with
all NYSE, AMEX, and NASDAQ listed stocks. The total list varies but after discarding penny
stocks and very lightly traded stocks, it includes about 8,500 stocks. This list is further filtered
by eliminating stocks with a price below $5 and stocks with a 50-day moving average of dollar-
volume below $50,000,000. This leaves about a universe of about 4,500 stocks to choose from.
I use two kinds of relative strength methods to find new stocks for the Bargain List. Both
methods use a ratio of the weekly closing price to a moving average of past weekly prices. The
“Relative” screen uses a ratio of the weekly closing price to 30-week moving average. This ratio
is calculated for each stock in the universe and then ranked with the highest ratio at the top. The
ranked list is then divided into percentiles such that each percentile includes about 45 stocks.
The top percentile is 99 and the bottom is 0. Only stocks with a percentile of 97 or better are
considered for inclusion in the Bargain List.
The second relative strength method uses a similar ratio but doesn’t rank the results and
is called the “Absolute” method. It looks only for those stocks with ratios above a predetermined
threshold gained from experiment. Currently the ratio is the closing price to its 61-week moving
average, and the buy threshold is 1.47. Thus any stock with both a ratio above 1.47 using this
method and a relative rank in the first method of 97 or better is likely to be included in the list.
On the sell side, I have found that a relative rank below percentile 58, or 1.04 in the
absolute method, is the statistically best time to eliminate a stock from the list using relative
strength.
Selecting what stocks to sell and when to sell them is an easy problem for the investor to
solve if a tested, discipline system is used. Stocks are deleted from the list when they either
Kirkpatrick & Company, Inc.
4
www.charleskirkpatrick.com
break an important previous low as determined by a three-bar reversal, decline in relative
strength below a predefined level, break below a 9-week low, or form a peak in their ADX.
A good sell system will protect investments from individual stock losses by eliminating
them from a portfolio when they fall behind the general market. Unfortunately, most investment
advisors have no standard for selling stocks when they begin to falter. Indeed, many advisors
will buy more shares of a declining stock, believing that the stock is even more attractive.
Nothing could be more dangerous. Test after test has shown that a declining stock price has a
strong tendency to continue downward. Because risk of capital loss is so important to successful
investing, I have always been amazed at this deficiency in professional management. One of the
advantages in using relative price strength is that we also have reliable and tested signals of when
to sell a particular issue.
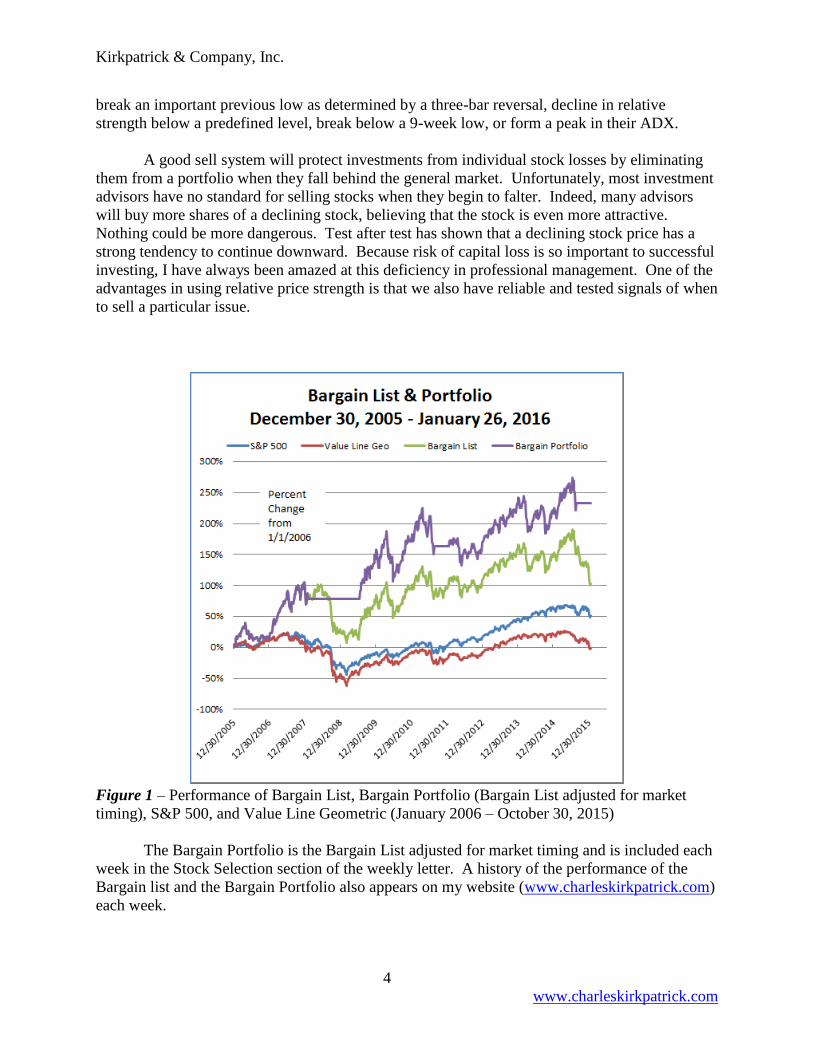
Figure 1 – Performance of Bargain List, Bargain Portfolio (Bargain List adjusted for market
timing), S&P 500, and Value Line Geometric (January 2006 – October 30, 2015)
The Bargain Portfolio is the Bargain List adjusted for market timing and is included each
week in the Stock Selection section of the weekly letter. A history of the performance of the
Bargain list and the Bargain Portfolio also appears on my website (www.charleskirkpatrick.com)
each week.

Kirkpatrick & Company, Inc.
5
www.charleskirkpatrick.com
Market Timing
The two principle methods I employ for market timing are the filtered, dual, moving-
average, crossover system, and the ADX/DMI system devised through experimenting and
testing.
Dual, filtered, moving-average, crossover system
In terms of a portfolio (not individual issues which can be protected from capital loss
through sell stops) one method of reducing systemic risk is the use of market timing. Market
timing is a concept believed by many to be impossible to accomplish. Again, however, the
concept of market timing can be simple. The easiest and best methods I have found so far,
without becoming intensely mathematical, is the use of simple moving averages (SMA) and
Wilder’s DMI and ADX. I have experimented with various combinations of moving averages
and have found that a dual, filtered, moving-average, crossover system is the best. Dual means
that because market tops and bottoms have different configurations, a separate crossover system
is needed for each. Filtered means that each signal must make a crossover by a predetermined
distance before registering as “active”. This lowers the number of whipsaws often seen with
moving average crossovers. Finally, because no system is perfect, each signal must be protected
by stop orders to minimize capital risk even further. The timing signals reduce risk and increase
the likelihood of continuous profit, and the stops add additional safety. The specific parameters
for the crossover systems are described in the Monthly Overview.
Below (Figure 2) is a chart of the signals generated by the dual, moving-average system.
The system is longer-term in nature and suffers from almost no whipsaws. A chart showing the
moving averages is occasionally shown in the Weekly Market Strategist and always in the
Monthly Overview.
Figure 2 – Dual, filtered, moving-average, crossover signals of S&P 500 (weekly: June 2010
through January 2016)

Kirkpatrick & Company, Inc.
6
www.charleskirkpatrick.com
DMI and ADX Timing System
Trading encompasses both long and short positions over short periods, usually just days
or weeks. The Weekly Market Strategist covers shorter-term trends for several commodities, the
long-term interest rate, and stock markets. Directional decisions are based on the behavior of the
DMI, the ADX, (see Indicators below) and a percentage protective stop exit. The principle rules
have now been coded in TradeStation, and walk-forward optimized. All parameters for each
market are disclosed.
Upward Trend - In an upward trend, the DMI is positive (buying pressure is greater than
selling pressure), and the ADX is climbing (the trend is accelerating). Anything less is
suspicious. The first sell signal usually occurs at a peak in the ADX, which tends to peak at the
end of any trend regardless of direction. A sell may also occur when prices decline below a
protective stop. The DMI and ADX use a period of half the dominant cycle in the price data.
This period may change but is always reported. The forward line is a moving average of the
cycle length moved forward by half the cycle length (see “Forward Line Analysis” on page 7).
For example, a 20-day cycle is represented by a 20-day simple moving average plotted 10 days
ahead of the price. The forward line has predictive abilities as well as the DMI and ADX but is
no longer used in the trading system (see Indicators below).
The trading model is based on a crossover in the two DMI lines, positive and negative.
This crossover requires an additional price move beyond the bar (in a bar chart) that caused the
crossover. For example, the positive DMI line (usually shown in blue) crosses above the
negative DMI line (usually shown in red). This is called a positive crossover. The price bar that
occurs at the time of the crossover is called the crossover bar. In a positive crossover, the high
of the crossover bar must be exceeded by a proscribed amount in a following bar for a buy signal
to occur. The amount by which the bar high has to be exceeded is a parameter in the model.
Once that level is broken, unless canceled by a negative crossover, the crossover is considered
confirmed, a buy signal is generated, and the position is assumed to be long. That long position
can be sold either on a peak in the ADX that must reverse direction by a certain parameter
percentage, a confirmed negative crossover, a protective stop or a trailing stop.
Downward Trend - The same rules apply in a downward trend as for an upward trend
only in reverse. However, as in an upward trend, the ADX peaks at the end of the trend.

Kirkpatrick & Company, Inc.
7
www.charleskirkpatrick.com
Figure 3 – Short-term DMI/ADX trading signals on Dow Jones Industrial (daily: January 20,
2015 to December 14, 2015)
Figure 4 – Short-term DMI/ADX trading signals on Dow Jones Industrial (daily: September
1983 to January 2016)
Figures 3 and 4 show how the DMI/ADX method gives timely signals when walk-
forward optimized. Figure 3 is a daily bar chart of the Dow Jones Industrial Average for the year
2015 with the many signals that occurred. When I use monthly bar charts of the Dow Jones
Industrial Average in Figure 4, the signals become less common but just as important. It is these
signals that determine when the Bargain portfolio goes into cash.
Indicators Used in Commentary
Forward Line Analysis
Please refer to the attached chart of the daily S&P 500 (Figure 5).
The forward line is calculated as the dominant cycle’s moving average (from optimizing
the DMI/ADX model) moved one half the cycle length forward. This configuration has many
interesting consequences and shows several aspects of a security’s price behavior.
Notice that the forward line reaches tops when it is rounding over at approximately the
same time as a price low. In Figure 5, for example, the forward line has made a peak, suggesting
that a low is near.

Kirkpatrick & Company, Inc.
8
www.charleskirkpatrick.com
Notice that the price sometimes crosses the forward line and sometimes doesn't. When it
does cross the forward line, it gives a price projection of the distance from the prior peak or
trough from the forward line. When this happens and the price projections are met, the
underlying trend is flat. When the price doesn't cross the forward line, it suggests the underlying
trend is strong. If it does cross and the projection is over run, it suggests a trend reversal, and if
the projection is not met, it suggests the earlier trend is still in effect. There are many other rules,
but these are the basic ones:
A. A cycle low that did not appreciably decline below the forward line indicates the earlier
trend is still in force.
B. A cycle low that did not break the forward line indicates the trend is strongly in the
original direction.
C. The price breaks below the forward line price to the expected cycle low, indicating a
price target at XC, the distance from the peak to the crossover subtracted from the
crossover price.
D. The target XC was exceeded at the cycle low, indicating that the market is becoming
weaker and that the underlying trend is either flattening or reversing.
E. The price breaks above the forward line indicates a price target of 1372.
F. Cycle low occurs above the forward line, and the target from the earlier crossover was
met. The low occurring above the forward line is an indication of trend strength, and
reaching the target is a sign of a flat underlying trend.
G. Price breaks below the forward line early in the cycle period (after only 7 days in a 40-
day cycle), indicating trend weakness and a new target of GX (1295).
H. Price far exceeded the GX projection at 1258. Indicates underlying trend is likely
reversing downward.
I. Price crosses above the forward line. Indicates projected target (IX) of 1348.
J. Price reaches target and indicates the trend is flat to downward - downward slightly
because the high at J fails to exceed the earlier high.
K. Forward line is broken late in cycle and indicates the trend may still be flat. It projects a
target of 1249.
L. L? Target exceeded indicating that the underlying trend is likely downward and that
price will rally back to declining forward line.

Kirkpatrick & Company, Inc.
9
www.charleskirkpatrick.com
Figure 5 – Example of the use of a Forward Line (S&P 500 daily: October 15, 2011 – August
10, 2012)
Average True Range (ATR)
The Standard Range calculation used on bar and candlestick charts is the difference
between the high and low of that bar. An average range therefore is an average of those
individual ranges. This average is often used as a measure of volatility.
The Welles Wilder range is called the True Range and is calculated as below using the
high, low, and previous close of the last two bars.
Standard Price Range = High – Low
Wilder Price Range = the largest of
o Today’s high to low
o Today’s high to yesterday’s close
o Today’s low to yesterday’s close
The graphic in Figure 6 is Wilder’s drawing of the average true range calculation.

Kirkpatrick & Company, Inc.
10
www.charleskirkpatrick.com
Figure 6 – Diagram of Wilder True Range. Source: Wilder, J. Welles. New Concepts in Technical Trading Systems. Greensboro, SC: Trend Research, 1978.
The Average True Range (ATR) uses a special method of averaging concocted by
Wilder that in the example of a 14-bar average, takes yesterday’s ATR multiplied by 13 +
today’s TR, and the whole result then divided by 14.
ATR = [(N-1)*ATR-1 + TR] / N where N is the period.
This measure of price range calculates pure price volatility that is missed in the standard
method, especially in 24-hour markets, because it accounts for all trading activity over a
continuous time rather than that included only in active trading. Unlike standard deviation, it
does not include the trend. It is similar to an exponential moving average because it doesn’t
suffer the drop-off effect that occurs in a simple moving average. It is used in the calculation of
Wilder indicators such as the DMI, ADX & RSI and as a filter for protective stops. It is usually
referred to by its acronym ATR.
Directional Movement (DMI)
As defined by Wilder, directional movement is a measure of trend strength taking into
consideration the net of upward and downward trading pressure. It is calculated as follows:
1) The bar raw figure is the absolute amount by which the 2nd bar trading range
exceeds the 1st bar range, and is measured specifically as whichever is larger
of:
2) The 2nd bar high to the 1st bar high (+DM) or
3) The 2nd bar low to the 1st bar low (-DM).
4) In an “outside” bar, for example, the larger of the two outside ranges is the
directional movement, and in an “inside” bar, no figure is used.
5) All DM’s are positive numbers.
The period (number of bars) is picked, over which the movement is to be measured. The
standard is 14 bars, but can be any length, usually determined through optimization. The
Positive Directional Indicator and Negative Directional Indicator are calculated by averaging,
using Wilder’s method, +DMs and –DMs over the past period and dividing each by the ATR
over the same period. For 14 bars, the formula would look like:

Kirkpatrick & Company, Inc.
11
www.charleskirkpatrick.com
14-bar Positive Directional Indicator (+DI14) = +DM14 / ATR14
14-bar Negative Directional Indicator (-DI14) = -DM14 / ATR14
Figure 7 – Directional Movement of 1000-tick bars showing +DI in blue and –DI in red (S&P E-
mini futures (ES): January 22, 2016)
Notice in Figure 7 that the DI’s often cross each other and give signals as to the next
trend direction. The crossovers are usually late, depending on the length of the DI moving
averages, but similar to any moving average crossover, are useful in signaling the beginning of
longer trends. The earlier “whipsaws” have to be filtered out using price filters.
ADX
If we subtract the –DI from +DI, we get the DX, the directional index. To neutralize the
difference, we divide it by the sum of –DI and +DI, the total of all directional bars, and Wilder
average this figure over some period, say 14 bars. This is called the ADX, and it measures the
intensity of the trend but is independent of trend direction. It tends to peak at the end of trends
and turn upward when a trend increases momentum. It is thus a valuable indicator of when to
close a position and sometimes an indicator of when to add to a position in an existing trend.

Kirkpatrick & Company, Inc.
12
www.charleskirkpatrick.com
Figure 7 – ADX for same period as Figure 6 showing peaks correlated to price position. Blue
arrows designate price troughs, and red arrows designate price peaks. The ADX peaks
thus occur at market turning points, when the earlier trend, up or down, has ended. (S&P
E-mini futures (ES): January 22, 2016)
In Figure 7 notice the ADX peaks at trend completions, up or down, and the ADX
troughs turn upward just as a trend is beginning to increase in momentum, up or down. Likewise,
though not shown with lines, ADX troughs tend to suggest acceleration in the existing price
direction and end with an ADX peak.
Subscription Information
Cost: $195/year.
Delivery: Email notification with link to letter on a specific website address – currently use
ISSUU.com – from which the issue can be downloaded, read, and printed.
Ordering:
1) Mail check to Kirkpatrick & Company, Inc., 1 Bowen Road, Kittery, ME, 03904-
1355.
2) Go to website: www.charleskirkpatrick.com and click on “Market Strategist” tab at
top of the page. On “Market Strategist” page click on the yellow button at lower right
marked “BUY NOW.” This will send you to PayPal where you can either use PayPal
or a private credit card. Just follow the instructions.
Questions, Comments, Suggestions or Complaints: email: [email protected]