
Kirk R. Smith UC Berkeley - California Air Resources … R. Smith UC Berkeley ... Paracelsus •...
31
Regulating indoor air pollution Kirk R. Smith UC Berkeley • Why would you want to do it? • Why not just depend on regulating outdoor air pollution? • How might it be done?
Transcript of Kirk R. Smith UC Berkeley - California Air Resources … R. Smith UC Berkeley ... Paracelsus •...

Regulating indoor air pollution
Kirk R. SmithUC Berkeley
• Why would you want to do it?• Why not just depend on regulating outdoor
air pollution?• How might it be done?
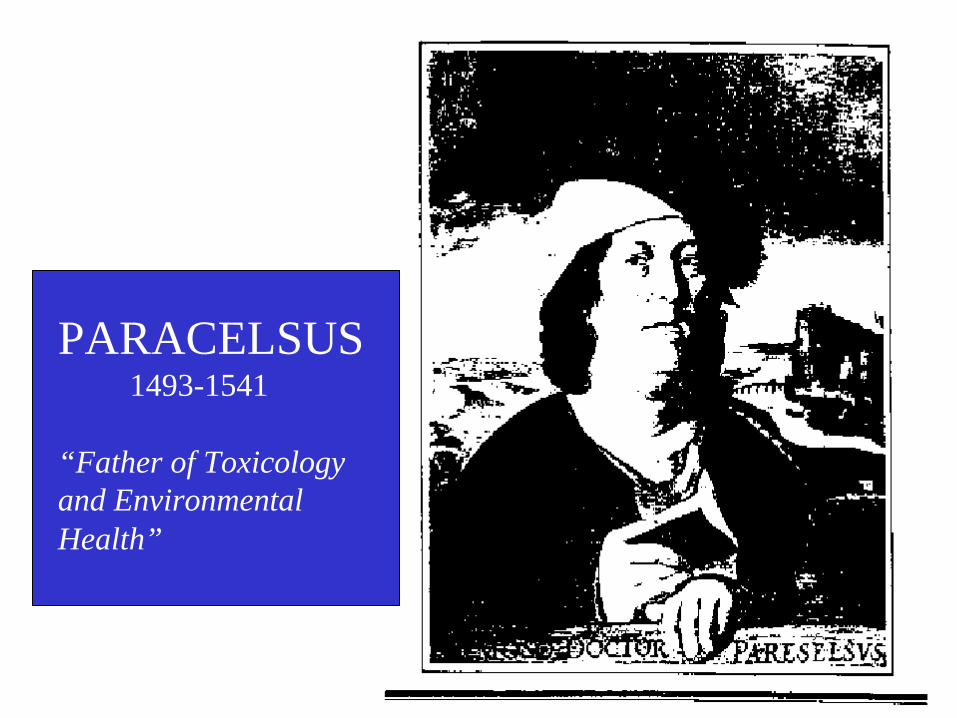
PARACELSUS 1493-1541
“Father of Toxicologyand Environmental Health”
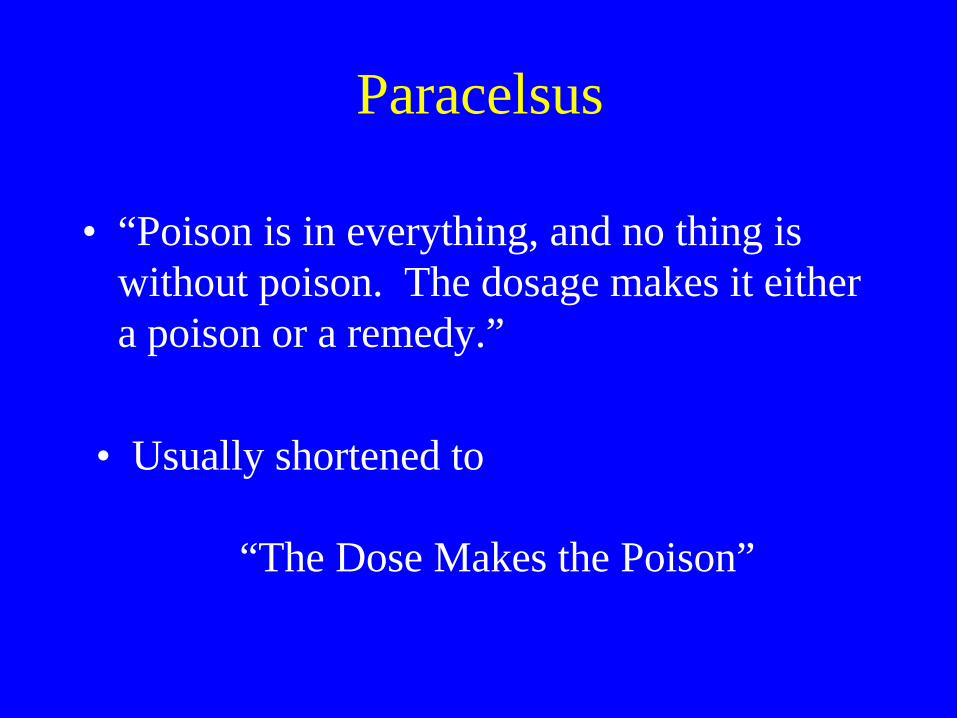
Paracelsus
• “Poison is in everything, and no thing iswithout poison. The dosage makes it eithera poison or a remedy.”
• Usually shortened to
“The Dose Makes the Poison”

In environmental health, ‘dose makes thepoison” is commonly elaborated as
The Environmental Pathway:

Exposure
Indicates the degree to which the pollutionactually reaches the breathing zone ofpeople. It depends on the amount ofpollution, the number of people, and thetotal time.

Wallace’s Maxim
To obtain the most realisticunderstanding of pollution healtheffects and their implications, it isnecessary to:
“Measure where the people are”
Lance Wallace, USEPA

National Emissions
0 20 40 60
Autos
Coke Ovens
Chemicals
Other Outdoor
Indoor
Workers
ETS
Smoking
Percentage
National Exposures
0 20 40 60
Autos
Coke Ovens
Chemicals
Other Outdoor
Indoor
Workers
ETS
Smoking
PercentageInvoluntary Exposures
0 20 40 60
Autos
Coke Ovens
Chemicals
Other Outdoor
Indoor
Workers
ETS
Percentage
Benzene Pollutionin the USA ~1990
<1%
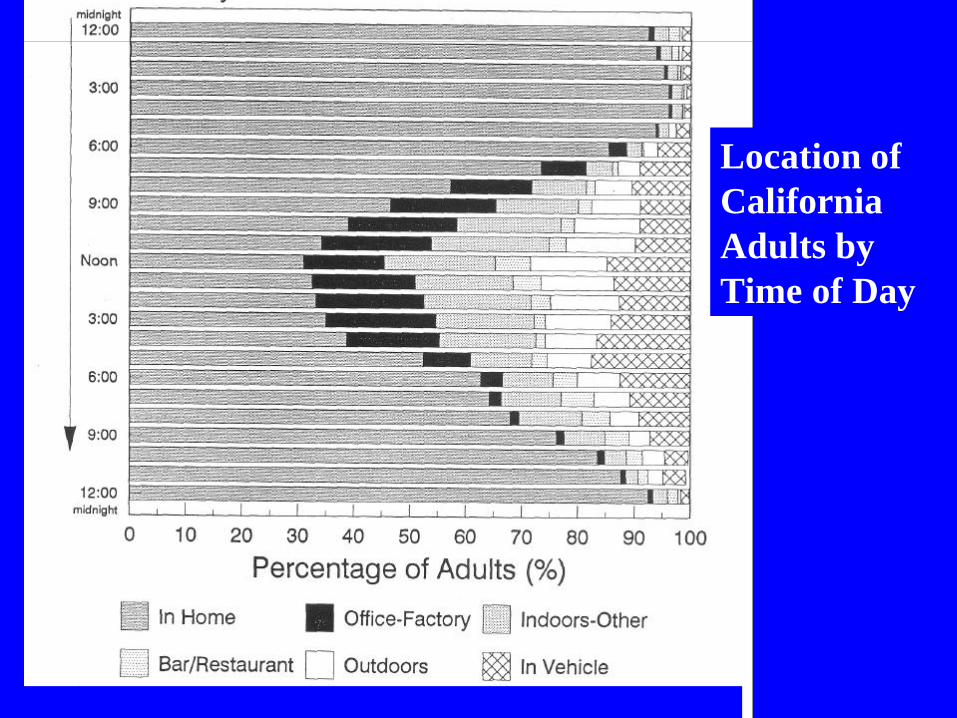
Location ofCaliforniaAdults byTime of Day

Exposure considers where the people are
Where are the people?•How many, where, when, and forhow long?•Which kind of people (age, sex, healthstatus) doing what (resting, working)

Indoor Air Pollution
• People spend an average of 90 percent oftheir time indoors while some at-risksubgroups such as the elderly, very young,and chronically ill may spend nearly alltheir time indoors.

Sources of Indoor Air Pollution
• Fuel burning: wood, coal, kerosene, oil, gas• Burning of tobacco, incense, mosquito coils• Cleaning products• Furnishings, carpets• Paints• Radon from the ground• Moisture, molds, mildew, etc.

Major Sources of Emissions andExposures in the USA
Pollutant Effect Emissions Exposures Particles Resp Disease Autos, industry ETS
Benzene Leukemia Autos, industry ETS, household products
Tetrachloro- ethylene
Cancer Dry-cleaning Dry-cleaned clothes
Chloroform Cancer Sewage plants Chlorinated water in showers
Nitrogen Dioxide
Resp. Disease Autos, industry Gas Stoves
Carbon Monoxide
Heart Disease Autos Driving, gas stoves

Why does outdoor pollution link sowell with health effects if indoor air
pollution is important?
• If, personal exposures are what cause healtheffects, and
• Personal exposures are affected by both outdoorand indoor pollution, and
• Indoor pollution exposure is often as important ormore so than outdoor pollution; then
• Why does it work so well to determine healtheffects by examining only outdoor pollution andignoring indoor?

Airborne Particle Risks: Utah Valley Study
1.01.02
1.041.06
1.12
0.981.00
1.021.041.061.08
1.101.121.14
0 20 40 60 80 100
Daily PM-10 Concentration
Rel
ativ
e R
isk
of D
eath
Sample Exposure-Response Relationship
µg/m3
Outdoor Only!

Air ExchangeRate
Indoor and outdoor pollution
Indoor pollutionsource
Indoor concentrations
Exposuresare due both to indoorsources andoutdoor pollutionpenetratingindoors
OutdoorPollution

Outdoor air pollution epidemiology
• Changes in outdoor pollution are compared tochanges in health effects– Time-series study: outdoor air pollution goes up, health
effects go up next day– Cohort studies: outdoor pollution is higher in one city
over a year than in another as are health effects• Indoor sources, however, do not vary in the same
way as outdoor pollution.– They may go up/down on a daily or weekly schedule,
but not in the same way as outdoor pollution– Except for such important factors as smoking, which
are accounted for in the studies, they do not varyannually according to city.

Exposure
Response
Exposure/responserelationshipbased on differencesi.e., the slope
Absolute risk based on total exposure
Outdoor Indoor

How would exposure be used insteadof ambient concentrations in policy?
• Measure personal exposure?– Expensive, intrusive, difficult– Not practical for routine application
• Categorize and rank emission sources bytheir exposure implications?

This Can be Done Though the Concept ofIntake Fraction (IF)
• IF is the fraction of material emitted thatcrosses some person’s physiologicalbarriers (skin, GI tract, Resp. tract, etc.)
• For air pollution, IF is the fraction breathedin by the exposed population.

IF = 1.0

Intake Fractions : these are rough calculations for typicalexamples of sources in each class
Grams Inhaled per Ton Emitted
0.1 1 10 100 1000 10000 100000 1000000
Cigarette - mainstream
ETS
Stove Vented Indoors
Stove Vented Outdoors
Neighborhood Sources
Vehicles
LDC Power Plant
US Coal Power Plant
Smith, 1993

Exposure effectiveness or intake fraction
• Where a pollutant is released is as important aswhat is released
• “Rule of One Thousand” = Pollutants releasedindoors are about 1000 times more likely to reachsomeone’s lungs than if released outdoors.
• This has significant effects on the relativeimportance of different pollution sources.
• For example, even though there is more than 40times more particle pollution released from UScoal power plants than from cigarettes, a 3%reduction in passive smoking would be equivalentto eliminating all the power plants in the countryin terms of particle exposure to people.

Comparisons of Annual PopulationIntakes in California Based on
IF Calculations
• Vehicles– 140 t CO– 12-40 kg benzene– 400 kg PM
• ETS– 8 t CO– 35 kg benzene– 1300 kg PM Nazaroff & Lai,
2000

Environmental Tobacco SmokeStrong Evidence (dozens of studies)
• Acute Lower Respiratory Infections inchildren under 5 OR= 1.4-1.7
• Otitis Media in children under 5: OR= 1.1-2.0
• Asthma attacks in children under 15: OR= 1.2-1.6
• Lung cancer in adults: OR= 1.1-1.4

Growing Evidence of otherETS Health Impacts
• Heart disease• Stroke• Low birth weight, stillbirth, and other
adverse pregnancy outcomes• Sudden infant death syndrome

Intake fraction varies because emissions are afunction of where and when the people spend time
Where are the people?•How many, where, when, and forhow long?•Which kind of people (age, sex, healthstatus) doing what (resting, working)
What is the relationof the source toexposure? (intakefraction)

Instead of Emissions Regulation, couldthere be Exposure Regulation?*
How would it be done?• Establish IFs for all major source categories• Weight emissions by IFs to determine nominal intakes• Regulate by nominal intake quantities, not emissions.
Problems• Could acceptable and repeatable methods to determine
IFs be established?• Would the (sometimes substantial) difference in control
priorities be politically acceptable?
* Or Trading

What regulatory levers are available?
• Appliance standards• Fuel standards• Building codes• Consumer product regulations• Rules for operation of hospitals, schools, nursing
homes, and other places with vulnerable groups• Public information and education• Medical interventions, for example, prescribing air
cleaners• More………..

Environmental Pathway
Best Controls Best MeasurementsMost Concern
Bottom lines1. For health, it is not only how much is emitted and
how toxic it is, but how much of it actuallyreaches people
2. Pollution released indoors is much more likely toreach people
3. There are ways to regulate indoor air pollutionwithout draconian or even new methods.

“We feel it should be builtaway from population centres.”
Thank youAnd certainly not indoors, if we can avoid it!