Kirill Okhotnikov, Baltzar Stevensson and Mattias Ede´n*
15
This journal is c the Owner Societies 2013 Phys. Chem. Chem. Phys., 2013, 15, 15041--15055 15041 Cite this: Phys. Chem. Chem. Phys., 2013, 15, 15041 New interatomic potential parameters for molecular dynamics simulations of rare-earth (RE = La, Y, Lu, Sc) aluminosilicate glass structures: exploration of RE 3+ field-strength effects† Kirill Okhotnikov, Baltzar Stevensson and Mattias Ede ´n* Sets of self-consistent oxygen-rare earth (RE = La, Y, Lu, Sc) interatomic potential parameters are derived using a force-matching procedure and utilized in molecular dynamics (MD) simulations for exploring the structures of RE 2 O 3 –Al 2 O 3 –SiO 2 glasses that feature a fixed molar ratio n Al /n Si = 1 but variable RE contents. The structures of RE aluminosilicate (AS) glasses depend markedly on the RE 3+ cation field strength (CFS) over both short and intermediate length-scales. We explore these dependencies for glasses incorporating the cations La 3+ ,Y 3+ , Lu 3+ and Sc 3+ , whose CFSs increase due to the concomitant shrinkage of the ionic radii: R La > R Y > R Lu > R Sc . This trend is mirrored in decreasing average RE 3+ coordination numbers ( % Z RE ) from % Z La = 6.4 to % Z Sc = 5.4 in the MD-derived data. However, overall the effects from RE 3+ CFS elevations on the local glass structures are most pronounced in the O and {Al [4] , Al [5] , Al [6] } speciations. The former display minor but growing populations of O [0] (‘‘free oxygen ion’’) and O [3] (‘‘oxygen tricluster’’) moieties. The abundance of AlO 5 polyhedra increases significantly from E10% in La-based glasses to E30% in their Sc counterparts at the expense of the overall domi- nating AlO 4 tetrahedra, whereas the amounts of AlO 6 groups remain o5% throughout. We also discuss the Si [4] /Al [p] (p = 4, 5, 6) intermixing and the nature of their oxygen bridges, where the degree of edge-sharing increases together with the RE 3+ CFS. 1 Introduction Thanks to their beneficial (magneto)optical properties, rare-earth (RE) bearing silicate-based glasses have found applications as laser hosts and optical amplifiers in telecommunication. For optimal performance of such devices, it is desirable to intro- duce high amounts of uniformly dispersed RE 3+ ions into silica melts. Unfortunately, the RE 2 O 3 –SiO 2 system manifests liquid immiscibility, which leads to RE-clustering at low RE 2 O 3 contents of a few mol% and to macroscopic phase-separations for RE 3+ -richer compositions. 1,2 The solubility may be increased by introducing RE 3+ ions into a M 2 O–SiO 2 based glass, 3–7 or by exploiting the ternary RE 2 O 3 –Al 2 O 3 –SiO 2 aluminosilicate (AS) system 8–18 that generally admits the formation of homogeneous amorphous phases by standard melt-quench procedures/conditions, 8–11,15–17 unless their RE 2 O 3 and/or Al 2 O 3 contents are too low (typically t10 mol%, depending on the identity of the RE 3+ ion 11,15 ). Owing to their chemical inertness and favorable physical properties, e.g., high glass transition temperatures (T g ), high microhardness (H V ) and low thermal expansion coefficients, lanthanide-bearing AS glasses are explored as model systems for storage of long-lived actinides, 19 whereas Y–Al–Si–O glasses are exploited in radiotherapy for in situ cancer treatment. 9,20 There is a strong correlation between many physical/mechanical features of RE 2 O 3 –Al 2 O 3 –SiO 2 glasses and the RE 3+ cation field- strength (CFS); the CFS is given by z/R 2 , where z and R denote the charge and radius of the ion, respectively. However, the detailed structure–property relationships of RE AS glasses are poorly understood, such as why the T g -value of the glass strongly depends on the RE 3+ CFS 10,11,15–18 but is almost independent of its RE–Al–Si composition. 9–11,16,17 While such peculiarities inarguably stem from the presence of RE 3+ ions and most likely originate from their bearings on structural features over both short and intermediate length-scales t1 nm, the currently incomplete structural insight hampers unambiguous rationalizations of many structure–property correlations of RE 2 O 3 –Al 2 O 3 –SiO 2 glasses. We have recently Physical Chemistry Division, Department of Materials and Environmental Chemistry, Arrhenius Laboratory, Stockholm University, SE-106 91 Stockholm, Sweden. E-mail: [email protected] † Electronic supplementary information (ESI) available. See DOI: 10.1039/ c3cp51726h Received 22nd April 2013, Accepted 9th July 2013 DOI: 10.1039/c3cp51726h www.rsc.org/pccp PCCP PAPER Open Access Article. Published on 09 July 2013. Downloaded on 12/14/2021 2:18:02 PM. This article is licensed under a Creative Commons Attribution 3.0 Unported Licence. View Article Online View Journal | View Issue
Transcript of Kirill Okhotnikov, Baltzar Stevensson and Mattias Ede´n*
This journal is c the Owner Societies 2013 Phys. Chem. Chem. Phys., 2013, 15, 15041--15055 15041
Cite this: Phys. Chem.Chem.Phys.,2013,15, 15041
New interatomic potential parameters for moleculardynamics simulations of rare-earth (RE = La, Y, Lu, Sc)aluminosilicate glass structures: exploration of RE3+
field-strength effects†
Kirill Okhotnikov, Baltzar Stevensson and Mattias Eden*
Sets of self-consistent oxygen-rare earth (RE = La, Y, Lu, Sc) interatomic potential parameters are derived
using a force-matching procedure and utilized in molecular dynamics (MD) simulations for exploring
the structures of RE2O3–Al2O3–SiO2 glasses that feature a fixed molar ratio nAl/nSi = 1 but variable RE
contents. The structures of RE aluminosilicate (AS) glasses depend markedly on the RE3+ cation field
strength (CFS) over both short and intermediate length-scales. We explore these dependencies for
glasses incorporating the cations La3+, Y3+, Lu3+ and Sc3+, whose CFSs increase due to the concomitant
shrinkage of the ionic radii: RLa > RY > RLu > RSc. This trend is mirrored in decreasing average RE3+
coordination numbers ( %ZRE) from %ZLa = 6.4 to %ZSc = 5.4 in the MD-derived data. However, overall the
effects from RE3+ CFS elevations on the local glass structures are most pronounced in the O and
{Al[4], Al[5], Al[6]} speciations. The former display minor but growing populations of O[0] (‘‘free oxygen
ion’’) and O[3] (‘‘oxygen tricluster’’) moieties. The abundance of AlO5 polyhedra increases significantly
from E10% in La-based glasses to E30% in their Sc counterparts at the expense of the overall domi-
nating AlO4 tetrahedra, whereas the amounts of AlO6 groups remain o5% throughout. We also discuss
the Si[4]/Al[p] (p = 4, 5, 6) intermixing and the nature of their oxygen bridges, where the degree of
edge-sharing increases together with the RE3+ CFS.
1 Introduction
Thanks to their beneficial (magneto)optical properties, rare-earth(RE) bearing silicate-based glasses have found applications aslaser hosts and optical amplifiers in telecommunication. Foroptimal performance of such devices, it is desirable to intro-duce high amounts of uniformly dispersed RE3+ ions into silicamelts. Unfortunately, the RE2O3–SiO2 system manifests liquidimmiscibility, which leads to RE-clustering at low RE2O3
contents of a few mol% and to macroscopic phase-separationsfor RE3+-richer compositions.1,2 The solubility may beincreased by introducing RE3+ ions into a M2O–SiO2 basedglass,3–7 or by exploiting the ternary RE2O3–Al2O3–SiO2
aluminosilicate (AS) system8–18 that generally admits theformation of homogeneous amorphous phases by standardmelt-quench procedures/conditions,8–11,15–17 unless their RE2O3
and/or Al2O3 contents are too low (typically t10 mol%,depending on the identity of the RE3+ ion11,15).
Owing to their chemical inertness and favorable physicalproperties, e.g., high glass transition temperatures (Tg), highmicrohardness (HV) and low thermal expansion coefficients,lanthanide-bearing AS glasses are explored as model systemsfor storage of long-lived actinides,19 whereas Y–Al–Si–O glassesare exploited in radiotherapy for in situ cancer treatment.9,20
There is a strong correlation between many physical/mechanicalfeatures of RE2O3–Al2O3–SiO2 glasses and the RE3+ cation field-strength (CFS); the CFS is given by z/R2, where z and R denotethe charge and radius of the ion, respectively. However, thedetailed structure–property relationships of RE AS glasses arepoorly understood, such as why the Tg-value of the glassstrongly depends on the RE3+ CFS10,11,15–18 but is almostindependent of its RE–Al–Si composition.9–11,16,17 While suchpeculiarities inarguably stem from the presence of RE3+ ionsand most likely originate from their bearings on structuralfeatures over both short and intermediate length-scalest1 nm, the currently incomplete structural insight hampersunambiguous rationalizations of many structure–propertycorrelations of RE2O3–Al2O3–SiO2 glasses. We have recently
Physical Chemistry Division, Department of Materials and Environmental
Chemistry, Arrhenius Laboratory, Stockholm University, SE-106 91 Stockholm,
Sweden. E-mail: [email protected]
† Electronic supplementary information (ESI) available. See DOI: 10.1039/c3cp51726h
Received 22nd April 2013,Accepted 9th July 2013
DOI: 10.1039/c3cp51726h
www.rsc.org/pccp
PCCP
PAPER
Ope
n A
cces
s A
rtic
le. P
ublis
hed
on 0
9 Ju
ly 2
013.
Dow
nloa
ded
on 1
2/14
/202
1 2:
18:0
2 PM
. T
his
artic
le is
lice
nsed
und
er a
Cre
ativ
e C
omm
ons
Attr
ibut
ion
3.0
Unp
orte
d L
icen
ce.
View Article OnlineView Journal | View Issue
15042 Phys. Chem. Chem. Phys., 2013, 15, 15041--15055 This journal is c the Owner Societies 2013
demonstrated that the RE3+ effects on such relationshipsmay be subtle, for example that the well-known enhancedmicrohardness for increasing RE3+ CFS originates from theaccompanying elevated amounts of high-coordination AlO5/AlO6 polyhedra,16,21 whose populations are in turn dictated bythe RE3+ CFS.12–18
Hence, it is desirable to reach a more detailed structuralpicture that encompasses (i) the local RE3+ environments(coordination numbers and RE–O distances) and their distri-bution across the structure, as well as (ii) the speciations andintermixing of the various SiO4 and AlOp (p = 4, 5, 6) groupsassociated with the glass network. Data obtained from X-rayand neutron diffraction techniques18,22 constitute the primaryinformation source for feature (i), whereas the hitherto mostdetailed insight into the network structures stem from 17O,27Al, and 29Si solid-state nuclear magnetic resonance (NMR)spectroscopy applied to AS glasses incorporating the diamag-netic (and thereby accessible to NMR) La3+, Y3+, Lu3+ and Sc3+
ions12–18,23–25 that are listed in the order of decreasing ionicradii and thereby increasing CFS. Besides including bothend-members of the lanthanide series, this ion-set features alarge CFS-span from 2.8 Å�2 for La3+ to 5.4 Å�2 for Sc3+, therebyallowing for the probing of structural variations across a widerange of field-strengths.
As the experimentally derived structural understanding isinsufficient, molecular dynamics (MD) simulation is an attrac-tive method for gaining complementary insight. However, suchreports of RE2O3–Al2O3–SiO2 glasses are hitherto limited to theY system,16,26–28 except in our recent modeling work on Lu16
and La25 AS glasses. The present contribution serves the dualpurpose of (i) outlining the approach for deriving the RE–O(RE = La, Y, Lu) interionic potential parameters utilized by us inref. 16 and 25, as well as introducing new parameters for theSc–O pair; (ii) exploring the relationships between the localstructural features and the nature of the RE3+ ion (RE = La, Y,Lu, Sc) in two series of RE–Al–Si–O glasses; RE(2.21) andRE(2.45). Their members feature equal Al and Si molar contentsbut distinct glass network polymerization degrees29 of r = 2.21and r = 2.45, respectively, with
r = nO/(nAl + nSi), (1)
where nE and xE denote the stoichiometric amount and molarfraction of species E, respectively (the latter out of the cations):
xE = nE/(nSi + nAl + nRE), with E = Si, Al, or RE. (2)
The glass compositions correspond to those reported byIftekhar et al.,15 i.e., 0.171RE2O3–0.276Al2O3–0.553SiO2
[RE(2.21)] or 0.238RE2O3–0.254Al2O3–0.508SiO2 [RE(2.45)] thatare associated with {xSi = xAl = 0.381; xRE = 0.238} and {xSi = xAl =0.340; xRE = 0.320}, respectively. Except for Sc(2.45), which isoutside the glass-forming region attainable by a regular melt-quench procedure at 1650 1C15,17 and that has only beenprepared with 20 at.% of Sc substituted by either Y or La,15
several physical properties and 27Al/29Si NMR parameters arereported for all RE(2.21) and RE(2.45) specimens, as well as forrelated RE AS compositions.11,15–17,24,25
This paper is organized as follows: Section 2 describes ourgeneral MD simulation procedures, whereas Section 3 outlinesour implementation of the three-step force-matching procedureof Ercolessi and Adams,30 which was employed to derive newBorn–Mayer RE–O interionic potential parameters for RE = La,Y, Lu, Sc. These are subsequently evaluated in Section 4,where the modeled short-range features of RE2O3–Al2O3–SiO2
glasses—as well as the energy-optimized lattice parameters ofseveral RE-bearing oxide and aluminate structures—are com-pared with experimental literature data. Section 5 explores thedependence of local and intermediate-range structures ofthe RE(2.21) and RE(2.45) glass series on variations of each ofthe four RE3+ ions and their respective contents, where weexamine the RE and O speciations, the cation constellations atthe various O environments, as well as the Si–Al intermixingand the nature of their shared bridging oxygen (BO) sites.
2 Computational details
The classical MD simulations emulating a melt-quench proce-dure were performed for an NVT ensemble in a cubic box withperiodic boundary conditions.31 The computations were carriedout with the DLPOLY3 package32,33 for E3300 atoms and acubic box-length in the range 3.33–3.54 nm. These parameterswere adjusted slightly to match the experimental density andcomposition of each RE AS glass, using the previously reportedvalues for the La,11,24 Y,16 Lu16 and Sc17 bearing samples. Theexperimental densities ranged between 2.93 g cm�3 for Sc(2.21)and 5.05 g cm�3 for Lu(2.45).15 The melt-quench simulationstarted from a structure equilibrated at 3500 K for 100 ps,followed by a 10 ps step-wise decrease of 10 K ps�1 down to300 K, where equilibration was performed during 200 ps, ofwhich the trajectory during the last 150 ps was used for thestructural analysis. For each glass composition, this protocolwas completed twelve times with distinct initial ion configura-tions, each generated by a random distribution subject to theconstraint of a 50 pm minimum distance in any ion-pair. Theaverage value and uncertainty of each reported modeled struc-tural feature was derived from these distinct trajectories.
For two ion species a and b with indices j and k separated ata distance Rjk
a–b, the corresponding interaction energy includedboth long-range Coulombic (Bzazb/[4pe0Rjk
a–b], where za repre-sents the ionic charge), and short-range Buckingham terms.The latter is given by
U jka–b(R jk
a–b) = Aa–b exp{�R jka–b/ra–b} � Ca–b(R jk
a–b)�6,(3)
except for the RE–O (RE = La, Y, Lu, Sc) interionic potentialsderived herein that solely employed the repulsive Born–Mayercontribution:
U jka–b(Rjk
a–b) = Aa–b exp{�R jka–b/ra–b}, (4)
i.e., for which C � 0. The sets {Aa–b,ra–b,Ca–b} are listed inTable 1. The Buckingham/Born–Mayer parameters employedpartial charges of �1.2e for O, 2.4e for Si, and 1.8e for Altogether with all RE species,34 where e is the elementary charge.
Paper PCCP
Ope
n A
cces
s A
rtic
le. P
ublis
hed
on 0
9 Ju
ly 2
013.
Dow
nloa
ded
on 1
2/14
/202
1 2:
18:0
2 PM
. T
his
artic
le is
lice
nsed
und
er a
Cre
ativ
e C
omm
ons
Attr
ibut
ion
3.0
Unp
orte
d L
icen
ce.
View Article Online
This journal is c the Owner Societies 2013 Phys. Chem. Chem. Phys., 2013, 15, 15041--15055 15043
A modified Buckingham potential was implemented to circum-vent strong attractions at small interionic distances.35 Eqn (3)and (4) were evaluated for all ion-pairs up to 0.8 nm, whereasthe Coulombic interactions were calculated by a smoothedparticle mesh Ewald summation33 with a 1.2 nm real-spacecut-off and an accuracy of 10�6. These parameters providesufficient accuracy and are standard for MD implementationsfor similar glass systems (e.g., see ref. 2, 27 and 28). Theequations of motion were integrated in time-steps of 2 fs bythe velocity Verlet integrator approach, and a Berendsenthermostat with a 1.0 ps relaxation time constant.31
These parameters and methods were employed throughoutall MD simulations, except for the optimization procedure ofthe new RE–O potential parameters in Section 3, whichemployed a smaller set of 113 atoms and box-lengths spanning1.12–1.15 nm, whereas 0.53 nm and 0.55 nm cut-off radii wereused for the Buckingham and Coulombic interactions, respec-tively. The restricted set of atoms originates from computermemory constraints in the ab initio calculations outlined below.
To verify that the sets of interionic potential parameters mayalso reproduce the experimental glass densities, we additionallyperformed NPT simulations for four distinct initial configura-tions of each composition. The modeled densities were con-sistently slightly lower than their experimental counterparts,but deviated only by t3% and t5% within each RE(2.21) andRE(2.45) series, respectively. The overall largest discrepancy(5.3%) was observed for the Y(2.45) composition, whereas essen-tially perfect matches resulted for the two La glass compositions(o1% relative error). The sets of simulations revealed a negli-gible spread within �0.01 g cm�3 for each glass; incidentally,this value is equal to the experimental uncertainty.15–17
3 Optimization of RE–O interionic potentialparameters
Current computer resources limit ab initio calculations to sys-tems comprising less than a few hundred atoms over t10 ps,and simulations of larger ensembles over long timescales canonly be achieved by classical MD approaches31 that require a setof parameters for approximating the interaction energy in eachion-pair of a targeted structure. An ‘‘ideal’’ interaction potential
should reproduce the experimentally assessed properties of thesystem, as well as providing reliable predictions over widelyspanning sample compositions. Several strategies exist for con-structing interatomic potentials, such as the reverse MonteCarlo,36,37 electronic density,38 and effective medium39 options.
We employed the iterative force-matching procedure ofErcolessi and Adams30 to obtain the parameters Aa–b and ra–b
of the Born–Mayer potential [eqn (4)]; their values were selectedso as to provide the closest possible match to ab initio-derivedforces. Such a protocol is convenient for applications to amor-phous phases where elastic constants or lattice parameterscannot be defined. It was carried out for the RE(2.21) composi-tion of each RE–Al–Si–O (RE = La, Y, Lu, and Sc) glass. Everyiteration step (n) involves three stages:
(1) For a given set of Buckingham parameters {Aa–b,ra–b,Ca–b}of Si–O, Al–O and O–O interionic pairs (using the values ofDu et al.26,40,41) and Born–Mayer counterparts {A(n)
RE–O,r(n)RE–O} for
the RE–O pairs, a glass structure model was obtained usingclassical MD simulations (see Section 2) at the nth iterationstage. For the case of RE = Y, the initial set {A(0)
Y–O,r(0)Y–O} was
derived by mapping the Buckingham parameters of Du26 ontothe Born–Mayer form [{AY–O,rY–O,CY–O} - {A(0)
Y–O,r(0)Y–O}] using a
numerical fitting, whereas the A(0)RE–O starting values were scaled
for the other RE–O contacts according to the ratios of theirShannon–Prewitt42 ionic radii (RRE/RY).
(2) The ion coordinates of each MD-derived glass structurewere utilized in a density functional theory (DFT) full-potentiallinearized augmented plane wave (FP-LAPW)43,44 calculation toprovide the interionic forces [ %F(ab initio)]. The generalizedgradient approximation of Perdew, Burke and Ernzerhof45 wasused with the Wien2k package.46 One k-point of the irreducibleBrillouin zone was computed by employing basis functions thatobeyed the criterion KmaxRmin = 7.0, where Kmax represents themagnitude of the largest basis vector in the reciprocal space andRmin is the smallest muffin-tin radius in the simulated cell. Thelatter values were fixed throughout all computations at 1.83 a.u.,1.66 a.u., 1.51 a.u., and 1.31 a.u. for the RE, Al, Si, and O species,respectively.46 We verified that the product KmaxRmin = 7.0provides converged forces. The electronic band-states were sepa-rated by �8.1 Ry to include all contributions down to the 2p and2s orbitals for Si and Al, respectively. The force convergencecriteria for the self-consistent field (SCF) procedure were 0.5 mRyper a.u. During the last SCF-cycle, the total forces were calculatedusing Pulay’s correction.47
(3) The DLPOLY3 package32,33 was employed to compute aset of forces { %Fj (ARE–O,rRE–O)}. A refined set of interionicpotential parameters resulted from a least-square force-fittingprocedure that minimized the function
w2 ARE�O; rRE�Oð Þ ¼Xj
~FjðARE�O; rRE�OÞ � ~Fjðab initioÞ�� ��2;
(5)
where the index j runs over all RE3+ sites in the structure and||� � �|| denotes the magnitude (norm) of the vector-difference.The Born–Mayer parameters were varied until the best match
Table 1 Buckingham potential parameters
Paira A/eV r/Å C/(eV Å6)
O1.2�–O1.2� b 1844.7458 0.343645 192.58Al1.8+–O1.2� 12 201.417 0.195628 31.997Si2.4+–O1.2� 13 702.905 0.193817 54.681Y1.8+–O1.2� 29 526.977 0.211377 50.477
La1.8+–O1.2� c 9537.95 0.235917 0Y1.8+–O1.2� 11 019.6 0.224173 0Lu1.8+–O1.2� 6657.09 0.230360 0Sc1.8+–O1.2� 3095.04 0.244357 0
a Superscripts indicate values of the partial ionic charges according tovan Beest et al.34 b Parameters from Du and Cormack.26,40,41 c The newparameters derived herein, corresponding to the set {A(3)
RE–O,r(3)RE–O} of
Section 3.
PCCP Paper
Ope
n A
cces
s A
rtic
le. P
ublis
hed
on 0
9 Ju
ly 2
013.
Dow
nloa
ded
on 1
2/14
/202
1 2:
18:0
2 PM
. T
his
artic
le is
lice
nsed
und
er a
Cre
ativ
e C
omm
ons
Attr
ibut
ion
3.0
Unp
orte
d L
icen
ce.
View Article Online
15044 Phys. Chem. Chem. Phys., 2013, 15, 15041--15055 This journal is c the Owner Societies 2013
was found in eqn (5). This provided a new set of values,{A(n+1)
RE–O,r(n+1)RE–O}, extracted at the minimum of w2(ARE–O,rRE–O)
and subsequently provided as input to the MD simulationstage (1) of the next, i.e., (n + 1)th iteration step.
Steps (1)–(3) of the protocol were repeated three times,resulting in the sets {A(n)
RE–O,r(n)RE–O} with n = 1, 2, and 3.
Table 1 lists the {A(3)RE–O,r(3)
RE–O} values that were employed inall remaining calculations, as well as in our recent work.16,25
The parameters obtained at each iteration stage were used tocompute the potential energy [URE–O(RRE–O)] from eqn (4), aswell as the respective radial distribution function [RDF;denoted gRE–O(RRE–O)]. The latter was evaluated for an ensembleof E3300 atoms, as described in Section 2. Fig. S1 of the ESI†shows the results for the RE(2.21) glass composition andRE = {La, Y, Lu, Sc}.
4 Validation of the interionic potentialparameters4.1 Short-range structures of RE2O3–Al2O3–SiO2 glasses
The general validity of the new potential parameters for repro-ducing short-range structural features of RE2O3–Al2O3–SiO2
glasses was previously confirmed over large RE–Al–Si composi-tional ranges within each La,25 Y16 and Lu16 system. Focussingon the structural dependency on the identity of the RE3+ ion, weevaluate here the predictions of the MD simulations for theseries of RE(2.21) and RE(2.45) specimens against experimentalresults from either solid-state NMR16,17,25 (Si and Al coordina-tions) or diffraction18,22 techniques; the latter data on cation–oxygen distances were reported for Si-richer and RE-poorercompositions and may therefore only serve as general guides.
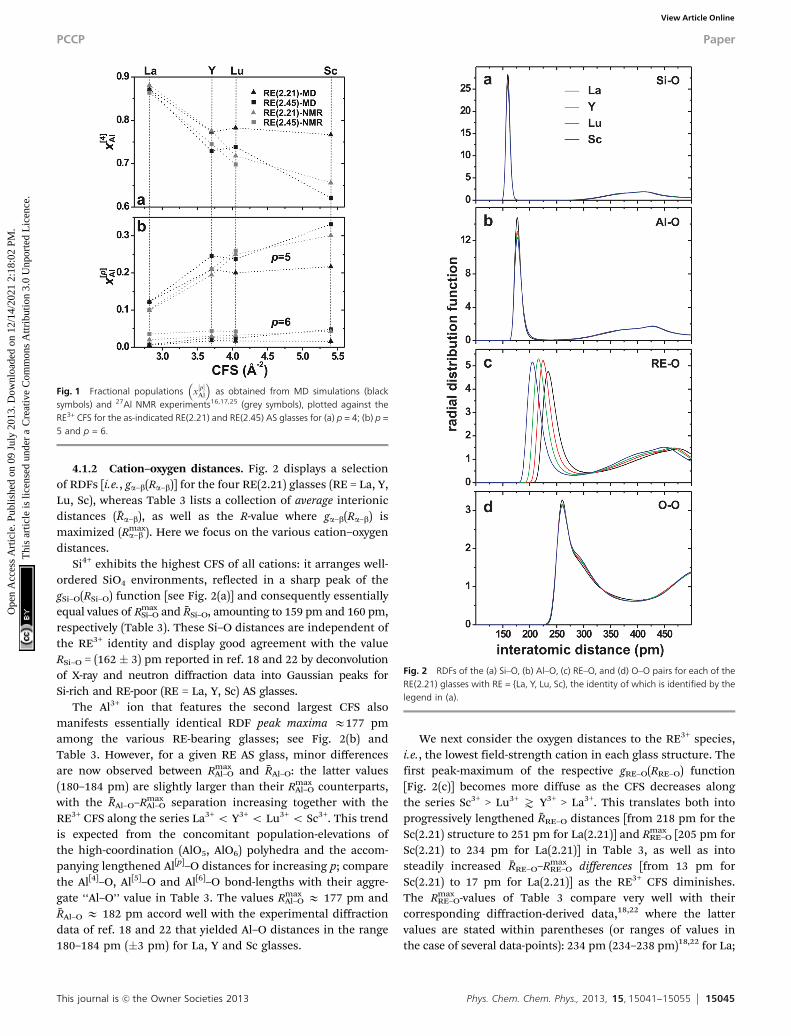
4.1.1 Si and Al coordinations. The MD simulations of thepresent glass compositions, as well as others previouslyreported,16,17 reveal that Si4+ is exclusively (>98.5%) present intetrahedral coordination (Si[4]), which is in excellent agreementwith experimental solid-state 29Si NMR data.15–17,23,24 For thisreason, we henceforth do not explicitly indicate the coordina-tion number of Si. All Al3+ ions (Z99.9%) coordinate either four
(Al[4]), five (Al[5]) or six (Al[6]) oxygen atoms, also in full accor-dance with 27Al NMR results obtained from the present RE AScompositions as well as related ones.12–18,23,25
Fourfold Al3+ coordinations dominate the three coexistingAlO4, AlO5 and AlO6 polyhedra. The amounts of higher-coordi-nation species (mainly AlO5) grow primarily for increasing RE3+
CFS and secondly for decreasing xSi, in good agreement withexperimental findings.13,14,16,17,25 These trends are witnessed inthe average Al coordination number ( %ZAl) and fractional popula-tions {x[p]
Al } of the {AlOp} polyhedra listed in Table 2 for the twoRE(2.21) and RE(2.45) series of specimens. As the CFS elevatesbetween the La3+ and Sc3+ ions, the modeled %ZAl values range over4.14–4.43 for the RE(2.45) series, whereas its RE(2.21) counterpartdisplays nearly equal average Al coordination numbers E4.24 inthe Y, Lu and Sc bearing structures. Minor variations are observedfor each RE AS structure when xSi diminishes, i.e., for increasingthe r-value of the glass. The elevation of %ZAl stems primarily from agrowth of the AlO5 population, whereas that for the AlO6 groupsremains low throughout (x[6]
Al o 0.05).Table 2 compares the modeled %ZAl and {x[p]
Al } results withtheir experimental counterparts obtained from solid-state 27AlNMR in ref. 16, 17 and 25. The x[p]
Al values are plotted against theRE3+ CFS in Fig. 1. While excellent agreement is observed for allLa and Y AS glasses, for the cases of Lu and Sc the MDsimulations underestimate the AlO5 populations (and thereby%ZAl), notably so for the Sc(2.21) glass. Despite the largest relativediscrepancy between the MD and NMR derived %ZAl-values beingonly E4% [for Sc(2.21)], the pronounced experimental trend ofa monotonic elevation of %ZAl for increasing RE3+ CFS is notreproduced well by the simulations of the Lu and Sc members,particularly for the r = 2.21 branch. Given the significantlyfaster quench-rate in the calculations relative to the physicalsamples, one expects the modeled x[5]
Al and x[6]Al populations to be
comparable to, or even higher, than their NMR-derived counter-parts, as explained in detail in ref. 25. Hence, the frequentlyobserved underestimation of %ZAl from the MD simulations issurprising (see Fig. 1). We have no explanation for these effectsbut refer to Jaworski et al.25 for further discussions.
Table 2 Results of MD Simulations and 27Al MAS NMRa
Glass %ZRE %ZAl x[4]Al x[5]
Al x[6]Al %ZO x[0]
O x[1]O x[2]
O x[3]O
La(2.21) 6.39 4.13(4.14) 0.872(0.877) 0.123(0.091) 0.005(0.022) 1.84 0.009 0.229 0.677 0.085Y(2.21) 6.18 4.24(4.25) 0.773(0.776) 0.209(0.195) 0.018(0.029) 1.86 0.010 0.226 0.655 0.109Lu(2.21) 5.66 4.23(4.31) 0.782(0.718) 0.201(0.250) 0.017(0.032) 1.86 0.012 0.232 0.641 0.115Sc(2.21) 5.13 4.25(4.40) 0.767(0.649) 0.217(0.307) 0.016(0.044) 1.86 0.017 0.231 0.629 0.123
La(2.45) 6.42 4.14(4.14) 0.871(0.884) 0.122(0.089) 0.007(0.027) 1.66 0.022 0.350 0.576 0.052Y(2.45) 6.29 4.30(4.30) 0.729(0.746) 0.246(0.210) 0.025(0.044) 1.70 0.025 0.333 0.564 0.078Lu(2.45) 5.77 4.29(4.34) 0.739(0.698) 0.237(0.260) 0.024(0.042) 1.69 0.031 0.329 0.559 0.081Sc(2.45) 5.38 4.43 0.621 0.331 0.048 1.72 0.034 0.317 0.544 0.105
Y(2.21)b 6.51 4.22(4.25) 0.795(0.776) 0.191(0.195) 0.014(0.029) 1.86 0.006 0.227 0.669 0.098Y(2.45)b 6.60 4.28(4.30) 0.738(0.746) 0.239(0.210) 0.023(0.044) 1.69 0.019 0.337 0.578 0.066
a MD-derived RE3+ and Al3+ average coordination numbers ( %ZRE, %ZAl) and fractional populations of AlOp groups (x[p]Al ) obtained by MD simulations and
NMR. The latter data are given within parentheses and are reproduced from our recent work.16,17,25 The populations are associated with uncertaintiesof �0.010 (MD) and �0.015 (NMR). The rightmost columns list the mean O coordination numbers ( %ZO) and the fractional population x[p]
O of each O[p]
(p = 0, 1, 2, 3) coordination, where only bonds to Si and Al are considered. b Results obtained by using the Y–O potential parameters of Du.26
Paper PCCP
Ope
n A
cces
s A
rtic
le. P
ublis
hed
on 0
9 Ju
ly 2
013.
Dow
nloa
ded
on 1
2/14
/202
1 2:
18:0
2 PM
. T
his
artic
le is
lice
nsed
und
er a
Cre
ativ
e C
omm
ons
Attr
ibut
ion
3.0
Unp
orte
d L
icen
ce.
View Article Online
This journal is c the Owner Societies 2013 Phys. Chem. Chem. Phys., 2013, 15, 15041--15055 15045
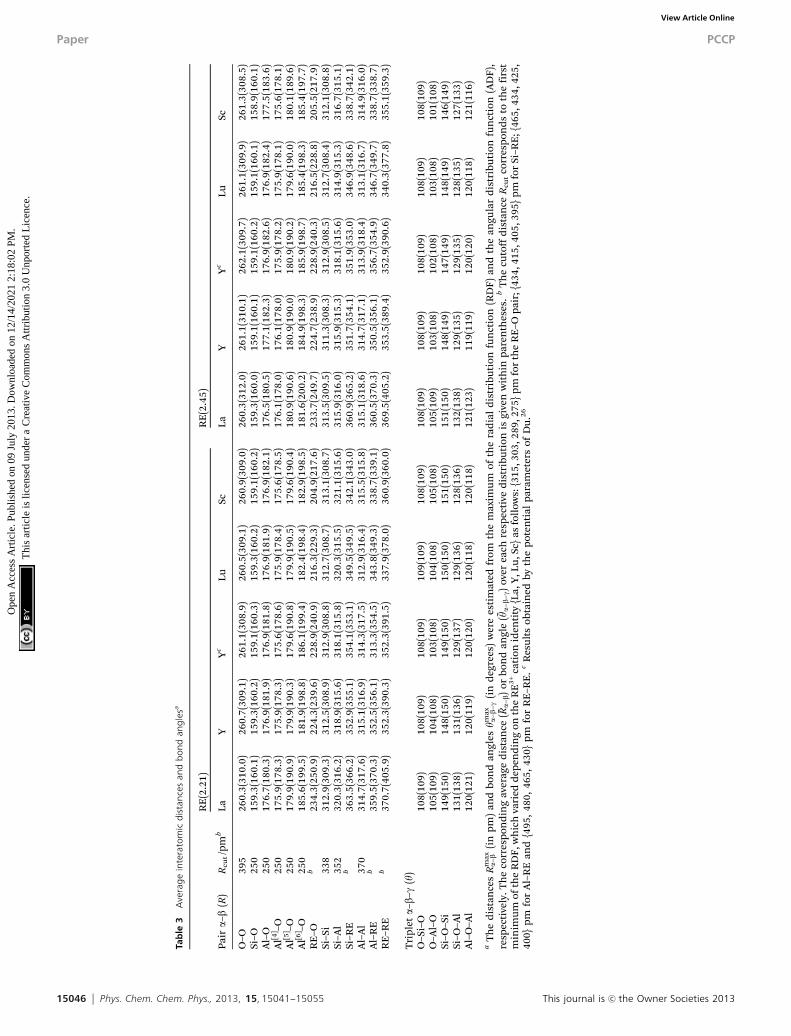
4.1.2 Cation–oxygen distances. Fig. 2 displays a selectionof RDFs [i.e., ga–b(Ra–b)] for the four RE(2.21) glasses (RE = La, Y,Lu, Sc), whereas Table 3 lists a collection of average interionicdistances ( %Ra–b), as well as the R-value where ga–b(Ra–b) ismaximized (Rmax
a–b ). Here we focus on the various cation–oxygendistances.
Si4+ exhibits the highest CFS of all cations: it arranges well-ordered SiO4 environments, reflected in a sharp peak of thegSi–O(RSi–O) function [see Fig. 2(a)] and consequently essentiallyequal values of Rmax
Si–O and %RSi–O, amounting to 159 pm and 160 pm,respectively (Table 3). These Si–O distances are independent ofthe RE3+ identity and display good agreement with the valueRSi–O = (162 � 3) pm reported in ref. 18 and 22 by deconvolutionof X-ray and neutron diffraction data into Gaussian peaks forSi-rich and RE-poor (RE = La, Y, Sc) AS glasses.
The Al3+ ion that features the second largest CFS alsomanifests essentially identical RDF peak maxima E177 pmamong the various RE-bearing glasses; see Fig. 2(b) andTable 3. However, for a given RE AS glass, minor differencesare now observed between Rmax
Al–O and %RAl–O: the latter values(180–184 pm) are slightly larger than their Rmax
Al–O counterparts,with the %RAl–O–Rmax
Al–O separation increasing together with theRE3+ CFS along the series La3+ o Y3+ o Lu3+ o Sc3+. This trendis expected from the concomitant population-elevations ofthe high-coordination (AlO5, AlO6) polyhedra and the accom-panying lengthened Al[p]–O distances for increasing p; comparethe Al[4]–O, Al[5]–O and Al[6]–O bond-lengths with their aggre-gate ‘‘Al–O’’ value in Table 3. The values Rmax
Al–O E 177 pm and%RAl–O E 182 pm accord well with the experimental diffractiondata of ref. 18 and 22 that yielded Al–O distances in the range180–184 pm (�3 pm) for La, Y and Sc glasses.
We next consider the oxygen distances to the RE3+ species,i.e., the lowest field-strength cation in each glass structure. Thefirst peak-maximum of the respective gRE–O(RRE–O) function[Fig. 2(c)] becomes more diffuse as the CFS decreases alongthe series Sc3+ > Lu3+
\ Y3+ > La3+. This translates both intoprogressively lengthened %RRE–O distances [from 218 pm for theSc(2.21) structure to 251 pm for La(2.21)] and Rmax
RE–O [205 pm forSc(2.21) to 234 pm for La(2.21)] in Table 3, as well as intosteadily increased %RRE–O–Rmax
RE–O differences [from 13 pm forSc(2.21) to 17 pm for La(2.21)] as the RE3+ CFS diminishes.The Rmax
RE–O-values of Table 3 compare very well with theircorresponding diffraction-derived data,18,22 where the lattervalues are stated within parentheses (or ranges of values inthe case of several data-points): 234 pm (234–238 pm)18,22 for La;
Fig. 1 Fractional populations x½p�Al
� �as obtained from MD simulations (black
symbols) and 27Al NMR experiments16,17,25 (grey symbols), plotted against theRE3+ CFS for the as-indicated RE(2.21) and RE(2.45) AS glasses for (a) p = 4; (b) p =5 and p = 6.
Fig. 2 RDFs of the (a) Si–O, (b) Al–O, (c) RE–O, and (d) O–O pairs for each of theRE(2.21) glasses with RE = {La, Y, Lu, Sc}, the identity of which is identified by thelegend in (a).
PCCP Paper
Ope
n A
cces
s A
rtic
le. P
ublis
hed
on 0
9 Ju
ly 2
013.
Dow
nloa
ded
on 1
2/14
/202
1 2:
18:0
2 PM
. T
his
artic
le is
lice
nsed
und
er a
Cre
ativ
e C
omm
ons
Attr
ibut
ion
3.0
Unp
orte
d L
icen
ce.
View Article Online
15046 Phys. Chem. Chem. Phys., 2013, 15, 15041--15055 This journal is c the Owner Societies 2013
Tab
le3
Ave
rag
ein
tera
tom
icd
ista
nce
san
db
on
dan
gle
sa
Pair
a–b
(R)
Rcu
t/p
mb
RE
(2.2
1)R
E(2
.45)
LaY
Yc
LuSc
LaY
Yc
LuSc
O–O
395
260.
3(31
0.0)
260.
7(30
9.1)
261.
1(30
8.9)
260.
5(30
9.1)
260.
9(30
9.0)
260.
3(31
2.0)
261.
1(31
0.1)
262.
1(30
9.7)
261.
1(30
9.9)
261.
3(30
8.5)
Si–O
250
159.
3(16
0.1)
159.
3(16
0.2)
159.
1(16
0.3)
159.
3(16
0.2)
159.
1(16
0.2)
159.
3(16
0.0)
159.
1(16
0.1)
159.
1(16
0.2)
159.
1(16
0.1)
158.
9(16
0.1)
Al–
O25
017
6.7(
180.
3)17
6.9(
181.
9)17
6.9(
181.
8)17
6.9(
181.
9)17
6.9(
182.
1)17
6.5(
180.
5)17
7.1(
182.
3)17
6.9(
182.
6)17
6.9(
182.
4)17
7.5(
183.
6)A
l[4] –O
250
175.
9(17
8.3)
175.
9(17
8.3)
175.
6(17
8.6)
175.
9(17
8.4)
175.
6(17
8.5)
176.
1(17
8.0)
176.
1(17
8.0)
175.
9(17
8.2)
175.
9(17
8.1)
175.
6(17
8.1)
Al[5
] –O25
017
9.9(
190.
9)17
9.9(
190.
3)17
9.6(
190.
8)17
9.9(
190.
5)17
9.6(
190.
4)18
0.9(
190.
6)18
0.9(
190.
0)18
0.9(
190.
2)17
9.6(
190.
0)18
0.1(
189.
6)A
l[6] –O
250
185.
6(19
9.5)
181.
9(19
8.8)
186.
1(19
9.4)
182.
4(19
8.4)
182.
9(19
8.5)
181.
6(20
0.2)
184.
9(19
8.3)
185.
9(19
8.7)
185.
4(19
8.3)
185.
4(19
7.7)
RE
–Ob
234.
3(25
0.9)
224.
3(23
9.6)
228.
9(24
0.9)
216.
3(22
9.3)
204.
9(21
7.6)
233.
7(24
9.7)
224.
7(23
8.9)
228.
9(24
0.3)
216.
5(22
8.8)
205.
5(21
7.9)
Si–S
i33
831
2.9(
309.
3)31
2.5(
308.
9)31
2.9(
308.
8)31
2.7(
308.
7)31
3.1(
308.
7)31
3.5(
309.
5)31
1.3(
308.
3)31
2.9(
308.
5)31
2.7(
308.
4)31
2.1(
308.
8)Si
–Al
352
320.
3(31
6.2)
318.
9(31
5.6)
318.
1(31
5.8)
320.
3(31
5.5)
321.
1(31
5.6)
315.
9(31
6.0)
315.
9(31
5.3)
318.
1(31
5.6)
314.
9(31
5.3)
316.
7(31
5.1)
Si–R
Eb
363.
5(36
6.2)
352.
9(35
5.1)
354.
1(35
3.1)
349.
5(34
9.5)
342.
1(34
3.0)
360.
9(36
5.2)
351.
7(35
4.1)
351.
9(35
3.0)
346.
9(34
8.6)
338.
7(34
2.1)
Al–
Al
370
314.
7(31
7.6)
315.
1(31
6.9)
314.
3(31
7.5)
312.
9(31
6.4)
315.
5(31
5.8)
315.
1(31
8.6)
314.
7(31
7.1)
313.
9(31
8.4)
313.
1(31
6.7)
314.
9(31
6.0)
Al–
RE
b35
9.5(
370.
3)35
2.5(
356.
1)31
3.3(
354.
5)34
3.8(
349.
3)33
8.7(
339.
1)36
0.5(
370.
3)35
0.5(
356.
1)35
6.7(
354.
9)34
6.7(
349.
7)33
8.7(
338.
7)R
E–R
Eb
370.
7(40
5.9)
352.
3(39
0.3)
352.
3(39
1.5)
337.
9(37
8.0)
360.
9(36
0.0)
369.
5(40
5.2)
353.
5(38
9.4)
352.
9(39
0.6)
340.
3(37
7.8)
355.
1(35
9.3)
Tri
plet
a–b–
g(y
)O
–Si–
O10
8(10
9)10
8(10
9)10
8(10
9)10
9(10
9)10
8(10
9)10
8(10
9)10
8(10
9)10
8(10
9)10
8(10
9)10
8(10
9)O
–Al–
O10
5(10
9)10
4(10
8)10
3(10
8)10
4(10
8)10
5(10
8)10
5(10
9)10
3(10
8)10
2(10
8)10
3(10
8)10
1(10
8)Si
–O–S
i14
9(15
0)14
8(15
0)14
9(15
0)15
0(15
0)15
1(15
0)15
1(15
0)14
8(14
9)14
7(14
9)14
8(14
9)14
6(14
9)Si
–O–A
l13
1(13
8)13
1(13
6)12
9(13
7)12
9(13
6)12
8(13
6)13
2(13
8)12
9(13
5)12
9(13
5)12
8(13
5)12
7(13
3)A
l–O
–Al
120(
121)
120(
119)
120(
120)
120(
118)
120(
118)
121(
123)
119(
119)
120(
120)
120(
118)
121(
116)
aT
he
dis
tan
ces
Rm
axa
–b(i
npm
)an
dbo
nd
angl
esym
axa
–b–g
(in
deg
rees
)w
ere
esti
mat
edfr
omth
em
axim
um
ofth
era
dia
ld
istr
ibu
tion
fun
ctio
n(R
DF)
and
the
angu
lar
dis
trib
uti
onfu
nct
ion
(AD
F),
resp
ecti
vely
.Th
eco
rres
pon
din
gav
erag
ed
ista
nce
(% Ra
–b)
orbo
nd
angl
e(% y
a–b
–g)
over
each
resp
ecti
ved
istr
ibu
tion
isgi
ven
wit
hin
pare
nth
eses
.b
Th
ecu
toff
dis
tan
ceR
cut
corr
espo
nd
sto
the
firs
tm
inim
um
ofth
eR
DF,
wh
ich
vari
edd
epen
din
gon
the
RE
3+
cati
onid
enti
ty{L
a,Y
,Lu
,Sc}
asfo
llow
s:{3
15,3
03,2
89,2
75}
pmfo
rth
eR
E–O
pair
;{43
4,41
5,40
5,39
5}pm
for
Si–R
E;{
465,
434,
425,
400}
pmfo
rA
l–R
Ean
d{4
95,
480,
465,
430}
pmfo
rR
E–R
E.
cR
esu
lts
obta
ined
byth
epo
ten
tial
para
met
ers
ofD
u.2
6
Paper PCCP
Ope
n A
cces
s A
rtic
le. P
ublis
hed
on 0
9 Ju
ly 2
013.
Dow
nloa
ded
on 1
2/14
/202
1 2:
18:0
2 PM
. T
his
artic
le is
lice
nsed
und
er a
Cre
ativ
e C
omm
ons
Attr
ibut
ion
3.0
Unp
orte
d L
icen
ce.
View Article Online
This journal is c the Owner Societies 2013 Phys. Chem. Chem. Phys., 2013, 15, 15041--15055 15047
224 pm (220–226 pm)18,22 for Y, and 205 pm (212 pm)18 for Sc.The largest discrepancy (E3%) is observed for Sc, although itmay partially originate from widely differing cation composi-tions between our Sc(2.21) glass and that analyzed by Sadikiet al.;18 the latter corresponds to r = 1.87, xAl/xSi = 0.58 andxSc E 0.03 in our sample nomenclature. While both the Y–Ointerionic parameters derived herein and those of Du26 provideRmax
Y–O values in good accordance with experimental diffractiondata, slightly better predictions are observed from the present{ARE–O,rRE–O} set. Experimental Lu–O bond-lengths are notreported from Lu–Al–Si–O glasses. Yet, as shown below inSection 4.2, our interionic Lu–O potential parameters provideexcellent predictions of %RLu–O-values and lattice-parameters forsome crystalline Lu-bearing phases.
4.2 Crystalline model structures
The new RE–O potentials were further evaluated by energyminimizations at zero absolute temperature by applying theGULP program48 to the set of crystalline structures shown inTable 4; they correspond to the La2O3, Y2O3, Lu2O3, and Sc2O3
oxides, some RE-bearing aluminates (LaAlO3, Y3Al5O12,Lu3Al5O12, ScAlO3) and scandium disilicate (Sc2Si2O7). Eachrepresentative XRD-derived structural parameter-set (obtainedfrom the inorganic crystal structure database49) was used as theinitial input to the minimization procedure with the interionicpotentials evaluated up to 2.0 nm. The space-group symmetryof each structure was preserved throughout.
The resulting lattice parameters (a, b, c), cell volume (V) andaverage RE–O distance ( %RRE–O) within the unit cell are listed inTable 4 and compared with their experimental counterpartsobtained using single crystal XRD. An acceptable agreement isobserved: the relative deviations among the (a, b, c) parametersand the volume of the unit cell generally stay below 2% and 4%,respectively. For both the RE2O3 and aluminate structures, thedata derived from the new Y–O and Lu–O potential parametersaccord very well with their experimental counterparts, wherethe largest discrepancies in the cell-lengths, volumes andaverage RE–O distances amount to 0.8%, 2.2% and 1.6%,respectively, while the agreement is overall significantly lowerfor La and Sc. Table 4 also compares the results of using theY–O interionic potential parameters of Du et al.26 with thosederived herein. Overall, the two options display comparablequalities in their structural predictions; the present {AY–O,rY–O}parameters perform favorably for the case of Y2O3, whereasthose of ref. 26 give better agreement with the experimentallattice parameters of Y3Al5O12.
The La–O and Sc–O interionic potentials offer the weakestpredictability. While the LaAlO3 lattice parameters calculatedby the new La–O potential give excellent agreement with theexperimental data (Table 4), the globally largest discrepancyamong all structures is observed for La2O3, for which thecalculated values of V and %RLa–O are underestimated by 7.3%and 2.4%, respectively. However, the three Sc-bearing struc-tures manifest the overall weakest agreement between calcu-lated and experimental lattice parameters, where discrepancies
over the ranges of 1.2–2.1%, 3.8–5.8% and 2.0–3.1% areobserved for the values of (a, b, c), V, and %RSc–O, respectively.
Nevertheless, our new RE–O potential parameters that wereoptimized directly on amorphous phases, display a good trans-ferability to crystalline structures, except for La2O3 and theSc-based phases. For instance, the observed deviations betweencalculated and experimental data are not substantially largerthan the analogous results of Pedone et al.50 obtained by aMorse-based potential that was optimized directly on crystal-line oxides and subsequently evaluated on several multicom-ponent structures. Table 4 also verifies acceptable values of theenergy-minimized lattice parameters of a-quartz and a-Al2O3,which originated from solely employing the O–O, Si–O, andAl–O interionic parameters of Du and Cormack26,40,41 (seeTable 1); hence, the validity of our RE–O Born–Mayer para-meters is confirmed by the comparable quality in the structuralpredictability observed both in their presence and absence.Moreover, the herein utilized Si–O and O–O parameters fromref. 40 and 41 compare favorably with the Beest–Kramer–Santen34 (BKS) and Carre–Horbach–Ispas–Kob51 (CHIK) poten-tials when evaluated for the case of a-SiO2 (see Table 4).
5 Cation field-strength effects onRE2O3–Al2O3–SiO2 glass structures5.1 Rare-earth coordinations
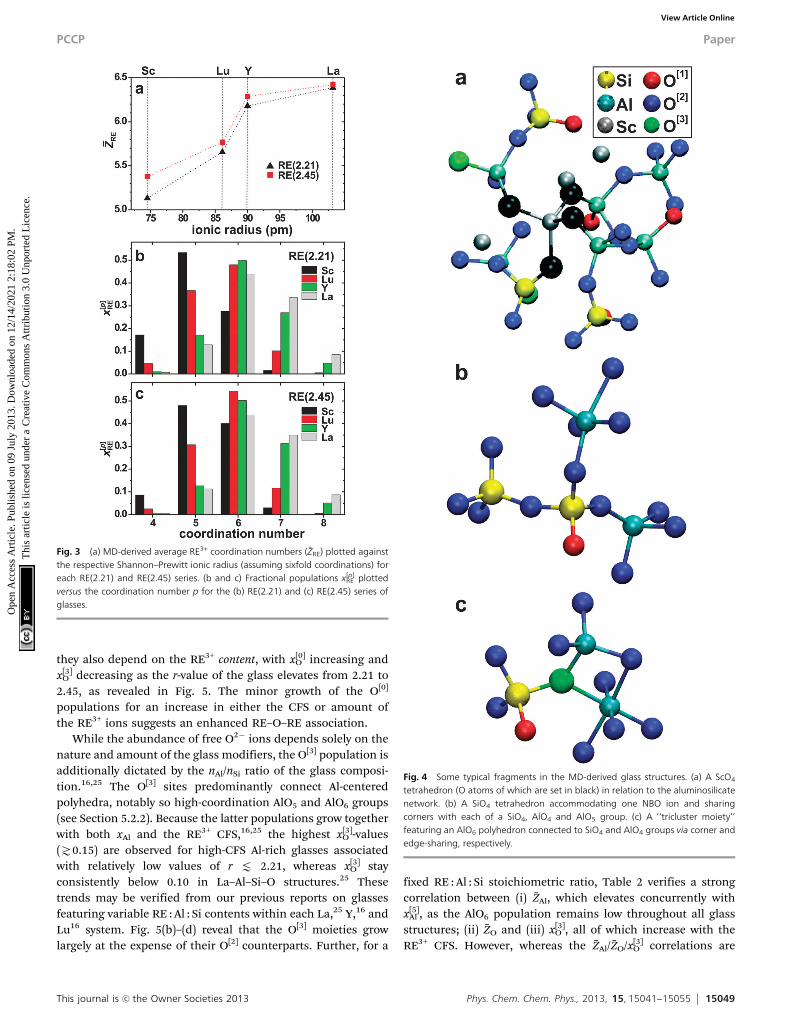
Fig. 3(a) plots the average number of oxygen species coordinatedby each RE3+ ion ( %ZRE) against its corresponding Shannon–Prewitt radius,42 the latter value relevant for REO6 groups.Indeed, all MD-derived mean coordination numbers scatteraround %ZRE B 6; they elevate either for increasing RE3+ radius(i.e., decreasing CFS) or for growing r-value of the glass. Thelatter observation may be rationalized from the dependence of%ZRE on the glass composition, where both %ZRE and %ZAl increasesfor decreasing silica content (i.e., increasing xRE), as demon-strated in ref. 16 and 25. Table 2 verifies our claimed correla-tion between %ZRE and %ZAl for the present glasses.
The underlying distribution of RE[p] populations (x[p]RE) are
conveyed by Fig. 3(b) and (c) for the RE(2.21) and RE(2.45)series. Coordination numbers are observed in the range 4 rp r 8, although the fourfold and eightfold populations are onlysignificant for the smallest (Sc3+) and largest (La3+) cations,respectively. Except for Sc3+ ions that primarily form ScO5
polyhedra, p = 6 coordinations dominate the {RE[p]} distribu-tions of the RE3+ cations, where REO7 polyhedra constitute thesecond most abundant species for La3+ and Y3+, whereas >30%of the (small) Lu3+ cations assume fivefold coordinations. TheMD-modeled %ZRE-values around six accord semi-quantitativelywith the X-ray absorption spectroscopy results of %ZRE = 6 � 0.5observed throughout the lanthanide-ion series when RE3+ ispresent in a low amount (5 wt% RE2O3) in a Na2Si2O5 basedglass,52 as well as with several MD reports on RE-bearing(alumino)silicate glasses.6,7,26–28
Interestingly, the calculations predict significant fractions0.09 r x[4]
Sc r 0.17, suggesting that Sc3+ might partially assume
PCCP Paper
Ope
n A
cces
s A
rtic
le. P
ublis
hed
on 0
9 Ju
ly 2
013.
Dow
nloa
ded
on 1
2/14
/202
1 2:
18:0
2 PM
. T
his
artic
le is
lice
nsed
und
er a
Cre
ativ
e C
omm
ons
Attr
ibut
ion
3.0
Unp
orte
d L
icen
ce.
View Article Online
15048 Phys. Chem. Chem. Phys., 2013, 15, 15041--15055 This journal is c the Owner Societies 2013
a glass-network forming role in the guise of ScO4 groups, asreported previously for the similarly-sized Mg2+ ion.53–55 Fig. 4(a)displays a typical Sc[4] environment in the Sc(2.21) glass. Thepotential network-forming capability of Sc requires furtherexperimental studies, but may constitute the origin of previouslyreported anomalies in 29Si NMR shifts and unexpectedly lowglass transition temperatures observed from Sc AS glasses.15,17
5.2 Oxygen environments
5.2.1 Oxygen coordinations. We identify the coordinationnumber p of an oxygen species O[p] in the RE–Al–Si–O glassaccording to its total number of bonds to Si and/or Al. Hence,O[1] and O[2] represent non-bridging oxygen (NBO) and BOspecies, respectively.56 They dominate the total O speciation,as follows from Table 2 that lists the fractional population {x[p]
O }
of each O[p] moiety (p = 0, 1, 2, 3) observed in the modeled data.The relative amounts of the BO and NBO environments dependpredominantly on the r-value of the AS glass and hence its RE3+
content; nearly constant x[1]O fractions of E0.23 and 0.32–0.35
are indeed observed for the series of RE(2.21) and RE(2.45)specimens, respectively.
The MD-predicted non-negligible amounts of O[0] (‘‘free O2�
ion’’) and significant O[3] (‘‘oxygen tricluster’’) moieties in thepresent (as well as previously reported16,25–27) RE AS glassesthat involve high-CFS trivalent modifier ions is the primarydistinction between their corresponding O speciations inmono- or di-valent based glasses of otherwise comparablecompositions; compare for instance our results with previousmodeled data from Ca AS glasses.57,58 Whereas both the O[0]
and O[3] populations grow slightly as the RE3+ CFS increases,
Table 4 Parameters for energy-optimized structuresa
Oxide a/pm b/pm c/pm V/nm�3 %RRE–O /pmb
La2O3 (g = 1201)Exp60 393.8 — 613.6 0.0824 253.5Calc. 382.5 (�2.9%) — 603.2 (�1.7%) 0.0764 (�7.3%) 247.5 (�2.4%)LaAlO3 (g = 1201)Exp61 536.5 — 1311.0 0.3268 268.2Calc. 537.0 (0.09%) — 1309.2 (�0.14%) 0.3270 (0.05%) 269.1 (0.34%)
Y2O3
Exp62 1060.7 — — 1.1935 228.6Calc. 1060.3 (�0.04%) — — 1.1921 (�0.11%) 228.4 (�0.09%)Calc.c 1059.3 (�0.13%) — — 1.1887 (�0.40%) 228.1 (�0.22%)Y3Al5O12
Exp63 1200.6 — — 1.7307 237.7Calc. 1208.4 (0.65%) — — 1.7645 (2.0%) 239.7 (0.84%)Calc.c 1201.5 (0.07%) — — 1.7344 (0.22%) 237.8 (0.04%)
Lu2O3
Exp64 1039.1 — — 1.1220 223.6Calc. 1032.3 (�0.65%) — — 1.1001 (�2.0%) 222.5 (�0.49%)Lu3Al5O12
Exp65 1190.6 — — 1.6877 233.0Calc. 1199.4 (0.74%) — — 1.7256 (2.2%) 236.8 (1.6%)
Sc2O3
Exp66 984.9 — — 0.9554 212.1Calc. 1002.7 (1.8%) — — 1.0082 (5.5%) 216.4 (2.0%)ScAlO3
Exp67 493.7 523.2 720.5 0.1861 226.8Calc. 504.0 (2.1%) 526.0 (0.54%) 742.7 (3.1%) 0.1969 (5.8%) 232.8 (2.7%)Sc2Si2O7
d
Exp68 650.3 849.8 468.2 0.2523 212.4Calc. 658.2 (1.2%) 851.1 (0.15%) 482.1 (3.0%) 0.2619 (3.8%) 219.0 (3.1%)
a-SiO2 (g = 1201)Exp69 490.2 — 540.0 0.1124 161.3Calc.e 493.1 (0.59%) — 544.2 (0.78%) 0.1146 (2.0%) 158.9 (�1.5%)BKS34 494.0 (0.78%) — 544.8 (0.89%) 0.1151 (2.5%) 160.1 (�0.74%)CHIK51 504.5 (2.9%) — 552.0 (2.2%) 0.1217 (8.3%) 161.8 (0.31%)
a-Al2O3 (g = 1201)Exp70 476.0 — 1299.6 0.2551 191.3Calc.e 476.7 (0.15%) — 1316.2 (1.3%) 0.2591 (1.6%) 192.5 (0.63%)
a Results of using the interionic potential parameters of Table 1 in lattice-energy calculations that assumed fixed (a, b, g) unit-cell angles, andleading to the calculated (Calc.) cell dimensions (a, b, c) and volume (V). Values within parentheses represent relative deviations from the XRD-derived experimental (Exp) data. b Average RE–O distance, except for the data on a-quartz and a-Al2O3 that reports %RSi–O and %RAl–O, respectively.c Obtained from the Y–O potential parameters of Du.26 d The b-value was optimized to b = 104.081, which may be compared with the XRD-derivedresult of b = 102.771. e Obtained by using the Si–O or Al–O potential parameters of ref. 26, 40 and 41 (see Table 1).
Paper PCCP
Ope
n A
cces
s A
rtic
le. P
ublis
hed
on 0
9 Ju
ly 2
013.
Dow
nloa
ded
on 1
2/14
/202
1 2:
18:0
2 PM
. T
his
artic
le is
lice
nsed
und
er a
Cre
ativ
e C
omm
ons
Attr
ibut
ion
3.0
Unp
orte
d L
icen
ce.
View Article Online
This journal is c the Owner Societies 2013 Phys. Chem. Chem. Phys., 2013, 15, 15041--15055 15049
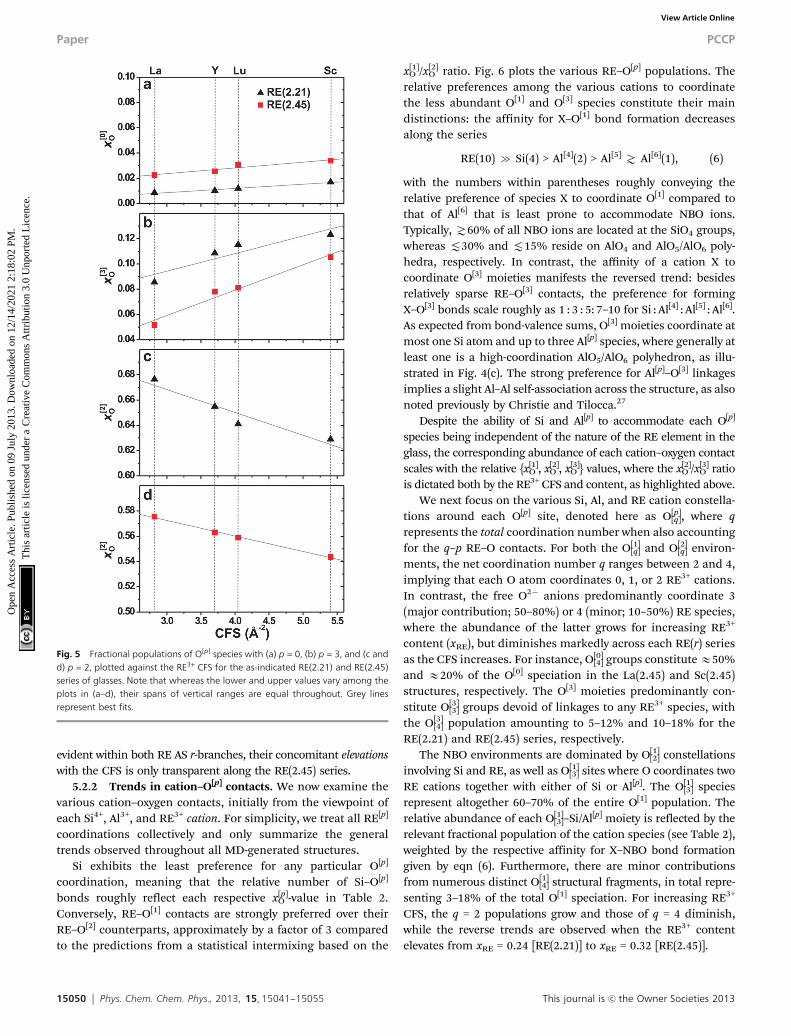
they also depend on the RE3+ content, with x[0]O increasing and
x[3]O decreasing as the r-value of the glass elevates from 2.21 to
2.45, as revealed in Fig. 5. The minor growth of the O[0]
populations for an increase in either the CFS or amount ofthe RE3+ ions suggests an enhanced RE–O–RE association.
While the abundance of free O2� ions depends solely on thenature and amount of the glass modifiers, the O[3] population isadditionally dictated by the nAl/nSi ratio of the glass composi-tion.16,25 The O[3] sites predominantly connect Al-centeredpolyhedra, notably so high-coordination AlO5 and AlO6 groups(see Section 5.2.2). Because the latter populations grow togetherwith both xAl and the RE3+ CFS,16,25 the highest x[3]
O -values(\0.15) are observed for high-CFS Al-rich glasses associatedwith relatively low values of r t 2.21, whereas x[3]
O stayconsistently below 0.10 in La–Al–Si–O structures.25 Thesetrends may be verified from our previous reports on glassesfeaturing variable RE : Al : Si contents within each La,25 Y,16 andLu16 system. Fig. 5(b)–(d) reveal that the O[3] moieties growlargely at the expense of their O[2] counterparts. Further, for a
fixed RE : Al : Si stoichiometric ratio, Table 2 verifies a strongcorrelation between (i) %ZAl, which elevates concurrently withx[5]
Al , as the AlO6 population remains low throughout all glassstructures; (ii) %ZO and (iii) x[3]
O , all of which increase with theRE3+ CFS. However, whereas the %ZAl/ %ZO/x[3]
O correlations are
Fig. 3 (a) MD-derived average RE3+ coordination numbers ( %ZRE) plotted againstthe respective Shannon–Prewitt ionic radius (assuming sixfold coordinations) foreach RE(2.21) and RE(2.45) series. (b and c) Fractional populations x[p]
RE plottedversus the coordination number p for the (b) RE(2.21) and (c) RE(2.45) series ofglasses.
Fig. 4 Some typical fragments in the MD-derived glass structures. (a) A ScO4
tetrahedron (O atoms of which are set in black) in relation to the aluminosilicatenetwork. (b) A SiO4 tetrahedron accommodating one NBO ion and sharingcorners with each of a SiO4, AlO4 and AlO5 group. (c) A ‘‘tricluster moiety’’featuring an AlO6 polyhedron connected to SiO4 and AlO4 groups via corner andedge-sharing, respectively.
PCCP Paper
Ope
n A
cces
s A
rtic
le. P
ublis
hed
on 0
9 Ju
ly 2
013.
Dow
nloa
ded
on 1
2/14
/202
1 2:
18:0
2 PM
. T
his
artic
le is
lice
nsed
und
er a
Cre
ativ
e C
omm
ons
Attr
ibut
ion
3.0
Unp
orte
d L
icen
ce.
View Article Online
15050 Phys. Chem. Chem. Phys., 2013, 15, 15041--15055 This journal is c the Owner Societies 2013
evident within both RE AS r-branches, their concomitant elevationswith the CFS is only transparent along the RE(2.45) series.
5.2.2 Trends in cation–O[p] contacts. We now examine thevarious cation–oxygen contacts, initially from the viewpoint ofeach Si4+, Al3+, and RE3+ cation. For simplicity, we treat all RE[p]
coordinations collectively and only summarize the generaltrends observed throughout all MD-generated structures.
Si exhibits the least preference for any particular O[p]
coordination, meaning that the relative number of Si–O[p]
bonds roughly reflect each respective x[p]O -value in Table 2.
Conversely, RE–O[1] contacts are strongly preferred over theirRE–O[2] counterparts, approximately by a factor of 3 comparedto the predictions from a statistical intermixing based on the
x[1]O /x[2]
O ratio. Fig. 6 plots the various RE–O[p] populations. Therelative preferences among the various cations to coordinatethe less abundant O[1] and O[3] species constitute their maindistinctions: the affinity for X–O[1] bond formation decreasesalong the series
RE(10) c Si(4) > Al[4](2) > Al[5]\ Al[6](1), (6)
with the numbers within parentheses roughly conveying therelative preference of species X to coordinate O[1] compared tothat of Al[6] that is least prone to accommodate NBO ions.Typically, \60% of all NBO ions are located at the SiO4 groups,whereas t30% and t15% reside on AlO4 and AlO5/AlO6 poly-hedra, respectively. In contrast, the affinity of a cation X tocoordinate O[3] moieties manifests the reversed trend: besidesrelatively sparse RE–O[3] contacts, the preference for formingX–O[3] bonds scale roughly as 1 : 3 : 5: 7–10 for Si : Al[4] : Al[5] : Al[6].As expected from bond-valence sums, O[3] moieties coordinate atmost one Si atom and up to three Al[p] species, where generally atleast one is a high-coordination AlO5/AlO6 polyhedron, as illu-strated in Fig. 4(c). The strong preference for Al[p]–O[3] linkagesimplies a slight Al–Al self-association across the structure, as alsonoted previously by Christie and Tilocca.27
Despite the ability of Si and Al[p] to accommodate each O[p]
species being independent of the nature of the RE element in theglass, the corresponding abundance of each cation–oxygen contactscales with the relative {x[1]
O , x[2]O , x[3]
O } values, where the x[2]O /x[3]
O ratiois dictated both by the RE3+ CFS and content, as highlighted above.
We next focus on the various Si, Al, and RE cation constella-tions around each O[p] site, denoted here as O[p]
[q], where qrepresents the total coordination number when also accountingfor the q–p RE–O contacts. For both the O[1]
[q] and O[2][q] environ-
ments, the net coordination number q ranges between 2 and 4,implying that each O atom coordinates 0, 1, or 2 RE3+ cations.In contrast, the free O2� anions predominantly coordinate 3(major contribution; 50–80%) or 4 (minor; 10–50%) RE species,where the abundance of the latter grows for increasing RE3+
content (xRE), but diminishes markedly across each RE(r) seriesas the CFS increases. For instance, O[0]
[4] groups constitute E50%and E20% of the O[0] speciation in the La(2.45) and Sc(2.45)structures, respectively. The O[3] moieties predominantly con-stitute O[3]
[3] groups devoid of linkages to any RE3+ species, withthe O[3]
[4] population amounting to 5–12% and 10–18% for theRE(2.21) and RE(2.45) series, respectively.
The NBO environments are dominated by O[1][2] constellations
involving Si and RE, as well as O[1][3] sites where O coordinates two
RE cations together with either of Si or Al[p]. The O[1][3] species
represent altogether 60–70% of the entire O[1] population. Therelative abundance of each O[1]
[3]–Si/Al[p] moiety is reflected by therelevant fractional population of the cation species (see Table 2),weighted by the respective affinity for X–NBO bond formationgiven by eqn (6). Furthermore, there are minor contributionsfrom numerous distinct O[1]
[4] structural fragments, in total repre-senting 3–18% of the total O[1] speciation. For increasing RE3+
CFS, the q = 2 populations grow and those of q = 4 diminish,while the reverse trends are observed when the RE3+ contentelevates from xRE = 0.24 [RE(2.21)] to xRE = 0.32 [RE(2.45)].
Fig. 5 Fractional populations of O[p] species with (a) p = 0, (b) p = 3, and (c andd) p = 2, plotted against the RE3+ CFS for the as-indicated RE(2.21) and RE(2.45)series of glasses. Note that whereas the lower and upper values vary among theplots in (a–d), their spans of vertical ranges are equal throughout. Grey linesrepresent best fits.
Paper PCCP
Ope
n A
cces
s A
rtic
le. P
ublis
hed
on 0
9 Ju
ly 2
013.
Dow
nloa
ded
on 1
2/14
/202
1 2:
18:0
2 PM
. T
his
artic
le is
lice
nsed
und
er a
Cre
ativ
e C
omm
ons
Attr
ibut
ion
3.0
Unp
orte
d L
icen
ce.
View Article Online
This journal is c the Owner Societies 2013 Phys. Chem. Chem. Phys., 2013, 15, 15041--15055 15051
The same general CFS/xRE trends are observed in thenumber of O[2]–RE contacts; the O[2]
[4] moieties remain t10%throughout all structures, whereas the lower formal charge ofthe O[2] atoms relative to their O[1] counterparts implies overall
higher O[2][2] contributions, dominated by Si–O[2]–Si and
Si–O[2]–Al[4] fragments. Most Si–O[2]–Si bridges constitute O[2][2]
groups devoid of contacts with RE3+. Conversely, roughly equalamounts of O[2]
[2] and O[2][3] motifs contribute to the overall
dominating Si–O[2]–Al[4] linkages. The O[2][3] species involve O[2]
coordinated by one RE3+ cation together with any two membersof the set {Si, Al[4], Al[5], Al[6]}. As expected from the accumulatednegative charges associated with Al[4]–O[2]–Al[4] bridges,56 allsuch motifs require one RE3+ cation for stabilization, reflectedin their sole presence as O[2]
[3] (as opposed to O[2][2]) groups.
O[2][3] moieties are also encountered for the majority of all
interpolyhedral bonds involving either of AlO5 or AlO6, suchas Si–O[2]–Al[5]/Al[6] and Al[4]–O[2]–Al[5]/Al[6] bridges. Generally,the amounts of the various O[2]
[3] groups involving Si–O–Al[p] andAl[p]–O–Al[q] linkages with (p, q) = (4, 5, 6) roughly obey astatistical partitioning based on the products between therelative fractions {xSi, xAlx
[p]Al } associated with each pair of
Si/Al[p] species, as discussed in detail below. Throughout allglass structures, E75–80% of all O[2] sites constitute O[2]
[2](Si, Si),O[2]
[2](Si, Al[4]), O[2][3](Si, Al[4]), O[2]
[3](Al[4], Al[4]) and O[2][3](Si, Al[5])
moieties, where the two interlinked cations are indicatedwithin parentheses.
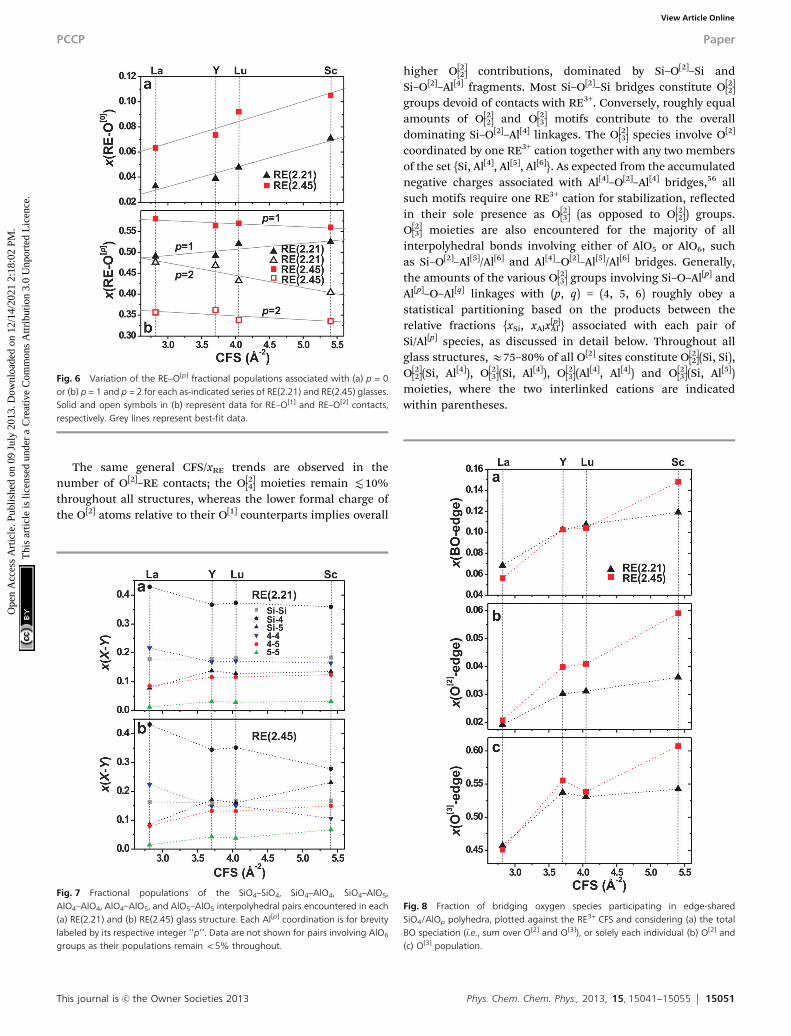
Fig. 7 Fractional populations of the SiO4–SiO4, SiO4–AlO4, SiO4–AlO5,AlO4–AlO4, AlO4–AlO5, and AlO5–AlO5 interpolyhedral pairs encountered in each(a) RE(2.21) and (b) RE(2.45) glass structure. Each Al[p] coordination is for brevitylabeled by its respective integer ‘‘p’’. Data are not shown for pairs involving AlO6
groups as their populations remain o5% throughout.
Fig. 6 Variation of the RE–O[p] fractional populations associated with (a) p = 0or (b) p = 1 and p = 2 for each as-indicated series of RE(2.21) and RE(2.45) glasses.Solid and open symbols in (b) represent data for RE–O[1] and RE–O[2] contacts,respectively. Grey lines represent best-fit data.
Fig. 8 Fraction of bridging oxygen species participating in edge-sharedSiO4/AlOp polyhedra, plotted against the RE3+ CFS and considering (a) the totalBO speciation (i.e., sum over O[2] and O[3]), or solely each individual (b) O[2] and(c) O[3] population.
PCCP Paper
Ope
n A
cces
s A
rtic
le. P
ublis
hed
on 0
9 Ju
ly 2
013.
Dow
nloa
ded
on 1
2/14
/202
1 2:
18:0
2 PM
. T
his
artic
le is
lice
nsed
und
er a
Cre
ativ
e C
omm
ons
Attr
ibut
ion
3.0
Unp
orte
d L
icen
ce.
View Article Online
15052 Phys. Chem. Chem. Phys., 2013, 15, 15041--15055 This journal is c the Owner Societies 2013
5.3 SiO4–AlOp and AlOp–AlOq interpolyhedral connectivities
5.3.1 Al–Si intermixing. The MD-generated glass structuresexhibit networks built by interconnected SiO4 and AlO4 tetra-hedra, as well as network-associated AlO5 and AlO6 polyhedra.These groups link through O[2] and O[3] bridging oxygen species,both of which we henceforth collectively refer to as ‘‘BO’’ atoms.
The various SiO4/AlOp polyhedra manifest a non-preferentialintermixing, leading to an MD-derived fractional populationx(X–Y) of an XOp–YOq pair that is well-approximated by itscorresponding product
xðX�YÞ �MyXyY; withM ¼ 1 for X ¼ YM ¼ 2 for XaY
�: (7)
Each of yX and yY represents the fractional population of thegiven species X and Y out of the total Si and Al speciation,which for the present glass compositions (that exhibit nSi/nAl = 1)corresponds to ySi = 0.5 and y[p]
Al = yAlx[p]Al = 0.5x[p]
Al , with x[p]Al listed
in Table 2. Consequently, owing to the dominance of SiO4 andAlO4 groups followed by AlO5, the most frequently encounteredpairs of structural building blocks represent SiO4–AlO4,SiO4–SiO4, AlO4–AlO4 motifs, and to a lesser extent SiO4–AlO5
and AlO4–AlO5. Fig. 7 plots the relative abundances of thevarious pair-connectivities. Note that owing to the smallamounts of AlO6 polyhedra, all AlO6–XOp contacts remain lowthroughout all structures, with the highest fractions x(Si–Al[6]) Ex(Al[4]–Al[6]) E 0.03 observed in the Sc(2.45) glass.
We verified that the modeled x(X–Y) fractions closely obeya statistical intermixing, where the deviations between theMD-derived values and the predictions from eqn (7) are readilyexplained by the relative preference of each {SiO4, AlOp}polyhedral type to accommodate NBO ions [see eqn (6)]: thecomparatively most abundant Si–NBO bond formation leadsconsistently to somewhat lower x(Si–Si) populations relative tothose predicted by eqn (7), whereas the reluctance of the AlOp
groups to accommodate NBO ions implies the opposite trendfor the x(Al[p]–Al[q]) values. In the context of La2O3–Al2O3–SiO2
glasses, a pronounced Si–Al disorder was verified experimen-tally for SiO4–AlO4 [ref. 24] and AlOp–AlOq [ref. 25] contacts, inthe latter case by a direct connectivity-probing of the variousAlOp–AlOq pairs by double-quantum 27Al NMR spectroscopy.59
5.3.2 Extents of corner and edge sharing. As illustrated byFig. 8(a), the Si/Al[p]-centered polyhedra merge by sharingcorners or edges that constitute >85% and 5–15% out of theentire BO ensemble, respectively. The RE AS structures aredevoid of face-shared SiO4 or AlOp groups. For increasingRE3+ CFS, a slight growth in the relative degree of edge-sharingis observed across each RE(r) glass series, which concerns boththe O[2] and O[3] bridges [Fig. 8(b) and (c)], particularly for theRE(2.45) members. Yet, the relative preferences of the BOspecies to participate in edge-sharing differ substantially: while\95% of all O[2] atoms connect polyhedral corners [Fig. 8(b)],45–60% of the O[3] counterparts are involved in edge-sharing[Fig. 8(c)]. Note that while both the amounts of O[3] moieties (x[3]
O )
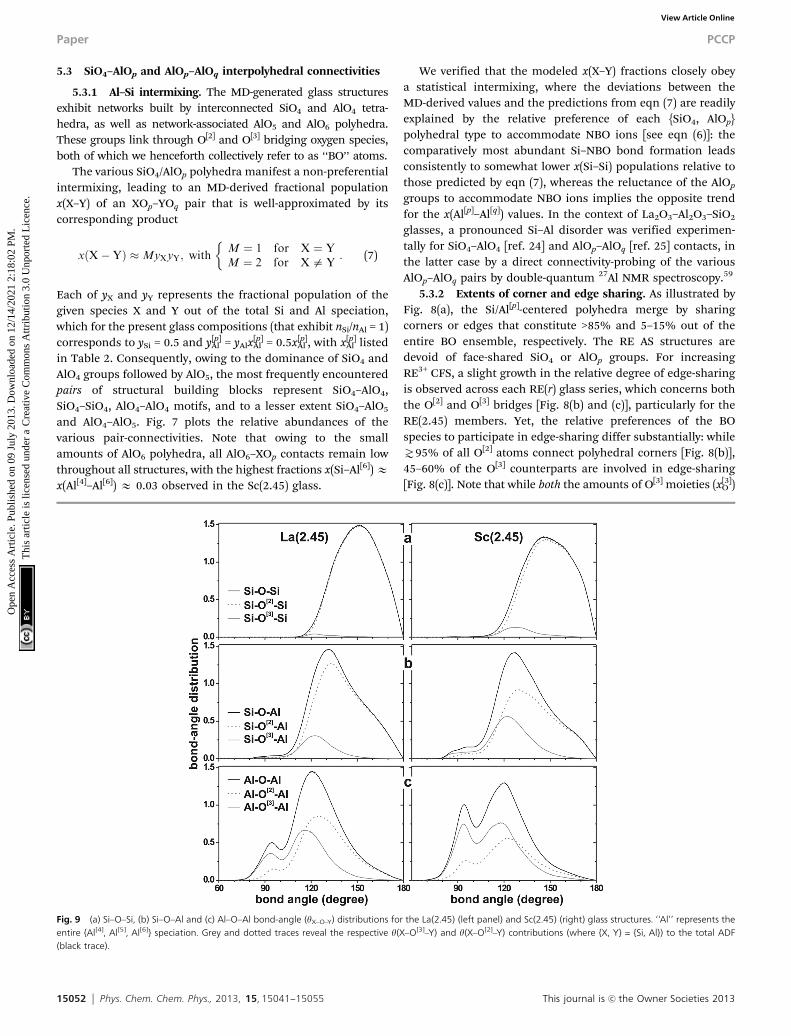
Fig. 9 (a) Si–O–Si, (b) Si–O–Al and (c) Al–O–Al bond-angle (yX–O–Y) distributions for the La(2.45) (left panel) and Sc(2.45) (right) glass structures. ‘‘Al’’ represents theentire {Al[4], Al[5], Al[6]} speciation. Grey and dotted traces reveal the respective y(X–O[3]–Y) and y(X–O[2]–Y) contributions (where {X, Y} = {Si, Al}) to the total ADF(black trace).
Paper PCCP
Ope
n A
cces
s A
rtic
le. P
ublis
hed
on 0
9 Ju
ly 2
013.
Dow
nloa
ded
on 1
2/14
/202
1 2:
18:0
2 PM
. T
his
artic
le is
lice
nsed
und
er a
Cre
ativ
e C
omm
ons
Attr
ibut
ion
3.0
Unp
orte
d L
icen
ce.
View Article Online
This journal is c the Owner Societies 2013 Phys. Chem. Chem. Phys., 2013, 15, 15041--15055 15053
and their affinity for edge-sharing increases concurrently withthe RE3+ CFS, the x[3]
O values decreases with the r-value, asdiscussed in Section 5.2.1.
Striking differences further emerge when comparing the pre-ferences among the various {SiO4, AlO4, AlO5, AlO6} groups toconnect through corners or edges: the strong tendency of O[3]
moieties to interlink the cations by edge-sharing, coupled with theinherently distinct affinities of the cations to form X–O[3] bonds,implies that the participation in edge-shared polyhedra growsalong the series Si t Al[4] { Al[5] o Al[6]. Altogether, the netabundance of edge-shared XOp–YOq polyhedra scales roughly as
Si–Si(0%) E Si–Al[4](o1%) o Al[4]–Al[4](o3%) o Si–Al[5](E5%)
o Si–Al[6](E10%) o Al[4]–Al[5](10–20%)
o Al[4]–Al[6](20–25%) { Al[5]–Al[5](E50%)
o Al[5]–Al[6](60–70%) o Al[6]–Al[6](\75%), (8)
where the numbers within parentheses reflect the edge-sharingcontribution, with the remaining constituting corner-sharedpolyhedra of the respective type. However, whereas a majorityof the AlO5–AlO6 and AlO6–AlO6 linkages occur through edge-sharing, the total amounts of such structural motifs remain verylow, as discussed above. Analogously to the relative preferencesof each Al[p]–O[q] and Si–O[q] contact, no statistically ascertainedvariation is observed among the relative tendencies for corner/edge-sharing of the SiO4/AlOp groups when the RE3+ CFS alters.Fig. 4 illustrates a collection of structural fragments typicallyencountered in the RE AS glass structures.
Edge-shared XOp–YOq polyhedra translate into bond-anglesyX–O–Y E 901 that may be compared with their wider corner-shared analogs peaking in the ranges of 110–1301 for Al–O–Al/Siand 140–1601 for Si–O–Si linkages (see Table 3). Hence, theabundance of edge-shared polyhedra may also be inspectedfrom the plots of the MD-derived angle-distribution functions(ADFs) shown in Fig. 9 for each type of Si–O[p]–Si, Si–O[p]–Al andAl–O[p]–Al contact. The ADF amplitudes of the latter indeedincreases markedly around yAl–O–Al = 901, which is most trans-parent for the structures involving Sc (and Lu; not shown) thatexhibit the largest AlO5/AlO6 populations and thereby the high-est extent of edge-sharing.
6 Concluding remarks
New RE–O interatomic potential parameters were optimized forRE = {La, Y, Lu, Sc} by a force-matching procedure30 involvingab initio derived forces in MD-generated RE–Al–Si–O glassstructures. Overall they performed well both for reproducingdiffraction-derived lattice parameters of crystalline RE-bearingoxide/aluminate structures, as well as short-range features inRE AS glasses, such as previously reported RE–O distances18,22
and {Al[4], Al[5], Al[6]} speciations.16,17,25 These self-consistentRE–O potential parameters are expected to be useful for exploringthe structures of other amorphous as well as well-orderedRE-bearing oxide-based structures.
The MD-derived average Al coordination numbers ( %ZAl)typically reproduce their experimental counterparts within
o2% deviation, with the largest discrepancy (3.5%) observedfor the Sc(2.21) glass. Whereas Sc3+ mainly assumes Sc[5]
coordinations and non-negligible amounts of Sc[4] species(up to E20%), all other (larger) RE3+ ions reveal {RE[p]} specia-tions peaked at p = 6, with La[7] and Lu[5] constituting thesecond most abundant coordinations for La3+ and Lu3+, respec-tively. The simulated structures exhibit essentially randomizedconnectivities among the various SiO4 and AlOp (p = 4, 5, 6)network (associated) polyhedra, a feature attributed to the highcharge of the trivalent RE3+ ions, whose comparatively strongRE3+–O bonds (relative to their M+–O and M2+–O counterparts)perturb any Si/Al ordering and also promote otherwise energe-tically disfavored structural motifs,56 such as free O2� ions,Al[4]–O–Al[4] bridges, and Al–O[1] contacts. These trends areprimarily reflected by the following structural alterations whenthe RE3+ CFS increases along the series La3+ o Y3+ o Lu3+ o Sc3+:
(i) An increase in the minor but non-negligible populationsof free O2� ions (o3.5%) is observed, suggesting a strongerRE–O–RE self-association, where each O[0] site coordinates 3 or 4RE3+ cations. The x[0]
O values also increase with the RE3+ content.(ii) Each of %ZAl and %ZO increases by elevating Al[5] and O[3]
populations, respectively, at the expense of the dominating Al[4]
and O[2] counterparts.(iii) Whereas >85% of all SiO4 and AlOp polyhedra connect
through corners, the degree of edge-sharing increases steadilyfrom E5% in the La-based glasses to E15% in the Sc analogs.Owing to the strong affinity for Al[5]–O[3] and Al[6]–O[3] bondformation combined with the pronounced tendency of O[3]
moieties to create edge-sharing, large fractions of all AlO5 andAlO6 linkages to other groups occur via edge-sharing.
Altogether, the structures of RE2O3–Al2O3–SiO2 glassesexhibit a pronounced disorder both in their distributions ofO[p], Al[p] and RE[p] coordinations and how the various struc-tural motifs combine. Effectively, (i) and (ii) imply partialO[1] - O[0] and O[2] - O[3] net conversions as the RE3+ CFSgrows, thereby amounting in more complex O[p] speciationscompared with the sole presence of O[1] and O[2] moietiesexpected from traditional theories of glass structures.56
The present study corroborates and reinforces previousexperimental and computational findings that the structuresof RE2O3–Al2O3–SiO2 glasses are strongly influenced by the RE3+
CFS over both short and medium ranges.12–18,24–28 The largeCFS-span across the set {La3+, Y3+, Lu3+, Sc3+}, coupled with theoverall monotonic (and occasionally approximately linear; seeFig. 5 and 6) trends of several structural features against thefield-strength, suggest the possibility of roughly assessing thecorresponding feature in another RE–Al–Si–O glass that exhi-bits a similar cation composition but a distinct RE3+ ion, basedon its CFS-value relative to those considered herein.
Acknowledgements
This work was supported by the Swedish Research Council(contract VR-NT 2010-4943) and the Faculty of Sciences atStockholm University. We thank Jekabs Grins and AlexanderLyubartsev for discussions.
PCCP Paper
Ope
n A
cces
s A
rtic
le. P
ublis
hed
on 0
9 Ju
ly 2
013.
Dow
nloa
ded
on 1
2/14
/202
1 2:
18:0
2 PM
. T
his
artic
le is
lice
nsed
und
er a
Cre
ativ
e C
omm
ons
Attr
ibut
ion
3.0
Unp
orte
d L
icen
ce.
View Article Online
15054 Phys. Chem. Chem. Phys., 2013, 15, 15041--15055 This journal is c the Owner Societies 2013
References
1 V. McGahay and M. Tomozawa, J. Non-Cryst. Solids, 1993,159, 246–252.
2 N. D. Afify and G. Mountjoy, Phys. Rev. B: Condens. MatterMater. Phys., 2009, 79, 024202.
3 J. Coon and J. E. Shelby, Phys. Chem. Glasses, 1994, 35,47–51.
4 J. E. Shelby, Key Eng. Mater., 1994, 94–95, 43–80.5 T. Schaller, J. F. Stebbins and M. C. Wilding, J. Non-Cryst.
Solids, 1999, 243, 146–157.6 B. Park, H. Li and L. R. Corrales, J. Non-Cryst. Solids, 2002,
297, 220–238.7 J. A. Johnson, C. J. Benmore, D. Holland, J. Du, B. Beuneu
and A. Mekki, J. Phys.: Condens. Matter, 2011, 23, 065404.8 A. Makishima, M. Kobayashi, T. Shimohria and T. Nagata,
J. Am. Ceram. Soc., 1982, 65, C210–C211.9 M. J. Hyatt and D. E. Day, J. Am. Ceram. Soc., 1987, 70,
C283–C287.10 J. T. Kohli and J. E. Shelby, Phys. Chem. Glasses, 1991, 32,
67–71.11 S. Iftekhar, J. Grins and M. Eden, J. Non-Cryst. Solids, 2010,
356, 1043–1048.12 J. T. Kohli, J. E. Shelby and J. S. Frye, Phys. Chem. Glasses,
1992, 33, 73–78.13 T. Schaller and J. F. Stebbins, J. Phys. Chem. B, 1998, 102,
10690–10697.14 P. Florian, N. Sadiki, D. Massiot and J. P. Coutures, J. Phys.
Chem. B, 2007, 111, 9747–9757.15 S. Iftekhar, J. Grins, P. N. Gunawidjaja and M. Eden, J. Am.
Ceram. Soc., 2011, 94, 2429–2435.16 S. Iftekhar, B. Pahari, K. Okhotnikov, A. Jaworski,
B. Stevensson, J. Grins and M. Eden, J. Phys. Chem. C,2012, 116, 18394–18406.
17 B. Pahari, S. Iftekhar, A. Jaworski, K. Okhotnikov,K. Jansson, B. Stevensson, J. Grins and M. Eden, J. Am.Ceram. Soc., 2012, 95, 2545–2553.
18 N. Sadiki, L. Hennet, P. Florian, Y. Vaills, D. Massiot andJ.-P. Coutures, Mater. Tech., 2010, 98, 409–421.
19 P. J. Hayward, Radioactive Waste Forms for the Future,North-Holland, Amsterdam, 1988.
20 S. D. Chen, J. F. Hsieh, S. C. Tsai, W. Y. Lin, K. Y. Cheng andS. J. Wang, Nucl. Med. Commun., 2001, 22, 121–125.
21 B. Stevensson and M. Eden, J. Non-Cryst. Solids, 2013, 378,163–167, DOI: 10.1016/j.jnoncrystsol.2013.06.013.
22 I. Pozdnyakova, N. Sadiki, L. Hennet, V. Cristiglio,A. Bytchkov, G. J. Cuello, J. P. Coutures and D. L. Price,J. Non-Cryst. Solids, 2008, 354, 2038–2044.
23 E. Leonova, A. S. Hakeem, K. Jansson, B. Stevensson,Z. Shen, J. Grins, S. Esmaeilzadeh and M. Eden, J. Non-Cryst. Solids, 2008, 354, 49–60.
24 S. Iftekhar, E. Leonova and M. Eden, J. Non-Cryst. Solids,2009, 355, 2165–2174.
25 A. Jaworski, B. Stevensson, B. Pahari, K. Okhotnikov andM. Eden, Phys. Chem. Chem. Phys., 2012, 14, 15866–15878.
26 J. Du, J. Am. Ceram. Soc., 2009, 92, 87–95.
27 J. K. Christie and A. Tilocca, Chem. Mater., 2010, 22,3725–3734.
28 J. K. Christie and A. Tilocca, J. Phys. Chem. B, 2012, 116,12614–12620.
29 M. Eden, J. Non-Cryst. Solids, 2011, 357, 1595–1602.30 F. Ercolessi and J. B. Adams, Europhys. Lett., 1994, 26,
583–588.31 M. P. Allen and D. J. Tildesley, Computer Simulation of
Liquids, Oxford, Clarendon, 1989.32 W. Smith and T. R. Forester, J. Mol. Graphics, 1996, 14,
136–141.33 I. T. Todorov, W. Smith, K. Trachenko and M. T. Dove,
J. Mater. Chem., 2006, 16, 1911–1918.34 B. W. H. van Beest, H. J. Kramer and R. A. van Santen, Phys.
Rev. Lett., 1990, 64, 1955–1958.35 V. A. Bakaev and W. A. Steele, J. Chem. Phys., 1999, 111,
9803–9812.36 R. H. Swendsen, Phys. Rev. Lett., 1979, 42, 859–861.37 A. Lyubartsev and A. Laaksonen, Phys. Rev. E: Stat. Phys.,
Plasmas, Fluids, Relat. Interdiscip. Top., 1995, 52, 3730–3737.38 E. Lomba and J. L. Lopez-Martın, J. Chem. Phys., 1996, 104,
5244–5250.39 K. W. Jacobsen, J. K. Nørskov and M. J. Puska, Phys. Rev. B:
Condens. Matter Mater. Phys., 1987, 35, 7423–7442.40 J. Du and A. N. Cormack, J. Am. Ceram. Soc., 2005, 88,
2532–2539.41 J. Du and L. R. Corrales, J. Non-Cryst. Solids, 2007, 353,
210–214.42 R. D. Shannon, Acta Crystallogr., Sect. A: Cryst. Phys., Diffr.,
Theor. Gen. Cryst., 1976, 32, 751–767.43 M. Petersen, Comput. Phys. Commun., 2000, 126, 294–309.44 D. J. Singh and L. Nordstrom, Planewaves, Pseudopotentials
and the LAPW Method, Springer-Verlag, Berlin, 2006.45 J. P. Perdew, K. Burke and M. Ernzerhof, Phys. Rev. Lett.,
1996, 77, 3865–3868.46 P. Blaha, K. Schwarz, G. K. H. Madsen, D. Kvasnicka and
J. Luitz, WIEN2k, An Augmented Plane Wave + Local Orbi-tals Program for Calculating Crystal Properties, KarlheinzSchwarz, Techn. Universitat Wien, Wien, Austria, 2001.
47 P. Pulay, Mol. Phys., 1969, 17, 197–204.48 J. D. Gale and A. L. Rohl, Mol. Simul., 2003, 29, 291–341.49 G. Bergerhoff and I. D. Brown, Crystallographic Databases,
International Union of Crystallography, Chester, 1987.50 A. Pedone, G. Malavasi, M. C. Menziani, A. N. Cormack and
U. Segre, J. Phys. Chem. B, 2006, 110, 11780–11795.51 A. Carre, J. Horbach, S. Ispas and W. Kob, Europhys. Lett.,
2008, 82, 17001.52 M. R. Cicconi, G. Giuli, E. Paris, P. Courtial and
D. B. Dingwell, J. Non-Cryst. Solids, 2013, 362, 162–168.53 C. A. Angell, P. A. Cheeseman and R. R. Kadiyala, Chem.
Geol., 1987, 62, 83–92.54 M. Guignard and L. Cormier, Chem. Geol., 2008, 256,
111–118.55 D. R. Neuville, L. Cormier, V. Montouillout, P. Florian,
F. Millot, J.-C. Rifflet and D. Massiot, Am. Mineral., 2008,93, 1721–1731.
Paper PCCP
Ope
n A
cces
s A
rtic
le. P
ublis
hed
on 0
9 Ju
ly 2
013.
Dow
nloa
ded
on 1
2/14
/202
1 2:
18:0
2 PM
. T
his
artic
le is
lice
nsed
und
er a
Cre
ativ
e C
omm
ons
Attr
ibut
ion
3.0
Unp
orte
d L
icen
ce.
View Article Online
This journal is c the Owner Societies 2013 Phys. Chem. Chem. Phys., 2013, 15, 15041--15055 15055
56 M. Eden, Annu. Rep. Prog. Chem., Sect. C, 2012, 108,177–221.
57 L. Cormier, D. Ghaleb, D. R. Neuville, J.-M. Delaye andG. Calas, J. Non-Cryst. Solids, 2003, 332, 255–270.
58 A. Pedone, E. Gambuzzi, G. Malavasi and M. C. Menziani,Theor. Chem. Acc., 2012, 131, 1147.
59 A. Y. H. Lo and M. Eden, Phys. Chem. Chem. Phys., 2008, 10,6635–6644.
60 P. Aldebert and J. P. Traverse, Mater. Res. Bull., 1979, 14,303–323.
61 B. C. Chakoumakos, D. G. Schlom, M. Urbanik and J. Luine,J. Appl. Phys., 1998, 83, 1979–1982.
62 M. M Faucher and J. Pannetier, Acta Crystallogr., Sect. B:Struct. Crystallogr. Cryst. Chem., 1980, 36, 3209–3211.
63 A. Nakatsuka, A. Yoshiasa and T. Yamanaka, Acta Crystallogr.,Sect. B: Struct. Sci., 1999, 55, 266–272.
64 F. Hanic, M. Hartmanova, G. G. Knab, A. A. Urusovskayaand K. S. Bagdasarov, Acta Crystallogr., Sect. B: Struct. Sci.,1984, 40, 76–82.
65 F. Euler and J. A. Bruce, Acta Crystallogr., 1965, 19, 971–978.66 A. Bartos, K. P. Lieb, M. Uhrmacher and D. Wiarda, Acta
Crystallogr., Sect. B: Struct. Sci., 1993, 49, 165–169.67 R. J. Hill and I. Jackson, Phys. Chem. Miner., 1990, 17, 89–96.68 Y. I. Smolin, Y. F. Shepelev and A. P. Titov, Kristallografiya,
1972, 17, 857–858.69 G. A. Lager, J. D. Jorgensen and F. J. Rotella, J. Appl. Phys.,
1982, 53, 6751–6756.70 L. Lutterotti and P. Scardi, J. Appl. Crystallogr., 1990, 23, 246–252.
PCCP Paper
Ope
n A
cces
s A
rtic
le. P
ublis
hed
on 0
9 Ju
ly 2
013.
Dow
nloa
ded
on 1
2/14
/202
1 2:
18:0
2 PM
. T
his
artic
le is
lice
nsed
und
er a
Cre
ativ
e C
omm
ons
Attr
ibut
ion
3.0
Unp
orte
d L
icen
ce.
View Article Online


![MATTIAS SJÖBLOM MARCUS HEDENSTRÖMpublications.lib.chalmers.se/records/fulltext/157435.pdf · MATTIAS SJÖBLOM MARCUS HEDENSTRÖM ... (4PL) [10], meaning that we do not operate any](https://static.fdocuments.us/doc/165x107/5aa334657f8b9aa0108e419d/mattias-sjblom-marcus-h-sjblom-marcus-hedenstrm-4pl-10-meaning-that-we.jpg)