Kinship, Social Preferences and Voting in Rural China: A ... · Kinship, Social Preferences and...
44
Kinship, Social Preferences and Voting in Rural China: A Lab-in-the-Field Experiment Xin Gao *1 and Hong Fu 2 1 Dyson School of Applied Economics and Management, Cornell University 2 School of Insurance, Shandong University of Finance and Economics Abstract Economists have come to understand that human choices are not only driven by self-interest but also “social preferences” – a person’s concern over resources allocated to other people. Moreover, such preferences may be affected by the environment in which such choices are made, especially social networks and social pressure. We performed a lab-in-the-field experiment in rural China, where we recruited 162 Chinese farmers to vote in 7 variants of allocation games in randomly assigned groups and with real-world social contacts, with and without pressure. We find that social network and social pressure combined have significant yet heterogeneous effects on social preferences. The source of heterogeneity include the assignment with in-group or out-group members, membership in dominant lineages, individual characteristics as defined by age and gender, and the degree of kinship between individuals within a social group. Our study not only provide empirical evidence for the social preference theories but also urges policy makers to be careful in choosing an appropriate voting method. In addition, constraining the power of dominant lineage and having better educated villagers more involved in village affairs could be welfare improving. * Xin Gao: Dyson School of Applied Economics and Management, Cornell University. Address: 362 Warren Hall, Cornell University Ithaca NY 14850 (E-mail: [email protected]) 1
Transcript of Kinship, Social Preferences and Voting in Rural China: A ... · Kinship, Social Preferences and...
Kinship, Social Preferences and Voting in Rural China: ALab-in-the-Field Experiment
Xin Gao∗1 and Hong Fu2
1Dyson School of Applied Economics and Management, Cornell University2School of Insurance, Shandong University of Finance and Economics
Abstract
Economists have come to understand that human choices are not only driven by self-interest but also“social preferences” – a person’s concern over resources allocated to other people. Moreover, suchpreferences may be affected by the environment in which such choices are made, especially socialnetworks and social pressure. We performed a lab-in-the-field experiment in rural China, wherewe recruited 162 Chinese farmers to vote in 7 variants of allocation games in randomly assignedgroups and with real-world social contacts, with and without pressure. We find that social networkand social pressure combined have significant yet heterogeneous effects on social preferences. Thesource of heterogeneity include the assignment with in-group or out-group members, membershipin dominant lineages, individual characteristics as defined by age and gender, and the degree ofkinship between individuals within a social group. Our study not only provide empirical evidencefor the social preference theories but also urges policy makers to be careful in choosing an appropriatevoting method. In addition, constraining the power of dominant lineage and having better educatedvillagers more involved in village affairs could be welfare improving.
∗Xin Gao: Dyson School of Applied Economics and Management, Cornell University. Address: 362 Warren Hall,Cornell University Ithaca NY 14850 (E-mail: [email protected])
1
1. Introduction
Economic behaviors of human beings have been modeled on the basic assumption that individualsare rational agents driven exclusively by self-interest, maximizing their own utilities defined inmonetary or material terms. However, this assumption is often contradicted by casual observationsin history 1 as well as in the real world 2. In recent years, “social preferences” – a person’s concernover resources allocated to others – have been introduced to complement self-interest 3. Parallelto the theoretical modeling are lab experiment results that refute the self-interest assumption andreveal that people exhibit social preferences when making economic decisions (Guth, Schmittberger& Schwarze, 1982; Engelmann and Strobel, 2004; Bolton and Ockenfels, 2006; Messer et al., 2010). Akey aspect that is missing from the literature, however, is whether or not such social preferences aredependent on social network (whose interests are involved) and social pressure (how such preferencesare elicited). In this paper, we perform a lab-in-the-field experiment where we introduce dyad-levelsocial networks (the lineage) and randomly assignment of pressure treatment into the experimentaldesign. We invite villagers in rural China to bring in their real-world social contacts to play an arrayof allocation games, with and without social pressure. We find that social preferences are affectedthe combined force of social network and social pressure. The effects, however, are heterogeneousand vary with lineage dominance, personal characteristics, as well as distance between individualswithin a lineage.
The primary objective of our study is to address the incompetence of lab experiments in identi-fying network-dependent social preferences. In most of the lab experiments, “the subjects enterthe laboratory as equals, they do not know anything about each other and they are allocated todifferent roles in the experiment at random”, while in reality, “the social context, the saliency ofparticular agents, and the social proximity among individuals, are all likely to influence referencegroups and outcomes” (Fehr and Schmidt, 1999). This is supported by a observational studies onthe impact of social network characteristics on cooperative behaviors. These studies have a widegeographical and cultural coverage and show evidence from the United States (Alesina et al., 1997),India (Banerjee, Iyer and Somanathan, 2005), the United Kingdom (Bandiera et al., 2005), Kenya(Miguel and Gugerty, 2005), and China (Miquel et al., 2012). The findings generally indicate thatmore fragmented social network structure reduces cross-group cooperation and leads to lower levelof public goods provision. Therefore, even if a lab experiment finds that people care more aboutfairness than total welfare (Bolton and Ockenfels, 2006), it may not be the case in the real worldbecause in the real world people are embedded in networks instead of floating around like freeatoms.
Acknowledging its importance, more recent lab studies attempt to incorporate social network into
1Mass demonstrations to overturn dictatorships in China and Eastern Europe2Blood donation, volunteer activities, etc.3Three major types of social preferences are theoretically modeled: altruism, where people positively value material
resources allocated to relevant reference agents (Andreoni, 1989; Cox et al., 2001; modeled as efficiency in Engelmannand Strobel, 2004); inequality aversion, where people prefer an equitable distribution of material resources (Fehr andSchmidt, 1999; Bolton and Ockenfels, 2000), and reciprocity, where people respond to actions that are perceived tobe kind in a kind manner, and to actions that are perceived to be hostile in a hostile manner (Rabin, 1993; Charnessand Rabin, 2002)
2
their experimental designs. Their approaches of introducing networks, however, are either tempo-rary (on-site assignment of groups within the lab) or categorical (group affiliation instead of dyadlevel interpersonal relationships). One example of the temporary assignment approach is Chen andLi (2009), where participants that prefer paintings by the same artists are assigned to the samesocial group. This “’group identity” is then reinforced through a few rounds of within-group in-teractions. This approach, however, fails to incorporate personal histories in the real world and islikely to be rather weak. Guala and Filippin (2005), for example, manipulates the complexity ofdistributive tasks to show that the induced group identity is merely a framing effect that can beeasily displaced by alternative decision heuristics. On the other end of the spectrum is the cate-gorical assignment using existing social groups, for example college fraternities in Kollock (1998)and tribes in Bernhard et al. (2006). They found that group affiliation has a significant effect ondistributional preferences – people favor in group members at the expense of outgroup members.The problem with this method is that it homogenizes social ties within a group and mutes the morenuanced effects of interpersonal relationships. Namely, if A and B belong to the same fraternity,they must favor everyone else in the fraternity to the same extent and treat anyone outside thefraternity with the same degree of hatred. Therefore, to more realistically characterize the effect ofnetwork on preferences, a dyad-level approach that reflects the mutual, specific, and context-boundinteractions between individuals is necessary.
Bringing a community with identifiable dyad-level personal relationships into a behavioral lab ismostly unrealistic due to long travel distance and conflicting schedules of community members. Wetherefore decide to carry the lab to the field and invite participants to bring in their real-world socialcontacts to a set of experiments without having to travel from their communities. The design ofour experiment (explained in detail in Section 4) will allow us to examine the nuanced dependenceof social preferences on social network. We also conduct a post-experiment survey to collect infor-mation on the specifics of the interpersonal relationship between each pair of participants, whichallows us to investigate (1) how participants perceive resources allocated to in-group and out-groupmembers; (2) if members of dominant social groups have different social preference patterns; (3)if social preferences vary with personal characteristics such as gender and age; (4) if variations insocial preferences can be explained by social proximity.
Another aspect that is missing from the literature is how social pressure affects social preferences,especially when such pressure interacts with social network effects. It is true that some recenteconomic experiments incorporate peer pressure as a form of informal sanction and find that disap-proval of other agents can increase contribution to public goods (Masclet et al, 2003), and that theallocators in third-party allocation games choose less efficient but more equal distributions whenrecipients are identifiable (Halali et al, 2017). These lab experiments, however, still recruited in-dependent participants and therefore failed to test how social pressure adds on to social network.Our study, on the other hand, investigates the interaction effect of social pressure and social net-work by randomly assigning participants into a control group, where anonymity is ensured, and atreatment group, where participants are informed that their choices will be revealed to other par-ticipants. This assignment is performed in the social network context where participants play withtheir social contacts and in the random assignment context where participants play with unknownmembers. We also interact the social pressure with social proximity between participants to test ifthe pressure effect depends on degree of kinship.
3
The current paper is to our knowledge the first lab-in-the-field experiment that embeds dyad level,real-world network structure into allocation games. By observing choices made by any pair ofparticipants in our games and obtaining information on their social interaction in real life, we areable to examine the complex interplay of social preferences and social pressure in the context ofthe very details of social network. Our study not only serves as an empirical test for the longdebated social preference theories but also provides insights at the policy level. Our results showthat in any society where social interactions are frequent and personal, the design of a welfare-enhancing policy where collective action is involved (voting, donation, private provision of publicgoods, etc.) requires a thorough understanding of the social preference patterns of participants andhow such preferences interact with the specific network structure and social norms. Without suchconsiderations, identifying an appropriate roadmap of collective action (in the case of voting, policymakers need to choose among secret balloting, show of hands, village meeting, etc.) that yieldseconomically efficient outcomes would be difficult.
The rest of this paper is organized as follows. In section 2, we explain the reason why we chooseto carry out our experiment in rural China, including the history and characteristics of lineagenetworks in China; In section 3, we introduce our experimental design and procedures. In section4, we present our regression models and empirical results. Section 5 concludes.
2. Social Network and Social Preferences in the Chinese Context
We choose to implement this experiment in rural China for three reasons, which will be elaboratedin the following subsections. First of all, lineages saliently define the basic social network structurein rural China and have long been governing the economic and social behaviors of Chinese villagers(Cohen 2005; Liu and Murphy 2006). Such salience facilitates our recruitment as well as theidentification of network effects. Secondly, the rich and observable variations in the patrilinealrelationships in the Chinese rural society can be exploited to test how social preferences varywith personal characteristics and with the strength of social ties. Thirdly, the interplay of socialnetwork, social pressure, and social preferences is particularly relevant to recent policy changes invillage governance in China and other developing countries.
2.1 Salience of Lineage Network in Rural China
Social networks exist in numerous forms, but the network in rural china that centers on patrilineallineage ties is especially salient and deeply entrenched. A lineage is a branch of residents thatdescend from the same patrilineal ancestors and share the same surname. The patrilineal lineagesystem has over 3000 years of history form the basis of the Chinese social network (Hu, 2007). Sincefarmers are attached to their lands, usually the households in a lineage cluster in a settlement forgenerations, and this long-term connection and repeated interactions make lineage structure withina village rather stable (Coate and Ravallion, 1993). Lineages draw so much on their networks forcollective activities that every aspect of village lives revolves around lineages (Cohen 2005; Liu andMurphy 2006; Lu and Tao 2017) 4. Such stable entrenchment of qualify Chinese villages as an ideal
4In terms of economic affairs, lineage groups have taken on governmental functions such as property protection
4
setting to carry out this field experiment.
2.2 Heterogeneous Effects of Lineage Network
The advantage of exploiting the lineage network structure is rural China that its rich and identifi-able variations allows us to ascertain (1) how participants perceive resources allocated to in-groupand out-group members; (2) if members of dominant lineages (big surnames) have different socialpreference patterns; (3) if social preferences vary with personal characteristics such as gender andage; (4) if variations in social preferences can be explained by social proximity (closer relationshipwithin a lineage).
In-group vs Out-group Allocations
Community in Sociology is often defined as a “group of insider people” or called “insiders-we”compared to “outsiders-they” (Landa 1997: 110, 130). This division of in-group and out-grouphas been particularly evident in China, where lineage groups tend to be inwardly focused andself-interested and that ‘great inward cohesion [is] gained at the expense of equivalent outwardantagonism’ 5 (Baker, 1979: 121–2). It would therefore be interesting to examine how individualsperceive resources allocated to in-group versus out-group members, especially if in-group favorswould be offered “at the price of hostility towards out-group members” (Fukuyama, 2001: 8).
Lineage Dominance
Another interesting feature of the lineage system in rural China is the existence of dominant lineages;that is, a large proportion of residents share the same surname. Relying on the vast of their lands andtheir prestige in village history, the dominant lineages control the economic and political resourcesand influence village affairs heavily. Smaller lineage groups, on the other hand, are often suppressedand bullied in the form of name-calling, the vandalism of crops and property and the withholdingof irrigation water by the members of the larger kinship groups in their villages (Liu and Murphy,2006). The display of social preferences may change as the degree of lineage dominance increases(Pan, 2011). This is because in a large lineage group, a member’s selfish choice may result in morelineage members’ retaliation. Also the cost of defection potentially rises as the size of the lineageincreases, since the deviant can be denied access to a greater amount of resources withheld by thelarge lineage (He et al, 2017). In our experiment, we will test the how social preferences vary with
and tax collection (Huang 2008). The provision of village public goods such as elementary schools and irrigationsystems has also relied heavily on the donation of major lineage groups (Tsai, 2007; Miquel et. al. 2012). In termsof political affairs, strong lineages influence village elections to ensure members’ entry into village power operations(Thurston 1998). In some villages, strong lineage networks are mobilized to unite villagers to resist implementationof unpopular birth control policies (Peng 2010). Wary that lineage might counterbalance state power, the Maogovernment attempted to force peasants to break away from the lineage system and by establishing an administrativevillage system(He 2003). However, as the economic reforms proceed, the lineage system has undergone a remarkablerevival in rural China (Xiao 2001; He 2003) and regained its influence on village affairs.
5It is also documented in Liu and Murphy (2006) that in many villages in mid 1990s, members of small descentgroups were pushed out of their residential villages by larger descent groups and relocating to their ancestral villages.The rationale behind such territorializing actions is that lineage members did not want to allow a share to those whowere outsiders
5
the degree of lineage dominance.
Personal Characteristics
The lineage ties in rural China are highly individualistic phenomenon in the sense that each tiecan only be specified with reference to a particular individual. Hence, an individual’s personalcharacteristics, such as gender and age, can affect his or her position within the network andconsequently his or her social preferences. Female members, for example, are positioned inferiorlyin this patriarchal system and do not have moral authority as male members do (He 2017). Age isanother factor because in the lineage system, seniority equals authority 6. It is therefore expectedthat behaviors in our games may depend on personal characteristics of the players.
Network Characteristics
The sacredness of family tree, the genealogical table that records the human relationship betweenlineage members, is another feature of the lineage network in rural China. A physical copy of thefamily tree is kept in the lineage temple, and every member is aware of his position relative toeveryone else in the lineage. The strength of dyadic ties in the lineage system depends on socialproximity, namely, how close the two agents are in the family tree. The closer agents may thereforedisplay stronger social preferences and may tend to do so at greater costs to the out-group member.We also test this hypothesis in our experiment.
2.3 Lineage Network and Rural Democracy
Another reason why we chose rural China for implementation is because the interplay of socialnetwork and social preferences has profound policy implications for the democratization movementin recent years. Since late 1990s, the political and economic aspects of village affairs becamemore and more democratized. Village leaders are elected instead of nominated, and public projectproposals need to be voted on before implementation7. The outcomes of such collective decisionmaking, however, largely depend on how individuals perceive the tradeoffs between selfish gainsand the social optimality when making choices. It has been reported that some villages can hardlyever reach an agreement and hence have never had any public projects implemented. Welfare aidsseldom reach the poorest households but end up being allocated to the dominant lineage groups.
One plausible cause, as discussed in the pages before, is that heterogeneous lineage groups oftenhave conflicting interests and tend to only care about in-group members’ welfare. Social pressureis another plausible factor. An interesting observation we have made from our field research isthat villages use various voting methods in village meetings, ranging from a secret ballot to ashow of hands. The lack of anonymity may alter the pattern of social preferences displayed in
6Confucianism supports patrimonial power and emphasizes that everyone should “respect their superiors, theyoung should respect the old and the old should love the young” (Hu, 2007)
7One example is the introduction of the “One Project, One Review” (“Yi Shi Yi Yi”) scheme in 2007, wherevillagers jointly propose public projects that they wish to implement and vote on the proposal. In addition, welfareallocations are also determined in a more decentralized way in villages nowadays. Villagers gather at village meetingsto vote on which households should be provided with the rice or flour allocations from the upper level governments.
6
voting, for example making lineage members more fixated on in-group gains, thereby exacerbatingthe inefficiency of resource allocation. Therefore, we believe carrying out this experiment in thevillages in China will help offer valuable policy insights. Moreover, our experimental results can beexpanded to other developing countries in the process of democratization, whose formal institutionsare weak and informal institutions such as lineages, tribes, or castes guide people’s behavior.
Our experimental design allows us to not only identify the effects of network and pressure on socialpreferences, but also to ascertain the source of the heterogeneity of such effects (in-group vs out-group, lineage dominance, personal and network characteristics). The identification of preferenceparameters and network/pressure effects is achieved by manipulating the payoff structure of ourallocation games, whereas the identification of the source of heterogeneity is made possible by ourpost-experiment questionnaire, where we obtain information on demographics of all participantsand the degree of kinship between any pair.
3. Experimental Design
We designed a series of three-person allocation games and use participants’ choices in these gamesto characterize social preference patterns. To test if voters behave differently when they vote ina network setting (i.e. with their social contacts) or under social pressure, we invite participantsto play with anonymous group members and with people from his/her social network, either withsocial pressure or without. Subsection 3.1 discusses the payoff structure and assignment rules ofthe experiment, and Subsection 3.2 describes recruitment and experiment procedure in detail.
3.1 Payoff Structure and Assignment Rules
Our experiment consists of 7 variants of a three-person allocation game. The baseline payoff struc-ture of the 7 games is presented in Figure 1. Before each game, each participant receives a handoutthat presents payoffs to the 3 people in his group, with payoff to himself highlighted. Participantsare informed that a 3-person group is formed to vote and decide which allocation scheme, outof two alternatives, will be implemented. The voting follows a majority rule. That is, if two orthree people in the 3-person group vote “yes”, each of them will get paid the amount indicatedin the “Yes” column. Otherwise each individual will be paid the amount indicated in the “No”column. No discussion is allowed. The payoff structure and voting rules have been shown to beincentive compatible, that is, “as long as voters have strict preferences over outcomes, voting forone’s preferred outcome is the unique trembling-hand perfect equilibrium” (Bolton and Ockenfels,2006).
7
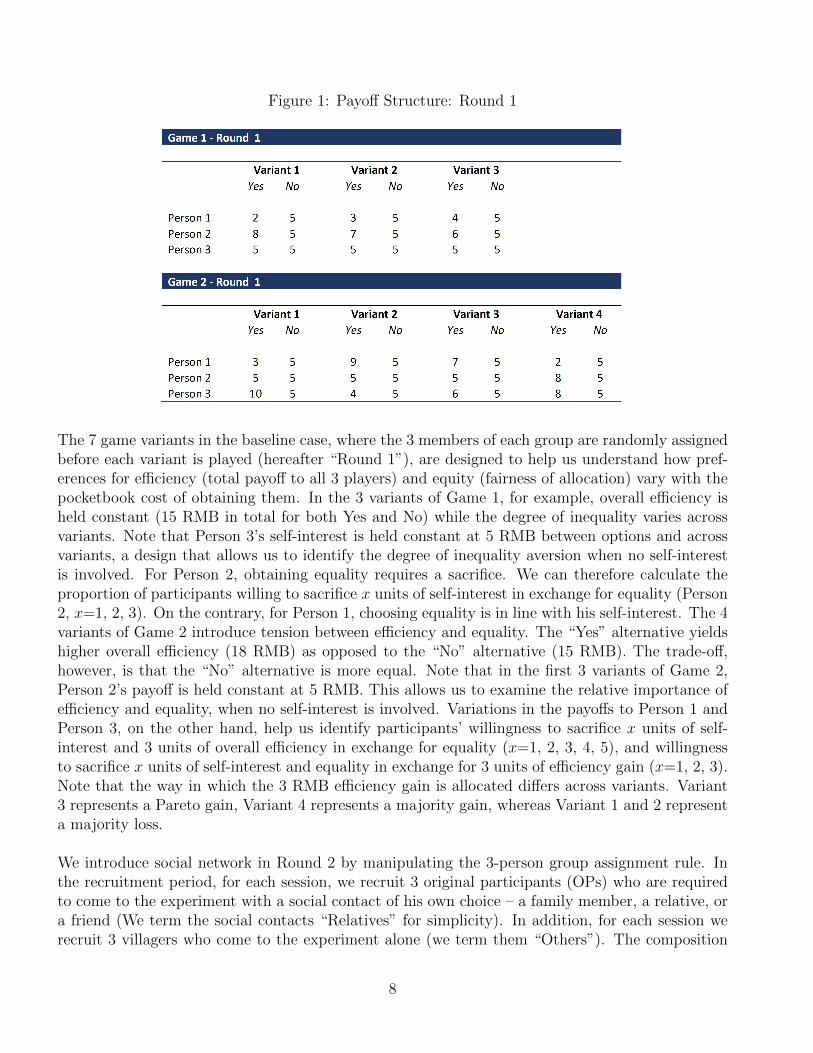
Figure 1: Payoff Structure: Round 1
The 7 game variants in the baseline case, where the 3 members of each group are randomly assignedbefore each variant is played (hereafter “Round 1”), are designed to help us understand how pref-erences for efficiency (total payoff to all 3 players) and equity (fairness of allocation) vary with thepocketbook cost of obtaining them. In the 3 variants of Game 1, for example, overall efficiency isheld constant (15 RMB in total for both Yes and No) while the degree of inequality varies acrossvariants. Note that Person 3’s self-interest is held constant at 5 RMB between options and acrossvariants, a design that allows us to identify the degree of inequality aversion when no self-interestis involved. For Person 2, obtaining equality requires a sacrifice. We can therefore calculate theproportion of participants willing to sacrifice x units of self-interest in exchange for equality (Person2, x=1, 2, 3). On the contrary, for Person 1, choosing equality is in line with his self-interest. The 4variants of Game 2 introduce tension between efficiency and equality. The “Yes” alternative yieldshigher overall efficiency (18 RMB) as opposed to the “No” alternative (15 RMB). The trade-off,however, is that the “No” alternative is more equal. Note that in the first 3 variants of Game 2,Person 2’s payoff is held constant at 5 RMB. This allows us to examine the relative importance ofefficiency and equality, when no self-interest is involved. Variations in the payoffs to Person 1 andPerson 3, on the other hand, help us identify participants’ willingness to sacrifice x units of self-interest and 3 units of overall efficiency in exchange for equality (x=1, 2, 3, 4, 5), and willingnessto sacrifice x units of self-interest and equality in exchange for 3 units of efficiency gain (x=1, 2, 3).Note that the way in which the 3 RMB efficiency gain is allocated differs across variants. Variant3 represents a Pareto gain, Variant 4 represents a majority gain, whereas Variant 1 and 2 representa majority loss.
We introduce social network in Round 2 by manipulating the 3-person group assignment rule. Inthe recruitment period, for each session, we recruit 3 original participants (OPs) who are requiredto come to the experiment with a social contact of his own choice – a family member, a relative, ora friend (We term the social contacts “Relatives” for simplicity). In addition, for each session werecruit 3 villagers who come to the experiment alone (we term them “Others”). The composition
8
of each session is therefore 3 OPs + 3 Relatives + 3 Others. In Round 2, instead of randomlysampling from the 9 participants in each session to form three 3-person groups as we did in Round1, we assign any OP and the Relative he brings to the same group, plus one “Other”. “Other”remains anonymous throughout the experiment to avoid the possibility that any unobserved personalhistories between the pair and the Other could affect their votes. In addition, a new “Other” isreassigned before each game, so that the pair cannot use the decision made by “Other” in theprevious game to get information on his preference pattern and adjust voting strategy accordingly.We name Round 1 “Random Assignment” and Round 2 “Network Assignment” in our discussionof the experimental results.
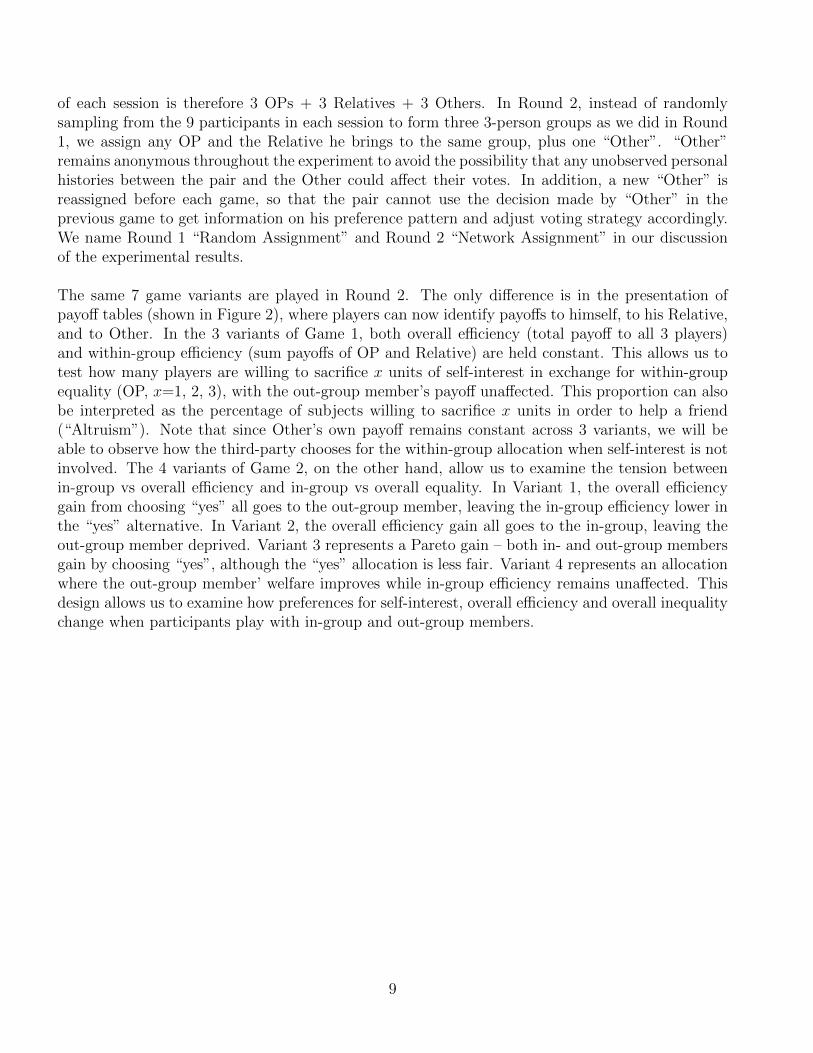
The same 7 game variants are played in Round 2. The only difference is in the presentation ofpayoff tables (shown in Figure 2), where players can now identify payoffs to himself, to his Relative,and to Other. In the 3 variants of Game 1, both overall efficiency (total payoff to all 3 players)and within-group efficiency (sum payoffs of OP and Relative) are held constant. This allows us totest how many players are willing to sacrifice x units of self-interest in exchange for within-groupequality (OP, x=1, 2, 3), with the out-group member’s payoff unaffected. This proportion can alsobe interpreted as the percentage of subjects willing to sacrifice x units in order to help a friend(“Altruism”). Note that since Other’s own payoff remains constant across 3 variants, we will beable to observe how the third-party chooses for the within-group allocation when self-interest is notinvolved. The 4 variants of Game 2, on the other hand, allow us to examine the tension betweenin-group vs overall efficiency and in-group vs overall equality. In Variant 1, the overall efficiencygain from choosing “yes” all goes to the out-group member, leaving the in-group efficiency lower inthe “yes” alternative. In Variant 2, the overall efficiency gain all goes to the in-group, leaving theout-group member deprived. Variant 3 represents a Pareto gain – both in- and out-group membersgain by choosing “yes”, although the “yes” allocation is less fair. Variant 4 represents an allocationwhere the out-group member’ welfare improves while in-group efficiency remains unaffected. Thisdesign allows us to examine how preferences for self-interest, overall efficiency and overall inequalitychange when participants play with in-group and out-group members.
9
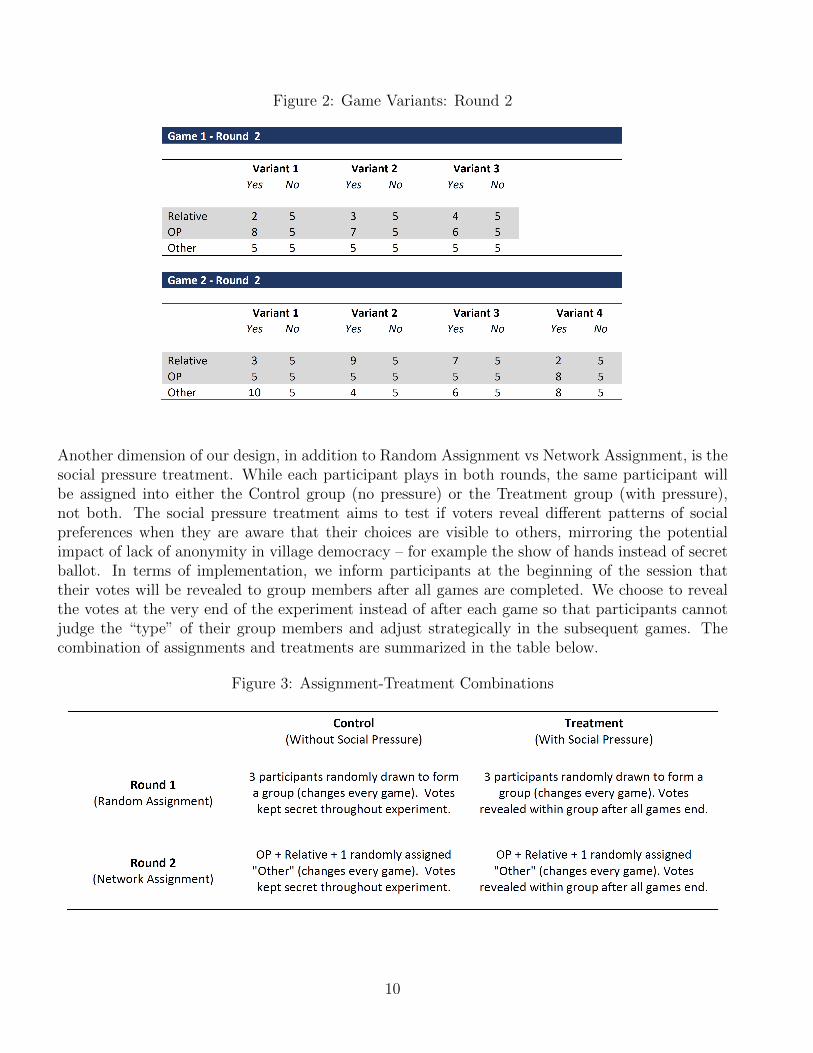
Figure 2: Game Variants: Round 2
Another dimension of our design, in addition to Random Assignment vs Network Assignment, is thesocial pressure treatment. While each participant plays in both rounds, the same participant willbe assigned into either the Control group (no pressure) or the Treatment group (with pressure),not both. The social pressure treatment aims to test if voters reveal different patterns of socialpreferences when they are aware that their choices are visible to others, mirroring the potentialimpact of lack of anonymity in village democracy – for example the show of hands instead of secretballot. In terms of implementation, we inform participants at the beginning of the session thattheir votes will be revealed to group members after all games are completed. We choose to revealthe votes at the very end of the experiment instead of after each game so that participants cannotjudge the “type” of their group members and adjust strategically in the subsequent games. Thecombination of assignments and treatments are summarized in the table below.
Figure 3: Assignment-Treatment Combinations
10
3.2 Experiment Procedure
The formal experiment was implemented in July 2017 in 4 randomly selected villages in Linyi,Shandong Province in China. Before the formal experiment, we performed a pilot experiment inJanuary 2017 in Shandong for test purposes only. Data from the pilot experiment is not usedin this paper. The experiment design and consent process was reviewed and approved by theInternal Review Board (IRB) at Cornell University. We obtained oral consent from all subjectsfor their participation in the experiment. All experiment materials, including payoff cards andquestionnaires, were presented in Chinese. Experiment instructions were read to participants inLinyi dialect to ensure understanding.
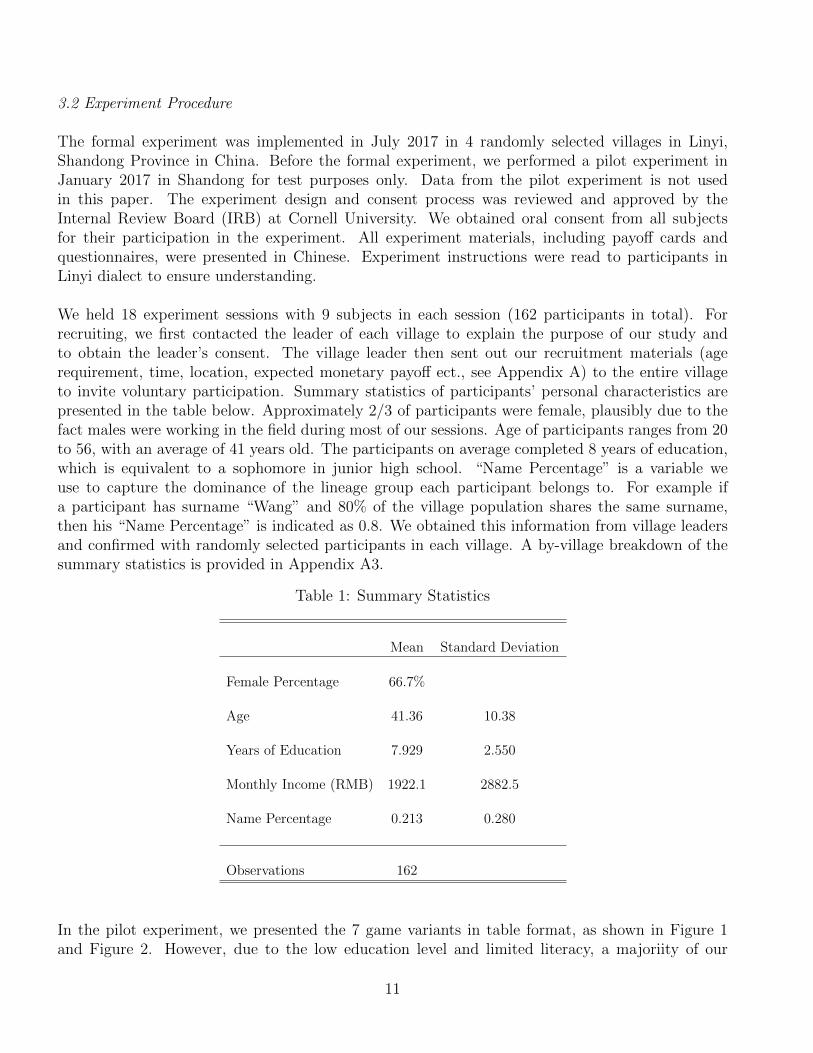
We held 18 experiment sessions with 9 subjects in each session (162 participants in total). Forrecruiting, we first contacted the leader of each village to explain the purpose of our study andto obtain the leader’s consent. The village leader then sent out our recruitment materials (agerequirement, time, location, expected monetary payoff ect., see Appendix A) to the entire villageto invite voluntary participation. Summary statistics of participants’ personal characteristics arepresented in the table below. Approximately 2/3 of participants were female, plausibly due to thefact males were working in the field during most of our sessions. Age of participants ranges from 20to 56, with an average of 41 years old. The participants on average completed 8 years of education,which is equivalent to a sophomore in junior high school. “Name Percentage” is a variable weuse to capture the dominance of the lineage group each participant belongs to. For example ifa participant has surname “Wang” and 80% of the village population shares the same surname,then his “Name Percentage” is indicated as 0.8. We obtained this information from village leadersand confirmed with randomly selected participants in each village. A by-village breakdown of thesummary statistics is provided in Appendix A3.
Table 1: Summary Statistics
Mean Standard Deviation
Female Percentage 66.7%
Age 41.36 10.38
Years of Education 7.929 2.550
Monthly Income (RMB) 1922.1 2882.5
Name Percentage 0.213 0.280
Observations 162
In the pilot experiment, we presented the 7 game variants in table format, as shown in Figure 1and Figure 2. However, due to the low education level and limited literacy, a majoriity of our
11
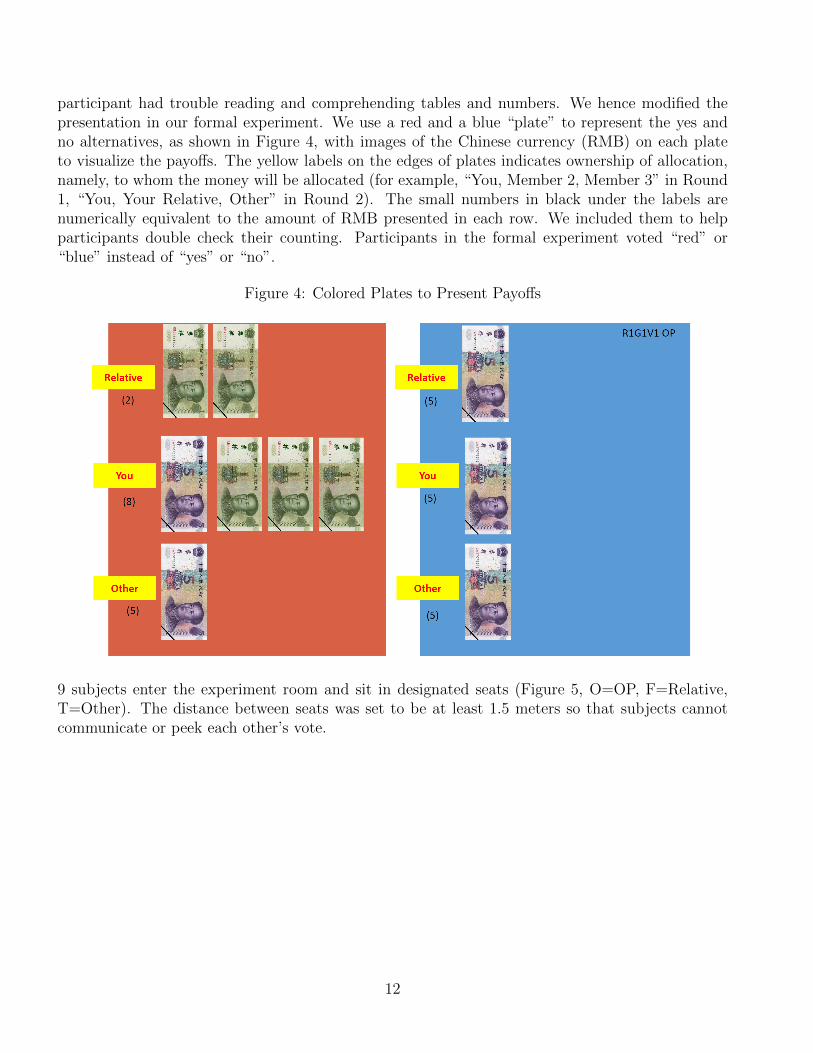
participant had trouble reading and comprehending tables and numbers. We hence modified thepresentation in our formal experiment. We use a red and a blue “plate” to represent the yes andno alternatives, as shown in Figure 4, with images of the Chinese currency (RMB) on each plateto visualize the payoffs. The yellow labels on the edges of plates indicates ownership of allocation,namely, to whom the money will be allocated (for example, “You, Member 2, Member 3” in Round1, “You, Your Relative, Other” in Round 2). The small numbers in black under the labels arenumerically equivalent to the amount of RMB presented in each row. We included them to helpparticipants double check their counting. Participants in the formal experiment voted “red” or“blue” instead of “yes” or “no”.
Figure 4: Colored Plates to Present Payoffs
9 subjects enter the experiment room and sit in designated seats (Figure 5, O=OP, F=Relative,T=Other). The distance between seats was set to be at least 1.5 meters so that subjects cannotcommunicate or peek each other’s vote.
12

Figure 5: Colored Plates to Present Payoffs
The same script of experimental instructions (in Appendix) was read out to participants in Linyidialect by the same experimenter at every session to ensure consistency. The experimental instruc-tion is essentially the same as described in the previous subsection. At the beginning of Round1, the main experimenter informs subjects that 3 members will be selected at random to form agroup (3 groups in total). Group members are shuffled and reassigned at the beginning of eachnew game and the identity of group members will not be revealed. She then proceeds to explainthe distribution schemes and the “majority rule”. In the Control sessions (Session 1, 2, 5, 6, 9, 10,13, 14, 17, 18), participants are informed that their votes will never be made public whereas in theTreatment sessions (Session 3, 4, 7, 8, 11, 12, 15, 16), participants are warned ahead of time thatafter all games are finished we will reveal everyone’s votes to group members. The experimentersthen distribute payoff “plates” and instruct participants how to read their own payoffs and otherparticipants’ payoffs. The majority rule is explained again and confirmation questions are asked toensure correct understanding. For example, “if you vote red and the other two members vote blue,what would Person 3’s payoff be for this game”. For each game, we give participants 1 minute toconsider before we go collect votes. Participants are instructed to point at the color of their choiceinstead of stating aloud so that votes remain unknown to other participants. Experimenter writesdown votes on a data sheet and uses majority rule to decide which allocation to implement. Corre-sponding payments are made immediately to participants to provide monetary incentives. Round 2proceeds the same way as Round 1, with the only exception that participants are informed that thepair (OP + Relative) will always be in the same group while the third member will be randomlyassigned before each game and will remain unidentifiable.
After all games are completed, participants are required to fill out a questionnaire about theirdemographic information. The pairs (OPs and Relatives) are asked to complete an additional setof questions on their relationships, frequency of interaction, etc. Each session, including the surveycompletion, takes between 45 minutes and 1 hour. The total payoff to each participant ranges from50 to 90 RMB with mean payoff targeted at 75 RMB, which is equivalent to an average participant’sdaily income. We believe this provides sufficient financial incentive to participants and ensures thatthey take their decisions seriously.
4. Results
13
4.1 Descriptive Results
In this sub-section, we provide a game-by-game description of participants’ social preferences pat-terns exhibited in the experiment. Due to limited space, we include tables (t-test results) inAppendix B2. Entries of the tables are percentage of players voting “No”. The more rigorouseconometric analysis results will be presented in sub-section 4.2.
In all the 3 variants of Game 1 where efficiency is held constant at 15RMB between “Yes” and“No”, the majority of participants (over 50% in all variants) chose the fair allocation regardless oftreatment. In addition, more than half of participants were willing to sacrifice self-interest (1 RMB,2 RMB and 3 RMB) to achieve a fair allocation. In terms of treatment effect, in Round 1 (RandomAssignment) social pressure does not alter behaviors in a statistically significant manner. In Round2 (Network Assignment), however, subjects are more willing to make sacrifices when they are undersocial pressure. In other words, subjects display more pro-social preferences when they are awarethat their choices will be revealed to people in their social networks. The motive of such behaviorchanges – if it is due to stronger preferences for overall equality or within-group equality – will betested in regression analyses.
The 4 variants of Game 2 allocate the 3 RMB overall efficiency gain differently. In Game 2 Variant1, the efficiency gain goes exclusively to the out-group member while the in-group members lose. Inthe “Round 1 (Random Assignment)- Control (No Pressure)” situation, the proportion of Person2 players (no self-interest involved) choosing efficiency and the proportion choosing fairness arealmost equal. This proportion changed significantly when Person 2 players are informed that theywill be paired with their partners (Round 2). Without social pressure, 27% more of them chose theoption that increases in-group total payoff, although it results in a larger loss in overall efficiency.
In Game 2 Variant 2, the efficiency gain is allocated to in-group members exclusively. With self-interest neutral across options, the majority of Person 2 players chose efficiency over fairness most ofthe time. This ratio is only reversed in the “Round 1 (Random Assignment)- Treatment (Pressure)”situation, where 25% more of Person 2 Players chose fairness over efficiency. Interestingly, 20% moreof the out-group members voted “No” when they are informed the other two are pairs, a sign thatthe out-group members dislike allocations where the paired players gain more.
The “Yes” option of Game 2 Variant 3 represents a Pareto gain. Most of our subjects realize this andplayed accordingly. The large majority of players (67%-87%) chose efficiency over equality, and thisstrong preference for Pareto efficiency gain is consistent across treatments and across roles. The onlyexception is that Person 1 players voted more for equality when they play with their partners underpressure. However even after this change, the proportion of Person 1 players choosing efficiencyover equality is still as high as 2/3.
Finally, Game 2 Variant 4 represents an efficiency gain that goes to the out-group member whilekeeping in-group efficiency constant. In this case, in-group members (Person 1 and Person 2) consis-tently preferred the fair allocation, unwilling to let the efficiency gain go to the out-group member.When Person 1 players are informed that Person 2 is their Relatives, they make significantly more
14
sacrifices to let Person 2 earn more.
In summary, when efficiency is held constant, subjects displayed strong distaste towards inequalityand are willing to sacrifice self-interest for equality even in the Random Assignment. Social pressure,when efficiency is constant, only works under Network Assignment. When there is an efficiency gain,however, behavioral change depends heavily on how the efficiency gain is allocated in-group vs. out-group. We also observe that when subjects play under Network Assignment, they become fixatedon within-group gains even when doing so leads to an overall efficiency loss, and such tendencybecomes more prominent when social pressure is present. A Pareto gain, on the other hand, isstrongly preferred regardless of assignment and treatment.
4.2 Regression Analysis
4.2.1 Social Preferences, Network Effects, and Pressure Effects
The rich variation in payoff structure of the 7 game variants allows us to identify parameters thatcharacterize preference for self-interest, efficiency, and inequality aversion, since these 3 componentshave been found to foster sharply different conduct (Rabin 1993, Fehr and Schmidt 1999, Bolton andOckenfels 2000, Charness and Rabin 2002, Engelmann and Strobel 2004, Fehr and Schmidt 2006).While “self-interest” and “efficiency” have been consistently defined in the existing literature aspayoff to oneself and the sum of payoffs to all members respectively, the definition of “equality” hasbeen under debate. We include three measures of inequality aversion – FS, ERC, and MaxiMin –in our regression analyses since they not only form the basis of theoretical work but also are themost widely employed ones in empirical tests (Engelmann and Strobel, 2004; Messer et al, 2010).
Attempting to explain cooperative behavior by a single simple model, Fehr and Schmidt (1999,henceforth FS) model fairness as self-centered inequality aversion; namely, people do not care aboutinequity per se that exists among others but are only interested in the fairness of their own materialpayoff relative to the payoff of others. Mathematically, the utility that person i generates from thegame outcome is written as:
Ui(π) = πi − αi1
n− 1
∑j 6=i
max{πj − πi, 0} − βi1
n− 1
∑j 6=i
max{πi − πj, 0}
αi ≥ βi, 0 ≤ βi < 1
where πi is the payoff to i himself, πj is the payoff to any other player j, and n is the total numberof players. In this framework the two max terms are mutually exclusive: αi measures the disutilityfrom other members being better off (Namely, when i is “Behind”), while βi measures the disutilityfrom other members being worse off (namely, when i is “Ahead”), αi ≥ βi therefore captures the ideathat a player suffers more from inequality that is to his disadvantage. They then tested the modelon a wide array of games such as ultimatum games, market games, and public goods games. Theresult is mixed in that in some games (ultimatum, public goods with punishment) more cooperativebehaviors are observed whereas in other games (market, public goods without punishment) subjectsbehave more selfishly. They therefore conclude that the distribution of social preferences dependsheavily on the strategic environment of the games.
15
Bolton and Ockenfels (2000, “Equity, Reciprocity, and Competition”, henceforth ERC) organizeda large set of laboratory games with a simple model constructed on the premise that people aremotivated by both their pecuniary payoff and their relative payoff standing. In particular, individuali’s utility function is specified as:
Ui = Ui(πi, σi)
c =∑j
πj
σi = σi(πi, c, n) =
{πi/c if c > 0
1/n if c = 0
Ui(cσi, σi) = αicσi −βin
(σi −1
n)2
αi ≥ 0, βi > 0
Namely, the utility is a function of payoff to i himself (πi) and the share he gets in the total payoff(σi). Utility is assumed to be strictly concave in the “share” argument, with a maximum around theallocation at which one’s own share is equal to the average share. This implies that the egalitariandivision is most preferred. In essence, the further the allocation moves from player i receivingan equal share, the higher the loss from the comparative effect. A player’s type is characterizedby αi/βi, the ratio of weights that are attributed to the pecuniary and relative components. Theauthors then fit data from various games (dictator, gift-exchange, Prisoner’s Dilemma, etc ) andfind that ERC equilibrium predicts people’s strategic behavior quite well.
Charness and Rabin (2002, henceforth MaxiMin) measures inequality by the payoff to the worst-offperson. They designed an array of new experimental games to determine whether subjects are moreconcerned with increasing social welfare – sacrificing to increase the payoffs for all recipients, espe-cially low-payoff recipients – than with reducing differences in payoffs. The multi-person MaxiMinmodel is specified as:
Ui(π1, π2, ..., πN) = (1− λ)πi + λ[δ ·min(π1, π2, ..., πN) + (1− δ)(π1 + π2 + ...+ πN)]
λ ∈ [0, 1]
That is, subjects like money but also prefer Pareto-improvements. By positing a concern for effi-ciency, this model helps explain why many subjects make inequality-increasing sacrifices – becausethese choices are Pareto-improving and inexpensive.
A number of empirical studies in the 2000s employ new game designs to compare performancesof the above social preference models. Engelmann and Strobel (2004), for example, presents aset of three-person one-shot distribution experiments to examine the importance of efficiency andinequality aversion in decision-making. They also compare the relative performance of the threemodels mentioned above. They find that the multi-person MaxiMin model can rationalize mostof the data while neither ERC or FS can explain important patterns. In response, Bolton and
16

Ockenfels (2006) challenged the Engelmann-Strobel design since the decision makers’ self-interestremained unaffected in most cases – namely no sacrifice was necessary. They then performedadditional experiments to show that willingness to pay for efficiency is substantially lower thanit is for equity. They also look more closely at the role of procedural equity by manipulatingthe role assignment rule in a majority voting game, and find that equal opportunity procedurescan soften the tension between equality and efficiency. Messer et al (2010) uses a Random PriceVoting Mechanism (RPVM) to elicit social preferences in a referenda experiment to find that thetwo equity based models – ERC and FS – are not supported by the data while MaxiMin performsrelatively well. They conclude that a social efficiency motive may lead to economically meaningfuldeviations from selfish voting choices and increase the likelihood that welfare-enhancing programsare implemented.
We use participants’ choices in each game and the associated payoff structures to estimate preferenceparameters in the above 3 models respectively. Specifically, we fit the ERC, FS, Maximin utilityfunctions using a binary logit regression as in Charness and Rabin (2002) and Engelmann andStrobel (2004). Assuming that all individuals choose “yes” or “no” to maximize their utilities, theprobability of individual i voting “yes” can be written as:
P (yesi) =eUi(yesi)
eUi(yesi) + eUi(noi)
Utility is assumed to be separately additive in three elements: self-interest, social efficiency, andinequality (using ERC, FS and MaxiMin one at a time). Note that when empirically applyingthe theoretical model specified in Fehr and Schmidt (1999), multi-colinearity is unavoidable sinceFS Ahead = FS Behind + Efficiency - 3× Self − Interest. To overcome this problem, wefollow Engelmann and Strobel (2004) by using two approaches. In a first approach, we exclude self-interest (we term it the “FS” model when presenting regression results). In a second approach, weemploy Engelmann and Strobel’s strict version by specifying FSstrict = FS Ahead + FS Behind.This new measure is essentially an aggregation of inequality where equal weights are assigned todisadvantageous and advantageous inequality (we term it the “FS Strict” model when presentingregression results).
Table 2: Utility Specification in Regressions
Utility Function of Person i
ERC αSELF,ERCi πi + βEFF,ERC
i
∑j πj + βERC
i |πi − 1N
∑Nj=1 πj|
FS βEFF,FSi
∑j πj + βFS,AHEAD
i1
N−1∑
j 6=iMax(πi − πj, 0) + βFS,BEHINDi
1N−1
∑j 6=iMax(πj − πi, 0)
FS Strict αSELF,FSsti πi + βEFF,FSst
i
∑j πj + βFSst
i1
N−1 [∑
j 6=iMax(πj − πi, 0) +∑
j 6=iMax(πi − πj, 0)]
Maximin αSELF,MMi πi + βEFF,MM
i
∑j πj + βMM
i1 ·Min(π1,..., πN)
The design of our experiment, especially the Assignment-Treatment Combinations as shown in
17

Figure 3, allows us to identify two effects. “Network effect” characterizes if participants displaydifferent degree of preferences for self-interest, efficiency, and equality when they are assigned tothe same group as their social contacts, with or without pressure. “Pressure effect”, on the otherhand, characterizes if participants display different degree of preferences for self-interest, efficiency,and equality when they are under social pressure, with or without social contacts in their groups.Mathematically, the utility function used to identify network effect, without social pressure (P = 0)and with social pressure (P = 1) is specified as:
Ui(P = 0) = αN0i,P=0πi+β
N0i,P=0
∑j
πj +γN0i,P=0di+α
N1i,P=0πi ·1N(i)+βN1
i,P=0
∑j
πj ·1N(i)+γN1i,P=0di ·1N(i)
Ui(P = 1) = αN0i,P=1πi+β
N0i,P=1
∑j
πj +γN0i,P=1di+α
N1i,P=1πi ·1N(i)+βN1
i,P=1
∑j
πj ·1N(i)+γN1i,P=1di ·1N(i)
where πi represents self-interest,∑
j πj represents the efficiency measure, di represents any inequalitymeasure (ERC, FS, FS Strict, or MaxiMin), and 1N(i) is an indicator function that takes value 1if the choice made by individual i is observed from the Network Assignment. We are interestedin testing which of the two network effects – network effect without social pressure (which weterm “Network Effect A”, identified as αN1
i,P=0, βN1i,P=0, and γN1
i,P=0) and network effect with socialpressure (which we term “Network Effect B”, identified as αN1
i,P=1, βN1i,P=1, and γN1
i,P=1) – is statisticallysignificant.
Similarly, the utility function used to estimate pressure effect, in the Random Assignment (N = 0)and Network Assignment (N = 1), is specified as:
Ui(N = 0) = αP0i,N=0πi+β
P0i,N=0
∑j
πj+γP0i,N=0di+α
P1i,N=0πi ·1P (i)+βP1
i,N=0
∑j
πj ·1P (i)+γP1i,N=0di ·1P (i)
Ui(N = 1) = αP0i,N=1πi+β
P0i,N=1
∑j
πj+γP0i,N=1di+α
P1i,N=1πi ·1P (i)+βP1
i,N=1
∑j
πj ·1P (i)+γP1i,N=1di ·1P (i)
where 1P (i) is an indicator function that takes value 1 if the choice made by individual i is observedfrom the Treatment Group (with social pressure). We are interested in testing which of the twopressure effects – pressure effect under Random Assignment (which we term “Pressure Effect A”,identified as αP1
i,N=0, βP1i,N=0, and γP1
i,N=0) and pressure effect under Network Assignment (which weterm “Pressure Effect B”, identified as αP1
i,N=1, βP1i,N=1, and γP1
i,N=1) – is statistically significant.
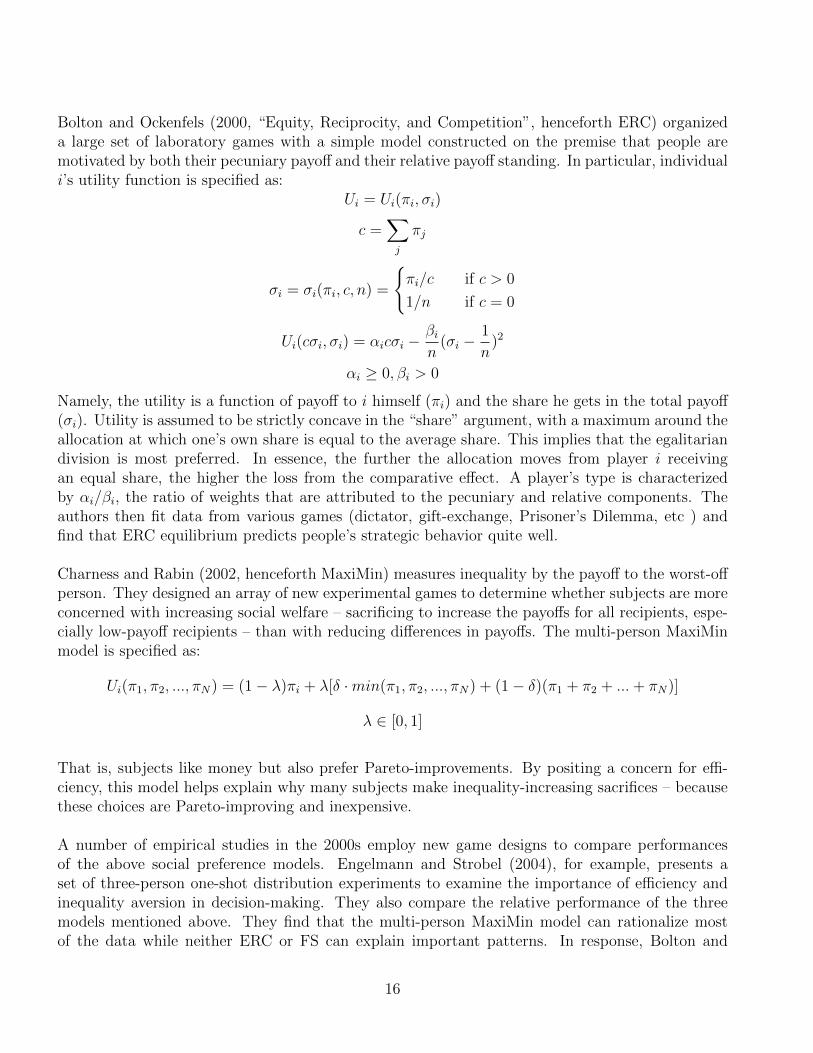
The above 4 effects are summarized in Table 3 and Table 4. Each 4 columns present a set of resultsusing the 4 inequality measures respectively – ERC, FS Strict, FS, and Maximin. Column (1) - (4)of Table 3 examines Network Effect without social pressure (Network Effect A); Column (5) - (8)of Table 3 examines Network Effect under social pressure (Network Effect B); Column (1) - (4) ofTable 4 examines Pressure Effect in random assignment (Pressure Effect A); Column (5) - (8) ofTable 4 examines Pressure Effect in network assignment (Pressure Effect B). The logic of our resultpresentation is summarized in Figure 6. We also performed a balance covariates check to make surethe demographics of participants in the control and treatment groups do not differ significantly.The result is presented in Appendix B1. Age is the only covariate that differs across control and
18
treatment, and the difference is rather weak (at p=0.1). We are therefore confident to say that thetreatment assignment is indeed random.
Figure 6: Regression Tables Illustration
The upper panel of the first 4 columns of Table 3 characterizes the baseline (no social pressure, nonetwork effects) social preference patterns displayed by our participants. Results are robust acrossthe 4 model specifications in the sense that all social preference parameters are statistically signifi-cant and are of the expected signs. Subjects strongly prefer (p<0.01) higher payoffs to themselves(self-interest) and higher total payoffs to the group (efficiency). In the mean time, players displaysignificant inequality aversion regardless of the measurement used. We also observe that the “FSBehind” parameter is (in absolute value) twice the size of the “FS Ahead” parameter, meaningthat subjects suffer more from inequality that is to their disadvantage. This is in line with thetheoretical prediction in Fehr and Schmidt (1999). The lower panel of the first 4 columns revealsthat when participants are not under social pressure, network effect is statistically insignificant. Inother words, when participants are informed that their votes will not be made public, playing withtheir relatives does not change their preference patterns.
The upper panel of columns (5)-(8) of Table 3 characterizes social preference patterns when partici-pants play in Random Assignment under social pressure. Very similar pattern is revealed here as inthe baseline case. The lower panel of columns (5)-(8), however, shows very strong Network Effect.That is, when participants are aware that their votes will be revealed to other players, assigningthem to play with their relatives will significantly alter their social preference patterns. The changeis particularly obvious in inequality aversion, in that players display much stronger distaste forunfair distributions and stronger willingness to help the worst-off person.
19
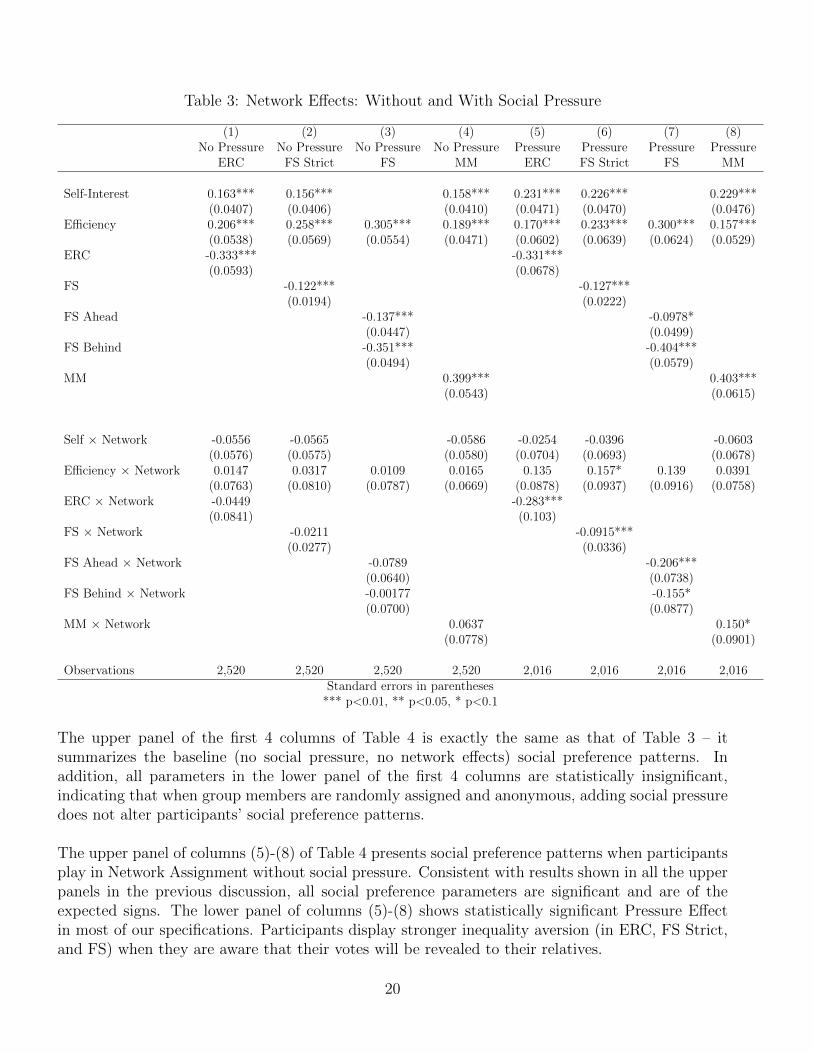
Table 3: Network Effects: Without and With Social Pressure
(1) (2) (3) (4) (5) (6) (7) (8)No Pressure No Pressure No Pressure No Pressure Pressure Pressure Pressure Pressure
ERC FS Strict FS MM ERC FS Strict FS MM
Self-Interest 0.163*** 0.156*** 0.158*** 0.231*** 0.226*** 0.229***(0.0407) (0.0406) (0.0410) (0.0471) (0.0470) (0.0476)
Efficiency 0.206*** 0.258*** 0.305*** 0.189*** 0.170*** 0.233*** 0.300*** 0.157***(0.0538) (0.0569) (0.0554) (0.0471) (0.0602) (0.0639) (0.0624) (0.0529)
ERC -0.333*** -0.331***(0.0593) (0.0678)
FS -0.122*** -0.127***(0.0194) (0.0222)
FS Ahead -0.137*** -0.0978*(0.0447) (0.0499)
FS Behind -0.351*** -0.404***(0.0494) (0.0579)
MM 0.399*** 0.403***(0.0543) (0.0615)
Self × Network -0.0556 -0.0565 -0.0586 -0.0254 -0.0396 -0.0603(0.0576) (0.0575) (0.0580) (0.0704) (0.0693) (0.0678)
Efficiency × Network 0.0147 0.0317 0.0109 0.0165 0.135 0.157* 0.139 0.0391(0.0763) (0.0810) (0.0787) (0.0669) (0.0878) (0.0937) (0.0916) (0.0758)
ERC × Network -0.0449 -0.283***(0.0841) (0.103)
FS × Network -0.0211 -0.0915***(0.0277) (0.0336)
FS Ahead × Network -0.0789 -0.206***(0.0640) (0.0738)
FS Behind × Network -0.00177 -0.155*(0.0700) (0.0877)
MM × Network 0.0637 0.150*(0.0778) (0.0901)
Observations 2,520 2,520 2,520 2,520 2,016 2,016 2,016 2,016Standard errors in parentheses
*** p<0.01, ** p<0.05, * p<0.1
The upper panel of the first 4 columns of Table 4 is exactly the same as that of Table 3 – itsummarizes the baseline (no social pressure, no network effects) social preference patterns. Inaddition, all parameters in the lower panel of the first 4 columns are statistically insignificant,indicating that when group members are randomly assigned and anonymous, adding social pressuredoes not alter participants’ social preference patterns.
The upper panel of columns (5)-(8) of Table 4 presents social preference patterns when participantsplay in Network Assignment without social pressure. Consistent with results shown in all the upperpanels in the previous discussion, all social preference parameters are significant and are of theexpected signs. The lower panel of columns (5)-(8) shows statistically significant Pressure Effectin most of our specifications. Participants display stronger inequality aversion (in ERC, FS Strict,and FS) when they are aware that their votes will be revealed to their relatives.
20
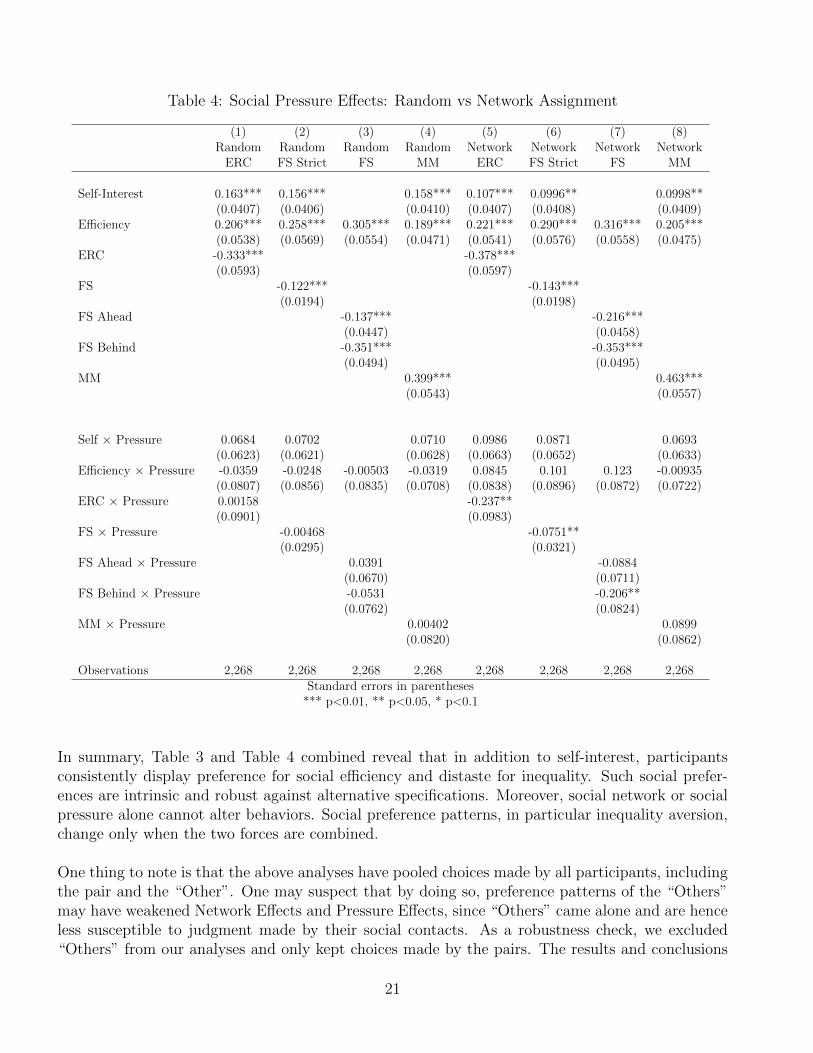
Table 4: Social Pressure Effects: Random vs Network Assignment
(1) (2) (3) (4) (5) (6) (7) (8)Random Random Random Random Network Network Network Network
ERC FS Strict FS MM ERC FS Strict FS MM
Self-Interest 0.163*** 0.156*** 0.158*** 0.107*** 0.0996** 0.0998**(0.0407) (0.0406) (0.0410) (0.0407) (0.0408) (0.0409)
Efficiency 0.206*** 0.258*** 0.305*** 0.189*** 0.221*** 0.290*** 0.316*** 0.205***(0.0538) (0.0569) (0.0554) (0.0471) (0.0541) (0.0576) (0.0558) (0.0475)
ERC -0.333*** -0.378***(0.0593) (0.0597)
FS -0.122*** -0.143***(0.0194) (0.0198)
FS Ahead -0.137*** -0.216***(0.0447) (0.0458)
FS Behind -0.351*** -0.353***(0.0494) (0.0495)
MM 0.399*** 0.463***(0.0543) (0.0557)
Self × Pressure 0.0684 0.0702 0.0710 0.0986 0.0871 0.0693(0.0623) (0.0621) (0.0628) (0.0663) (0.0652) (0.0633)
Efficiency × Pressure -0.0359 -0.0248 -0.00503 -0.0319 0.0845 0.101 0.123 -0.00935(0.0807) (0.0856) (0.0835) (0.0708) (0.0838) (0.0896) (0.0872) (0.0722)
ERC × Pressure 0.00158 -0.237**(0.0901) (0.0983)
FS × Pressure -0.00468 -0.0751**(0.0295) (0.0321)
FS Ahead × Pressure 0.0391 -0.0884(0.0670) (0.0711)
FS Behind × Pressure -0.0531 -0.206**(0.0762) (0.0824)
MM × Pressure 0.00402 0.0899(0.0820) (0.0862)
Observations 2,268 2,268 2,268 2,268 2,268 2,268 2,268 2,268Standard errors in parentheses
*** p<0.01, ** p<0.05, * p<0.1
In summary, Table 3 and Table 4 combined reveal that in addition to self-interest, participantsconsistently display preference for social efficiency and distaste for inequality. Such social prefer-ences are intrinsic and robust against alternative specifications. Moreover, social network or socialpressure alone cannot alter behaviors. Social preference patterns, in particular inequality aversion,change only when the two forces are combined.
One thing to note is that the above analyses have pooled choices made by all participants, includingthe pair and the “Other”. One may suspect that by doing so, preference patterns of the “Others”may have weakened Network Effects and Pressure Effects, since “Others” came alone and are henceless susceptible to judgment made by their social contacts. As a robustness check, we excluded“Others” from our analyses and only kept choices made by the pairs. The results and conclusions
21
are unchanged.
4.2.2 In-group vs Out-group Allocations
As introduced in Section 2, one key feature of the Chinese lineage networks is the clear division of“insiders-we” and “outsiders-they”. In this subsection, we examine how people in a network settingperceive resources allocated to in-group members (relatives) as opposed to out-group members(Others).
We introduce three new variables: In-group Efficiency, which measures the total payoff to the pair(πOP + πRelative); In-group Inequality, which measures the absolute difference in payoffs betweenthe pair (|πOP − πRelative|); and Distance, which measures how far the Other’s payoff is away fromthe average payoff of the pair(|πOther − 1
2(πOP + πRelative)|). We only use data from the Network
Assignment, because the division of in-group and out-group does not exist in Random Assignment.In addition, we separate observations of the pairs (in-group members) and the Others (out-groupmembers), because they may behave differently facing the division and social pressure. Specifically,utility function of the in-group members is specified as a separately additive function of 4 elements:self-interest, overall efficiency, in-group efficiency, and in-group inequality; utility function of theout-group members is specified as a separately additive function of 3 elements: self-interest, overallefficiency, and distance. The results are presented in Table 5.
The upper panel of Table 5 presents preferences for in-group measures in the network setting withoutsocial pressure. The pairs (in-group members) do not seem to be concerned with self-interest noroverall efficiency in this case. Since in-group efficiency is included in the regression, this can alsobe interpreted as their disregard of the payoffs to the out-group member. Instead, all that theycare about are in-group measures – in-group efficiency and in-group inequality. Such fixation onin-group measures is exacerbated by social pressure, as we observe from the lower panel of column(1). Imposing social pressure on the pair does not increase their concern for the group as a whole(or for the welfare of the out-group member). Instead it makes them more averse toward in-groupinequality.
Column (2) characterizes social preference patterns of the out-group member. Compared to thepairs, out-group members care more about overall efficiency. Since self-interest is included in theregression, this means that the out-group member actually prefer higher payoff to the pair. Theyalso dislike distance. Namely, the greater the difference between their own payoffs and the pairs’average payoff, the unhappier they feel. Moreover, social pressure does not significantly alter theirpreference patterns.
22

Table 5: In-group Measures (Pairs and Others)
(1) (2)VARIABLES Pairs Others
Self-Interest 0.0116 0.199*(0.0539) (0.108)
Overall Efficiency 0.0916 0.304***(0.0649) (0.118)
In-group Efficiency 0.320***(0.0676)
In-group Inequality -0.210***(0.0361)
Distance -0.327***(0.121)
Self-Interest × Pressure 0.0919 0.226(0.0878) (0.172)
Overall Efficiency × Pressure 0.157 -0.0602(0.101) (0.179)
In-group Efficiency × Pressure -0.0590(0.101)
In-group Inequality × Pressure -0.155**(0.0615)
Distance × Pressure -0.141(0.186)
Observations 1,512 756Standard errors in parentheses
*** p<0.01, ** p<0.05, * p<0.1
4.2.3. Social Preferences of Dominant lineages
A major feature of the lineage network in rural China is that the dominant lineages control theeconomic and political resources and influence village affairs heavily. In this section, we examinethe social preference pattern of members in dominant lineages as opposed to that of members innon-dominant lineages.
The dominance of the lineage that person i belongs to is measured by variable “Name”, which isdefined as the percentage of villagers that share the same surname as person i. Greater value of“Name” indicates larger lineage group, hence greater power in village affairs. The regressions weperform in this section include both main effects and “Name” interaction effects controlling for otherpersonal characteristics (gender, age, education, and income). Namely, utility function is specifiedas
Ui =∑k
βk ·Xik +∑k
θkXik ·Namei +∑lk
δlk ·XikZi
where Xik is the elements of social preference measures presented in each game (self-interest, effi-ciency, plus one set of inequality measure), and Zi is the vector of personal characteristics of person
23

i. To save space, in this section we only present the parameters of “Name” interaction effects,namely θk in different scenarios.
Columns (1) to (4) in Table 6 characterize “Name” interaction effects in Randomly Assignment.We observe that none of them is significant, indicating that when voting with randomly assignedunknown members, members of dominant lineages do not behave differently compared to membersof non-dominant lineages. When it comes to Network Assignment, however, columns (5) to (8)in Table 6 reveal different patterns. We notice that the interaction effect for ERC is positive,indicating that members of larger lineages care less about inequality. More importantly, they seemto feel better about inequality that is to their advantage.
Table 6: Social Preferences of Dominant lineages (All Observations)
(1) (2) (3) (4) (5) (6) (7) (8)Random Random Random Random Network Network Network Network
VARIABLES ERC FS Struct FS MM ERC FS Strict FS MM
Self-Interest × Name -0.158 -0.145 -0.143 0.178 0.205 0.222(0.143) (0.142) (0.143) (0.149) (0.148) (0.147)
Efficiency × Name 0.153 0.201 0.161 0.199 -0.289 -0.241 -0.171 -0.215(0.184) (0.196) (0.191) (0.162) (0.192) (0.206) (0.199) (0.168)
ERC × Name 0.227 0.402*(0.202) (0.215)
FS × Name 0.0392 0.0894(0.0667) (0.0713)
FS Ahead × Name -0.0226 0.313*(0.155) (0.164)
FS Behind × Name 0.173 0.0417(0.170) (0.181)
MM × Name -0.112 -0.272(0.186) (0.195)
Observations 2,184 2,184 2,184 2,184 2,184 2,184 2,184 2,184Standard errors in parentheses
*** p<0.01, ** p<0.05, * p<0.1
We further break down the “Name” interaction effects in Network Assignment to Pairs and Others.The results are presented in Table 7. We notice that almost all parameters in the first 4 columns(Pairs) are statistically significant, while none of them is significant in the last 4 columns (Others).In other words, members of dominant lineage groups behave differently only when the interestof their relatives are involved. They care more about self-interest and less about the welfare ofthe group as a whole (Efficiency). Members of dominant lineages are also less concerned aboutinequality. In fact, they do not feel as bad when the inequality is to their advantage (FS Ahead).This result is consistent with phenomena reported in the literature, where larger kinship groupsexploit their control of economic and political resources to suppress smaller groups.
24

Table 7: Social Preferences of Dominant lineages (Pairs and Others)
(1) (2) (3) (4) (5) (6) (7) (8)Pairs Pairs Pairs Pairs Others Others Others Others
VARIABLES ERC FS Strict FS MM ERC FS Strict FS MM
Self-Interest × Name 0.398** 0.449** 0.483*** -0.446 -0.170 -0.153(0.174) (0.176) (0.179) (0.462) (0.407) (0.363)
Efficiency × Name -0.371* -0.475* -0.311 -0.423** -0.0710 0.207 0.150 0.182(0.219) (0.246) (0.234) (0.201) (0.476) (0.445) (0.439) (0.373)
ERC × Name 0.538** 0.564(0.240) (0.745)
FS × Name 0.192** -0.0366(0.0850) (0.180)
FS Ahead × Name 0.670*** -0.187(0.213) (0.326)
FS Behind × Name 0.0746 0.0402(0.195) (0.548)
MM × Name -0.715*** 0.146(0.249) (0.390)
Observations 1,442 1,442 1,442 1,442 742 742 742 742Standard errors in parentheses
*** p<0.01, ** p<0.05, * p<0.1
4.2.4. Social Preferences and Personal Characteristics
Compared to the networks in western societies, the lineage ties in rural China are highly individual,in the sense that any interpersonal relationship are affected heavily by the individuals’ personalcharacteristics. In this subsection, we examine how gender, age, education and income interactwith social preference patterns.
The results are presented in Table 8. Overall we observe that personal characteristics interactioneffects (δlk) do not differ greatly across Random Assignment and Network Assignment. Female(Gender=1) consistently display greater inequality aversion compared to male, especially whenthe inequality is to their disadvantage. Interestingly, female displayed greater concern for overallefficiency and the welfare of the worst-off member under Random Assignment, but such concerndisappears when they are in Network Assignment. Although we do not have direct evidence toexplain this phenomenon, we reason that female are by nature more caring and compassionateespecially towards the deprived. However, when the interests of their relatives are involved, suchnature is suppressed and outweighed by in-group concerns. In the Age panel, we observe thatcompared to the young, senior participants are less concerned with self-interest and inequality inboth Random Assignment and Network Assignment. They seem to be less sensitive to every elementin the utility function and behaves in a more neutral manner.
The interaction effects in the Education and Income panels are apparently weaker. In NetworkAssignment, better educated participants display greater concern for overall efficiency and tendto feel worse when the inequality is to their advantage. Such pattern, however, is not present inRandom Assignment. The effect of income is almost non-existent.
25
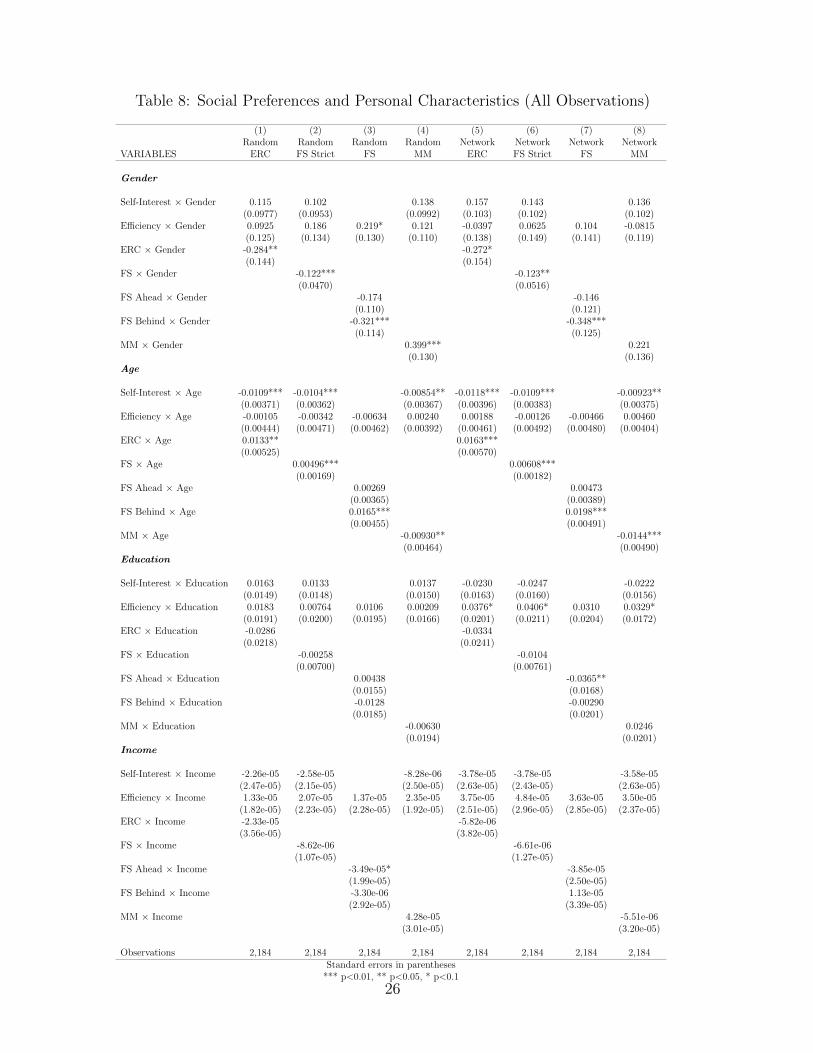
Table 8: Social Preferences and Personal Characteristics (All Observations)
(1) (2) (3) (4) (5) (6) (7) (8)Random Random Random Random Network Network Network Network
VARIABLES ERC FS Strict FS MM ERC FS Strict FS MM
Gender
Self-Interest × Gender 0.115 0.102 0.138 0.157 0.143 0.136(0.0977) (0.0953) (0.0992) (0.103) (0.102) (0.102)
Efficiency × Gender 0.0925 0.186 0.219* 0.121 -0.0397 0.0625 0.104 -0.0815(0.125) (0.134) (0.130) (0.110) (0.138) (0.149) (0.141) (0.119)
ERC × Gender -0.284** -0.272*(0.144) (0.154)
FS × Gender -0.122*** -0.123**(0.0470) (0.0516)
FS Ahead × Gender -0.174 -0.146(0.110) (0.121)
FS Behind × Gender -0.321*** -0.348***(0.114) (0.125)
MM × Gender 0.399*** 0.221(0.130) (0.136)
Age
Self-Interest × Age -0.0109*** -0.0104*** -0.00854** -0.0118*** -0.0109*** -0.00923**(0.00371) (0.00362) (0.00367) (0.00396) (0.00383) (0.00375)
Efficiency × Age -0.00105 -0.00342 -0.00634 0.00240 0.00188 -0.00126 -0.00466 0.00460(0.00444) (0.00471) (0.00462) (0.00392) (0.00461) (0.00492) (0.00480) (0.00404)
ERC × Age 0.0133** 0.0163***(0.00525) (0.00570)
FS × Age 0.00496*** 0.00608***(0.00169) (0.00182)
FS Ahead × Age 0.00269 0.00473(0.00365) (0.00389)
FS Behind × Age 0.0165*** 0.0198***(0.00455) (0.00491)
MM × Age -0.00930** -0.0144***(0.00464) (0.00490)
Education
Self-Interest × Education 0.0163 0.0133 0.0137 -0.0230 -0.0247 -0.0222(0.0149) (0.0148) (0.0150) (0.0163) (0.0160) (0.0156)
Efficiency × Education 0.0183 0.00764 0.0106 0.00209 0.0376* 0.0406* 0.0310 0.0329*(0.0191) (0.0200) (0.0195) (0.0166) (0.0201) (0.0211) (0.0204) (0.0172)
ERC × Education -0.0286 -0.0334(0.0218) (0.0241)
FS × Education -0.00258 -0.0104(0.00700) (0.00761)
FS Ahead × Education 0.00438 -0.0365**(0.0155) (0.0168)
FS Behind × Education -0.0128 -0.00290(0.0185) (0.0201)
MM × Education -0.00630 0.0246(0.0194) (0.0201)
Income
Self-Interest × Income -2.26e-05 -2.58e-05 -8.28e-06 -3.78e-05 -3.78e-05 -3.58e-05(2.47e-05) (2.15e-05) (2.50e-05) (2.63e-05) (2.43e-05) (2.63e-05)
Efficiency × Income 1.33e-05 2.07e-05 1.37e-05 2.35e-05 3.75e-05 4.84e-05 3.63e-05 3.50e-05(1.82e-05) (2.23e-05) (2.28e-05) (1.92e-05) (2.51e-05) (2.96e-05) (2.85e-05) (2.37e-05)
ERC × Income -2.33e-05 -5.82e-06(3.56e-05) (3.82e-05)
FS × Income -8.62e-06 -6.61e-06(1.07e-05) (1.27e-05)
FS Ahead × Income -3.49e-05* -3.85e-05(1.99e-05) (2.50e-05)
FS Behind × Income -3.30e-06 1.13e-05(2.92e-05) (3.39e-05)
MM × Income 4.28e-05 -5.51e-06(3.01e-05) (3.20e-05)
Observations 2,184 2,184 2,184 2,184 2,184 2,184 2,184 2,184Standard errors in parentheses
*** p<0.01, ** p<0.05, * p<0.1
26
Table 9 breaks down personal characteristics interaction effects in the Network Assignment intoPairs and Others. We observe that female participants in the pairs behave more selfishly comparedto female participants playing the role of Others – they care more about self-interest and feel worsewhen the inequality is to their disadvantage. Education affects the pairs’ preferences but not theOthers. In particular, better educated pairs are less selfish, more averse to inequality, especiallywhen inequality is to their advantage, and care more about the welfare of the worst-off person. Ageand Income interaction effects, on the other hand, are not different across pairs and Others in anobservable way.
27
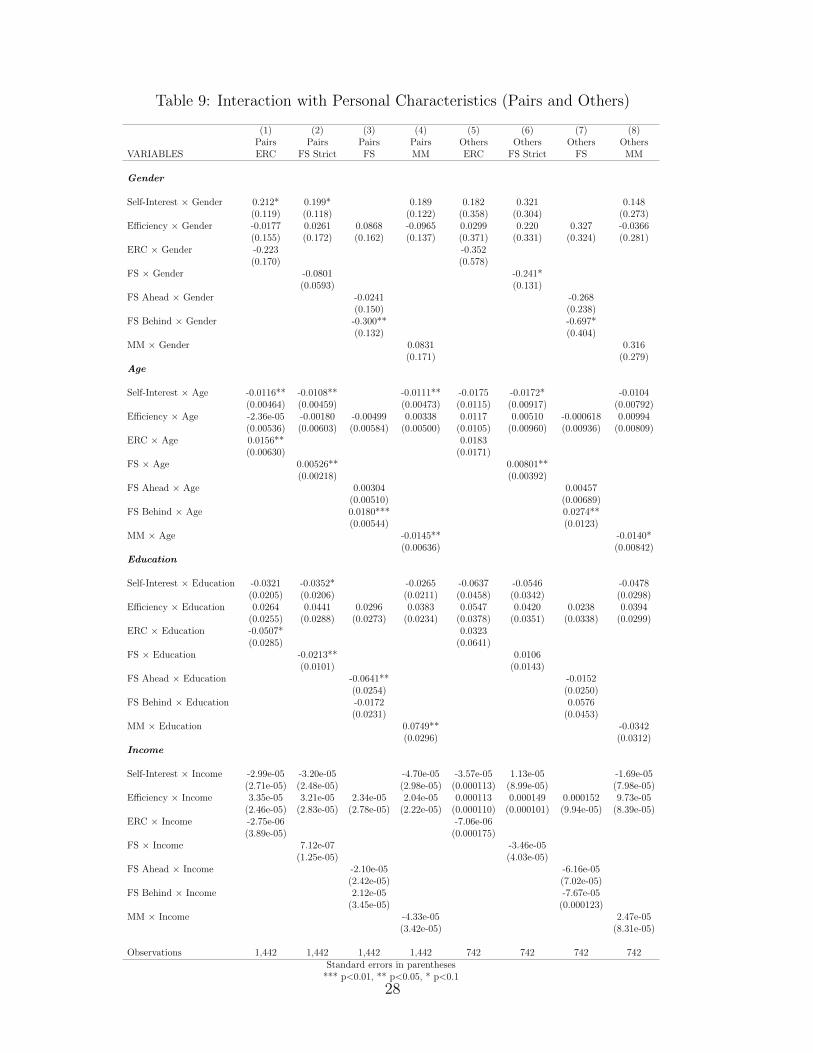
Table 9: Interaction with Personal Characteristics (Pairs and Others)
(1) (2) (3) (4) (5) (6) (7) (8)Pairs Pairs Pairs Pairs Others Others Others Others
VARIABLES ERC FS Strict FS MM ERC FS Strict FS MM
Gender
Self-Interest × Gender 0.212* 0.199* 0.189 0.182 0.321 0.148(0.119) (0.118) (0.122) (0.358) (0.304) (0.273)
Efficiency × Gender -0.0177 0.0261 0.0868 -0.0965 0.0299 0.220 0.327 -0.0366(0.155) (0.172) (0.162) (0.137) (0.371) (0.331) (0.324) (0.281)
ERC × Gender -0.223 -0.352(0.170) (0.578)
FS × Gender -0.0801 -0.241*(0.0593) (0.131)
FS Ahead × Gender -0.0241 -0.268(0.150) (0.238)
FS Behind × Gender -0.300** -0.697*(0.132) (0.404)
MM × Gender 0.0831 0.316(0.171) (0.279)
Age
Self-Interest × Age -0.0116** -0.0108** -0.0111** -0.0175 -0.0172* -0.0104(0.00464) (0.00459) (0.00473) (0.0115) (0.00917) (0.00792)
Efficiency × Age -2.36e-05 -0.00180 -0.00499 0.00338 0.0117 0.00510 -0.000618 0.00994(0.00536) (0.00603) (0.00584) (0.00500) (0.0105) (0.00960) (0.00936) (0.00809)
ERC × Age 0.0156** 0.0183(0.00630) (0.0171)
FS × Age 0.00526** 0.00801**(0.00218) (0.00392)
FS Ahead × Age 0.00304 0.00457(0.00510) (0.00689)
FS Behind × Age 0.0180*** 0.0274**(0.00544) (0.0123)
MM × Age -0.0145** -0.0140*(0.00636) (0.00842)
Education
Self-Interest × Education -0.0321 -0.0352* -0.0265 -0.0637 -0.0546 -0.0478(0.0205) (0.0206) (0.0211) (0.0458) (0.0342) (0.0298)
Efficiency × Education 0.0264 0.0441 0.0296 0.0383 0.0547 0.0420 0.0238 0.0394(0.0255) (0.0288) (0.0273) (0.0234) (0.0378) (0.0351) (0.0338) (0.0299)
ERC × Education -0.0507* 0.0323(0.0285) (0.0641)
FS × Education -0.0213** 0.0106(0.0101) (0.0143)
FS Ahead × Education -0.0641** -0.0152(0.0254) (0.0250)
FS Behind × Education -0.0172 0.0576(0.0231) (0.0453)
MM × Education 0.0749** -0.0342(0.0296) (0.0312)
Income
Self-Interest × Income -2.99e-05 -3.20e-05 -4.70e-05 -3.57e-05 1.13e-05 -1.69e-05(2.71e-05) (2.48e-05) (2.98e-05) (0.000113) (8.99e-05) (7.98e-05)
Efficiency × Income 3.35e-05 3.21e-05 2.34e-05 2.04e-05 0.000113 0.000149 0.000152 9.73e-05(2.46e-05) (2.83e-05) (2.78e-05) (2.22e-05) (0.000110) (0.000101) (9.94e-05) (8.39e-05)
ERC × Income -2.75e-06 -7.06e-06(3.89e-05) (0.000175)
FS × Income 7.12e-07 -3.46e-05(1.25e-05) (4.03e-05)
FS Ahead × Income -2.10e-05 -6.16e-05(2.42e-05) (7.02e-05)
FS Behind × Income 2.12e-05 -7.67e-05(3.45e-05) (0.000123)
MM × Income -4.33e-05 2.47e-05(3.42e-05) (8.31e-05)
Observations 1,442 1,442 1,442 1,442 742 742 742 742Standard errors in parentheses
*** p<0.01, ** p<0.05, * p<0.1
28

4.2.5. Social Preferences and Network Characteristics
The last set of results (Table 10) looks at how social preferences vary with network characteristics,namely how close the pairs are in terms of their relationship within the lineage network. Weconstruct a “Relation” variable – a Coefficient of Human Relationships – to numerically expressthis degree of kinship in human genealogy.
The Coefficient of Human Relationships is defined over a scale of 0 to 1, where greater value indicatescloser relationship. In the patriarchal lineage system in rural China, married couples form the basicunits of the society, the coefficient for spouses is set to be 1. An offspring carries half the genes ofeach parent, so the coefficient for parent-offspring relationship is 0.5. Calculation of the coefficientsfor other relationships is provided in the Appendix.
Since the concept of network or relationship does not exist in Random Assignment, our analysisfocuses on behaviors in Network Assignment. Moreover, since the relationship variable can onlybe calculated for the pairs, we exclude Others from our sample. We focus on in-group measures ofsocial preferences in this subsection, because those are likely to be what in-group members are mostconcerned with and are more naturally affected by relationship. As a robustness check, we repeatedthe analysis using overall measures of preferences and included the results in the Appendix. Theyreveal almost identical pattern.
The upper panel of Table 10 presents relationship interaction effects. We observe that when votingwith closer relatives, in-group members care less about self interest. We also notice that closersocial relationship makes in-group members care more about both overall efficiency and in-groupefficiency. In addition, in-group members playing with closer Relatives are more averse to in-groupinequalities that are to their advantages. Namely, their sense of guilt increases with social proximity.The lower panel of Table 10 presents the triple interaction effects with relationship and with socialpressure. The only statistically significant triple interaction effect is the one with in-group efficiency,meaning that pressure effect is more prominent on preference for in-group efficiency when the pairis closer. Since both overall efficiency and in-group efficiency are included in the regression, thisalso indicates that social pressure makes the more intimate pairs more fixated on their within-groupgains even at the cost of the out-group member.
29
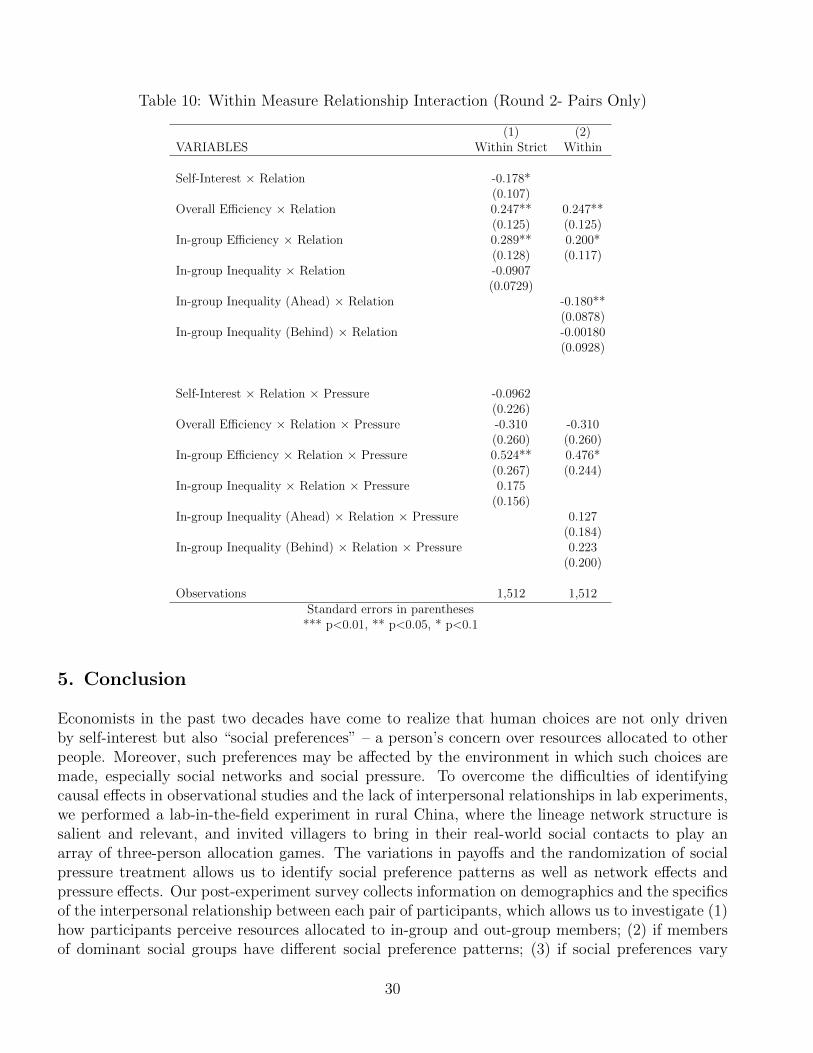
Table 10: Within Measure Relationship Interaction (Round 2- Pairs Only)
(1) (2)VARIABLES Within Strict Within
Self-Interest × Relation -0.178*(0.107)
Overall Efficiency × Relation 0.247** 0.247**(0.125) (0.125)
In-group Efficiency × Relation 0.289** 0.200*(0.128) (0.117)
In-group Inequality × Relation -0.0907(0.0729)
In-group Inequality (Ahead) × Relation -0.180**(0.0878)
In-group Inequality (Behind) × Relation -0.00180(0.0928)
Self-Interest × Relation × Pressure -0.0962(0.226)
Overall Efficiency × Relation × Pressure -0.310 -0.310(0.260) (0.260)
In-group Efficiency × Relation × Pressure 0.524** 0.476*(0.267) (0.244)
In-group Inequality × Relation × Pressure 0.175(0.156)
In-group Inequality (Ahead) × Relation × Pressure 0.127(0.184)
In-group Inequality (Behind) × Relation × Pressure 0.223(0.200)
Observations 1,512 1,512Standard errors in parentheses
*** p<0.01, ** p<0.05, * p<0.1
5. Conclusion
Economists in the past two decades have come to realize that human choices are not only drivenby self-interest but also “social preferences” – a person’s concern over resources allocated to otherpeople. Moreover, such preferences may be affected by the environment in which such choices aremade, especially social networks and social pressure. To overcome the difficulties of identifyingcausal effects in observational studies and the lack of interpersonal relationships in lab experiments,we performed a lab-in-the-field experiment in rural China, where the lineage network structure issalient and relevant, and invited villagers to bring in their real-world social contacts to play anarray of three-person allocation games. The variations in payoffs and the randomization of socialpressure treatment allows us to identify social preference patterns as well as network effects andpressure effects. Our post-experiment survey collects information on demographics and the specificsof the interpersonal relationship between each pair of participants, which allows us to investigate (1)how participants perceive resources allocated to in-group and out-group members; (2) if membersof dominant social groups have different social preference patterns; (3) if social preferences vary
30

with personal characteristics such as gender and age; (4) if variations in social preferences can beexplained by social proximity.
Consistent with evidence shown in prior literature, we find that (a) in addition to self-interest, par-ticipants consistently display preference for social efficiency and distaste for inequality. Such socialpreferences are intrinsic and robust against alternative specifications. Moreover, social network orsocial pressure alone cannot alter behaviors. Social preference patterns, in particular inequalityaversion, change only when the two forces are combined; (b) In-group members tend to be fixatedon in-group gains and disregard the welfare of out-group members, and such fixation is often exacer-bated by social pressure; (c) When playing with people in their networks, members of larger lineagegroups, especially those in the position of pairs, tend to be less concerned with overall efficiencyand inequality. They also seem not to feel as bad when the inequality is to their advantage; (d) So-cial preference patterns also vary with personal characteristics, such as gender, age, and education;(e) Closer social relationship makes in-group members care more about efficiency and inequality.Moreover, social pressure makes the more intimate pairs more fixated on within-group gains evenat the cost of the out-group member.
This study is to our knowledge the first lab-in-the-field experiment that embeds both real-worldsocial network and social pressure into allocation games. Our results not only provide empiricalevidence for the social preference theories but also offer policy insights for the developing world. Thedemocratization progress of many developing countries in Asia and Africa has been complicated bysocial network structures, especially when the in-group out-group division is salient. In this case,recognizing the possibility that in-group preferences may outweigh out-group preferences and yieldeconomically inefficient outcomes is essential. Since social pressure and social network tend to have acombined effect that reinforces each other, policy makers must be careful in choosing an appropriatevoting method. Secret ballot instead of show of hands, for example, may help alleviate in-groupmembers’ fixation on in-group gains when they are under social pressure, and may help improve thewelfare of the out-group members. In addition, since members of the dominant lineages consistentlydisplayed less pro-social tendencies during the experiment, constraining the power they can wield inthe decision-making process is important in enhancing the performance of rural democracy projects.Last but not least, since better educated participants are more pro-social during our experiment –they care more about overall efficiency and the welfare of the worst-off member and are more averseto inequalities that are to their advantages – having them more involved in village decision makingcould be beneficial.
31
References:
[1] Akerlof, G. A. (1997). Social distance and social decisions. Econometrica: Journal of theEconometric Society, 1005-1027.
[2] Alesina, A., Baqir, R., & Easterly, W. (1997). Public goods and ethnic divisions (No. w6009).National Bureau of Economic Research.
[3] Andreoni, J. (1988). Privately provided public goods in a large economy: the limits of altruism.Journal of Public Economics, 35(1), 57-73.
[4] Andreoni, J. (1989). Giving with impure altruism: applications to charity and Ricardian equiv-alence. The Journal of Political Economy, 1447-1458.
[5] Bandiera, O., Barankay, I., & Rasul, I. (2005). Social preferences and the response to incentives:Evidence from personnel data. The Quarterly Journal of Economics, 120(3), 917-962.
[6] Banerjee, A., Iyer, L., & Somanathan, R. (2005). History, social divisions, and public goods inrural India. Journal of the European Economic Association, 3(2-3), 639-647.
[7] Baker, H. D. (1979). Chinese family and kinship. New York: Columbia University Press
[8] Bernhard, H., Fehr, E., & Fischbacher, U. (2006). Group affiliation and altruistic norm enforce-ment. American Economic Review, 96(2), 217-221.
[9] Bolton, G. E., & Ockenfels, A. (2000). ERC: A theory of equity, reciprocity, and competition.American economic review, 166-193.
[10] Bolton, G. E., & Ockenfels, A. (2006). Inequality aversion, efficiency, and maximin preferencesin simple distribution experiments: comment. American Economic Review, 96(5), 1906-1911.
[11] Bursztyn, L., Ederer, F., Ferman, B., & Yuchtman, N. (2014). Understanding mechanismsunderlying peer effects: Evidence from a field experiment on financial decisions. Econometrica,82(4), 1273-1301.
[12] Charness, G., & Rabin, M. (2002). Understanding social preferences with simple tests. Quar-terly journal of Economics, 817-869.
[13] Chen, Y., & Li, S. X. (2009). Group identity and social preferences. American EconomicReview, 99(1), 431-57.
[14] Coate, S., & Ravallion, M. (1993). Reciprocity without commitment: Characterization andperformance of informal insurance arrangements. Journal of development Economics, 40(1), 1-24.
32
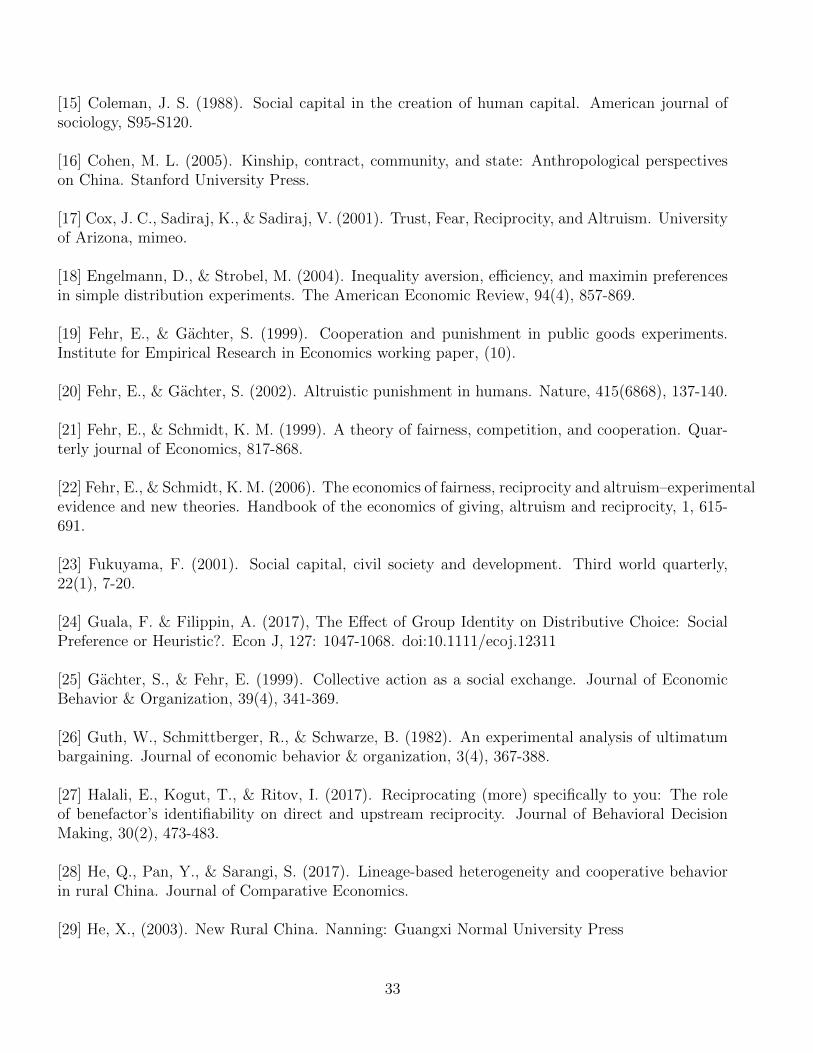
[15] Coleman, J. S. (1988). Social capital in the creation of human capital. American journal ofsociology, S95-S120.
[16] Cohen, M. L. (2005). Kinship, contract, community, and state: Anthropological perspectiveson China. Stanford University Press.
[17] Cox, J. C., Sadiraj, K., & Sadiraj, V. (2001). Trust, Fear, Reciprocity, and Altruism. Universityof Arizona, mimeo.
[18] Engelmann, D., & Strobel, M. (2004). Inequality aversion, efficiency, and maximin preferencesin simple distribution experiments. The American Economic Review, 94(4), 857-869.
[19] Fehr, E., & Gachter, S. (1999). Cooperation and punishment in public goods experiments.Institute for Empirical Research in Economics working paper, (10).
[20] Fehr, E., & Gachter, S. (2002). Altruistic punishment in humans. Nature, 415(6868), 137-140.
[21] Fehr, E., & Schmidt, K. M. (1999). A theory of fairness, competition, and cooperation. Quar-terly journal of Economics, 817-868.
[22] Fehr, E., & Schmidt, K. M. (2006). The economics of fairness, reciprocity and altruism–experimentalevidence and new theories. Handbook of the economics of giving, altruism and reciprocity, 1, 615-691.
[23] Fukuyama, F. (2001). Social capital, civil society and development. Third world quarterly,22(1), 7-20.
[24] Guala, F. & Filippin, A. (2017), The Effect of Group Identity on Distributive Choice: SocialPreference or Heuristic?. Econ J, 127: 1047-1068. doi:10.1111/ecoj.12311
[25] Gachter, S., & Fehr, E. (1999). Collective action as a social exchange. Journal of EconomicBehavior & Organization, 39(4), 341-369.
[26] Guth, W., Schmittberger, R., & Schwarze, B. (1982). An experimental analysis of ultimatumbargaining. Journal of economic behavior & organization, 3(4), 367-388.
[27] Halali, E., Kogut, T., & Ritov, I. (2017). Reciprocating (more) specifically to you: The roleof benefactor’s identifiability on direct and upstream reciprocity. Journal of Behavioral DecisionMaking, 30(2), 473-483.
[28] He, Q., Pan, Y., & Sarangi, S. (2017). Lineage-based heterogeneity and cooperative behaviorin rural China. Journal of Comparative Economics.
[29] He, X., (2003). New Rural China. Nanning: Guangxi Normal University Press
33
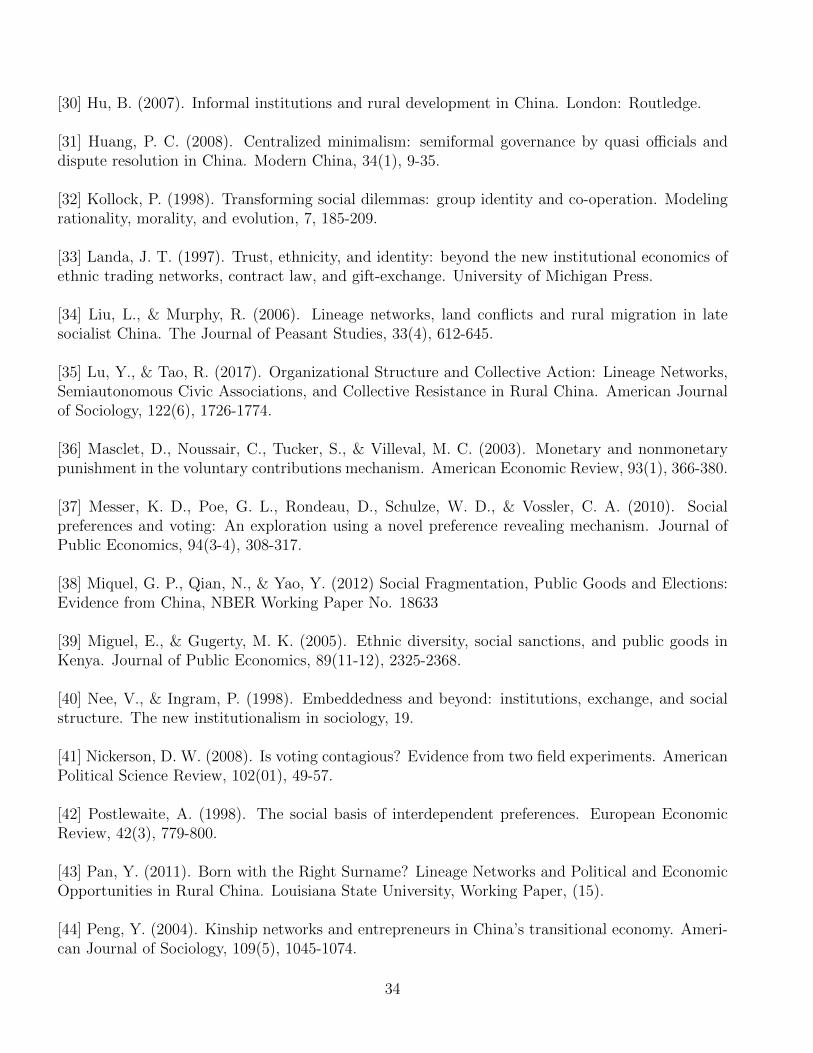
[30] Hu, B. (2007). Informal institutions and rural development in China. London: Routledge.
[31] Huang, P. C. (2008). Centralized minimalism: semiformal governance by quasi officials anddispute resolution in China. Modern China, 34(1), 9-35.
[32] Kollock, P. (1998). Transforming social dilemmas: group identity and co-operation. Modelingrationality, morality, and evolution, 7, 185-209.
[33] Landa, J. T. (1997). Trust, ethnicity, and identity: beyond the new institutional economics ofethnic trading networks, contract law, and gift-exchange. University of Michigan Press.
[34] Liu, L., & Murphy, R. (2006). Lineage networks, land conflicts and rural migration in latesocialist China. The Journal of Peasant Studies, 33(4), 612-645.
[35] Lu, Y., & Tao, R. (2017). Organizational Structure and Collective Action: Lineage Networks,Semiautonomous Civic Associations, and Collective Resistance in Rural China. American Journalof Sociology, 122(6), 1726-1774.
[36] Masclet, D., Noussair, C., Tucker, S., & Villeval, M. C. (2003). Monetary and nonmonetarypunishment in the voluntary contributions mechanism. American Economic Review, 93(1), 366-380.
[37] Messer, K. D., Poe, G. L., Rondeau, D., Schulze, W. D., & Vossler, C. A. (2010). Socialpreferences and voting: An exploration using a novel preference revealing mechanism. Journal ofPublic Economics, 94(3-4), 308-317.
[38] Miquel, G. P., Qian, N., & Yao, Y. (2012) Social Fragmentation, Public Goods and Elections:Evidence from China, NBER Working Paper No. 18633
[39] Miguel, E., & Gugerty, M. K. (2005). Ethnic diversity, social sanctions, and public goods inKenya. Journal of Public Economics, 89(11-12), 2325-2368.
[40] Nee, V., & Ingram, P. (1998). Embeddedness and beyond: institutions, exchange, and socialstructure. The new institutionalism in sociology, 19.
[41] Nickerson, D. W. (2008). Is voting contagious? Evidence from two field experiments. AmericanPolitical Science Review, 102(01), 49-57.
[42] Postlewaite, A. (1998). The social basis of interdependent preferences. European EconomicReview, 42(3), 779-800.
[43] Pan, Y. (2011). Born with the Right Surname? Lineage Networks and Political and EconomicOpportunities in Rural China. Louisiana State University, Working Paper, (15).
[44] Peng, Y. (2004). Kinship networks and entrepreneurs in China’s transitional economy. Ameri-can Journal of Sociology, 109(5), 1045-1074.
34
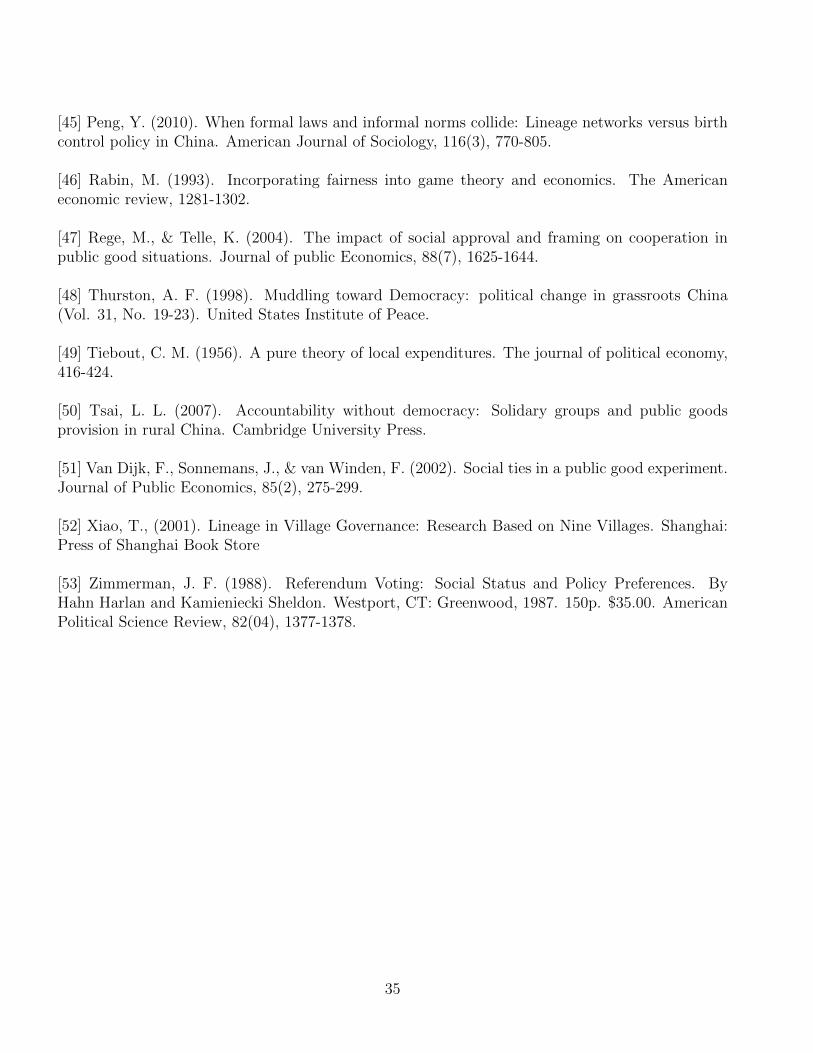
[45] Peng, Y. (2010). When formal laws and informal norms collide: Lineage networks versus birthcontrol policy in China. American Journal of Sociology, 116(3), 770-805.
[46] Rabin, M. (1993). Incorporating fairness into game theory and economics. The Americaneconomic review, 1281-1302.
[47] Rege, M., & Telle, K. (2004). The impact of social approval and framing on cooperation inpublic good situations. Journal of public Economics, 88(7), 1625-1644.
[48] Thurston, A. F. (1998). Muddling toward Democracy: political change in grassroots China(Vol. 31, No. 19-23). United States Institute of Peace.
[49] Tiebout, C. M. (1956). A pure theory of local expenditures. The journal of political economy,416-424.
[50] Tsai, L. L. (2007). Accountability without democracy: Solidary groups and public goodsprovision in rural China. Cambridge University Press.
[51] Van Dijk, F., Sonnemans, J., & van Winden, F. (2002). Social ties in a public good experiment.Journal of Public Economics, 85(2), 275-299.
[52] Xiao, T., (2001). Lineage in Village Governance: Research Based on Nine Villages. Shanghai:Press of Shanghai Book Store
[53] Zimmerman, J. F. (1988). Referendum Voting: Social Status and Policy Preferences. ByHahn Harlan and Kamieniecki Sheldon. Westport, CT: Greenwood, 1987. 150p. $35.00. AmericanPolitical Science Review, 82(04), 1377-1378.
35

Appendix A: Experiment Materials
A1. Recruitment Material
36

A2. Experiment Instruction
37

38

A3. Summary Statistics By Village
Table 11: Summary Statistics by Village
Village 1 Village 2 Village 3 Village 4
Gender 0.70 0.83 0.56 0.59Age 39.11 42.67 47.44 41.41Education 8.08 7.72 7.56 8.00Income 1939.33 816.67 1431.48 3055.56Name Percentage 0.20 0.14 0.30 0.25
N 90 18 27 27
39

Appendix B: Supplementary Analysis
B1. Balance Check
Table 12: Covariate Balance (Control vs Treatment)
(1) (2) (3)Control Treatment Difference
Mean SD Mean SD Difference t-StatisticsGender 0.64 0.48 0.71 0.46 -0.06 (-0.86)Age 42.92 10.46 39.22 9.75 3.70∗ (2.31)Education 7.84 2.43 8.06 2.72 -0.22 (-0.53)Income 1929.78 1924.64 1898.61 3728.06 31.16 (0.07)Name Percentage 0.20 0.27 0.23 0.29 -0.03 (-0.64)N 90 72 162
B2. Game-by-Game Comparison
Figure 7: Game 1 Variant 1
40
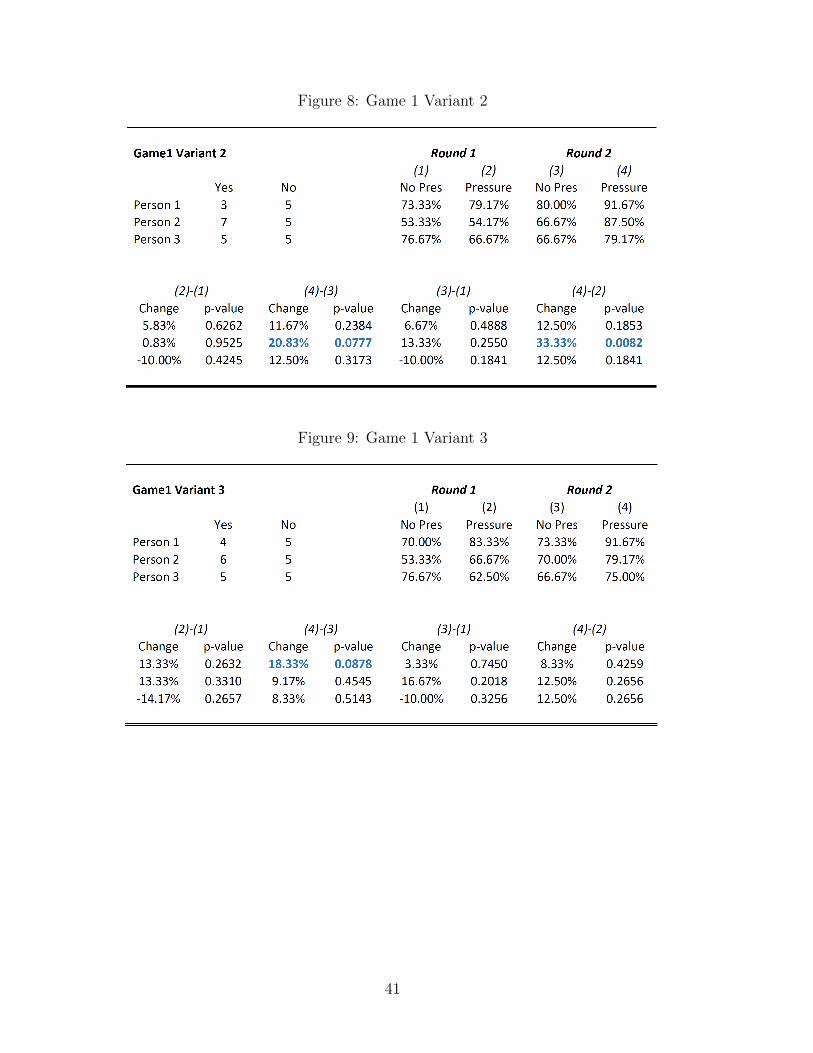
Figure 8: Game 1 Variant 2
Figure 9: Game 1 Variant 3
41

Figure 10: Game 2 Variant 1
Figure 11: Game 2 Variant 2
42
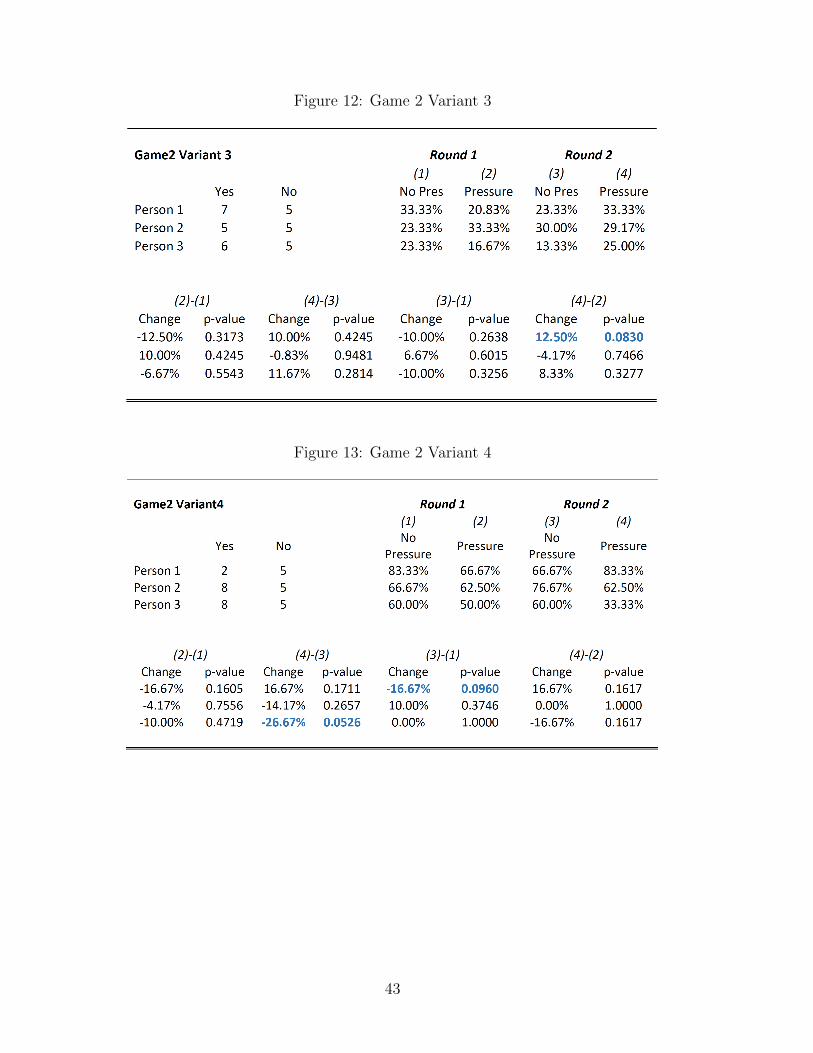
Figure 12: Game 2 Variant 3
Figure 13: Game 2 Variant 4
43

B3. Coefficient of Human Relationship
44