Kinship Coefficients - Genome Analysis Wiki Coefficients • Summarize genetic similarity between...
29
Kinship Coefficients Biostatistics 666
-
Upload
phungquynh -
Category
Documents
-
view
226 -
download
1
Transcript of Kinship Coefficients - Genome Analysis Wiki Coefficients • Summarize genetic similarity between...

Kinship CoefficientsBiostatistics 666

Today’s Lecture
• Genetic analyses require relationships to be specified
• Misspecified relationships lead to tests of inappropriate size• Inflated Type I error• Decreased power
• Kinship Coefficients
• Using data to verify genetic relationships


Kinship Coefficients
• Summarize genetic similarity between pairs of individuals.
• Can be used to study relationship between genetic similarity and phenotypic similarity across individuals.

Kinship Coefficients – Definition
• Given two individuals• One with genes (gi, gj)• The other with genes (gk, gl)
• The kinship coefficient is:• ¼P(gi≡gk) + ¼P(gi≡gl) + ¼P(gj≡gk) + ¼P(gj≡gl)• where “≡” represents identity by descent (IBD)
• Probability that alleles sampled at random from each individual are IBD

Some kinship coefficients
Unrelated (ϕ=0)Parent-Offspring
(ϕ=1/4)
Half-Sibs (ϕ=1/8)Siblings (ϕ=1/4) MZ Twins (ϕ=1/2)

What about other relatives?
• For any two related individuals i and j …
• … use a recursive algorithm allows calculation of kinship coefficient
• Algorithm requires an order for individuals in the pedigree where ancestors precede descendants
• That is where for any i>j, i is not ancestor of j• Such an order always exists (e.g. the birth order!)

Computing Kinship Coefficients
• The recursive definition is then (for i ≥ j):
=+
≠+
==
ji
ji
iji
ji
ifatherimother
jifatherjimother
ij
)1(
)(
foundera is ,
founders are and 0
)()(21
)()(21
21
ϕ
ϕϕϕ

An example pedigree…
• Can you find …
• Suitable ordering for recursive calculation?
• Calculate kinship coefficient between shaded individuals?
Inbreeding Coefficients
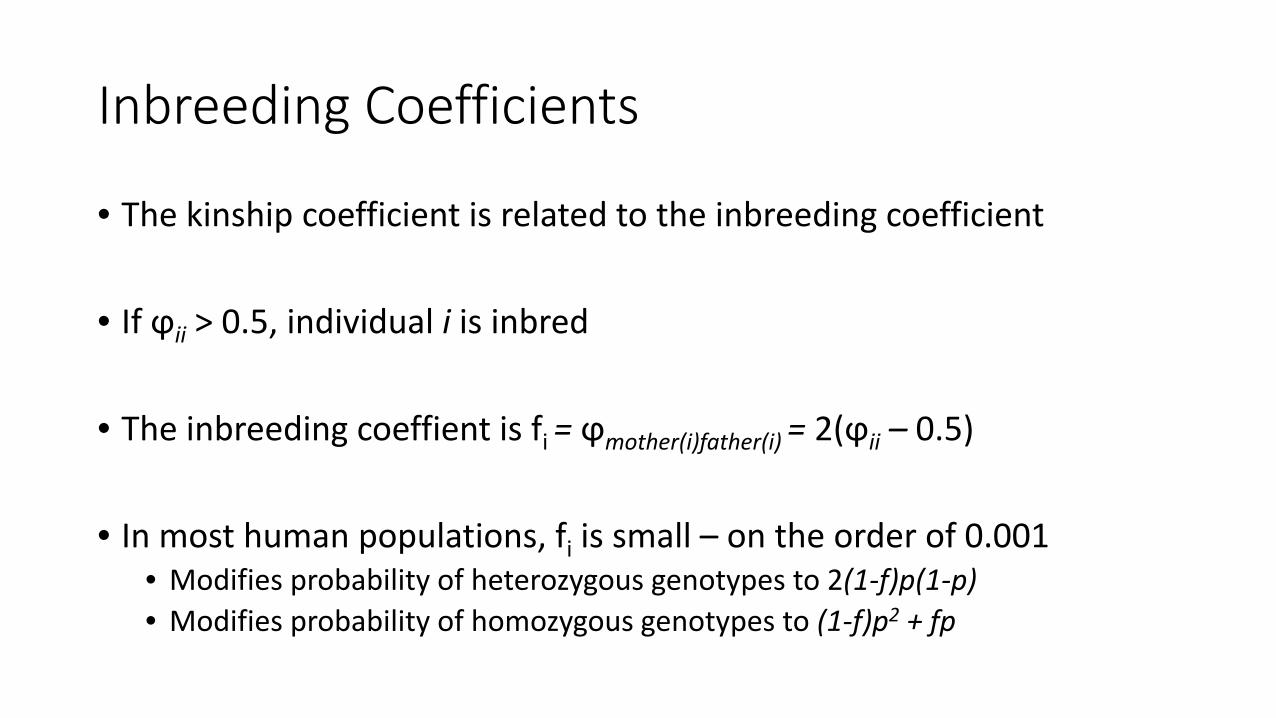
• The kinship coefficient is related to the inbreeding coefficient
• If ϕii > 0.5, individual i is inbred
• The inbreeding coeffient is fi = ϕmother(i)father(i) = 2(ϕii – 0.5)
• In most human populations, fi is small – on the order of 0.001• Modifies probability of heterozygous genotypes to 2(1-f)p(1-p)• Modifies probability of homozygous genotypes to (1-f)p2 + fp

Verifying Relationships:Strategy I - Allele Sharing Methods
• For each pair, summarize allele sharing across all markers• Specifically, average number of identical alleles at each marker pair• Number of alleles shared between two genotypes is the “identify-by-state”
• Compare observed values for each pair to expected values • Expected values derived by assessing all pairs with same putative relationship

IBS Sharing Scores
• Sk – IBS score (0,1,2) for marker k
=∑
markers
kk
n
SS 1
)( 2
2
−
−=∑
markers
kk
n
SSs

Could construct a Z-score
• Comparing observed IBS score to expected values within class of relatives
)|()|(
RSVarRSESZ −
=

Example…
• ~800 marker genome scan
• Calculated IBS for each set of putative relationships…• Unrelated pairs• Sibling pairs• Parent-offspring pairs

Putative Unrelated Pairs
Mean = 0.87 St. Dev. = 0.07

Parent-Offspring Pairs
Mean = 1.27St. Dev. = 0.05

Putative Sibling Pairs
Mean = 1.32St. Dev. = 0.09

Problem Individuals Are Outliers
Circled pairs are likely
misclassified

Problems with IBS Scores
• Inefficient• Ignores information on allele frequencies• Ignores correlations between neighboring markers
• … work well if large amounts of data available• Cannot distinguish some types of relatives

Verifying Relationships:Strategy I - Likelihood Based Methods
• When evaluating sharing, take allele frequency into account• Place greater importance in sharing of rare alleles• Recognize that sharing of common alleles can occur by chance
• Choice of parameters to maximize and constraints on underlying probabilities

P (Xm | IBD)
IBD Sib CoSib 0 1 2 (a,b) (c,d) 4papbpcpd 0 0 (a,a) (b,c) 2pa2pbpc 0 0 (a,a) (b,b) pa2pb2 0 0 (a,b) (a,c) 4pa2pbpc papbpc 0 (a,a) (a,b) 2pa3pb pa2pb 0 (a,b) (a,b) 4pa2pb2 (papb2+pa2pb) 2papb
(a,a) (a,a) pa4 pa3 pa2

Example I
• Consider genotypes for one marker• Let G = (1/1, 1/1)• Assume p1 = .5
• Calculate P(G|R) for each relationship• MZ twin, Full Sibs, Half-Sibs, Unrelated
• How do results change with p1?

Likelihood
• Likelihood above assumes markers are independent• With smaller amounts of data, important to model recombination
• With large amounts of data, this works well
• Maximize probability of IBD=0, IBD=1, IBD=2• Or, often, just P(IBD=1) = 2Φij and P(IBD=0) = 1 - 2 Φij
𝐿𝐿 = �𝑚𝑚=1
𝑀𝑀
�𝑘𝑘=0
2
𝑃𝑃 𝐺𝐺𝑖𝑖𝑚𝑚,𝐺𝐺𝑗𝑗𝑚𝑚 𝐼𝐼𝐼𝐼𝐼𝐼 = 𝑘𝑘 𝑃𝑃(𝐼𝐼𝐼𝐼𝐼𝐼 = 𝑘𝑘|𝑟𝑟𝑟𝑟𝑟𝑟𝑟𝑟𝑟𝑟𝑟𝑟𝑟𝑟𝑟𝑟𝑟𝑟𝑟𝑟𝑟𝑟𝑟)

Simulations (M=50, 10 cM apart)
True R Full Sibs Half Sibs UnrelatedFull Sibs .914 .085 .001Half Sibs .044 .872 .081Unrelated <.001 .059 .941
Inferred R

Simulations (M=400, 10 cM apart)
True R Full Sibs Half Sibs UnrelatedFull Sibs 1.000 <.001 <.001Half Sibs <.001 1.000 <.001Unrelated <.001 <.001 1.000
Inferred R

Weaknesses with likelihood approach…
• One weakness is that the approach is sensitive to genotyping error
• Consider some genome scan data• 380 microsatellite markers
• Observed Sharing• Identical for 379/380 genotype pairs
• L(G|R=MZ Twins) = 0• L(G|R=Any other) > 0
• How to resolve?

Solution:Allow for Genotyping Errors• If likelihood ignores errors, even a few errors can lead to misclassification
• Need to update likelihood to allow errors
• Introduce a distinction between true genotypes G and observed genotypes X• An error rate parameter, say ε, models the difference between the two
[ ] )()()²1(1)|()²1(
)|(),|()|(
21 iiii
Giiii
ii
GPGPIGP
IGPGXPIXP
i
εε
ε
−−+−=
= ∑

Weaknesses with likelihood approach…
• Another weakness is that the approach is sensitive to allele frequency estimates
• How can we make sure that we have chosen the right allele frequencies?
• Manichaikul et al (2010) proposed focusing on marker pairs that have configuration (a/a, b/b) or (a/b, a/b)
• The ratio of these two configurations does not depend on allele frequencies!• However, it will depend on the ratio of P(IBD=1) to P(IBD=0)

Recommended Reading
• Boehnke and Cox (1997) Am J Hum Genet 61:423-429
• Optional• Broman and Weber (1998), AJHG 63:1563-4 • McPeek and Sun (2000), AJHG 66:1076-94 • Epstein et al. (2000), AJHG 67:1219-31