Kinnevik Rocket Internet IR Deck - May 2014
11
Kinnevik Rocket Capital Markets Day Berlin, 22 May 2014 Introduction Cristina Stenbeck, Executive Chairman Lorenzo Grabau, CEO
-
Upload
sygroup -
Category
Investor Relations
-
view
27 -
download
4
Transcript of Kinnevik Rocket Internet IR Deck - May 2014
Kinnevik Rocket Capital Markets Day
Berlin, 22 May 2014
Introduction
Cristina Stenbeck, Executive Chairman
Lorenzo Grabau, CEO
2
Kinnevik today – focus on growth sectors and markets
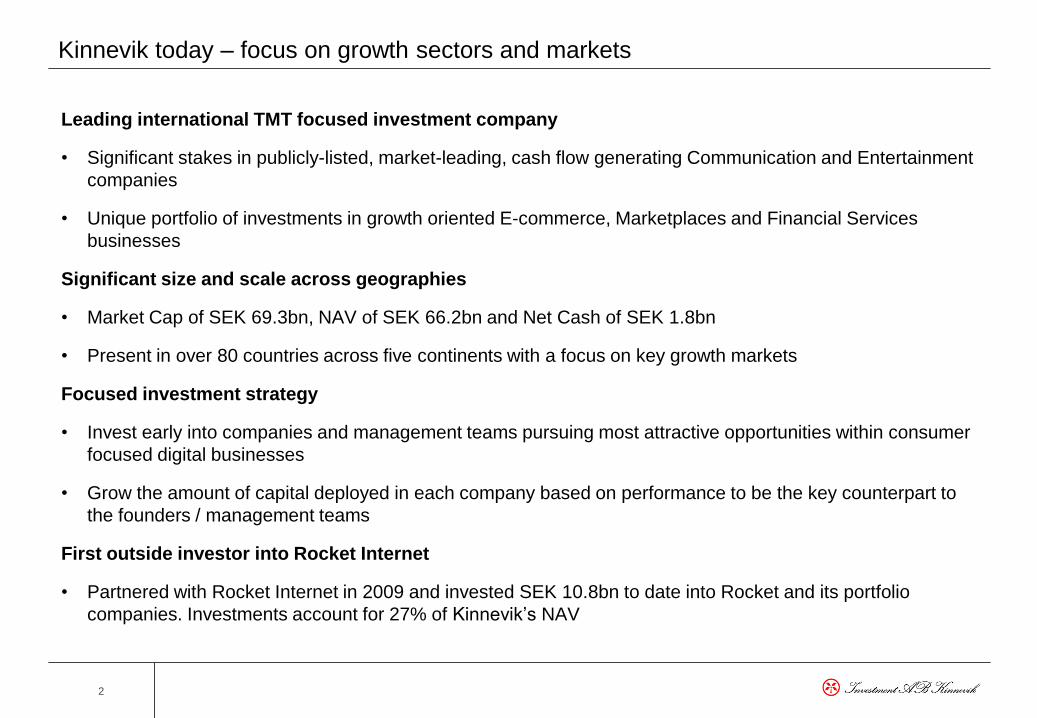
Leading international TMT focused investment company
• Significant stakes in publicly-listed, market-leading, cash flow generating Communication and Entertainment
companies
• Unique portfolio of investments in growth oriented E-commerce, Marketplaces and Financial Services
businesses
Significant size and scale across geographies
• Market Cap of SEK 69.3bn, NAV of SEK 66.2bn and Net Cash of SEK 1.8bn
• Present in over 80 countries across five continents with a focus on key growth markets
Focused investment strategy
• Invest early into companies and management teams pursuing most attractive opportunities within consumer
focused digital businesses
• Grow the amount of capital deployed in each company based on performance to be the key counterpart to
the founders / management teams
First outside investor into Rocket Internet
• Partnered with Rocket Internet in 2009 and invested SEK 10.8bn to date into Rocket and its portfolio
companies. Investments account for 27% of Kinnevik’s NAV
3
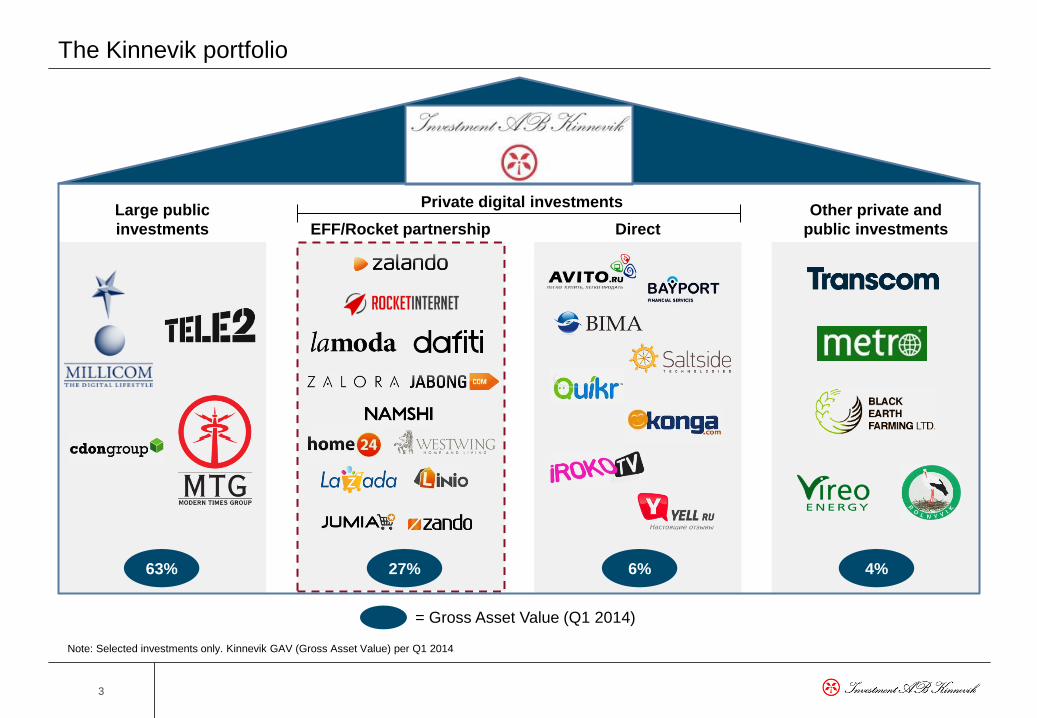
The Kinnevik portfolio
Large public
investments
Note: Selected investments only. Kinnevik GAV (Gross Asset Value) per Q1 2014
EFF/Rocket partnership Direct
Other private and
public investments
63% 27%
= Gross Asset Value (Q1 2014)
Private digital investments
6% 4%
4
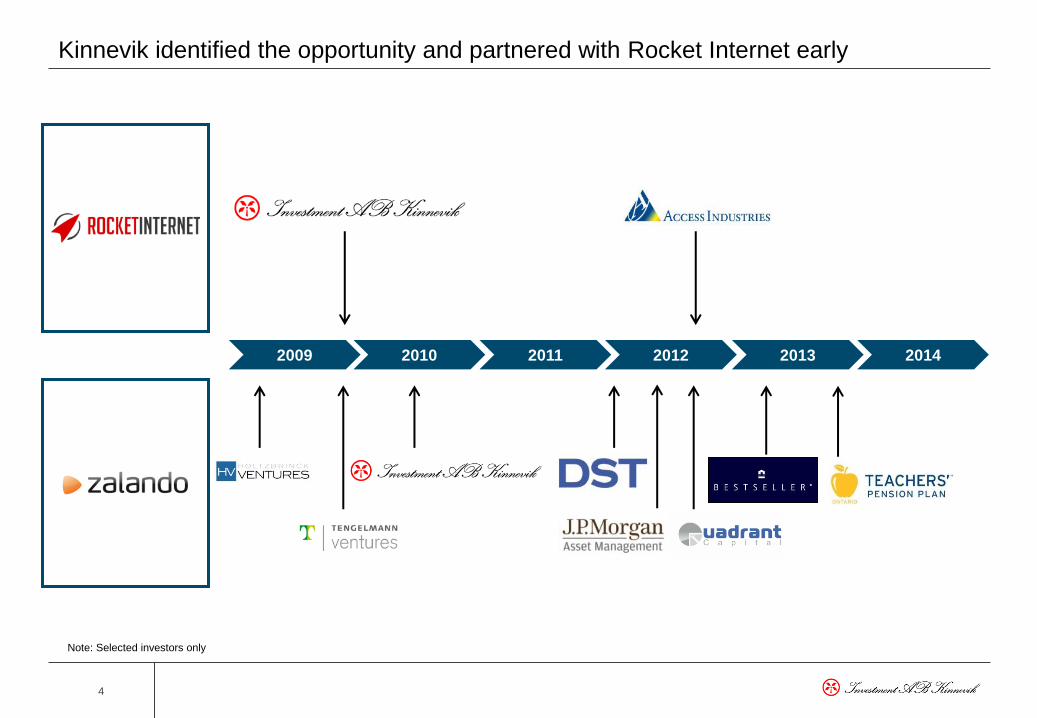
Kinnevik identified the opportunity and partnered with Rocket Internet early
Note: Selected investors only
2009 2010 2011 2012 2013 2014
5
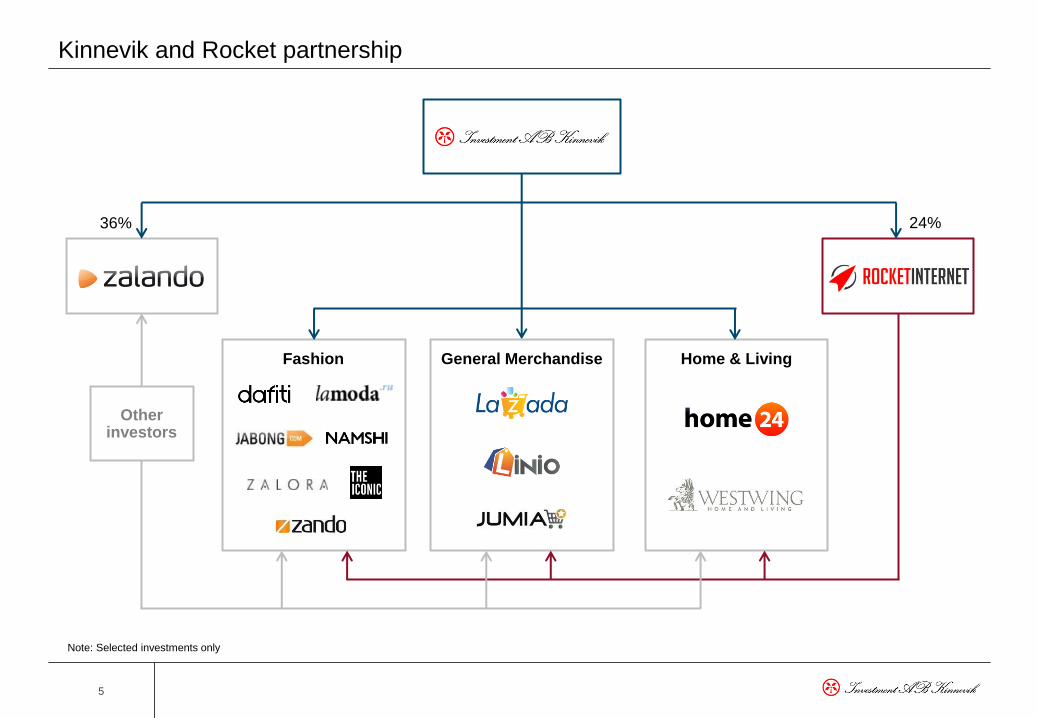
24%
Kinnevik and Rocket partnership
36%
Fashion General Merchandise Home & Living
Other investors
Note: Selected investments only
6
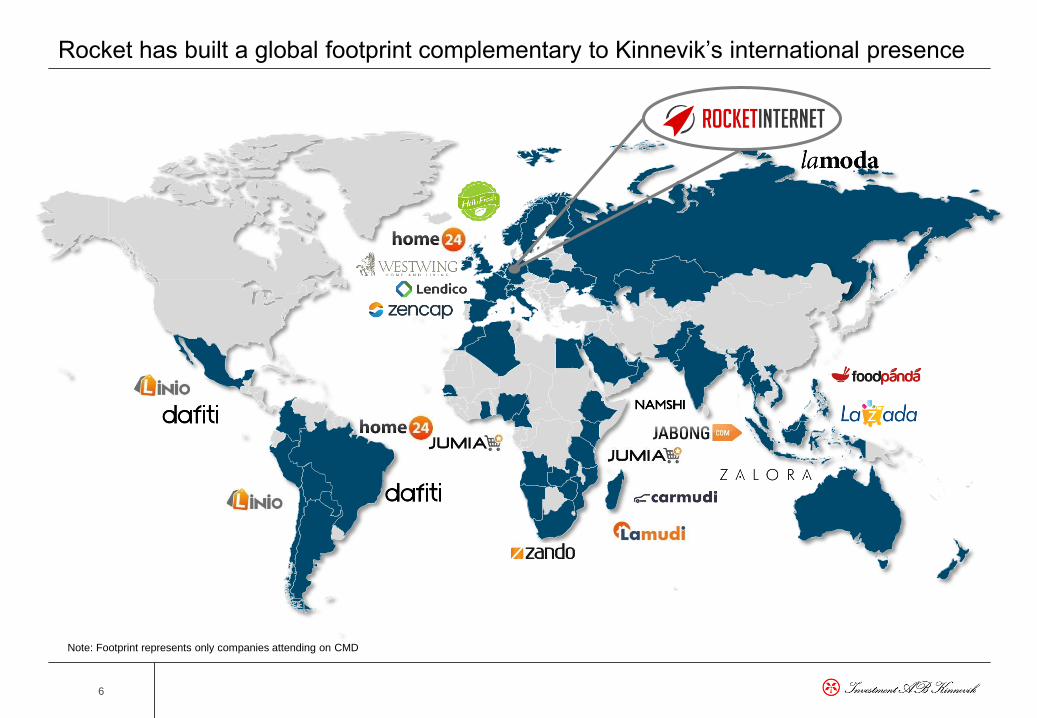
Rocket has built a global footprint complementary to Kinnevik’s international presence
Note: Footprint represents only companies attending on CMD
7
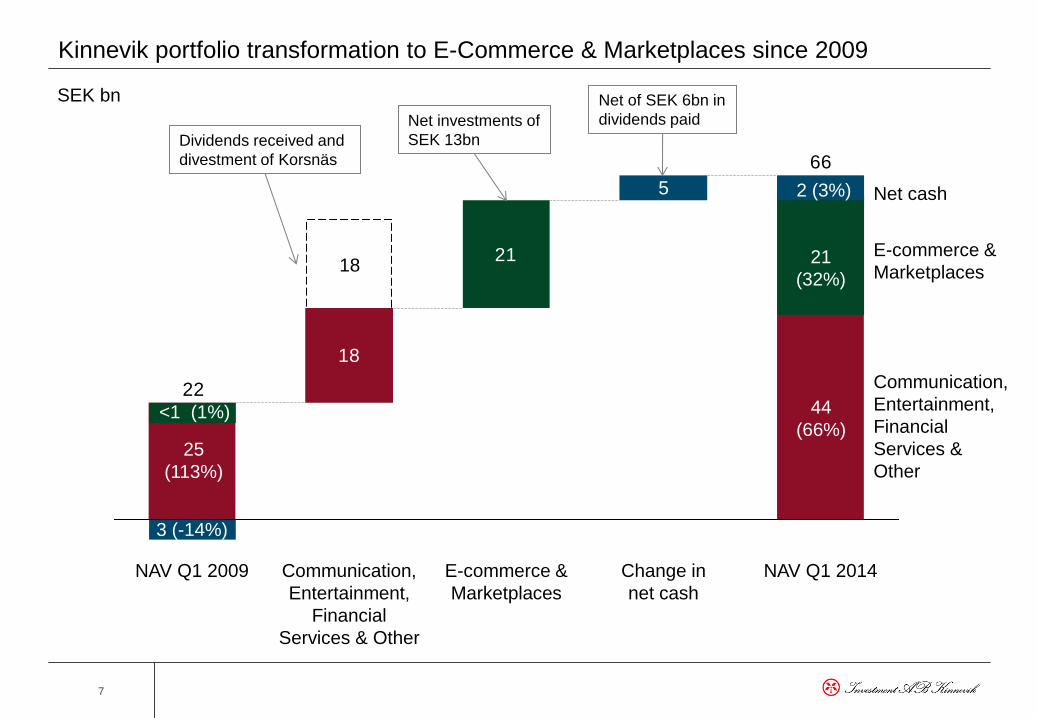
18
21
5
66
22
Change in
net cash
NAV Q1 2014
E-commerce &
Marketplaces
Communication,
Entertainment,
Financial
Services & Other
NAV Q1 2009
Kinnevik portfolio transformation to E-Commerce & Marketplaces since 2009
Dividends received and
divestment of Korsnäs
Net investments of
SEK 13bn
25
(113%)
44
(66%)
SEK bn Net of SEK 6bn in
dividends paid
E-commerce &
Marketplaces
Communication,
Entertainment,
Financial
Services &
Other
Net cash
<1 (1%)
3 (-14%)
21
(32%)
2 (3%)
18
8
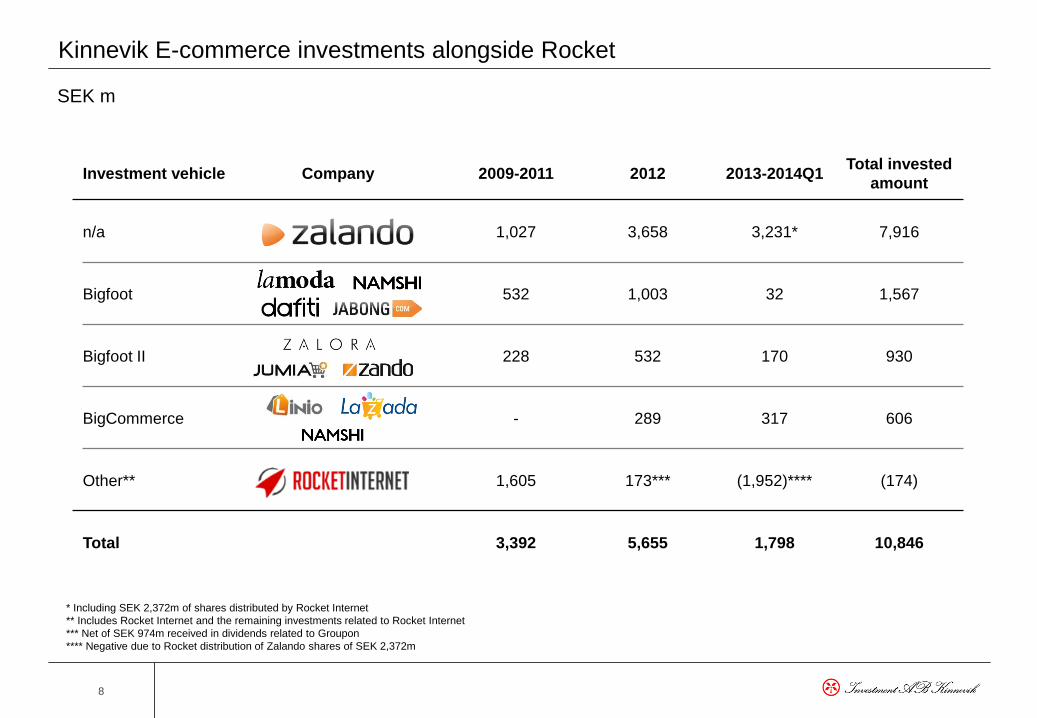
Kinnevik E-commerce investments alongside Rocket
Investment vehicle Company 2009-2011 2012 2013-2014Q1 Total invested
amount
n/a 1,027 3,658 3,231* 7,916
Bigfoot 532 1,003 32 1,567
Bigfoot II 228 532 170 930
BigCommerce - 289 317 606
Other** 1,605 173*** (1,952)**** (174)
Total 3,392 5,655 1,798 10,846
SEK m
* Including SEK 2,372m of shares distributed by Rocket Internet
** Includes Rocket Internet and the remaining investments related to Rocket Internet
*** Net of SEK 974m received in dividends related to Groupon
**** Negative due to Rocket distribution of Zalando shares of SEK 2,372m
9
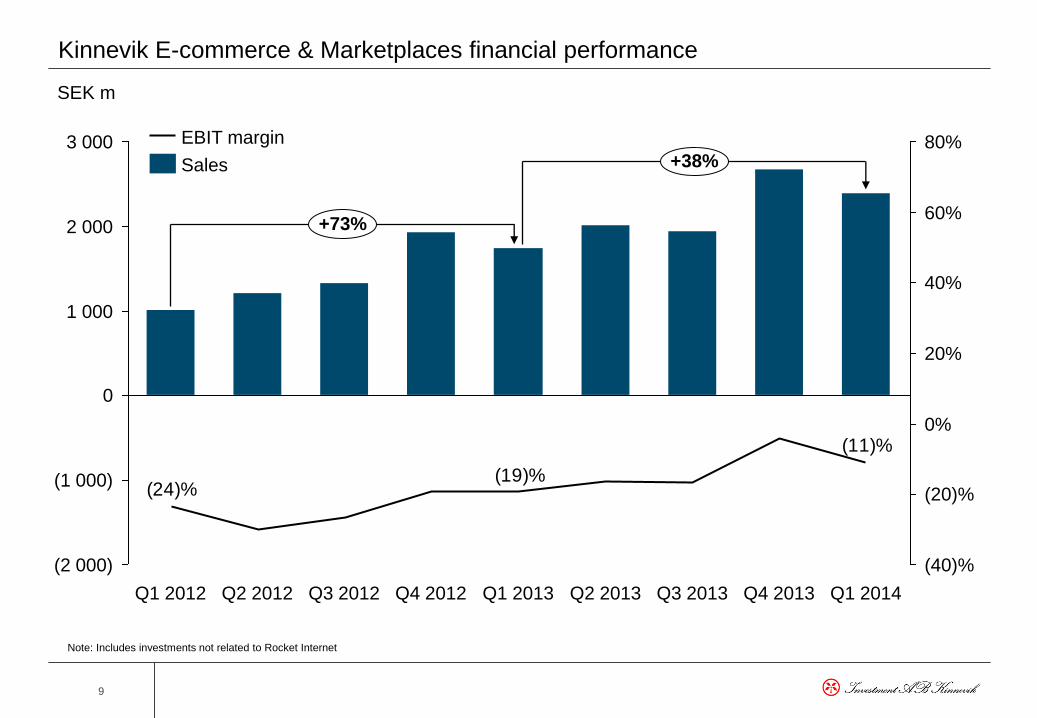
Kinnevik E-commerce & Marketplaces financial performance
(11)%
(19)%(24)%
(1 000)
(2 000)
(20)%
(40)%
3 000
2 000
1 000
0
80%
60%
40%
20%
0%
Q2 2013 Q1 2013 Q4 2012 Q3 2012 Q2 2012 Q1 2012
+73%
Q1 2014 Q4 2013 Q3 2013
+38% Sales
EBIT margin
SEK m
Note: Includes investments not related to Rocket Internet
10
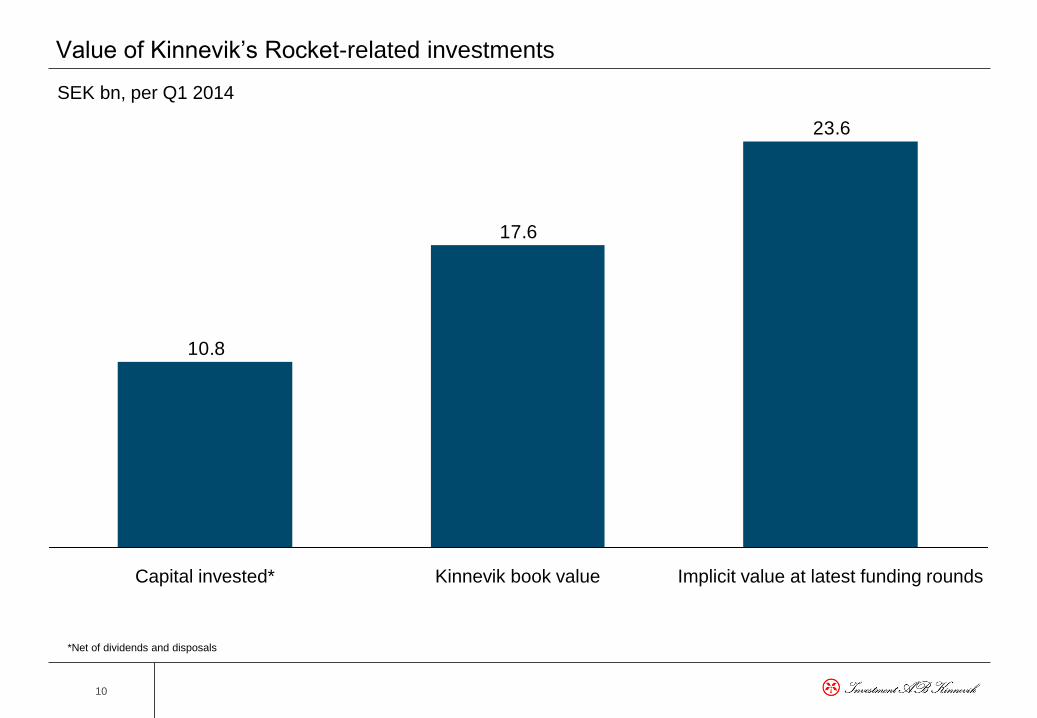
Value of Kinnevik’s Rocket-related investments
23.6
17.6
10.8
Implicit value at latest funding rounds Kinnevik book value Capital invested*
SEK bn, per Q1 2014
*Net of dividends and disposals
11
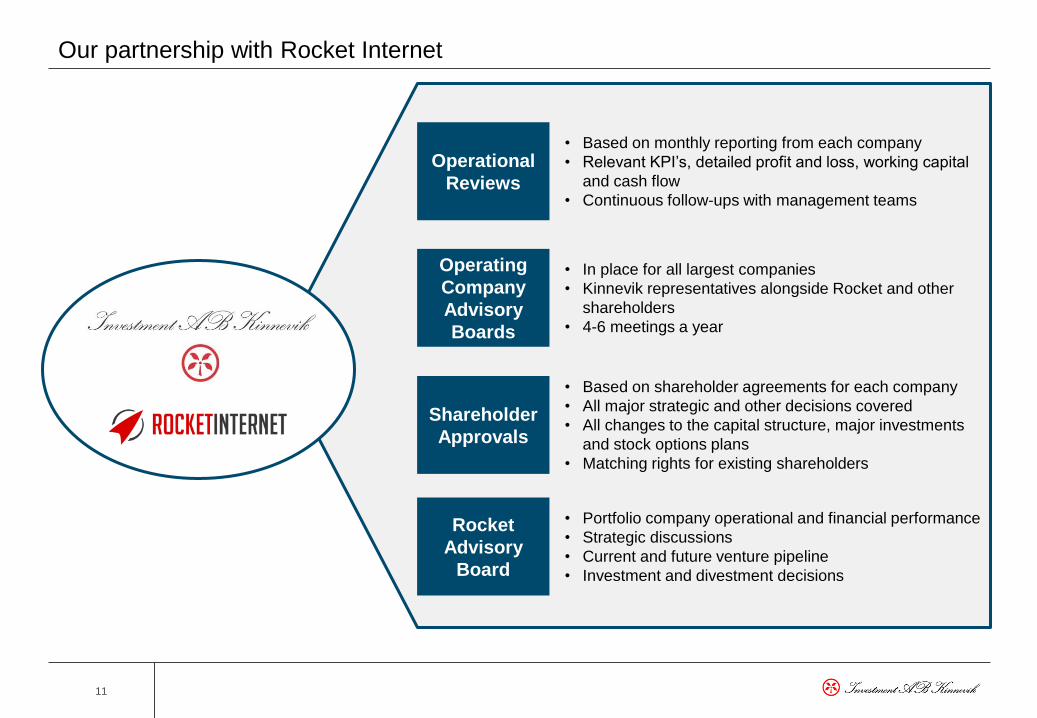
Our partnership with Rocket Internet
Rocket
Advisory
Board
Operating
Company
Advisory
Boards
Operational
Reviews
Shareholder
Approvals
• Portfolio company operational and financial performance
• Strategic discussions
• Current and future venture pipeline
• Investment and divestment decisions
• In place for all largest companies
• Kinnevik representatives alongside Rocket and other
shareholders
• 4-6 meetings a year
• Based on monthly reporting from each company
• Relevant KPI’s, detailed profit and loss, working capital
and cash flow
• Continuous follow-ups with management teams
• Based on shareholder agreements for each company
• All major strategic and other decisions covered
• All changes to the capital structure, major investments
and stock options plans
• Matching rights for existing shareholders