KINGSTON WATER DISTRICT - Rhode Island
30
1 KINGSTON WATER DISTRICT Clean Water Infrastructure Plan 2020
Transcript of KINGSTON WATER DISTRICT - Rhode Island

1
KINGSTON WATER DISTRICT
Clean Water Infrastructure Plan
2020
2
Table of Contents
Chapter 1: Goal Statement
Chapter 2: General Narrative
Chapter 3: System Components
Chapter 4: Water Treatment
Chapter 5: Capital Expenditures
Chapter 6: Capital Funding
Chapter 7: Conclusion
Chapter 8: Attachments

3
Chapter 1 Goal Statement
2020
The Kingston Water District’s goal is to provide safe drinking water in a reliable manner to all users in its service area. The Kingston Water District will endeavor to preserve and conserve natural resources while utilizing the ground waters to serve its community as indicated in the District’s motto: “To serve, preserve, and conserve”. This Clean Water Infrastructure Plan is consistent with the District’s Water Supply System Management Plan and serves as a tool in the development of the District’s financial planning process. The District has a long history of working closely with Town officials in coordinating its long range and short term planning efforts.

4
Chapter 2
General Narrative 2020
Introduction:
The Kingston Water District is a quasi-public water district supplying water to a legislatively defined district including the Villages of Kingston and West Kingston and encompassing the University of Rhode Island. The District was chartered by the General Assembly (Chapter 105 of the Public Laws of 1990) on July 3, 1990. The qualified electors of the district ratified the creation of the Kingston Water District on November 8, 1990. The voters of the Kingston Fire District transferred the assets of its Water Department to the Water District on February 26, 1991. Effectively, March 1, 1991 was the first day of operation for the KWD. The KWD is independent of the Kingston Fire District, which functions solely as a fire district. Historical Perspective: Prior to the KWD, the residents of Kingston had been serviced by various water supply entities. The first public water supply got under way in 1888 and became incorporated in 1923 as the Bernon-LeMoine Water Company. In 1955, the Kingston Fire District purchased the assets of the Water Company and created the Water Department. From 1955 until 1991, the Kingston Fire District provided both water and fire service to the Kingston area through the two separate departments. With the growth experienced in this area, it became apparent that the Water Department’s service area would have to be expanded beyond the limits of the Kingston Fire District. This led to the creation of the Kingston Water District. System Description: The Kingston Water District is a public community water supply system that has two wells located in the Chipuxet aquifer with a third well located in the Genesee Brook aquifer. Currently, the KWD leases land from the University of Rhode Island for the two production wells located near the intersection of Plains Road and Route 138 (Kingstown Road). Well #1 is approximately 200 feet north of Rt. 138. Well #2 is situated 200 feet south of Rt. 138. Well #3 is located on a 78-acre parcel owned by the District approximately 2 miles southeasterly of the first two wells.
Water is stored in two elevated water towers. One tower is located on Mooresfield Road (Rt. 138) in Kingston Village, and the other tower is located on Tefft Hill off of South Road. Because both towers operate at the same level, the KWD’s distribution system functions as a single pressure zone.
The District maintains three emergency interconnections with the University of Rhode Island’s water system, which also has wells in the Chipuxet aquifer. The interconnections are located on Upper and Lower College Roads and Rt. 138 in Kingston. The two eight-inch connections and one 12-inch connection flow in both directions on a gravity basis.
In anticipation of future regional needs to wheel water, the KWD installed, in 2008, a short run of twelve-inch piping from the District’s main on Old North Road into

5
URI property at Flagg Road. This could make for a fourth interconnection with the university and could become a means of moving water elsewhere in the region. This action was undertaken by the district with consent from URI. KWD funded the project using only its own funds and without support from the Water Resources Board’s interconnection program.
The District has approximately 1,150 service connections serviced by a network of 21.9 miles of pipes. The pipes range in diameter from 4” to 16”. An inventory of all mains is included in the attachments. All of the distribution piping has been sized to handle the flows associated with domestic use. System Limitations:
Fire flows have been improved over time since the current management began revitalizing the system. According to the local fire chief, fire flows required in the central portion of Kingston Village are approximately 2,500 gpm. With the construction of the Tefft Hill water tower and the addition of Well #2, fire flows reached 1,500 gpm. With the addition of Well #3, the fire flows are approximately 2,000 gpm at a residual pressure of 20 psi.
At this time, the major constraint to reaching higher fire flows has been the undersized transmission line along Rt. 138. A significant portion of 8” piping will be replaced with 16” piping when RIDOT rebuilds Rt. 138. In anticipation of that work, the District, in 2005, replaced a major bottleneck on Rt. 138 in the vicinity of Biscuit City road with 16” material.
In 2010, the District replaced the valves and other appurtenances in the intersection of Rt. 138 with Little Rest Road, in so doing increased the piping from 8” to 16”.
Because RIDOT has indicated that it plans to go out to bid in 2025 for work on Rt. 138, the District has shifted priorities from transmission work to well development. KWD will make some improvements along the Rt. 138 when opportunities present themselves, such as the Town’s sewer force main replacement project that had been proposed for 2020.
In hopes of becoming a partner in the process, the district had selected the town’s engineering firm as its project engineer only to find out that DOT had a much longer timing horizon than either the town or the district had anticipated. Future Improvements: New Water Sources:
Well #1: The District has replaced Well #1(WL 001) with Well 1A (WL 004) The replacement well is located approximately 30 feet north of the original well and operates at approximately 450 gpm. It is in the same geological formation as its predecessor.
Well #4 (Liberty Lane Well): The District has acquired the site and has received site approval from DOH.
The well site has been approved by the Department for a public supply. The well has been redeveloped and is in serviceable condition with a rated capacity of 700 gpm. Early in 2019, a new 12” main was installed to connect the well site to the District’s 16

6
inch main on Fairgrounds Road. The preexisting connection to the District’s main on Liberty Lane has been abandoned.
Recently, the District conducted another pump test to determine the quality of the source water. The main impetus behind the testing was to make a preliminary determination of whether the well might be under the direct influence of surface water. From design and engineering perspectives, the raw water quality information was paramount in developing a scope of work. Transmission Line Upgrade:
To improve fire flows on top of Kingston Hill, the District plans to replace its existing transmission line. This will involve replacing the existing 8” cast iron main with a 16” main, effectively quadrupling the carrying capacity of the pipe.
The KWD will tailor its water main replacement program to the extent of DOT’s 3R project on Rt. 138. At a bare minimum, the District envisions replacing all of the eight inch cast iron piping running from Little Rest Road to Lower College Road. Distribution System: The District, historically, has made it a practice to replace/upgrade the distribution system. Based upon ongoing annual system wide leak detection and inspection of older components, the KWD identifies various areas of the distribution system, including services, for replacement on a neighborhood by neighborhood basis. When water mains are replaced, all of the water services on that pipe are replaced at the same time. The District has adopted the policy of replacing entire water services if the service has failed due to age or major damage. The District has established 8-inch mains as the smallest size allowed for distribution purposes. Ductile iron and molecular oriented PVC are the materials most commonly used piping materials. Similarly, the minimum size for a water service is one-inch. High density polyethylene is the material of choice for most potable water services. The use of non-metallic piping has dramatically reduced pipe failure associated with external corrosion caused by elevated ground water and stray voltage. Perched water tables, as found on Kingston Hill, tend to be very aggressive especially with the abundant muse of road deicing compounds. Anode pits installed by other entities can cause problems especially when the pits are located close to the District’s piping.

7
Chapter 3
System Components 2020
Description The system is broken down into its various major components including wells, towers, water mains, hydrants, valves, services, and meters. A brief description follows of each component and of the operational procedures associated with that particular component. From that discussion, a capital cost is given. Wells The KWD has three active wells, which are described below. The fourth well is not active at this time and is described as a future source of supply.
KINGSTON WATER DISTRICT: RIDOH PWS ID# 1858421 Well #1A Well #2 Well #3 Location Plains Road Ministerial Road Off Ministerial Road Aquifer Chipuxet Chipuxet Genesee Type Gravel Packed Gravel Packed Gravel Packed Depth 51’” 67’ 11” 91’ Diameter 24” x 18” 24” x 18” 24” x 18” Pump Type Submersible Turbine Turbine Pump Age 2013 2011 2016 Remaining Life NA NA NA Rated Capacity 500 gpm 600 gpm 703 gpm well output Daily Capacity 576,000 864,000 1,008,000 Pump Size 8” 8” 8” Discharge Size 8” 8” 8” Column Size NA 8” 8” Head 330’ 330’ 330’ Screen Length 10’ 15’ 20’ To top of Screen 41’ 52’ 11” 71’ Screen Slot Size 60# 70# 70# Screen Material Stainless Steel Stainless Steel Stainless Steel Auxiliary Power Generator Right Angle Drive Generator Date Well Drilled July12, 2013 Nov. 10, 1982 Dec. 28, 1998 Driller S.B. Church R. E. Chapman R. E. Chapman Drilling Method Drilling Bucket Cable Tool Cable Tool Casing Material Steel Steel Steel Monitoring Wells 3 2 10 Well Status Active Active Active Date Redeveloped NA November 2011 2016 Notes

8
The wells are operated on an alternating basis. Draw down measurements are taken at each well on a weekly basis to evaluate pumping conditions. The wells are redeveloped every ten years or less as conditions warrant. At Well #2, backup power is supplied through right angle drive propane powered engine that is operated on line weekly. Wells #1 and #3 are equipped with propane powered generators that are exercised weekly. All three wells are equipped with variable frequency drives. The wells are controlled by a SCADA system that was installed over a number of years starting in 2015. The system became fully operational in 2018 linking together all major components of the water system. Future Source of Supply
Well #4 Location Fairgrounds Road Aquifer Chickasheen Type Gravel Packed Depth 65’ 6” Diameter 24” x 18” Pump Type NA Pump Age NA Remaining Life NA Rated Capacity 700 gpm Daily Capacity Pump Size NA Discharge Size NA Column Size NA Head NA Screen Length 21’ To top of Screen 44’6” Screen Slot Size 60# Screen Material Stainless Steel Auxiliary Power NA Date Well Drilled 1960 Driller R. E. Chapman Drilling Method Cable tool Casing Material Steel Monitoring Wells 2 Well Status Inactive Date Redeveloped 2013 Notes Rescreened 2013
This well is still in the design/permitting process. It had been owned by the University of Rhode Island and was used to supply two facilities that are now connected to the District’s system. To date the District has expended over $500,000 in improvements including additional land acquisition.
9
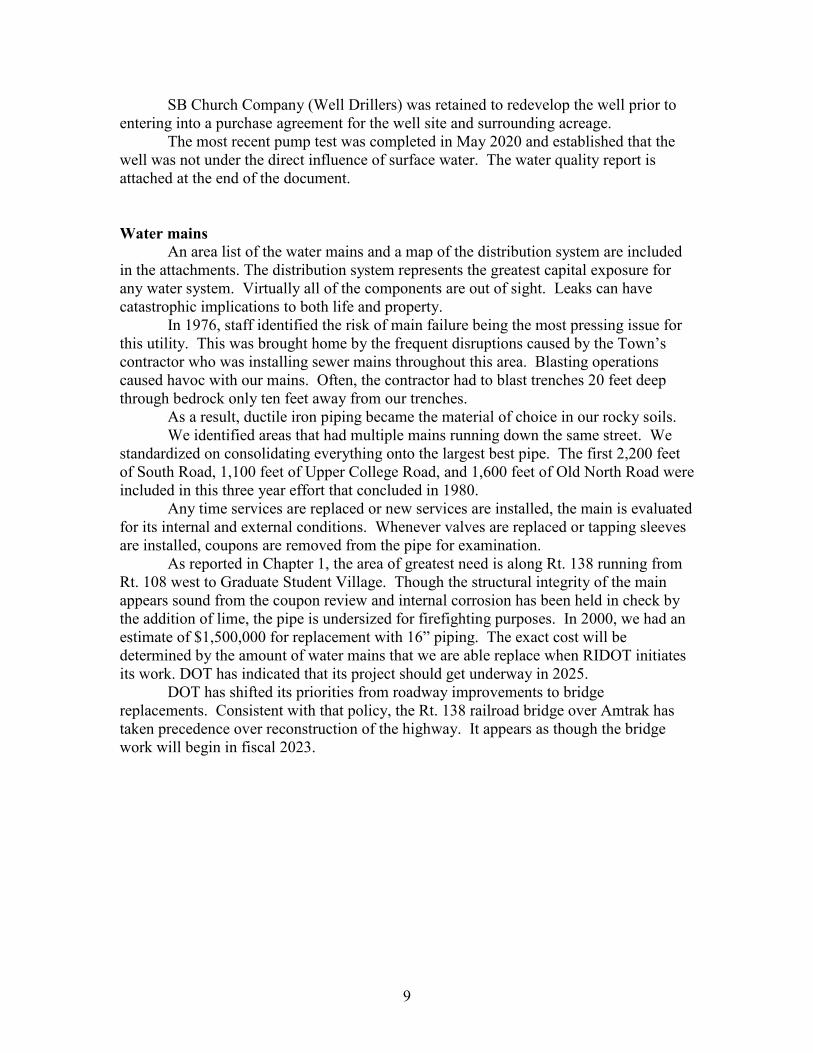
SB Church Company (Well Drillers) was retained to redevelop the well prior to entering into a purchase agreement for the well site and surrounding acreage. The most recent pump test was completed in May 2020 and established that the well was not under the direct influence of surface water. The water quality report is attached at the end of the document. Water mains An area list of the water mains and a map of the distribution system are included in the attachments. The distribution system represents the greatest capital exposure for any water system. Virtually all of the components are out of sight. Leaks can have catastrophic implications to both life and property. In 1976, staff identified the risk of main failure being the most pressing issue for this utility. This was brought home by the frequent disruptions caused by the Town’s contractor who was installing sewer mains throughout this area. Blasting operations caused havoc with our mains. Often, the contractor had to blast trenches 20 feet deep through bedrock only ten feet away from our trenches. As a result, ductile iron piping became the material of choice in our rocky soils. We identified areas that had multiple mains running down the same street. We standardized on consolidating everything onto the largest best pipe. The first 2,200 feet of South Road, 1,100 feet of Upper College Road, and 1,600 feet of Old North Road were included in this three year effort that concluded in 1980. Any time services are replaced or new services are installed, the main is evaluated for its internal and external conditions. Whenever valves are replaced or tapping sleeves are installed, coupons are removed from the pipe for examination. As reported in Chapter 1, the area of greatest need is along Rt. 138 running from Rt. 108 west to Graduate Student Village. Though the structural integrity of the main appears sound from the coupon review and internal corrosion has been held in check by the addition of lime, the pipe is undersized for firefighting purposes. In 2000, we had an estimate of $1,500,000 for replacement with 16” piping. The exact cost will be determined by the amount of water mains that we are able replace when RIDOT initiates its work. DOT has indicated that its project should get underway in 2025. DOT has shifted its priorities from roadway improvements to bridge replacements. Consistent with that policy, the Rt. 138 railroad bridge over Amtrak has taken precedence over reconstruction of the highway. It appears as though the bridge work will begin in fiscal 2023.

10
Towers The following table describes the District’s storage structures. Towers #1 #2 Location 1843 Mooresfield Road 430 Chestnut Hill Road Capacity in Gallons 100,000 500,000 Overflow Elevation MSL 351 351 Type Elevated Elevated Age 1964 1991 Condition Excellent Good Inspected 2018 Spring 2015 Repairs External stiffeners 2018 Repairs Internal cleaning 2018 External cleaning 2019 Repainting 2003, touchup 2020 Completed 2010
The towers are inspected routinely. Tower #1 was completely repainted in 2003.
Tower #2 was repainted in 2010 at a cost of $444,000 plus approximately $30,000 in inspection services. Essentially, it cost as much to repaint the tower as it did to build the structure. And, people don’t believe in inflation! The District leases space on its towers to AT&T and to T-Mobile. The revenue associated with the rental will be used to fund the maintenance of these two structures. All revenue from this source is allocated to the Infrastructure Reserve Account in our capital budget. Hydrants
The District supplies water to 117 public fire hydrants and 21 private hydrants. The oldest hydrant was installed in 1965. The newest hydrant was installed in 2009. All hydrants installed after 1979 must be UL/FM rated in addition to meeting AWWA standards. Currently, the District is converting all of its valve and hydrant records to GIS In 1977, staff implemented the ongoing semi-annual hydrant-flushing program, which has evolved into a twice-yearly unidirectional flushing operation. All hydrants are repaired or replaced promptly. One third of the District’s hydrants are painted annually. The District keeps spare hydrants in inventory at all times along with normal wear and tear parts. Currently, the replacement cost of a hydrant is approximately $2,300. The hydrant charge revenues are transferred from the operating budget to the capital budget to offset the costs of infrastructure replacement and capital improvements necessary to meet fire flows. Valves Currently the KWD maintains approximately 500 valves ranging in size from 4” to 16”. From an operational standpoint, the District standardized on resilient seated valves beginning in 1979. During the late 70s and early 80s, the District replaced a significant number of old double disc gate valves with new resilient seated valves. This action was undertaken to provide better control of water flow.

11
All valves are operated at least annually. Repairs are made promptly. Valves are installed on each leg of any pipeline intersections; e.g. three valves on three-way intersections. Valves are identified by age, manufacturer, type, and condition. Valves are replaced according to performance. Leaking valves either are repaired promptly or are replaced depending upon the severity of the condition. To minimize capital expense, the District attempts to coordinate its valve and main replacement efforts to coincide with state and town road rehabilitation projects. Road repairs now cost as much as the installation of piping. Current prices are listed below for various valves. The radical increase in cost of 16” valves is directly attributable to depth of cover requirements. Because the 16” valves are so large, the District, in order to maintain proper depth of bury, has to install the valves horizontally, which in turn requires the use of bevel gear drives.
16" Valves 8,000 12" Valves 3,500 8" Valves 1,000 6" Valves 600
Future valve replacements will be tied largely to water main upgrades and will be included in the capital costs of those projects. However, good operation practices will ensure that the full life is realized from every valve and that capital dollars are expended for improvements and not infrastructure replacements caused by poor O&M practices. In anticipation of sewer line replacement projects that had been slated for 2020, the District, to minimize risk, installed insertion valves at the intersections of Rt. 138 with both Upper and Lower College Roads. Services The District owns and is responsible for the service from the main to the curb stop at the property line. The property owner is responsible for the line from the curb stop up to the point of use. Samples of the various water service forms are included in the attachments. The District has adopted the practice that all leaking water services more than 10 years old or subject to major damage will be replaced from the main to the curb stop. Depending upon the situation, we encourage our customers to replace the private portion of the line at the same time. This avoids the practice of repairing a chain one link at a time. It also gives us the opportunity to evaluate the condition of the main at each service installation. By replacing water services on a regular basis, we avoid having to implement a “crash program” of service line replacements. We plan to replace other services as part of water main upgrades.
Since 2009, the District implemented a policy of purchasing “no” lead brass fittings.
In 2011, the District replaced the 3” cast iron pipe on French Road with 6” PVC. All of the water services were replaced at the same time.
In 2015, the District focused on the Biscuit City Road section because the Town had targeted the area roads for reconstruction. Services were replaced along the entire

12
length of Biscuit City Road. In addition, approximately 380 feet of 6” piping along White Horn Dive was replaced with 8” PVC complete with all new water services. Leak survey A leak survey of the entire system is performed annually. This has the effect of minimizing the costs associated with leaks. Early leak identification helps to avoid catastrophic failures, which in turn lead to capital problems. Repairing a service leak, for example, may avoid settlement, which can lead to main failure. In addition, lost water means increased operating costs. By standardizing on non-metallic water services and compression fittings, the KWD minimizes the potential for corrosion induced leaks. The KWD consistently has maintained non-account (more correctly termed non- billed) water levels well below the state’s goal of 15%. A copy of the District’s 2019 water sales and usage analysis report is included in the attachments. Customer meters All meters are read quarterly. By 2010 all of the meters had been equipped with radio reading devices that were read on a drive by system. Starting in 2017, the District began a conversion to fixed base meter reading (AMR). Currently, over 30% of the District’s meters are monitored continuously from the office. All large volume water users have been connected to the fixed base system. All replacement meters are “no” lead and conform to NSF 61 and are connected to the AMR system. Backflow Prevention The District has had a backflow policy in place since 1989. Though revised in 2001, the current policy was revised further to reflect new regulations adopted by DOH in 2010. All customers are required to have backflow preventers installed at the meter and at any point of use determined to be hazardous. All lawn irrigation systems are equipped with backflow preventers that must be tested annually. Older homes are retrofitted with backflow preventers prior to sale or when significant repairs are made to the water supply. As a courtesy to our customers, the District absorbs the cost of the containment device and utility grade shut off located at the meter for all single family dwellings. As of this report, less than 50 accounts do not have some sort of backflow prevention device installed at the meter (containment) and/or at the point of use.
The major side benefits to this program have been the minimizing of water hammer and a certain amount of surge control. Under conditions of high water flow and or draining of pipes for repair, the customers’ services do not drain back into the system. The backflow preventers minimize the amount of shock being displaced into the system when things return to normal thus reducing the possibility of contamination associated with backsiphonage. This should have a positive impact on system longevity.

13
Chapter 4
Water Treatment 2020
Current Treatment: The District started adding lime to its water in the late 1980s. The pH of the raw water ranges between 5.9 and 6.1 depending upon which well is in use. With the addition of lime and the raising of pH to 7.5, the District has been able to comply with the Lead and Copper Rule. To enhance lead and copper compliance, the KWD has standardized on the use of non-metallic water services along with “no” lead fittings and meters. The use of lime had the additional benefit of minimizing leaks in customer’s copper service lines. Pinhole leaks have become things of the past. No other treatment is practiced at this time. Future Treatment:
Background: The District has not had to disinfect either its source of supply or the distribution system. The system has a reasonable supply of good quality groundwater. Well #3 has been situated in an area that is remote from the kinds of potential threats that could affect the other two wells located in the Chipuxet.
The distribution system has been managed and maintained to provide high quality non-disinfected water.
Disinfection: Though KWD has a long history of providing safe water without the use of a
disinfectant, the District has retained engineering services for the design and permitting of a disinfection system.
This action grew out of general recognition of the risks that could be encountered should the system ever experience a contamination event similar to that of a neighboring utility. The delays associated with designing a system under the restrictions of a boil water decree would be disastrous. Better to be prepared than not.
Before the District can implement disinfection, a number of steps will have to be implemented. First, as the District’s largest customer is a fish research facility that cannot tolerate any chlorine use, provision will have to be made for disinfectant removal. Even under the current supply, the fish could be vulnerable due to a host of reasons, not the least of which is a water main break. In anticipation of current risks to the facility, the District and the facility’s director have initiated discussions for future on site storage and the need for additional treatment.
In addition to providing an additional layer of protection for our customers, the use of a disinfectant will enable the District to supply water to two neighboring utilities during times of need. In 2021, for example, URI will need to come on the District’s system while the university makes repairs to its water tower.

14
Chapter 5
Capital Expenditures 2020
The District has established two classes of capital expenditures, capital
improvements and infrastructure replacements, and has segregated the funds according to the following definitions. Capital Improvements
“A capital improvement project is defined as any project, which increases the capacity or the size of the water system and has a life expectancy greater than 10 years.” For example, Well #3 was treated totally as an improvement project because it increased the capacity of the water system and did not “replace” another well. Infrastructure Replacements
“An infrastructure replacement project is defined as any system component which must be replaced and has a life expectancy greater than 10 years.” The 2004 replacement of the line on Campus Avenue, for instance, was treated as an infrastructure replacement project because the old line had to be replaced. Identified Projects: The District has identified the following major projects. Well #4:
This well is a work in progress. The site has been approved by DOH. The water main into the site has been upgraded from 8” to 12”.
Raw water quality sampling has gotten underway so that the District can solicit bids for construction of the pumping station and requisite treatment. 48 hour and 72 hour pump tests have been conducted at the site over the past three years with the most recent having been completed this past May. Tower #1:
The complete rehabilitation of this tower was completed in 2003. Revolving loan funds were used to fund the project, which were paid off early. Though this tower will be due for painting prior to the other tower, it has had the benefit of ongoing maintenance associated with cellular communication improvements that have added both structural and aesthetic improvements to non-water bearing surfaces.
The most recent improvements took place in May and June of 2020. Tower #2:
This tower was completely repainted in 2010. ARRA funds were used to finance this project. In June, the board opted to pay off the loan early. Inspection and internal cleaning will take place in the summer of 2021.

15
Transmission Line Upgrade: This undertaking will be funded jointly as a capital improvement and
infrastructure replacement project. We plan to initiate this work when RIDOT commits to rehabilitating Rt. 138.
Estimated timeframe: 2025- 2026. Distribution Mains: Lower & Upper College Roads:
The KWD had identified the intersections of Lower and Upper College Roads with Route 138 as being particularly vulnerable to damage during the Town’s proposed 2020 sewer line project. To minimize potential risks, the District installed, in 2019, insertion valves at the two intersections so that the respective road crossings could be closed with minimum impacts to system operations. Ultimately, the Town chose to postpone its sewer line project.
As part of its ongoing replacement program, the District will continue to replace, rather than repair, old or severely damaged water services, thus recapturing the entire life expectancy of the service line and enhancing system reliability.
Biscuit City Road: Throughout the area, there is an eclectic of piping materials including asbestos-
cement (AC), ductile iron, PVC, and molecularly oriented PVC (C909). To date, based upon service line replacements and valving improvements, the pipes appear to be in good to excellent condition.
All of the earlier 4” cast iron piping that dated back to the original Bernon-Lemoine Water Company have been abandoned. The oldest water main runs approximately 1,500 feet from Rt. 138 to the intersection of Potter Woods Road. According to our records, the main was installed around 1955. As such, it would be the most likely candidate for replacement during the next major town road maintenance project involving Biscuit City Road.
The six inch line running along White Horn Drive from Stonehenge Road to just east of Spring Hill Road was replaced with 8 inch piping to enhance water flows in and out of the Tefft Hill Tower.
In 2015 extensive water service replacements took place in the Biscuit City Road area because the town opted to rehabilitate the many of the roads in that area. Several valves were inserted at a key intersection to provide for better control of a looped network.

16
Trucks Vehicle replacement is taken out of the operating budget and transferred to the
capital budget. Depending upon individually tracked maintenance records, the trucks are replaced at the earlier of 120,000 miles or ten years.
The district maintains two full-sized pickups and recently purchased a third truck equipped with a utility body.
Truck Cost Year 2020 Utility 38,000 2020 2016 GMC Pickup 35,000 2018 2016 Ford Pickup 32,000 2018

17
Chapter 6 Funding
2020 Revenue Sources: The KWD is a self-supporting municipal enterprise, which has three revenue sources: operating revenues, impact fees, and antenna leasing. Operating Income: The operating income includes water sales, distribution (connection), capital, infrastructure, and hydrant charges, and interest on short-term investments. All operating expenses are funded by the operating budget. Expense lines #6225, #6226 and #6227 are designated for transferring funds out of the operating budget into the Infrastructure Replacement and Capital Improvement accounts of the capital budget. Recognizing that the cost of doing business increases routinely, the District will continue its practice of annual budget review and rate adjustment. This avoids rate shock and minimizes the lag time between rate implementation and the receipt of the new revenues. Through annual adjustments to our water rates, we should remain on track with increases in the cost of financing. Annual reassessment of water rates is essential in order to adjust for the actual costs down the road. In addition, surplus funds, if available, at the end of each year are transferred into the Infrastructure or Capital accounts. Capital Improvements (impact fees): This account was set up to deal with the demands placed upon the system by new construction. In 1989, the District determined that 20,000 cubic feet of water represented the upper limit of typical annual residential water consumption. This became a guideline in determining the needs of new construction. Each unit of new residential construction must pay an impact fee of $2,860.43 prior to hooking up to the system. Non-residential connections must pay a fee based upon an estimated number of 20,000 cubic foot blocks of water used. For example, a commercial establishment that anticipated using 200,000 cubic feet of water annually would pay a one-time impact fee of $28,604. Lease Income: The District leases space on its towers to various wireless communication providers, including Cox, T-Mobile and AT&T. The leases are in place for at least the next 15 years, and the revenue has been assigned to the Infrastructure Replacement Account.

18
Capital Projects: The KWD’s major capital projects have been classified into two timing categories: near term and 5-10 year. Each category is presented in a table with a project description, funding source, and cost. Near Term Projects:
Description Year Funding Cost Disinfection 2020 Budget 75,000 Disinfection 2021 Budget 30,000 Truck 2020 Budget 40,000 Well #4: testing 2020 Budget 20,000 Well #4: design 2021 Budget 100,000
Total 265,000 5 Year Projects:
Description Year Funding Cost Well #4 2022 SRF 1,500,000 Rt. 138 2025-26 SRF 2,000,000
Total 3,500,000 Total Cost for All Projects:
Near Term Projects 265,000 5 Year Projects 3,500,000
Total 3,765,000 Capital Funding: Our funding projections are based upon where the District expects to be in its capital program in 2020. To fund these projects, the District will utilize funds from several sources. Impact fees, routine transfers from the operating budget, and tower rental income are the primary sources of revenue for capital projects. In addition, the District will utilize the line items for new equipment, contracted labor, and materials as necessary to supplement the other funding sources. Copies of the rates and budgets are included in the attachments. In making our projections several underlying assumptions were made. Historically, the District had averaged 21 new connections per year. More recently, that figure has dropped to three per year. Being conservative, the KWD anticipates receiving one impact fee per year for the next 15 years. Budget transfers (capital, infrastructure, & hydrant charges) had been projected to increase 3% per annum. These actions result in a conservative approach to funding our capital projects. In addition, the District has a long history of segmenting projects into discrete portions that are fundable in single budget years, thus providing relief from the costs of ongoing inflation and debt service. For example in 2005, the District undertook the installation of 16 inch piping along Rt. 138 in the vicinity of Biscuit City Road, thus removing that expense from the overall cost of the future Rt. 138 project.
19
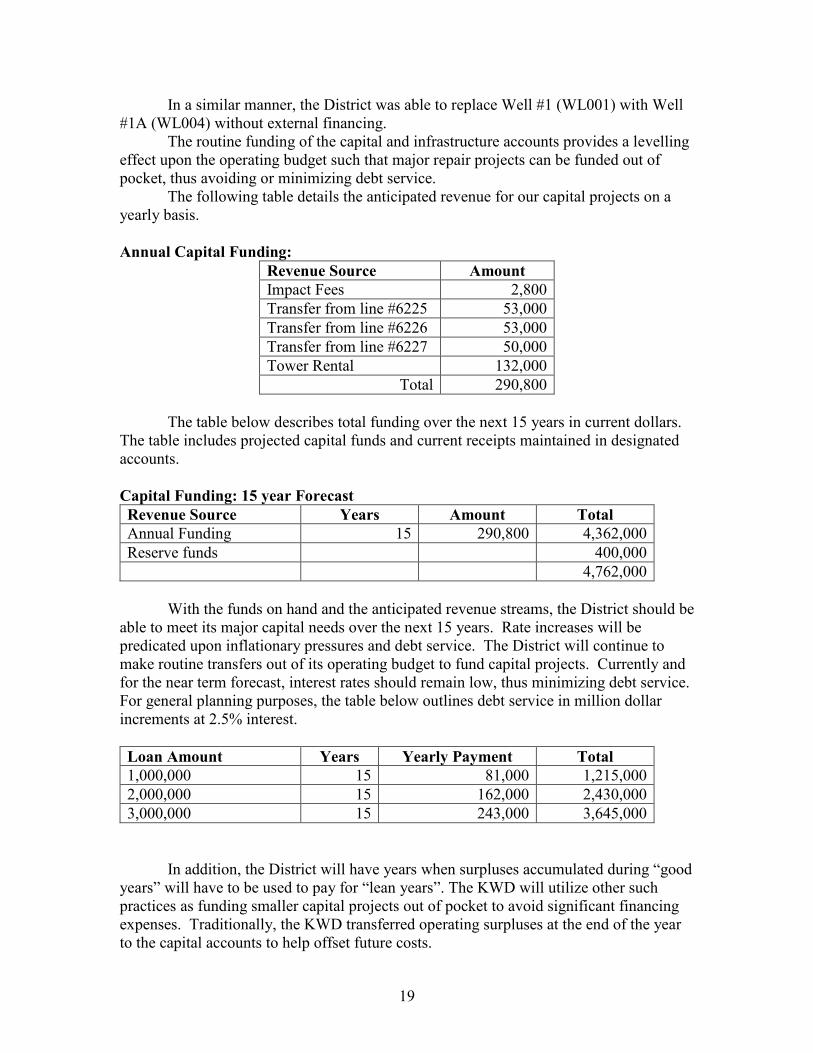
In a similar manner, the District was able to replace Well #1 (WL001) with Well #1A (WL004) without external financing. The routine funding of the capital and infrastructure accounts provides a levelling effect upon the operating budget such that major repair projects can be funded out of pocket, thus avoiding or minimizing debt service.
The following table details the anticipated revenue for our capital projects on a yearly basis. Annual Capital Funding:
Revenue Source Amount Impact Fees 2,800 Transfer from line #6225 53,000 Transfer from line #6226 53,000 Transfer from line #6227 50,000 Tower Rental 132,000
Total 290,800
The table below describes total funding over the next 15 years in current dollars. The table includes projected capital funds and current receipts maintained in designated accounts. Capital Funding: 15 year Forecast Revenue Source Years Amount Total Annual Funding 15 290,800 4,362,000 Reserve funds 400,000 4,762,000
With the funds on hand and the anticipated revenue streams, the District should be able to meet its major capital needs over the next 15 years. Rate increases will be predicated upon inflationary pressures and debt service. The District will continue to make routine transfers out of its operating budget to fund capital projects. Currently and for the near term forecast, interest rates should remain low, thus minimizing debt service. For general planning purposes, the table below outlines debt service in million dollar increments at 2.5% interest. Loan Amount Years Yearly Payment Total 1,000,000 15 81,000 1,215,000 2,000,000 15 162,000 2,430,000 3,000,000 15 243,000 3,645,000
In addition, the District will have years when surpluses accumulated during “good
years” will have to be used to pay for “lean years”. The KWD will utilize other such practices as funding smaller capital projects out of pocket to avoid significant financing expenses. Traditionally, the KWD transferred operating surpluses at the end of the year to the capital accounts to help offset future costs.

20
Historically, the District had made a practice of small (3%) annual increases in its
various charges. Because of rising costs, KWD and others must be cognizant of our customers’ ability to pay their water bills. The transition to quarterly billing appears to have helped in that regard.
Because the largest part of any water system is the distribution system, which has a life expectancy of 75 to 100 years, there has been a tendency to ride out the “capital wave” long after the assets have been fully depreciated. Unfortunately, riding the wave and not putting money aside in replacement funds (sinking funds) leads to the double jeopardy of having to play catch up while replacing huge amounts of infrastructure in an accelerated, almost crash course, manner.
Future KWD boards and management will continue to maintain and replenish sinking funds and other capital funds without resorting to the imprudent practice of deferring maintenance to accommodate the political expediency of not raising rates, let alone lowering water rates.

21
Chapter 7 Conclusion
2020 Conclusion: Based upon the identified projects and the associated revenue stream, the District should be able to meet its long-term capital goals, which include infrastructure replacement projects and new capital efforts. KWD recognizes that the timing of various projects may have to be altered because of the schedules of other entities. Bearing this in mind, the District will maintain close working relationships with other agencies, especially RIDOT, URI, and the Town of South Kingstown, to ensure the coordination and the timing of mutual projects. Economies of scale will come into reality on projects, such as RIDOT’s rehabilitation of Rt. 138. Economies of scale and coordination proved to be very advantageous in 2015 when, for example, the District joined forces with the Town in replacing infrastructure along White Horn Drive and elsewhere in the Biscuit City Road area. Already, the District has minimized some of its engineering expenses associated with Rt. 138 by collaborating with the Town on the design work for utility improvements in that highway. Because the Route 138 rehabilitation project has been pushed off by DOT until 2025, the District has refocused its attention to Well #4. The well could become a major asset in the event of a water emergency for URI, Kingston, or even the neighboring Suez Water system and its wholesale customers. As it has done over the past several decades, the District will continue to fund as many projects as possible out of accumulated reserves. For example, the entire cost of the Well #1 replacement project was paid for “out of pocket”, thus avoiding significant financing costs. In addition, along with appropriate professional input, the District acted as its own general contractor and spared itself the overhead costs of third party management. The District’s vendors and contractors benefitted from prompt payment. In turn, our costs reflected the District’s promptness.

22
Chapter 8
Attachments 2020
Attachment #1: System Map Attachment #2: Mains by Area Attachment #3: Water Rates Attachment #4: Budget Attachment #5: Non-Account Use Attachment #6: Well 4 MPA

23

24
Attachment #2 Area Totals Feet Miles Rt. 108 5,852
Rt. 138 East 10,848
Little Rest 5,195
South Road 21,559
Old North Road 12,619
Lower & Upper College Roads
4,619
Biscuit City Road 24,731
West Kingston 7,974
Tefft Hill 21,014
Total 114,411 21.7 Transmission Total 27,653 5.2 Distribution Total 86,758 16.4

25
Attachment #3 KINGSTON WATER DISTRICT Mail to: P.O. Box 216, West Kingston, RI 02892 Tel 401-783-5494 Office at: 14 Frank Ave., West Kingston, RI 02892 Fax 401-789-7004
WATER RATES
Effective: January 1, 2020
Distribution Charges: Based upon Meter Size Annual Charge Quarterly Charge
5/8” meter $ 245.69 $ 61.42 3/4” meter $ 328.42 $ 82.10 1” meter $ 376.94 $ 94.24 2” meter $ 829.17 $ 207.29 4” meter $2,222.33 $ 555.58 6” meter $4,296.66 $1,074.17
Rates for meter sizes larger than 6” would have to be developed as the need arises.
Water Consumption Charges: Per 100 Cubic Feet/
Residential $ 2.47 Up to 2450 Cubic Feet per Quarter Residential $ 2.72 Over 2450 Cubic Feet per Quarter Commercial $ 2.47 Institutional $ 2.47 Agricultural $ 2.47 Industrial $ 2.47 Wholesale $ 1.45
Capital Charge: Annual charge of $51.82 (paid quarterly $12.95) per customer account. Infrastructure Charge: Annual charge of $51.82 (paid quarterly $12.95) per customer account. State of Rhode Island Surcharge: State-imposed surcharge of $0.0292 per 100 gallons of water consumption. Multiple-Residential Use Through One Meter: For residential customers supplied through one (1) meter to more than one (1) dwelling or unit on the same platted lot, a distribution charge of $245.69 will be made to each residential unit, and the charge for water consumed will be billed as stated above under Water Consumption Charges.
Residential Impact Fee: A one-time fee of $2,860.43 per service connection shall be paid prior to hook-up to the water system for all new customers. Non-Residential Impact Fee: A one-time impact fee of $2,860.34 per service connection will be paid for each 20,000 cubic-foot increment of estimated potential annual water consumption. A partial schedule follows: 0 to 20,000 cu. ft. $2,860.43 impact fee 20,001 to 40,000 cu. ft. $5,720.86 impact fee 40,001 to 60,000 cu. ft. $8,581.30 impact fee 60,001 to 80,000 cu. ft. $11,441.71 impact fee Hydrant System Charges: Public Fire Hydrants: $312.10/Annual $78.03/Quarterly Private Fire Hydrants: $391.12/Annual $97.78/Quarterly Sprinkler & Fire Services: For each connection based upon size:

26
Size Annual Charge Quarterly Charge <1.5” $ 133.09 $ 33.27 1.5” $ 143.73 $ 35.93
2” $ 214.01 $ 53.50 3” $ 320.99 $ 80.25 4” $ 427.98 $ 106.84 6” $ 854.72 $ 213.68 8” $1,709.49 $ 427.37 10” $2,564.20 $ 641.05 12” $3,418.98 $ 854.75 Billing: Bills are prepared quarterly. All bills are payable within 30 days of billing. Interest on any unpaid balances will be assessed at a rate of 12% per annum beginning with the date of the original invoice. Shut-off Fees: There will be a “turn-off/turn-on” fee of $50.00 charged to the customer for nonpayment of water service other than in an emergency situation
FEES FOR SERVICES RENDERED
Current hourly rate: plus 50% markup Materials: @ Cost plus 50% markup Trench inspection: $25 per site visit Tapping service line: $75 per tap + hourly rate Temporary meter installation and water service: hourly rate + distribution charge + turn-on/turn-off fee + estimate of water consumption in advance Damaged meter/remote reader: Materials replacement @ cost + hourly rate SEASONAL: Turn-off/turn-on fee $50 each site visit Frozen meter: Turn-off/turn-on + hourly rate MID-CYCLE WATER-METER READING: Property Closing: $25 per site visit Change in Tenant: $25 per site visit BACKFLOW TESTING: $50 per device test. Bounced Check Fee: $25.00 per item

27
Attachment #4
December 2019
P & L YTD Budget
4100 · Operating Income 4101 · Water sales 365,890.18 315,000.00
4102 · Distribution charges 325,420.19 329,000.00 4103 · Interest on water sales 980.61 1,500.00 4104 · Interest from investments 1,600.05
4105 · Sales tax 3,279.53 3,300.00 4106 · Hydrant/sprinkler charge(#6227) 60,870.03 62,000.00 4107 · State surcharge 31,221.47 20,000.00 4108 · Miscellaneous 1,498.10 2,000.00 4109 · Capital Charge (#6226) 53,461.01 53,000.00 4110 · Infrastructure Charge (#6225) 53,273.10 53,000.00
Total 4100 · Operating Income 897,494.27 838,800.00
6200 · Operating Expense 6201 · Salaries 297,944.51 302,800.00
6202 · Payroll taxes (FICA - Employer) 22,792.75 23,200.00 6203 · Retirement 25,739.60 27,300.00 6205 · Health insurance 27,388.47 27,000.00 6206 · Rent (wells), Condo Fees 3,700.00 5,000.00 6207 · Office expense 33,881.37 39,000.00 6208 · Communications 11,371.00 13,000.00 6209 · Insurance 34,855.50 35,500.00 6210 · Legal and accounting 12,861.28 14,300.00 6211 · Water testing 5,004.29 8,000.00 6212 · Training, Dues, Subscriptions 4,728.00 5,000.00 6213 · Energy 56,625.70 68,000.00 6214 · New equipment 284.14 5,000.00 6215 · Meters and hydrants 25,565.53 20,000.00 6216 · Materials and supplies 18,633.18 15,300.00 6217 · Lime 7,287.50 9,200.00 6218 · Sales tax 3,277.56 3,300.00 6219 · Contract labor 22,340.76 31,300.00 6220 · Survey and engineering 1,239.50 4,000.00 6221 · Gasoline and truck repairs 5,524.21 6,600.00 6224 · State surcharge 28,723.06 20,000.00 6225 · Reserve-Infra Replacement (#4402) 53,273.10 53,000.00 6226 · Transfer to Capital (Line#4305) 53,461.01 53,000.00 6227 · Transfer to Capital(Line #4305) 50,000.00 50,000.00 6232 · Payroll Expenses 309.00 0.00
Total 6200 · Operating Expense 806,811.02 838,800.00
Net income (loss) from Operations 90,683.25 0.00
4300 · Capital Reserves Income 4302 · Impact fee (new accounts) 8,413.02 0.00

28
4303 · Interest from Investments 3,040.76 0.00 4305 · Transfer Op. 6226,6227 103,461.01 103,000.00
Total 4300 · Capital Reserves Income 114,914.79 103,000.00
6300 · Capital Reserves Expense 6310 · Other Projects (well #4) 42,874.95 50,000.00 Total 6300 · Capital Reserves Expense 42,874.95 50,000.00
Net income (loss) from Capital Reserves 72,039.84 53,000.00
4400 · Infrastructure Reserves 4402 · Transfer Op. #6225 53,273.10 53,000.00
4403 · Interest 6,262.05 300.00 4405 · Rental income-Tower #1 & #2 126,966.76 126,000.00
Total 4400 · Infrastructure Reserves 186,501.91 179,300.00
6400 · Infrastructure Reserves Expense 6408 · Service & Mains 22,758.04 15,000.00
6409 · Well Replacement 0.00 25,000.00 6410 · Other Vehicles, equipment 0.00 5,000.00 6411 · Loan Payments - RICWFA #1 (P&I) 29,850.40 30,100.00 6415 · SCADA/AMI 4,320.00 10,000.00
Total 6400 · Infrastructure Reserves Expense 56,928.44 85,100.00
Net income (loss) from Infrastructure Reserves 129,573.47 94,200.00
Net income (loss) from Operations & Reserves (cash basis) 292,296.56 147,200.00

29
Attachment #5
Section 6: Non Billed and Non Metered Water Use Estimates Non Billed Use Total FY Water Use Gallons Fire Fighting Allowance 200000 Main Flushing/System Maintenance 2872728 Storm Drain Flushing Sewer Cleaning Street Cleaning Schools and Other Public Buildings 260000 Landscaping in Public Areas Swimming Pools Construction Sites Water Quality and Other Testing Process Water at Treatment Plants 640000 Leakage Theft, meter error Other Non-Billed Water Total 3972728 Total Water Produced and Purchased 131786559 Total Water Sold and Billed 122653872 Total Non-Billed 3972728 Total Non-Metered 5159959 Percent Non Metered 3.9

30