
Russells green, Coombe Hill Road, Kingston Upon Thames, Surrey

ANNUAL PERFORMANCE ASSESSMENT
Version 2 - Final
Produced September 2008
DATASET
Kingston Upon Hull

APA dataset guidance notes
Traffic Lights and bandings
Please contact the team at [email protected] if you have any queries.
Introduction
This is the final version of the 2008 APA tookit, covering the reporting period of April 2007 to March 2008. The report includes updated information on all indicators where data had been available at the time of publication and matches the reporting period where possible. For convenience both the indicators updated from last year's APA toolkit and since the first version in April 2008 are highlighted on the contents page. This includes the unplanned revisions listed in the changes section below. The social care data covers the period 2007-08 and the attainment results relate to the 2006/07 academic year. .Changes from the April 2008 APA dataset. 3013OF /3104OF /5003OF /5004OF - For these indicators the data shown was correct, however, in some cases the traffic light bandings may have been incorrectly applied.1032OF - The final two columns titled 'current progress' have been removed in line with the Departmentof Health's guidelines.5041DE, 5042DE and 5044DE - The figures for 19 year olds not in education, employment or training (NEET) have been removed following DCSF guidance.5007OF - Data was transposed in some columns and this has now been amended. 2067SC - Issues have arisen with this indicator but the source data remains the same. A detailed explanation of this can be seen in the guidance notes on the indicator page.6010SC and 6024SC - Data activity on unaccompanied asylum seekers continues to be excluded.6016SC - Values of 0 (nil) were changed to "." (not applicable) for some LAs in the years prior to 2007-08. England averages for all years have increased as a result. The SN values for some LAs may also have increased as a result.For the 07-08 indicators that include ONS population data, the 2007 figures have been used so there will be no further updates to these indicators.
Statistical Neighbours . Statistical neighbour groups help to benchmark local authorities’ performance, and provide an initial guide as to whether it is above or below the level that might be expected. The NFER's Children's Services statistical neighbour groups were published in February 2007 and first used in the APA last year. They are designed to be used across all children's services data and are used on the majority of indicators in this dataset; key exceptions being indicators from the Healthcare Commission, Youth Justice Board and HMI Probation, where data may not be at local authority level. Please refer to appendices 1, 2 and 3.
On a number of indicators, traffic lights are used to highlight strong or poor performance. For data on educational attainment and absences the traffic lights show differences between the authority and its statistical neighbours, as well as between the authority and the national figure. For this reason the shading is applied to the neighbours’ and national figures rather than the figures for the authority itself. On social care Performance Assessment Framework indicators, shading is applied to the local authority, neighbours and national figures, as the bandings are based on cut-off points, not relative position. Please refer to individual indicators and contact the relevant inspectorate for further information if required.

Universal Code
Index Page No.
Updated from 2007 APA?
Updated from APA 2008 Version 1?
Notes
SECTION 1 – BEING HEALTHYBH01 Healthy lifestyle and preventative care data 9
1003HC Proportion of mothers initiating breast feeding 10 y
1047SC Percentage change from base year (1998) in number of conceptions among 15-17-year olds (BVPI 197)
12 y
1032OF Percentage of schools participating and achieving the National Healthy Schools Status 14 y y
BH02 Physical health data 15
1015HC Infant mortality rate (deaths per 1,000 live births) 16 y
BH03 Mental health data 17
1029HC Substance misuse related admissions to hospital, ages under 20 18 y
1030HC Percentage of Child and Adolescent Mental Health Service new cases with length of wait under four weeks and under 26 weeks
19 y
1043SC PAF CF/A70: councils’ self assessment of progress on four elements of the implementation of the Child and Adolescent Mental Health Service framework
20 y
1040NT Proportion of those in substance misuse treatment who are aged under 18 23 y
BH04 Looked after children and care leavers data 25
1037SC PAF CF/C19: the average of the percentages of children looked after who had been looked after continuously for at least 12 months, and who had their teeth checked by a dentist during the previous 12 months, and had an annual health assessment during the previous 12 months
26 y

Universal Code
SECTION 2 – STAYING SAFE Page No.
Updated from 2007 APA?
Updated from APA 2008 Version 1?
Notes
SS01 Environmental and other safety data 28
2001DT Number of children aged 0-15 killed or seriously injured in road traffic accidents 29 y
SS03 Child protection data – child protection procedures 31
2015SC KIGS CH141: number of referrals of children per 10,000 population 32 y
2016SC KIGS CH142: percentage of referrals that are repeat referrals within 12 months 34 y
2017SC KIGS CH143: percentage of referrals of children in need that led to initial assessments 35 y
2019SC KIGS CH02: initial child protection conferences per 10,000 population aged under 18 36 y
2020SC Percentage of initial assessments within seven working days of referral 37 y
2021SC KIGS CH145: number of core assessments of children in need per 10,000 population aged under 18 38 y
2022SC PAF CF/C64: percentage of core assessments that were completed within 35 working days of their commencement
39 y
2023SC KIGS CH01: children and young people who are the subject of a child protection plan, or on the child protection register, per 10,000 population aged under 18
41 y
2024SC Percentage of children and young people who are the subject of a child protection plan, or on the child protection register, who are not allocated to a social worker
42 y
2027SC KIGS CH03: children who became the subject of a child protection plan, or were registered, per 10,000 population aged under 18
44 y
2028SC PAF CF/A3: percentage of children who became the subject of a child protection plan, or were registered during the year, who had previously been the subject of a child protection plan or had been registered
45 y
2066SC Ethnicity of children who are the subject of a child protection plan (white, mixed ethnic origin, Asian or Asian British, and Black or Black British)
47 y
2034SC PAF CF/C20: percentage of child protection cases which should have been reviewed during the year that were reviewed (BVPI 162)
49 y
2035SC KIGS CH10: children whose child protection plans were discontinued, or were de-registered, per 10,000 population aged under 18
51 y
2036SC PAF CF/C21: percentage of children who ceased to be the subject of a child protection plan, or were de-registered, during the year ending 31 March, who had been registered, or the subject of a child protection plan, continuously for two years or more
52 y
SS06 Looked after children and care leavers data 54
2042SC KIGS CH39: children looked after per 10,000 population aged under 18 55 y
2064SC PAF CF/C68: percentage of looked after children cases which should have been reviewed during the year that were reviewed on time during the year
57 y
2043SC PAF CF/A1: percentage of looked after children at 31 March with three or more placements during the year (BVPI 49)
59 y
2067SC PAF CF/D78: percentage of children aged under 16 at March 31 who had been looked after continuously for at least 2 1/2 years, who had lived in the same placement for at least two years, or were placed for adoption
61 y
2052SC KIGS CH44: percentage of looked after children in residential accommodation 62 y
2054SC Percentage of looked after children fostered by relatives or friends 63 y
2068SC PAF CF/B79: percentage of children aged at least 10 and under 16 looked after at 31 March (excluding those placed with parents) who were in foster placements or placed for adoption
64 y
2058SC Percentage of looked after children adopted during the year who were placed for adoption within 12 months of the agency deciding that the child should be placed for adoption
66 y
2059SC PAF CF/C23: number of looked after children adopted during the year as a percentage of the number of looked after children at 31 March (excluding unaccompanied asylum seekers) who had been looked after for six months or more on that day (BVPI 163)
67 y
2060SC Percentage of looked after children with a named social worker who is qualified as a social worker 69 y
SS07 Children with learning difficulties and/or disabilities data 71
5026SC What percentage of children with disabilities aged 14+ had a transition plan to support their move from Children's Services to Adult Services?
72 y

Universal Code
SECTION 3 - ENJOYING AND ACHIEVING Page No.
Updated from 2007 APA?
Updated from APA 2008 Version 1?
Notes
EA13 Early Years and Foundation Stage 73
3102DE Improvement in young children's development measured by the foundation stage profile 74 y
EA01 Key Stage 1 data 75
3002OF Teacher assessment results on reading: achievement at KS1, level 2+ (all pupils) 76 y
3003OF Teacher assessment results on writing: achievement at KS1, level 2+ (all pupils) 77 y
3004OF Teacher assessment results on mathematics: achievement at KS1, level 2+ (all pupils) 78 y
EA02 Key Stage 2 data 79
3005OF Test results on English: achievement at KS2, level 4+ and Average Point Scores (all pupils) 80 y
3006OF Test results on mathematics: achievement at KS2, level 4+ and Average Point Scores (all pupils) 81 y
3007OF Test results on science: achievement at KS2, level 4+ and Average Point Scores (all pupils) 82 y
3008OF Contextual Value Added measure KS1 to KS2 83 y
EA03 Key Stage 3 data 84
3009OF Test results on English: achievement at KS3, level 5+ and Average Point Scores (all pupils) 85 y
3010OF Test results on mathematics: achievement at KS3, level 5+ and Average Point Scores (all pupils) 86 y
3011OF Test results on science: achievement at KS3, level 5+ and Average Point Scores (all pupils) 87 y
3012OF Contextual Value Added measure KS2 to KS3 88 y
EA04 GCSE/Equivalents data 89
3013OF Percentage achieving 5+ A*-C (all pupils) 90 y y
3104OF Percentage achieving 5+ A*- C (all pupils) - including English and Mathematics 90 y y
3105OF Contextual Value Added measure KS2 to GCSE/equivalents 91 y
3018OF Contextual Value Added measure KS3 to GCSE/equivalents 92 y
3061DE Percentage of schools not attaining KS4 floor targets 93 y
EA05 School Inspection findings 94
3087OF Percentage of schools requiring special measures since September 2005 95 y y
3088OF Percentage of schools requiring a 'Notice To Improve' since September 2005 96 y y
EA06 Attendance data 97
3034OF Attendance at primary schools 98 y
3035OF Attendance at secondary schools 99 y
EA07 Exclusions data 100
3091DE Percentage of fixed term and permanent exclusions in relation to the number of pupils in primary phase
101 y
3092DE Percentage of fixed term and permanent exclusions in relation to the number of pupils in secondary phase
102 y
EA08 Education otherwise than at school data 103
3067AC BVPI 159a, 159b, 159c and 159d - percentage of permanently excluded pupils provided with alternative tuition
104
EA11 Looked after children and care leavers data 105
3085SC PAF CF/C69: percentage of children newly looked after in the year, and still looked after at 31 March, who were placed at 31 March more than 20 miles from their home address from which first placed
106 y
3071SC Percentage of looked after children who were pupils in year 11 and eligible for GCSE (or equivalent) examinations who sat at least one GCSE or equivalent examination
108 y
3072SC PAF CF/A2: percentage of young people leaving care aged 16 or over with at least one GCSE at grade A*-G or a GNVQ (BVPI 50)
110 y
3073SC Percentage of young people leaving care aged 16 or over with five or more GCSEs at grade A*- C or GNVQs equivalent to grades A*- C
112 y
3074SC PAF CF/C24: percentage of children who had been looked after continuously for at least 12 months and were of school age, who missed a total of at least 25 days of schooling for any reason during the previous school year
114 y
EA12 Children with learning difficulties and/or disabilities data 116
3106DE Percentage of fixed term exclusions for pupils with statements in mainstream schools (broken down into Primary and Secondary phase)
117 y y
3095DE Percentage of pupils with a statement of special educational needs (SEN) 118 y
3063DE DCSF SEN2 – number of new statements of special educational needs (SEN) 119 y
3070AC Audit Commission BVPI – percentage of new statements of special educational needs prepared within 18 weeks
120 y
3097DE Percentage of permanent exclusions in relation to the number of pupils in special schools 121 y
3099DE Percentage of fixed period exclusions of one day or more in relation to the number of pupils in special schools
122 y

Universal Code
SECTION 4 – MAKING A POSITIVE CONTRIBUTION Page No.
Updated from 2007 APA?
Updated from APA 2008 Version 1?
Notes
MPC01 Youth offending information 123
2061YJ Recidivism - the rate of re-offending 124 y
2062YJ Number of first timers in the youth justice system 125 y y
3080YJ The proportion of supervised juveniles in full time education, training and employment 126 y y
MPC02 Participation and other activity information 127
4021OF Contact - percentage of young people aged 13-19 reached by publicly funded youth services 128 y
4022OF Ratio of full-time equivalent youth workers to young people aged 13-19 129 y
MPC04 Looked after children and care leavers data 130
4015SC PAF CF/C18: percentage of children aged 10 or over who had been looked after continuously for at least 12 months, who were given a final warning/reprimand or convicted during the year for an offence committed while they were looked after, expressed as a ratio of the percentage of all children aged 10 or over given a final warning/reprimand or convicted for an offence in the police force area
131 y
4016SC PAF CF/C63: number of children and young people who communicated their views specifically for each of their statutory reviews as a percentage of the number of children and young people who had been looked after at 31 March for more than four weeks
133 y

Universal Code
SECTION 5 – ACHIEVING ECONOMIC WELL-BEING Page No.
Updated from 2007 APA?
Updated from APA 2008 Version 1?
Notes
AEWB01 Post 16 education and training data 135
5038LS Percentage of young people by local authority/district achieving level 2 and level 3 by age 19 136 y
5003OF Schools with sixth forms: average point scores of students entered for GCE/VCE A/AS 137 y y
5007OF Further education institutions/sixth form colleges/specialist colleges/work-based learning providers: success rate by level
138 y y
5039AL NVQ success rate for all work-based learners living in the area and aged under 19 at the start of their programme (split by learning programme, gender, ethnicity and disability)
140 y
3079AL Personal characteristics of work-based learners living in the area and aged under 19 (gender ethnicity and disability)
142 y
5048DE Increase in the number of young people completing an apprenticeship 143
AEWB02 Inspection findings 144
5040OF Changes in childcare providers and places (since April 2005 benchmark) 145 y y
5029OF College inspection judgement (2005 framework): how far programmes or the curriculum meet external requirements, and are responsive to local circumstances (KQ 3B)
147 y y
AEWB03 Employment and NEET data 148
5041DE Connexions Partnership data: number and proportion of 16-18-year-olds not in education, employment or training (NEET)
149 y
5047DE Connexions Partnership data: increase in participation rates of 17-year-olds in education and training 150 y
5042DE Connexions Partnership data: proportion of 16-18-year-olds whose current activity is not known 151 y
5044DE Connexions Partnership data: 16-18-year-olds leaving the NEET group to re-engage in employment, education or training
152 y
5045DE Connexions Partnership data: young people at particular risk of becoming NEET 153 y
5046DE Connexions Partnership data: proportion of young people completing year 11 who continue in learning 155 y
AEWB07 Looked after children and care leavers data 156
5022SC PAF CF/A4: ratio of the percentage of those young people who were looked after on 1 April in their 17th year (aged 16), who were engaged in education, training or employment at the age of 19 to the percentage of all young people in the population who were engaged in education, training or employment at the age of 19 (BVPI 161)
157 y
2038SC Percentage of eligible, relevant and former relevant children who have pathway plans, have been allocated a personal adviser and are resident outside the council's boundaries
159 y
5037SC Percentage of care leavers at age 19 who are living in suitable accommodation (as judged by the council)
161 y

Universal Code
SECTION 6 – SERVICE MANAGEMENT Page No.
Updated from 2007 APA?
Updated from APA 2008 Version 1?
Notes
SM01 Social care 162
6006SC KIGS EX61: gross expenditure on services to children per capita aged under 18 163 y
6009SC KIGS EX77: expenditure on family support services per capita aged under 18 164 y
6010SC PAF CF/E44: gross expenditure on children in need but not looked after, as a percentage of gross expenditure on all children’s services
165 y
6022SC KIGS EX62: gross expenditure on looked after children per capita aged under 18 167 y
6024SC PAF CF/B8: average gross weekly expenditure per looked after child in foster care or in a children’s home
168 y
EA09 School places and admissions data 170
3089DE Percentage of primary schools with 25% or more surplus places 171 y
3090DE Percentage of secondary schools with 25% or more surplus places 172 y
SM03 Staffing and related data - Recruitment & retention 173
6012SC Percentage of social care staff directly employed posts for children and families vacant on 30 September
174
6016SC Percentage of residential child care workers who have achieved the NVQ at level 3 in 'Caring for Children and Young People'
175
6049DE Percentage of unfilled full time vacancies in relation to number of full time equivalent teachers employed as at January
176 y
Universal Code
Appendices Page No.
Updated from 2007 APA?
Updated from APA 2008 Version 1?
Notes
APP01 Statistical Neighbours 177
7001OF List of NFER statistical neighbours for Kingston Upon Hull 178
Map Showing the position of the local authority and its statistical neighbours 179
7002OF List of Youth Justice Board statistical neighbours for Kingston Upon Hull 181
7003OF List of ACA statistical neighbours for Kingston Upon Hull (used for social care indicator 6024SC) 182
7004OF List of Government Office Regions Local Authorities for Kingston Upon Hull (used for 1032OF) 183

BEING HEALTHYHealthy lifestyle and preventative care data

(Page 1 of 2)
BEING HEALTHY 1003HC
Healthy lifestyle and preventative care data
EASTERN HULL PCT
2005/06 624 1521 41.0% 46.3% - 68.9% -
2004/05 612 1526 40.1% 43.5% - 66.6% -
2003/04 630 1430 44.1% 41.8% - 64.6% -
HULL PCT2006/07 1780 3538 50.3% 68.3% - 69.6% -
WEST HULL PCT
2005/06 869 1682 51.7% 66.3% - 68.9% -
2004/05 853 1724 49.5% 65.3% - 66.6% -
2003/04 910 1547 58.8% 63.5% - 64.6% -
Proportion of mothers initiating breastfeeding
Indicator Description: The numerator is the number of mothers known to have initiated breastfeeding. The denominator is the number of deliveries for which the breastfeeding status of the mother was known (not the total number of maternities). NB. Please note that PCTs were reconfigured in October 2006. For current PCT names please see the Healthcare Commission APA briefing.
Guidance & Interpretation: High is good. Breastfeeding, especially in the first six months, is generally accepted to have health benefits for the child. A low percentage of mothers breastfeeding could prompt questions surrounding the PCT’s health promotion schemes. This data was collected for the first time in 2003/04 and the breastfeeding status of new mothers was only recorded in 87% of maternities, rising to 93% in 2004/05in 2005/06 the figure was 93% although in some PCTs this % was much lower. Recognising the data quality/coverage issues, the Healthcare Commission PI measured the % for which breastfeeding status was recorded, rather than the % breastfeeding. In future a higher percentage of data is expected to be available which should make this indicator more reliable.
Judgment basis: Judgment basis: green = significantly high rate with 95% confidenceamber = within the expected range of variation with 95% confidencered = significantly low rate with 95% confidence. NB Confidence intervals are not shown as the calculation uses an additive over-dispersion model which replaces a single target value with a distribution representing acceptable variability. If the observed indicator is inside the tolerance range, then it cannot be declared significantly different. If it is just outside and there is some overlap with its confidence interval, then it still may be OK. But if there is no overlap, or only minimal overlap, it will be declared significantly different (this assessment is based on a formula and does not correspond exactly to whether the intervals overlap or not) . This means that Cl alone might suggest a significant difference where one is not present.
Proportion of mothers initiating breastfeeding
Proportion of mothers initiating breastfeeding
Time Period: 1 April to 31 March
Proportion of mothers initiating breast feeding
numerator denominator Benchmark Group Average
significant difference vs
benchmark grp?indicator value England average
significant difference vs
England?
Proportion of mothers initiating breastfeeding
20%
30%
40%
50%
60%
70%
80%
90%
100%
2005/062004/052003/04
EnglandAverage
EASTERNHULL PCT
HULL PCT
WEST HULLPCT

(Page 2 of 2)
BEING HEALTHY 1003HC
Healthy lifestyle and preventative care data
Proportion of mothers initiating breast feeding
Owner: Healthcare Commission
If you have any queries concerning this data please contact [email protected]
Data Source: Selective data submitted for the "infant health" PCT PI: http://ratings2005.healthcarecommission.org.uk/more_information.asp

Being healthyHealthy lifestyle and preventative care data
Kingston Upon Hull
Number of conceptions amongst 15-17-year-olds per 1,000 population
. = Data not applicable2000 2001 2002 2003 2004 2005 2006 .. = Data not available
LA 73 71 66 69 79 71 70 - = Data suppressed SN 54 56 54 55 55 57 54 due to small numbersEng 44 43 43 42 42 41 40
% change from base year (1998) in number of conceptions amongst 15 - 17 year olds
2000 2001 2002 2003 2004 2005 2006LA -13.4 -16.1 -22.5 -18.1 -6.5 -15.9 -17.5SN -11.4 -9.8 -12.6 -9.0 -10.5 -5.4 -12.6Eng -6.4 -8.6 -8.0 -9.5 -10.3 -11.6 -13.3
Continued on following page
1047SC - Percentage change from base year (1998) in number of conceptions amongst 15-17-year-olds (BVPI 197)
Part two: Percentage change in number of conceptions amongst 15-17 year olds
Part one: Number of conceptions among girls aged under 18 resident in an area per 1,000 girls aged 15-17 years resident in the area.
Total female population aged 15-17 years in council area[Source - ONS mid year estimates]
DenominatorNumber of conceptions among girls aged under 18Numerator
Part 2 - positive or negative percentage to one decimal place
Numerator
Data definition
Part 1 - rate per 1,000 as a whole number
Traffic lights have not been applied to this indicator
Calculation for part 2 = (Numerator - denominator) / denominator x 100 [Source - Teenage Pregnancy Unit]N.B. 2006 Teenage Pregnancy Data is provisional.
The actual number of conceptions among girls aged under 18 resident in the authority area per 1,000 girls aged 15-17 years resident in the area for the calendar year.DenominatorThe actual number of conceptions among girls aged under 18 resident in the authority area per 1,000 girls aged 15-17 years resident in the area in 1998 (baseline year)
Measuring unit
% change from base year (1998) in number of conceptions amongst 15 - 17 year olds
-25
-20
-15
-10
-5
02000 2001 2002 2003 2004 2005 2006
%
LA
SN
Eng
Number of conceptions amongst 15-17-year-olds per 1,000 population
0
10
20
30
40
50
60
70
80
90
2000 2001 2002 2003 2004 2005 2006
%
LA
SN
Eng
[If you have any queries about this indicator please contact: [email protected] and quote ref: 1047SC]

Being healthyHealthy lifestyle and preventative care data
Kingston Upon Hull
1047SC - Percentage change from base year (1998) in number of conceptions amongst 15-17-year-olds (BVPI 197)
Guidance/interpretation
Data on teenage conceptions is available on a calendar year basis and ONS publish this data in February each year, 14 months after the year to which they relate. Therefore the indicator presented in the 2006/07 BVPI set will be the data published in February 2007 relating to calendar year 2005. The National Teenage Pregnancy Strategy outlines the National target to halve the under-18 conception rate in England by 2010 (with an interim target of 15% by 2004 included in the NHS Plan).
Progress in reducing conception rates amongst 15-17 year olds against the 1998 baseline would be represented by a negative figure in the percentage change in number of conceptions amongst 15-17 year olds. A positive figure would suggest that the conception rate has increased. Continued improvement would show a negative figure getting increasingly larger whilst fluctuations in this figure year on year may suggest that strategies to reduce conceptions in 15-17 year olds may be ineffective. This data should be looked at alongside the rate of conceptions per 1,000 population of 15-17 year olds.
[If you have any queries about this indicator please contact: [email protected] and quote ref: 1047SC]

BEING HEALTHYHealthy lifestyle and preventative care data
Kingston Upon Hull
Number of schools participating
Percentage participating
Schools achieved NHSS by 25th April 2008
Current progress: schools achieving NHSS as percentage of LA target (C)
Current progress: schools achieving NHSS as percentage of December 2007 national target of 55% (D)
LA 97 83 86% 59 116% 61%
Government Office Region: Yorkshire
& Humberside2,304 2,163 94% 1,460 98% 63%
SN 839 802 96% 543 n/a n/a
NAT 22,040 20,586 93% 13,283 .. 60%
School numbers excludes nurseries and independents
..= data not avaliable
Health Warning: School numbers were provided by the DoH and may not be the same as those published by Ofsted or used in other indicators in this dataset. Schools are not obliged to join the National Healthy Schools Programme. However, involvement in the National Healthy Schools Programme and achievement of National Healthy School Status, is an illustration that the school is attempting to improve the health outcomes for its children. Under the new Local Government Act the current progress of schools achieving Healthy School Status (HSS) is no longer a requirement for Local Authorities.
Percentage of schools participating and achieving the National Healthy Schools Status
Data Definition: The National Healthy Schools Programme is a joint initiative between the Department of Health (DoH) and the Department for Children, Schools and Families (DCSF). It originated in 1997 out of the White Paper Excellence in Schools. In 2004 the programme was revised as a result of the White Paper Choosing Health as there was a need to ensure consistency across the country. There are now four themes-Personal, Social and Health Education (PSHE), Physical Activity, Healthy Eating and Emotional Health and Wellbeing (EHWB). Each theme has its own criteria that schools have to meet to achieve National Healthy Schools Status (NHSS). Schools need to meet the criteria through the Whole School Approach (WSA) which is at the core of the NHSP. There are ten elements to the WSA and a process that schools need to employ while participating in the NHSP. Schools now Self-Validate and 10 per cent of all schools who Self-Validate go through moderation. The NHSP has four aims which are to support children and young people in developing healthy behaviours, help raise the achievement of children and young people, reduce health inequalities and promote social inclusion. Further information can be found at http://www.healthyschools.gov.uk/ . Data is a 'snap shot' of participation and achievement as of 25th April 2008.
From April 2008 the DoH National Healthy Schools Standard RAG Ratings no longer apply. [Source: DoH National Healthy Schools Standard RAG ratings]
Number of Primary and Secondary maintained schools
School participation rates School achievement rates
Data contact: Ade Alao (0207 972 4845) [email protected] Please quote ref: 1032OF

BEING HEALTHYPhysical health data

(Page 1 of 1)
BEING HEALTHY 1015HC
Physical health data
Kingston upon Hull UA2004-06 53 9915 5.3 5.5 - 5.0 -
2003-05 46 9388 4.9 5.3 - 5.1 -
2002-04 43 8958 4.8 5.3 - 5.2 -
2001-03 43 8600 5.0 5.5 - 5.4 -
2000-02 45 8491 5.3 5.9 - 5.4 -
1999-2001 50 8772 5.7 6.1 - 5.6 -
Owner: Healthcare Commission
If you have any queries concerning this data please contact [email protected]
Data Source: Compendium of Clinical and Health Indicators / Clinical and Health Outcomes Knowledge Base (nww.nchod.nhs.uk) based on National Statistics Code DA04N© Crown Copyright
Indicator Description: This indicator displays deaths of infants aged less than 1 year per 1000 live births occurring in the respective calendar year(s).
Guidance & Interpretation: Low is good. High rates may indicate problems such as deprivation, although other factors may also affect rates such as prevalence of low birth weight, age of mother, marital status and ethnicity. These factors are likely to be interlinked. High rates would warrant further investigation. These data are pooled over 3 years because of small numbers issues.
Judgment basis: Judgment basis: green = significantly low rate with 95% confidenceamber = within the expected range of variation with 95% confidencered = significantly high rate with 95% confidence. NB Confidence intervals are not shown as the calculation uses an additive over-dispersion model which replaces a single target value with a distribution representing acceptable variability. If the observed indicator is inside the tolerance range, then it cannot be declared significantly different. If it is just outside and there is some overlap with its confidence interval, then it still may be OK. But if there is no overlap, or only minimal overlap, it will be declared significantly different (this assessment is based on a formula and does not correspond exactly to whether the intervals overlap or not) . This means that Cl alone might suggest a significant difference where one is not present.
Time Period: Deaths registered during the 3 calendar years, eg from 01/01/1999 to 31/12/2001, divided by live births during the same period
Infant mortality rate (deaths per 1,000 live births)
numerator denominator Benchmark Group Average
significant difference vs
benchmark grp?
indicator value per 1,000 England average
significant difference vs
England?
Infant mortality, deaths per 1000 live births - infant under one year
Infant mortality, deaths per 1000 live births - infant under one year
0123456789
10
2004-062003-052002-042001-032000-021999-2001
EnglandAverage
Kingston uponHull UA

BEING HEALTHYMental health data

BEING HEALTHY 1029HC
Mental health data
Kingston upon Hull UA2004-07 204 93 220.2 183.8 - 100.5 -
2003-06 218 89 244.2 177.3 - 100.7 signif high
2002-05 196 80 244.7 176.1 - 101.0 signif high
2001-04 212 77 277.0 176.7 - 101.3 signif high
2004-07 42 19 221.2 211.5 - 126.9 -
2003-06 39 19 209.0 204.4 - 131.7 -
2002-05 37 18 211.3 204.7 - 133.6 -
2001-04 26 18 147.4 211.7 - 137.3 -
Owner: Healthcare Commission
If you have any queries concerning this data please contact [email protected]
Judgment basis: Judgment basis: green = significantly low rate with 95% confidenceamber = within the expected range of variation with 95% confidencered = significantly high rate with 95% confidence. NB Confidence intervals are not shown as the calculation uses an additive over-dispersion model which replaces a single target value with a distribution representing acceptable variability. If the observed indicator is inside the tolerance range, then it cannot be declared significantly different. If it is just outside and there is some overlap with its confidence interval, then it still may be OK. But if there is no overlap, or only minimal overlap, it will be declared significantly different (this assessment is based on a formula and does not correspond exactly to whether the intervals overlap or not) . This means that Cl alone might suggest a significant difference where one is not present.
Data Source: Healthcare Commission analysis of Hospital Episode Statistics 2001/02 - 2003/04 and 2002/03 - 2004/05 -2005/06 - 2006/07 and ONS population data mid 2002 and mid 2003 and mid 2004
Substance misuse related admissions to hospital, ages under 20s
number expected Benchmark Group Average
significant difference vs
benchmark grp?indicator value England average
significant difference vs
England?
Time Period: Hospital admissions between 1 April and 31 March. Data are pooled over 3 years because of small numbers issues.
Indicator Description: The indicator value is the standardised admission ratio - the number of hospital admission first finished consultant episodes (FFCEs) with the specified diagnosis code of patients aged under 20 resident in the local authority area, divided by the "expected" number of admissions, expressed as a percentage (ie England = 100). The expected number of admissions is calculated by multiplying the national rates of admissions for each age group (0, 1-4, 5-9, 10-14 and 15-19) and sex by the mid 2002 population of the LA within each of these age/sex groups. The specified diagnosis codes for mental and behavioural disorders are F10 to F19 inclusive, which include use of alcohol, opioids, cannabinoids, cocaine, solvents etc. The diagnosis codes for poisoning are T40 including opioids, cocaine and cannabis but not alcohol.
Guidance & Interpretation: Low is good. A low value indicates that drug misuse in the area is not leading to a high level of admissions to hospital - possibly due to there not being a major drug problem amongst children and young people in the area, and/or having good access to treatment/services that address problems short of hospital admission. High numbers could indicate poor access to preventative services or a high preponderance of drug use in the area. 2002-05 drug overdose/poisoning indicator values for 169 LAs have been suppressed due to being based on less than 5 admissions (also 9 LAs' data has been suppressed for mental disorders).
Admissions to hospital of under 20 year olds with mental and behavioural disorders due to substance misuse
Admissions to hospital of under 20 year olds with poisoning by narcotics and psychodysleptics

(Page 1 of 1)
BEING HEALTHY 1030HC
Mental health data
HULL AND EAST RIDING COMMUNITY HEALTH NHS TRUST2006 63 122 51.6% 39.8% -
2005 294 503 58.4% 51.2% -
2004 196 404 48.5% 48.8% -
2003 89 140 63.6% 47.5% -
2006 121 122 99.2% 89.7% -
2005 494 503 98.2% 94.4% -
2004 366 404 90.6% 91.8% -
2003 126 140 90.0% 91.4% -
2006 7 15 46.7% 56.2% -
2005 16 16 100.0% 62.8% high
2004 9 17 52.9% 66.5% -
2003 15 16 93.8% 55.2% high
2006 15 15 100.0% 94.2% high
2005 16 16 100.0% 97.0% high
2004 13 17 76.5% 97.5% low
2003 16 16 100.0% 94.2% high
Owner: Healthcare Commission
If you have any queries concerning this data please contact [email protected]
Proportion of Child and Adolescent Mental Health Service (CAMHS) new non-specialist cases with length of wait under 4 weeks
Data Source: All data taken from the CAMHS mapping atlas table 4.2: http://www.dur.ac.uk/camhs.mapping/index.php?page=atlas&a=19#s18
Indicator Description: The numerator is the number of cases waiting for under the specified amount of time. The denominator is the total number of cases waiting. Data is supplied separately for specialist and non-specialist cases at the 4 week and 26 week junctures. From 2005 data were reported for tier 2/3 and tier 4 cases instead of non-specialist cases and specialist cases
Guidance & Interpretation: High is good, indicating cases were seen within acceptable time frames. During the data collection period total caseload was broken down by time waited prior to treatment. The duration of the wait is the interval between the receipt of the referral request and the time the case is first seen. In the case of DNAs or cancellations, the wait is from the most recent DNA or cancellation.Non-specialist cases require clinics where clients come for meetings with staff or for group sessions, or individual home visits. Specialist cases require longer term or more intensive provision, which may take the form of whole- or half-day activities, in-patient care, or outreach support as an alternative to in-patient care. Data relates to the provider trust(s) mainly serving an area rather than all children from the LA area. In some cases the extent to which a provider serves children from the LA is not clear. Criteria triggering referral vary between LAs therefore cases may exist that have not been referred. From 2005 CAMHS groups were described as tier 2/3 and tier 4 instead of non-specialist and specialist
Judgment basis: green = more than 20% points above national average at 4 weeks, or 100% at 26 weeksamber = within 20% of averagered = more than 20% points below national average at 4 weeks or at 26 weeks
Proportion of Child and Adolescent Mental Health Service (CAMHS) new non-specialist cases with length of wait under 26 weeks
Proportion of Child and Adolescent Mental Health Service (CAMHS) new specialist cases with length of wait under 4 weeks.
Proportion of Child and Adolescent Mental Health Service (CAMHS) new specialist cases with length of wait under 26 weeks.
Time Period: For non-specialist cases, the data collection period was 1st of November to 30th November 2003 and 2004. For special care teams, the data collection period was 1st of April to 30th September 2003 and 1st June to 30th November 2004.
Percentage of Child and Adolescent Mental Health Service (CAMHS) new cases with length of wait under 4 weeks and under 26 weeks
numerator denominator indicator value England average difference vs England?

Being healthyMental health data
Kingston Upon Hull
Progress made towards a comprehensive Child and Adolescent Mental Health Service
2005-06 2006-07 2007-08 Data is not banded for 2005-06LA 11 14 16 .. = Data not availableSN 12 13 13Eng 12 13 14
Bands Low High
2006-08 4,5 6-8 9-11 12-14 15,16
Possible responses:
LA response:
As at 31 Jan 2006As at 31 Jan 2007As at 31 Jan 2008
Percentage of SN & England responses (LA's response is highlighted)
1 2 3 4 MissingSN - As at 31 Jan 2006 0.0 40.0 50.0 10.0 0.0SN - As at 31 Jan 2007 0.0 10.0 60.0 30.0 0.0SN - As at 31 Jan 2008 0.0 10.0 60.0 30.0 0.0
Eng - As at 31 Jan 2006 8.7 22.7 64.0 2.7 2.0Eng - As at 31 Jan 2007 0.0 6.0 68.7 25.3 0.0Eng - As at 31 Jan 2008 0.0 3.3 57.3 39.3 0.0 Continued on following page
4: Fully comprehensive service available, including protocols, whole area
1043SC - PAF CF/A70: Councils’ self assessment of progress on four elements of the implementation of the Child and Adolescent Mental Health Service framework
4: A fully comprehensive CAMH Service for children with learning disabilities and mental health needs is available, including fully implemented protocols between services and appropriately trained staff, covering the whole council area.
3: Protocols and plans are in place. Services in place/in development3: Protocols and plans are in place. Services in place/in development
1. Was a full range of CAMH services for children and young people with learning disabilities commissioned for your council area?
1: None of the above in place OR Strategic plans for the council area have yet to address the needs of children and young people with learning disabilities and mental health needs. 2: Plans and protocols for children and young people with learning disabilities and mental health needs are in place: services have yet to be put in place. 3: Plans and protocols for children and young people with learning disabilities and mental health needs are in place: some services are in place, some are still to be developed so as to provide cover across the whole council area.
1043SC - PAF CF/A70: Progress made towards a comprehensive CAMHS
0.0
2.0
4.0
6.0
8.0
10.0
12.0
14.0
16.0
18.0
2005-06 2006-07 2007-08
%
Unbanded
Very good
Good
Acceptable
Ask questions aboutperformanceInvestigate urgently
SN
Eng
[If you have any queries about this indicator please contact: [email protected] and quote ref: 1043SC]

Being healthyMental health data
Kingston Upon Hull
1043SC - PAF CF/A70: Councils’ self assessment of progress on four elements of the implementation of the Child and Adolescent Mental Health Service framework
Possible responses:
LA response:
As at 31 Jan 2006As at 31 Jan 2007As at 31 Jan 2008
Percentage of SN & England responses (LA's response is highlighted)
1 2 3 4 MissingSN - As at 31 Jan 2006 0.0 20.0 60.0 20.0 0.0SN - As at 31 Jan 2007 0.0 0.0 70.0 30.0 0.0SN - As at 31 Jan 2008 0.0 0.0 60.0 40.0 0.0
Eng - As at 31 Jan 2006 2.0 18.0 61.3 16.7 2.0Eng - As at 31 Jan 2007 0.0 4.7 54.7 40.7 0.0Eng - As at 31 Jan 2008 0.0 2.7 45.3 52.0 0.0
Possible responses:
LA response:
As at 31 Jan 2006As at 31 Jan 2007As at 31 Jan 2008
Percentage of SN & England responses (LA's response is highlighted)
1 2 3 4 MissingSN - As at 31 Jan 2006 0.0 20.0 40.0 40.0 0.0SN - As at 31 Jan 2007 0.0 0.0 30.0 70.0 0.0SN - As at 31 Jan 2008 0.0 0.0 40.0 60.0 0.0
Eng - As at 31 Jan 2006 3.3 10.7 47.3 36.7 2.0Eng - As at 31 Jan 2007 1.3 0.7 41.3 56.7 0.0Eng - As at 31 Jan 2008 0.0 1.3 33.3 65.3 0.0
Continued on following page
4: Fully comprehensive service available, including protocols, whole area
4: Protocols and plans are in place and fully implemented
3. Were arrangements in place for your council area to ensure that 24 hour cover is available to meet urgent mental health needs of children and young people and for a specialist mental health assessment to be undertaken within 24 hours or the next working day where indicated?
1: Strategic plans for the council area have yet to address the needs for 24 hour / 7 days per week access for emergencies and/or for specialist mental health assessment within 24 hours.2: Protocols and plans are in place: services have yet to be put in place.3: Protocols and plans are in place but are only partially implemented4: Protocols and plans are in place and are fully implemented.
3: Protocols and plans are in place, only partially implemented4: Protocols and plans are in place and fully implemented
2. Did 16 and 17 year olds from your council area who require mental health services have access to services appropriate to their age and level of maturity?
1: None of the above are in place OR Strategic plans for the council area have yet to address the needs of 16 and 17 year olds who require mental health services.2: Plans and protocols for 16 and 17 year olds who require mental health services are in place: services have yet to be put in place.3: Plans and protocols for 16 and 17 year olds who require mental health services are in place: some services are in place, some are still to be developed so as to provide cover across the whole council area.4: A fully comprehensive CAMH service for 16 and 17 year olds who require mental health services is available, including fully implemented protocols between services and appropriately trained staff, covering the whole council area.
3: Protocols and plans are in place. Services in place/in development3: Protocols and plans are in place. Services in place/in development
[If you have any queries about this indicator please contact: [email protected] and quote ref: 1043SC]

Being healthyMental health data
Kingston Upon Hull
1043SC - PAF CF/A70: Councils’ self assessment of progress on four elements of the implementation of the Child and Adolescent Mental Health Service framework
Possible responses:
LA response:
As at 31 Jan 2006As at 31 Jan 2007As at 31 Jan 2008
Percentage of SN & England responses (LA's response is highlighted)
1 2 3 4 MissingSN - As at 31 Jan 2006 0.0 50.0 20.0 30.0 0.0SN - As at 31 Jan 2007 0.0 30.0 20.0 50.0 0.0SN - As at 31 Jan 2008 10.0 20.0 30.0 40.0 0.0
Eng - As at 31 Jan 2006 1.3 30.7 42.7 23.3 2.0Eng - As at 31 Jan 2007 0.7 15.3 42.7 41.3 0.0Eng - As at 31 Jan 2008 1.3 7.3 38.7 52.7 0.0
4: Protocols and plans are in place: access fully operational4: Protocols and plans are in place: access fully operational
4. Were protocols in place for your council area for partnership working between agencies for children and young people with complex, persistent and severe behavioural and mental health needs?
1: No protocols or partnership services are in place for children and young people with complex, persistent and severe behavioural and mental health needs.2: Protocols and plans at an early stage of development: agreed access arrangements are not yet operating.3: Protocols and plans are in place: access arrangements are operating but not across the whole council area.
2: Protocols/plans in early development: agreed access not operational
4: Protocols and plans are in place: access arrangements for services are fully operational.
Data definition
4. Were protocols in place for your council area for partnership working between agencies for children and young people with complex, persistent and severe behavioural and mental health needs?
3. Were arrangements in place for your council area to ensure that 24 hour cover is available to meet urgent mental health needs of children and young people and for a specialist mental health assessment to be undertaken within 24 hours or the next working day where indicated?
2. Did 16 and 17 year olds from your council area who require mental health services have access to services appropriate to their age and level of maturity?
1. Was a full range of CAMH services for children and young people with learning disabilities commissioned for your council area?
Guidance/interpretation
This indicator was new in 2005-06. The data for 2006-07 is submitted in February 2007; councils submit data rating themselves on components 1-4; the PI is calculated from the answers given for each of these components.
The indicator reflects development in local authority areas of key services for children and adolescents. It has four components, the first three of which relate to a PSA target on CAMHS services. The scoring used is broadly in line with the CAMHS Self Assessment matrix for 2005-06 - each of the components features in this matrix. The plans and protocols for each component must be part of the overall strategy for the CAMHS service developed for each CAMHS partnership in line with the NSF.
Councils will have rated their performance against each of the components on a scale of 1 to 4, and the final figure will be an aggregate of these four component scores, i.e. a whole number between four and sixteen. The ratings for each of the four components are above in the body of the indicator.
Measuring Unit[Source - Durham University annual CAMHS mapping exercises]
Whole number between four and sixteen
[If you have any queries about this indicator please contact: [email protected] and quote ref: 1043SC]

Page 1 of 2
BEING HEALTHYMental health data
Kingston Upon Hull, City of Drug Action Team
numerator denominatorindicator
valueYORKSHIRE average
DAT - region
difference
Proportion of those in treatment who are aged less than 18 2005 25 2,048 1% 7% -6%
2006 65 2,218 3% 8% -5%
2007 133 2,448 5% 8% -3%
Proportion of under 18s in treatment with young people's services 2005 17 25 68% 74% -6%
2006 59 65 91% 83% 8%
2007 127 133 95% 83% 12%
Note: difference is calculated using actual numbers, not rounded figures as stated in indicator values
200520062007
Traffic Light: RED
Indicator description and interpretation: This is a two part indicator: For the first part the numerator is the number of people aged less than 18 who have received drug treatment during the year. The denominator is the number of people of all ages who have received drug treatment during the year. High is good - the number of under 18 substance misusers is generally around 11% of the total for all ages: if the percentage of those in treatment aged <18 is higher than this then the DAT has been relatively successful in getting young people into treatment.
Health warning: Data collection from young persons' treatment services only started in April 2005/06 we would therefore expect large differences with data from 2005/06 to 2006/07. This may be due to better compliance with NDTMS.A low percentage for the first part of this indicator could be due to excellent performance by adult services in getting substance misusers into treatment rather than poor performance by young people's services. The NTA has introduced a new definition of treatment with new thresholds so a drop in numbers in 2007 could reflect a change in practice. An increase in the % of young people in young people's treatment services would be a more realistic indicator of improved services. The figures for Cornwall & Isles of Scilly are combined for both LAs, as they are not reported separately.
1040NT: Proportion of those in substance misuse treatment who are aged under 18
For the second part the numerator is the number of under 18 year olds receiving treatment from specialist treatment services providing tier 3/4 interventions to under 18s. The denominator is the numerator for the first part i.e. the number of people aged less than 18 receiving treatment High is good, suggesting that interventions for young people are child focused. A high % will indicate the existence of young people’s interventions to meet all needs. A low figure (less than 90%) is likely to indicate that adult services are still providing the more clinical aspects of drug treatment such as prescribing.All numbers are based on the drug action team area (which is the same as the local authority area) where the person lives, not where the treatment is provided.
Traffic Light: REDTraffic Light: RED
judgment basis for 2005 data: For the first part of the indicator based on a National Average of 5%:green = more than 7% of those receiving treatment are age less than 18 amber = between 3% and 7%red = less than 3%The second part of the indicator is provided for information only, but a high number and high % would indicate a comprehensive range of children’s treatment services
REF: 1040NT

Page 2 of 2
BEING HEALTHYMental health data
1040NT: Proportion of those in substance misuse treatment who are aged under 18
Owner: National Treatment Agency
Data Contact: If you have any queries concerning this data please contact Tom Aldridge on 020 7261 8540 or Kirsty Blenkins 020 7261 8550. Please quote REF: 1040NT
judgment basis for 2006 & 2007 data: For the first part of the indicator based on a National Average of 11.3%:green = more than 14% of those receiving treatment are age less than 18 amber = between 11 and 13.9%red = less than 11%The second part of the indicator is provided for information only, but a high number and high % would indicate a comprehensive range of children’s treatment services
Data Source: National Drug Treatment Monitoring Systemyear end figures will be available on www.nta.nhs.uk
REF: 1040NT
BEING HEALTHYLooked after children and care leavers data

Being healthyLooked after children and care leavers data
Kingston Upon Hull
2001/02 2002/03 2003/04 2004/05 2005/06 2006/07 2007/08LA 76 68 84 81 80 80 86 . = Data not applicableSN 65 74 78 81 82 88 90 .. = Data not availableEng 68 72 75 78 81 84 85 - = Data suppressed
due to small numbers
Bands Low High
2001-08 0<50 50<60 60<70 70<80 80<=100
Data definition
Continued on following page
[Source - OC2 Question 10]
This indicator is an amalgam of two components dealing with visits to the dentist and health assessments. It may be useful to look at each of these individually; poor performance on one component may be masked by good performance on the other. If the figure is low, then the age breakdown of the LAC cohort may be relevant, since older children are more likely to refuse. As is the case with all performance indicators, indicators 'indicate', they do not 'mean'. The overall figure for this indicator should be interpreted with caution. Although councils should encourage children looked after to have a health assessment, participation in them is not mandatory and refusals may have a substantial impact on a council’s indicator value.Health issues are regularly raised in reviews, so there is a likely relationship between participation in, and the timeliness of, reviews (4016SC PAF CF/C63 & 2064SC - PAF CF/C68). Distance from home (3085SC PAF CF/C69) may have an influence on health outcomes, as would frequent placement moves (2043SC PAF CF/A1).
1037SC - PAF CF/C19: The average of the percentages of looked after children who had been looked after continuously for at least 12 months, and who had their teeth checked by a dentist during the previous 12 months, and had an annual health assessment during the previous 12 months
The number of the children in the denominator who had their teeth checked by a dentist during the year ending 30 September.Numerator iThis indicator is the average of two indicators which are calculated separately.
Denominator
Numerator iiThe number of the children in the denominator who had had an annual health assessment during the year ending 30 September.[Source - OC2 Question 11]
The total number of children looked after at 30 September, who had been looked after continuously for at least 12 months.
This indicator measures some health requirements, which are basic for all children, which should not be overlooked for children looked after and serve as a proxy for good overall health outcomes.This indicator should have an association with good parenting, notwithstanding the fact that older children looked after might exercise their right to refuse medical examinations and treatments. We would expect to see high proportions of children looked after receiving this basic health care. There is an associated National Priorities Guidance objective to enable looked after children to gain maximum life chance benefit from educational opportunities, health care, social care and other services.
Percentage as a whole number which is an average of the percentage of (Numerator i/denominator) and (Numerator ii/denominator)
Guidance/interpretation
Measuring unit [Source - OC2 Question 1]
1037SC - PAF CF/C19: Health of looked after children
0
10
20
30
40
50
60
70
80
90
100
2001/02 2002/03 2003/04 2004/05 2005/06 2006/07 2007/08
%
Unbanded
Very good
Good
Acceptable
Ask questions aboutperformanceInvestigate urgently
SN
Eng
[If you have any queries about this indicator please contact: [email protected] and quote ref: 1037SC]

Being healthyLooked after children and care leavers data
Kingston Upon Hull
1037SC - PAF CF/C19: The average of the percentages of looked after children who had been looked after continuously for at least 12 months, and who had their teeth checked by a dentist during the previous 12 months, and had an annual health assessment during the previous 12 months
2064SC PAF CF/C68: Timeliness of reviews of children looked after - see p.57
4016SC PAF CF/C63: Participation of looked after children in reviews - see p.133
2043SC PAF CF/A1: Stability of placements of children looked after (BVPI 49) - see p.59Related measures
3085SC PAF CF/C69: Distance children newly looked after are placed from home - see p.106
[If you have any queries about this indicator please contact: [email protected] and quote ref: 1037SC]

STAYING SAFEEnvironmental and other safety data

STAYING SAFEEnvironmental and other safety data
Kingston-Upon-Hull
1994 - 1998 Average 2002 2003 2004 2005 2006
2006 percentage change on baseline
Kingston-Upon-Hull 49 31 17 26 24 17 -65%England 5,729 3,884 3,477 3,353 2,977 2,779 -51%Great Britain 6,860 4,596 4,100 3,905 3,472 3,294 -52%
Commentary on Kingston-Upon-Hull values
Continued on following page
2001DT: Number of children aged 0-15 killed or seriously injured in road traffic accidents
Number of children aged 0 to 15 killed or seriously injured in road traffic accidents
Whilst the 2006 total for killed or seriously injured child casualties in Kingston-Upon-Hull was 65% below the baseline, this figure can be highly variable year on year. This variability may occur because a relatively small number of children are killed or seriously injured each year in road accidents at Local Authority level.
The overarching PSA target for Road Safety:To reduce the number of people killed or seriously injured in Great Britain in road accidents by 40%, and the number of children killed or seriously injured by 50%, by 2010 compared with the average for 1994-98, tackling the significantly higher incidence in disadvantaged communities.
The Department for Transport has agreed a target to reduce the number of children killed or seriously injured in road traffic accidents by 50% by 2010 compared with the average for 1994-98. Statistics showed the number of children killed or seriously injured in Great Britain in 2006 to be 52% below the 1994-98 average.
In Kingston-Upon-Hull the number of children killed or seriously injured in 2006 was 65% below the 1994-98 average for that Local Authority.
Coverage of the Road Safety target:The 40% and 50% casualty reduction targets apply to Great Britain as a whole, as they were set in the context of the national strategy that included many measures that would affect the whole country in the same way. However, DfT's focus in local interventions necessary to address the special problems of disadvantaged areas is solely a matter for the devolved administrations in Scotland and Wales, and so that part of the target applies to England only.
Definitions: The 40% and 50% targets - these relate to combined totals of deaths and serious injuriesChildren - those aged under 16Killed - people whose injuries cause their death less than 30 days after the accidentSeriously injured - people whose injuries cause them to be detained in hospital as an "in-patient", or include any of the following injuries whether or not they are detained in hospital: fractures, concussion, internal injuries, crushings, burns (excluding friction burns), severe cuts and lacerations, severe general shock requiring medical treatment and injuries causing death 30 or more days after the accidentRoad accidents - those involving personal injury on the public highway (including footways) in which at least one road vehicle is involved and which becomes known to the police within 30 days of its occurrenceDisadvantaged communities - those within the ODPM's 88 Neighbourhood Renewal Fund areas
REF: 2001DT

STAYING SAFEEnvironmental and other safety data
2001DT: Number of children aged 0-15 killed or seriously injured in road traffic accidents
The credible monitoring of targeted reductions requires that data be reported consistently and accurately. Local and national government, and local police forces, work closely to achieve a common reporting standard. A complex devolved reporting system such as that operated in Great Britain will never produce perfect results, but the high standards that are achieved reflect the efforts of local authorities and police forces to report to the standard national requirement. However readers should note that while very few, if any, fatal accidents do not become known to the police, there is evidence that an appreciable proportion of non fatal injury accidents are not reported to the police and thus are not included.
Any queries on the statistics or requests for further information should be directed to Linden Francis, tel: 020 7944 3078, e-mail: [email protected]
Statistics, baselines and targetsProvisional statistics for each calendar year are published about six months after it ends, with final figures following in September in the annual publication "Road Accidents Great Britain - The Casualty Report".The PSA target relates to road casualty figures for 2010 to be published in 2011.The baseline figures are the averages for the calendar years 1994 to 1998 in Great Britain:· Total killed or seriously injured 47,656 (after 40% reduction = 28594) · Children killed or seriously injured 6,860 (after 50% reduction = 3430)For disadvantaged communities, our target is a bigger reduction than for England as a whole in the overall road casualty rate by population for ODPM's 88 Neighbourhood Renewal Fund areas, comparing the figure for 2006 with the average for 2000 to 2002.
Data collection and quality assuranceOn receipt of the data, DfT carries out its own validation checks and refers back any records with errors or suspicious values, such as any where the number of vehicles and/or casualties noted on the attendant circumstances record is inconsistent with the actual number of vehicle/casualty records in the accident set. Before annual statistics are compiled, DfT carries out further quality checks including ensuring that the number of records it holds agrees with the total held by data providers.DfT is confident that its casualty statistics based on STATS19 data are accurate, but recognises that, by their nature, they do not cover casualties arising from any accidents that are not reported to the police. Also, studies have shown that the police can underestimate the severity of injuries because of the difficulty of determining this at the scene.
REF: 2001DT

STAYING SAFEChild protection data - child protection procedures

Staying safeChild protection data - child protection procedures
Kingston Upon Hull
2001-02 2002-03 2003-04 2004-05 2005-06 2006-07 2007-08LA 719 954 1003 1031 786 873 617 . = Data not applicableSN 571 657 669 597 635 552 641 .. = Data not availableEng 511 513 517 499 515 496 490 - = Data suppressed
due to small numbers
Data definition
Continued on following page
Measuring unit Rate per 10,000 as a whole number
Numerator
The population aged under 18 in the council area divided by 10,000Denominator [Source - CPR3, Part A, Item 1, box 1]The number of referrals in period between 1 April and 31 March
Traffic lights have not been applied to this indicator
2015SC - KIGS CH141: Number of referrals of children per 10,000 population aged under 18
[Source - ONS mid year estimates] (2007-08 data uses the latest 2007 mid year estimates)
2015SC - KIGS CH141: Number of referrals of children per 10,000 population aged under 18
0
200
400
600
800
1000
1200
2001-02 2002-03 2003-04 2004-05 2005-06 2006-07 2007-08
LA
SN
Eng
[If you have any queries about this indicator please contact: [email protected] and quote ref: 2015SC]

Staying safeChild protection data - child protection procedures
Kingston Upon Hull
2015SC - KIGS CH141: Number of referrals of children per 10,000 population aged under 18
This indicator tries to establish whether appropriate thresholds are being used in the cases of children who are in need.Referrals of children to councils are important as a measure of local concerns about children's welfare. They cover a wide range of concerns including potential abuse, disability, family functioning etc. They may be made by other professionals, family members, friends, the general public or children referring themselves.
The measure will reflect: the practices of the council, for example, use of a corporate call centre as compared with access via local offices; joint working with the NHS on CAMHS and other services; and with the local Youth Offending Team. As the newly formed children's services work more closely together the counts of referrals may change, reflecting changes in 'gate keeping' arrangements. There may also be an issue, particularly where departments have recently merged, of social care referrals being correctly identified.The measure will reflect adherence to guidance on how to count referrals for one or more children in the same family and repeat referrals for the same child. Unborn children may be referred and will be counted in this measure.
Guidance/interpretation
2022SC PAF CF/C64: Timing of core assessments - see p.39
Referral rates may reflect differences in deprivation between councils; this will also apply within a council's area. Children’s social care services vary in their definition of what constitutes a referral which makes comparisons difficult. Some have a ‘pre-referral stage to establish if the concern meets their threshold for an assessment.Low numbers of referrals could suggest that there are clear thresholds for assessment which are well understood by other agencies. Low numbers, however, could also indicate too high thresholds and poor practice of agencies not referring until situations have deteriorated so much that they have become child protection issues This would indicate a need to explore the range of preventative/support services available for those who did not meet the threshold for social care and /or whether local agencies share an agreed common threshold.Referral rates need to be viewed in conjunction with repeat referrals (2016SC), referrals leading to initial assessment (2017SC), initial assessments within 7 working days of referral (2020SC), and rate & timing of core assessments (2021SC & 2022SC).A rising referral rate, linked with a rising number of initial and core assessments, could indicate better identification of concerns by other agencies. The extent to which the introduction of the Common Assessment Framework has occured in the council may affect this indicator as there may be a change in the patterns of referrals between agencies.
Related measures2016SC KIGS CH142: % of referrals that are repeat referrals within 12 months - see p.34
2020SC % of initial assessments within 7 working days of referral - see p.372017SC KIGS CH143: % of referrals of children in need that led to initial assessments - see p.35
2021SC KIGS CH145: Number of core assessments of children in need per 10,000 population aged under 18 - see p.38
New information about a child who is part of an already open case does not constitute a referral for the purpose of this return. Open cases should include cases of children receiving an ongoing service that will continue until it is reviewed at a given date, but until that date the case is not active so far as fieldwork and decision making is concerned. Reception and initial contact activity is not in itself a referral for the purposes of child protection plans. Such activity may, or may not, lead to a referral. Only the number of actual referrals should be counted on the return.
* in respect of a case of a child not previously known to the council;* where a case was previously open but is now closed.
This is either:A referral is defined as a request for services to be provided by social care services.
[If you have any queries about this indicator please contact: [email protected] and quote ref: 2015SC]

Staying safeChild protection data - child protection procedures
Kingston Upon Hull
2001-02 2002-03 2003-04 2004-05 2005-06 2006-07 2007-08LA 17.2 19.3 17.8 21.2 13.0 14.2 12.8 . = Data not applicableSN 24.6 18.8 22.8 21.9 24.0 22.8 29.3 .. = Data not availableEng 23.8 22.1 22.2 22.1 23.3 22.7 24.3 - = Data suppressed
due to small numbers
Data definition
2020SC % of initial assessments within 7 working days of referral - see p.372022SC PAF CF/C64: Timing of core assessments - see p.39
2016SC - KIGS CH142: Percentage of referrals that are repeat referrals within 12 months
[Source - CPR3, Part A, Item 1, box 2]The number of re-referrals in period between 1 April and 31 March
2017SC KIGS CH143: % of referrals of children in need that led to initial assessments - see p.35
Related measures2015SC KIGS CH141: Number of referrals of children per 10,000 population - see p.32
Percentage to one decimal place
High re-referral rates may also indicate a lack of understanding of thresholds for social care services and/or a limited range of preventative/support services in the area. It is important to look at this indicator in conjunction with other referral data (2015SC, 2017SC). There may also be links to how quickly the more substantial referrals are dealt with in terms of assessment timescales (2020SC & 2022SC PAF CF/C64).
This indicator tries to establish whether appropriate thresholds are being used in the cases of children who are in need.Re-referral percentages help to indicate the extent to which initial assessments at first referral are assessing needs appropriately. High, or higher than average, scores may indicate that following an assessment, appropriate services have not been put in place, or cases have been closed before the required outcomes have been achieved. Lower scores may reflect delays in closure of cases.
Guidance/interpretation
Measuring unit [Source - CPR3, Part A, Item 1, box 1]
Traffic lights have not been applied to this indicator
The number of referrals in period between 1 April and 31 March
Numerator
Denominator
Re-referral for this purpose is where a case has been closed and a referral occurs within 12 months of a previous referral to the same council. See CPR3 form and CPR3 FAQ (DCSF docs) for further explanation of 're-referrals'.
2016SC - KIGS CH142: % of referrals that are repeat referrals within 12 months
0
5
10
15
20
25
30
35
2001-02 2002-03 2003-04 2004-05 2005-06 2006-07 2007-08
%
LA
SN
Eng
[If you have any queries about this indicator please contact: [email protected] and quote ref: 2016SC]

Staying safeChild protection data - child protection procedures
Kingston Upon Hull
2001-02 2002-03 2003-04 2004-05 2005-06 2006-07 2007-08LA 75.1 38.8 41.5 60.2 83.9 90.5 54.5 . = Data not applicableSN 46.7 39.7 52.3 57.0 54.9 60.4 58.3 .. = Data not availableEng 46.3 46.3 50.8 52.6 52.7 56.0 59.4 - = Data suppressed
due to small numbers
Data definition
2020SC % of initial assessments within 7 working days of referral - see p.372022SC PAF CF/C64: Timing of core assessments - see p.39
2017SC - KIGS CH143: Percentage of referrals of children in need that led to initial assessments
[Source - CPR3, Part A, Item 2, box 1 + box 2]The number of initial assessments completed in the period between 1 April and 31 March.
2019SC KIGS CH02: Initial child protection conferences per 10,000 population aged under 18 - see p.362016SC KIGS CH142: % of referrals that are repeat referrals within 12 months - see p.34
Guidance/interpretation
2015SC KIGS CH141: Number of referrals of children per 10,000 population - see p.32Related measures
This indicator tries to establish whether appropriate thresholds are being used in the cases of children who are in need and whether their needs are being properly assessed.A high percentage of referrals leading to initial assessments may indicate good inter-agency understanding of thresholds for social care services. A low percentage of referrals leading to initial assessments may indicate a lack of understanding for social care services, perhaps due to poor inter-agency, or poor intra-agency, understanding or application of thresholds.The introduction of CAF may affect this indicator as there may be a change in the patterns of referrals between agencies.Significant variation in council's figure from the SN average figure should prompt further investigation.Consideration should be given to the relationship between the processing of referrals (2015SC & 2016SC), and initial & core assessment timescales (2020SC & 2022SC PAF CF/C64).
Percentage to one decimal placeMeasuring unit [Source - CPR3, Part A, Item 1, box 1]
Traffic lights have not been applied to this indicator
Numerator
The number of referrals in period between 1 April and 31 March.Denominator
2017SC - KIGS CH143: % of referrals of children in need that led to initial assessments
0
10
20
30
40
50
60
70
80
90
100
2001-02 2002-03 2003-04 2004-05 2005-06 2006-07 2007-08
%
LA
SN
Eng
[If you have any queries about this indicator please contact: [email protected] and quote ref: 2017SC]

Staying safeChild protection data - child protection procedures
Kingston Upon Hull
2001-02 2002-03 2003-04 2004-05 2005-06 2006-07 2007-08LA 57.6 59.4 48.7 53.4 50.4 26.6 29.1 . = Data not applicableSN 45.8 52.1 45.7 48.5 44.6 46.0 55.2 .. = Data not availableEng 31.3 33.7 34.8 33.8 34.4 35.8 36.7 - = Data suppressed
due to small numbers
2023SC KIGS CH01: Children and young people on child protection register per 10,000 population aged under 18 - see p.412027SC KIGS CH03: Child Protection registrations per 10,000 population aged under 18 - see p.44
2019SC - KIGS CH02: Initial child protection conferences per 10,000 population aged under 18
Data definition
Rate per 10,000 to one decimal placeMeasuring unit [Source - ONS mid year estimates] (2007-08 data uses the latest 2007 mid year estimates)The population aged under 18 in the council area divided by 10,000Denominator [Source - CPR3 Part A Item 4, line 2]
Traffic lights have not been applied to this indicator
If the rate of ICPCs is significantly at variance to SN (not national) comparators this raises questions regarding the management and decision making regarding child protection concerns.
Related measures
2021SC KIGS CH145: Number of core assessments of children in need per 10,000 population aged under 18 - see p.382020SC % of initial assessments within 7 working days of referral - see p.372015SC KIGS CH141: Number of referrals of children per 10,000 population - see p.32
The number of initial child protection conferences in the period between 1 April and 31 March.Numerator
This indicator tries to establish whether appropriate thresholds are being used in the cases of children who are at the greatest risk of abuse.Rates may reflect differences in deprivation between councils; this will also apply within a council’s area. If there is a high mobility of families in an area this may add to numbers of initial conferences as children already on another council’s child protection plan move permanently into the area. Rates may reflect differences in the age structure of the under 18 population between councils.
Guidance/interpretation
2019SC - KIGS CH02: Initial child protection conferences per 10,000 population aged under 18
0
10
20
30
40
50
60
70
2001-02 2002-03 2003-04 2004-05 2005-06 2006-07 2007-08
LA
SN
Eng
[If you have any queries about this indicator please contact: [email protected] and quote ref: 2019SC]

Staying safeChild protection data - child protection procedures
Kingston Upon Hull
2001-02 2002-03 2003-04 2004-05 2005-06 2006-07 2007-08LA 59.0 53.8 52.7 63.2 60.0 60.0 75.5 . = Data not applicableSN 47.6 45.1 44.8 61.7 64.8 67.0 70.5 .. = Data not availableEng 54.0 56.6 58.1 61.7 64.9 68.4 70.7 - = Data suppressed
due to small numbers
Data definition
2020SC - Percentage of initial assessments within seven working days of referral
Numerator
The number of initial assessments completed in the period between 1 April and 31 March.Denominator [Source - CPR3, Part A, Item 2, box 1]The number of initial assessments completed, in the period between 1 April and 31 March, within seven working days of referral.
Traffic lights have not been applied to this indicator
Guidance/interpretation
Percentage to one decimal placeMeasuring unit [Source - CPR3, Part A, Item 2, box 1 + box 2]
q pIt should be undertaken within a maximum of seven working days. An initial assessment is deemed to have commenced at the point of referral to Children's Services or when the new information on a case already open indicates that an initial assessment should be repeated.
This indicator tries to establish whether children who are in need are being assessed in a timely manner as a proxy for the effectiveness of the assessment, and the meeting, of children's needs.A referral is defined as a request for services to be provided by the social services department. The response may include no action, but that in itself is a decision, and should be made promptly and recorded.
2015SC KIGS CH141: Number of referrals of children per 10,000 population - see p.32
High scores indicate good performance. Low scores indicate poor performance. Low percentages of IAs completed within timescale suggests problems in the duty and referral system which could include either poor systems, inadequate management, insufficient staff, or poor data management. This indicator should be viewed in conjunction with data on referrals (2015SC-2017SC), core assessments (2021SC & 2022SC) and staffing (6012SC).
Related measures
The Assessment Framework sets a timescale for an initial assessment which authorities are expected to meet. Feedback from children and parents has been very positive about the requirement to undertake an initial assessment within 7 working days. Where this timescale has been met, they have described being very appreciative of a prompt service.
2016SC KIGS CH142: % of referrals that are repeat referrals within 12 months - see p.342017SC KIGS CH143: % of referrals of children in need that led to initial assessments - see p.352021SC KIGS CH145: Number of core assessments of children in need per 10,000 population aged under 18 - see p.382022SC PAF CF/C64: Timing of core assessments - see p.396012SC % of SSD directly employed posts for children and families vacant on 30 September - see p.174
2020SC - % of initial assessments within 7 working days of referral
0
10
20
30
40
50
60
70
80
2001-02 2002-03 2003-04 2004-05 2005-06 2006-07 2007-08
%
LA
SN
Eng
[If you have any queries about this indicator please contact: [email protected] and quote ref: 2020SC]

Staying safeChild protection data - child protection procedures
Kingston Upon Hull
2001-02 2002-03 2003-04 2004-05 2005-06 2006-07 2007-08LA 57.6 58.9 62.6 62.4 88.4 175.9 101.7 . = Data not applicableSN 53.6 55.1 43.1 94.7 86.7 86.9 109.1 .. = Data not availableEng 50.5 50.1 57.4 66.9 76.8 84.9 95.6 - = Data suppressed
due to small numbers
Data definition
2021SC - KIGS CH145: Number of core assessments of children in need per 10,000 population aged under 18
Rate per 10,000 to one decimal placeMeasuring unit[Source - ONS mid year estimates] (2007-08 data uses the latest 2007 mid year estimates)
Numerator
The population aged under 18 in the council area divided by 10,000Denominator [Source - CPR3, Part A, Item 3, box 1 + box 2]The number of core assessments completed in the period between 1 April and 31 March.
Traffic lights have not been applied to this indicator
2016SC KIGS CH142: % of referrals that are repeat referrals within 12 months - see p.34
Related measures2015SC KIGS CH141: Number of referrals of children per 10,000 population - see p.32
Guidance/interpretation
This indicator should be viewed in conjunction with data on referrals (2015SC-2017SC), assessments (2020SC & 2022SC) and staffing (6012SC). Rates may reflect differences in deprivation between councils - this will also apply within a council's area - and may reflect differences in the age structure of the under 18 population. A high rate may indicate that thresholds are set too low and a low rate may indicate threshold set too high, though either may indicate the application of proportionate thresholds. Any rates, high or low, that are consistently and significantly different to those of SN comparators, however, require further exploration.
A core assessment is deemed to have commenced at the point at which the initial assessment ended, or strategy discussion decided to initiate enquiries under s47 of the Children Act 1989, or new information obtained on an open case indicates that a core assessment should be undertaken.
A core assessment is defined as an in-depth assessment of the needs of a child and the capacity of their parents or care givers to respond appropriately to these needs within the wider family and community network. At the conclusion of this phase of assessment, there should be an analysis of the findings to arrive at an understanding of the child's situation. This understanding should be used to inform a subsequent plan which sets out the case objectives, and the nature of services to be provided. The time-scale for the completion of a core assessment is a maximum of 35 working days. Successful meeting of the time-scales also indicates effective joint working where multi-agency assessment is required.
2017SC KIGS CH143: % of referrals of children in need that led to initial assessments - see p.352020SC % of initial assessments within 7 working days of referral - see p.372022SC PAF CF/C64: Timing of core assessments - see p.396012SC % of SSD directly employed posts for children and families vacant on 30 September - see p.174
2021SC - KIGS CH145: Number of core assessments of children in need per 10,000 population aged under 18
0
20
40
60
80
100
120
140
160
180
200
2001-02 2002-03 2003-04 2004-05 2005-06 2006-07 2007-08
LA
SN
Eng
[If you have any queries about this indicator please contact: [email protected] and quote ref: 2021SC]

Staying safeChild protection data - child protection procedures
Kingston Upon Hull
2004-05 2005-06 2006-07 2007-08LA 83 75 65 75 . = Data not applicableSN 68 76 79 80 .. = Data not availableEng 67 74 78 80 - = Data suppressed
due to small numbers
Bands Low High
2004-05 0<45 45<55 55<65 65<75 75<=1002005-06 0<45 45<60 60<70 70<80 80<=1002006-08 0<60 60<70 70<75 75<80 80<=100
Data definition
Continued on following page
Of the core assessments in the denominator, the number that had been completed within 35 working days of their commencement. A core assessment is deemed to have commenced at the point at which: * the initial assessment ended; or
2022SC - PAF CF/C64: Percentage of core assessments that were completed within 35 working days of their commencement
Numerator
* a strategy discussion decided to initiate enquiries under section 47 of the Children Act 1989; or
Guidance/interpretationThis indicator tries to establish whether children who are in the greatest need are being assessed in a timely manner as a proxy for the effectiveness of the assessment, and the meeting, of children's needs.A core assessment is deemed to have commenced at the point at which the initial assessment ended, or strategy discussion decided to initiate enquiries under s47 of the Children Act 1989, or new information obtained on an open case indicates that a core assessment should be undertaken.The Assessment Framework sets a timescale for a core assessment which authorities are expected to meet. It is not always possible to complete core assessments appropriately within 35 days. This is the case in only a minority of instances, however, and the bandings on this indicator have been tightened further from 2005-06 to 2006-07 to both reflect this and to encourage better performance.
[Source - CPR3, Item 3, box 1]* new information obtained on an open case indicates that a core assessment should be undertaken.
Percentage as a whole numberMeasuring unit [Source - CPR3, Item 3, box 1+ box 2]
The total number of core assessments in the year. If a child undergoes a core assessment more than once in the year, count each core assessment that finished during the year separately.
Denominator
Examination of the 2005-06 and 2006-07 data of the number of core assessments per 10,000 and the percentage of core assessments completed in time indicates that councils may not be recording data consistently or that practice varies widely. This indicator should be viewed in conjunction with data on referrals (2015SC-2017SC), assessments (2020SC-2022SC), and staffing (6012SC).High numbers generally indicate good performance. Low numbers generally indicate poor performance and suggest problems in allocation, and/or difficulties in joint working with other agencies. Moderate to very high scores in this indicator should, when coupled with high staff vacancy rates, prompt further questions about practice and/or data.
2022SC - PAF CF/C64: Timing of core assessments
0
10
20
30
40
50
60
70
80
90
2004-05 2005-06 2006-07 2007-08
%
Unbanded
Very good
Good
Acceptable
Ask questions aboutperformanceInvestigate urgently
SN
Eng
[If you have any queries about this indicator please contact: [email protected] and quote ref: 2022SC]

Staying safeChild protection data - child protection procedures
Kingston Upon Hull
2022SC - PAF CF/C64: Percentage of core assessments that were completed within 35 working days of their commencement
6012SC % of SSD directly employed posts for children and families vacant on 30 September - see p.174
Related measures2015SC KIGS CH141: Number of referrals of children per 10,000 population - see p.32
2020SC % of initial assessments within 7 working days of referral - see p.372021SC KIGS CH145: Number of core assessments of children in need per 10,000 population aged under 18 - see p.38
2016SC KIGS CH142: % of referrals that are repeat referrals within 12 months - see p.342017SC KIGS CH143: % of referrals of children in need that led to initial assessments - see p.35
[If you have any queries about this indicator please contact: [email protected] and quote ref: 2022SC]

Staying safe
Kingston Upon Hull
2001-02 2002-03 2003-04 2004-05 2005-06 2006-07 2007-08LA 36.2 42.7 41.6 43.6 46.7 27.9 22.6 . = Data not applicableSN 32.0 35.4 29.9 29.5 28.7 29.8 36.7 .. = Data not availableEng 23.1 23.9 23.7 23.4 23.9 25.3 26.5 - = Data suppressed
due to small numbers
Data definition
Rate per 10,000 population to one decimal placeMeasuring unit [Source - ONS mid year estimates] (2007-08 data uses the latest 2007 mid year estimates)The population aged under 18 in the council area divided by 10,000Denominator [Source - CPR3, Part B, Table 1, line 6, column 14]Number of children who were the subject of a child protection plan, or on the Child Protection Register at 31 March 2007.Numerator
2042SC KIGS CH39: Children looked after per 10,000 population aged under 18 - see p.552036SC PAF CF/C21: Duration on the Child Protection Register - see p.522035SC KIGS CH10: De-registrations from the Child Protection Register per 10,000 population aged under 18 - see p.512034SC PAF CF/C20: Reviews of child protection cases (BVPI 162) - see p.49
2016SC KIGS CH142: % of referrals that are repeat referrals within 12 months - see p.342015SC KIGS CH141: Number of referrals of children per 10,000 population - see p.32
This indicator tries to establish whether appropriate thresholds are being used in the cases of children who are at risk of suffering significant harm.This indicator should be viewed in conjunction with data on referrals (2015SC-2017SC), child protection conferences (2019SC), assessments (2020SC & 2021SC) and staffing (6012SC). Differences in rates may reflect differences in deprivation between councils - this will also apply within a council's area - and may reflect differences in the age structure of the under 18 population. A high rate may indicate that thresholds are set too low and a low rate may indicate threshold set too high, though either may also indicate the application of proportionate thresholds. More effective inter-agency working may lead to an increased indicator value and poor inter-agency working may lead to decreased indicator value. Any rates, high or low, that are consistently and significantly different to those of SN comparators, however, require further exploration.
Guidance/interpretation
Further exploration is also required if there are significant changes in the trend data because this may indicate important changes in the application of thresholds (2019SC, 2027SC, 2028SC PAF CF/A3). Practice in relation to timing of both child protection reviews and of deregistration may have a bearing on this indicator (2034SC PAF CF/C20, 2035SC & 2036SC PAF CF/C21).Changes in trend data on children looked after may also have an important connection with this indicator (2042SC).
Traffic lights have not been applied to this indicator
Child protection data - child protection procedures2023SC - KIGS CH01: Children and young people who are the subject of a child protection plan, or on the child protection register, per 10,000 population aged under 18
2028SC PAF CF/A3: Re-registrations on the Child Protection Register - see p.452027SC KIGS CH03: Child Protection registrations per 10,000 population aged under 18 - see p.442021SC KIGS CH145: Number of core assessments of children in need per 10,000 population aged under 18 - see p.38
Related measures
2017SC KIGS CH143: % of referrals of children in need that led to initial assessments - see p.35
2020SC % of initial assessments within 7 working days of referral - see p.372019SC KIGS CH02: Initial child protection conferences per 10,000 population aged under 18 - see p.36
2023SC - KIGS CH01: Children and young people on child protection register per 10,000 population aged under 18
0
5
10
15
20
25
30
35
40
45
50
2001-02 2002-03 2003-04 2004-05 2005-06 2006-07 2007-08
LA
SN
Eng
[If you have any queries about this indicator please contact: [email protected] and quote ref: 2023SC]

Staying safeChild protection data - child protection procedures
Kingston Upon Hull
2003-04 2004-05 2005-06 2006-07 2007-08LA 0.0 0.0 0.0 0.0 0.0 . = Data not applicableSN 0.9 0.4 0.4 1.3 0.0 .. = Data not availableEng 1.1 0.3 0.2 0.3 0.4 - = Data suppressed
due to small numbers
Data definition
Continued on following page
[Source - 2003-04 to 2005-06 - CSCI data collection; 2006-08 - Ofsted data collection]
Numerator
Numbers on the Child Protection Register at 31 MarchDenominator [Source - 2003-04 to 2005-06 - CSCI data collection; 2006-08 - Ofsted data collection]Of those in the denominator, numbers not allocated to a key worker at March 31.
2024SC - Percentage of children and young people who are the subject of a child protection plan, or on the child protection register, who are not allocated to a social worker
It should be noted that since this is snapshot data, this indicator does not necessarily represent a council's performance throughout the year. A high number would suggest that further investigation is needed around the number, recruitment, retention, and allocation of social workers. A high number would also raise questions about the use and supervision of unqualified staff (see 6012SC).A low number, coupled with poor recruitment and retention figures, should prompt further investigation (see above). A low number, coupled with an increasing pressure on children's services or of the volume of child protection work, should also prompt further investigation (see indicators 2015SC-2017SC, 2021SC, 2023SC, 2027SC, 2034SC-2035SC).
The role of the Key worker is set out in paragraphs 5.75 and 5.76 of Working Together to Safeguard Children . The Key Worker is the qualified social worker who has been allocated responsibility for the case. It is not a managerial role.
This indicator tries to use allocation data as a proxy for the measurement of the effectiveness of the interventions provided to children with a child protection plan or on the Child Protection Register. Working Together , which was based on research, inspections, and reviews of individual cases, stresses the importance of key workers in ensuring that plans are developed and implemented to protect children from abuse. The death of Victoria Climbié and its aftermath have reinforced this importance.
Traffic lights have not been applied to this indicator
Guidance/interpretation
Percentage to one decimal placeMeasuring unit
2024SC - % of children and young people on the child protection register who are not allocated to a social worker
0.0
0.2
0.4
0.6
0.8
1.0
1.2
1.4
2003-04 2004-05 2005-06 2006-07 2007-08
%
LA
SN
Eng
[If you have any queries about this indicator please contact: [email protected] and quote ref: 2024SC]

Staying safeChild protection data - child protection procedures
Kingston Upon Hull
2024SC - Percentage of children and young people who are the subject of a child protection plan, or on the child protection register, who are not allocated to a social worker
6012SC % of SSD directly employed posts for children and families vacant on 30 September - see p.174
2021SC KIGS CH145: Number of core assessments of children in need per 10,000 population aged under 18 - see p.382023SC KIGS CH01: Children and young people on child protection register per 10,000 population aged under 18 - see p.412027SC KIGS CH03: Child Protection registrations per 10,000 population aged under 18 - see p.44
2017SC KIGS CH143: % of referrals of children in need that led to initial assessments - see p.352019SC KIGS CH02: Initial child protection conferences per 10,000 population aged under 18 - see p.36
2034SC PAF CF/C20: Reviews of child protection cases (BVPI 162) - see p.492035SC KIGS CH10: De-registrations from the Child Protection Register per 10,000 population aged under 18 - see p.512060SC % of looked after children with a named social worker who is qualified as a social worker - see p.69
2016SC KIGS CH142: % of referrals that are repeat referrals within 12 months - see p.34
Related measures2015SC KIGS CH141: Number of referrals of children per 10,000 population - see p.32
[If you have any queries about this indicator please contact: [email protected] and quote ref: 2024SC]

Staying safe
Kingston Upon Hull
2001-02 2002-03 2003-04 2004-05 2005-06 2006-07 2007-08LA 42.5 59.4 48.7 48.0 47.6 25.7 28.6 . = Data not applicableSN 39.9 42.2 35.7 40.0 35.8 37.0 45.5 .. = Data not availableEng 25.0 27.2 28.1 27.7 28.5 30.2 30.9 - = Data suppressed
due to small numbers
Child protection data - child protection procedures2027SC - KIGS CH03: Children who became the subject of a child protection plan, or were registered, per 10,000 population aged under 18
Rate per 10,000 population to one decimal placeMeasuring unit [Source - ONS mid year estimates] (2007-08 data uses the latest 2007 mid year estimates)The population aged under 18 in the council area divided by 10,000Denominator [Source - CPR3, Part B, Table 5, line 6 (also Table 6, line 6, column 4)]
Numerator
2036SC PAF CF/C21: Duration on the Child Protection Register - see p.522034SC PAF CF/C20: Reviews of child protection cases (BVPI 162) - see p.492028SC PAF CF/A3: Re-registrations on the Child Protection Register - see p.452035SC KIGS CH10: De-registrations from the Child Protection Register per 10,000 population aged under 18 - see p.51
Traffic lights have not been applied to this indicator
2024SC % of children and young people on the child protection register who are not allocated to a social worker - see p.422019SC KIGS CH02: Initial child protection conferences per 10,000 population aged under 18 - see p.36Related measures
Data definition
If the rate of registrations is significantly at variance to national and local comparators this raises questions regarding the management and decision making regarding child protection concerns. If there are significant numbers of LAC on the CPR this should be investigated because it may suggest an inefficient use of resources or drift. Changes in this over time is a good indicator of changing practice within an authority (more or less risk averse, better prevention etc).This data should be viewed in conjunction with indicators on rates with child protection plans (2019SC), registration (2028SC PAF CF/A3), deregistration (2035SC & 2036SC PAF CF/C21) and reviews (2034SC PAF CF/C20).
This indicator tries to establish whether appropriate thresholds are being used in the cases of children who are at risk of suffering significant harm.Differences in rates between councils may reflect differences in deprivation between councils; this may also apply within a council's area. Rates may also reflect differences in the age structure of the under 18 population between councils.
Guidance/interpretation
Number of children registered, or having a child protection plan, during the year, ending 31 March.
2027SC - KIGS CH03: Child protection registrations per 10,000 population aged under 18
0
10
20
30
40
50
60
70
2001-02 2002-03 2003-04 2004-05 2005-06 2006-07 2007-08
LA
SN
Eng
[If you have any queries about this indicator please contact: [email protected] and quote ref: 2027SC]

Staying safeChild protection data - child protection procedures
Kingston Upon Hull
2001-02 2002-03 2003-04 2004-05 2005-06 2006-07 2007-08LA 13.8 17.2 16.7 21.6 19.1 15.4 18.5 . = Data not applicableSN 18.7 15.7 14.9 14.1 13.8 15.9 12.3 .. = Data not availableEng 14.0 13.4 13.1 13.4 14.2 13.4 13.6 - = Data suppressed
due to small numbers
Bands Low High
2001-08 0<3 3<6 6<8 8<10 10<15 15<17.21 17.21<20 20<24 24<=100
Data definition
Continued on following page
2028SC - PAF CF/A3: Percentage of children who became the subject of a child protection plan, or were registered during the year, who had previously been the subject of a child protection plan or had been registered
The purpose of the child protection plan, or registration, is to devise and implement a plan which leads to lasting improvements in the child’s safety and overall well being. Some re-registrations are essential in responding to adverse changes in circumstance, but high levels of re-registration may suggest that the professionals responsible for the child’s welfare are not intervening effectively either to bring about the required changes in the child’s family situation, or to make alternative plans for the child’s long term care.
Guidance/interpretation
Percentage to one decimal place
It is important to link this indicator with the other key child protections indicators (2023SC, 2027SC, 2034SC, 2035SC). The most obvious relationship is with 2036SC PAF CF/C21, duration with a child protection plan or on the register, where a good (i.e. low) figure for this indicator may have been achieved at the expense of a poor (i.e. high) figure for PAF C21. The levels of re-registrations, in other words, might be low where a council fails to achieve de-registrations within two years and children are left on the register for extended periods.
Measuring unit [Source - CPR3, Part B, Table 5, line 6, column 4 (also Table 9)]
Consideration needs to be given to the reasons for re-registration and to the timescales concerned in order to establish the extent to which re-registration is a result of inadequate child protection planning. A proportion of a council’s re-registrations may be because a child had left a council area only to return to the same area at some later date; this is not necessarily evidence of a failure of a child protection plan. Also a child may have been registered and deregistered many years previously to the relevant financial year and so their re-registration will not be a reflection of any failure on the part of the council in their child protection work.Not all councils have comprehensive records for previous registrations going back 18 years. The less comprehensive their data, the lower the rate of re-registration may be.
Numerator
The number of children who were the subject of a child protection plan, or on the Child Protection Register, at any time between 1 April and 31 March.This is a count of each occasion of registration in the year, and may count the same child more than once.
Denominator [Source - CPR3, Part B, Table 7 line 2 (also Table 9)]
Of the children in the denominator, the number who had previously been the subject of a child protection plan, or on the Child Protection Register, regardless of how long ago that was.
2028SC - PAF CF/A3: Re-registrations on the child protection register
0
5
10
15
20
25
2001-02 2002-03 2003-04 2004-05 2005-06 2006-07 2007-08
%
Unbanded
Very good
Good
Acceptable
Ask questions aboutperformanceInvestigate urgently
SN
Eng
[If you have any queries about this indicator please contact: [email protected] and quote ref: 2028SC]

Staying safeChild protection data - child protection procedures
Kingston Upon Hull
2028SC - PAF CF/A3: Percentage of children who became the subject of a child protection plan, or were registered during the year, who had previously been the subject of a child protection plan or had been registered
2023SC KIGS CH01: Children and young people on child protection register per 10,000 population aged under 18 - see p.412027SC KIGS CH03: Child Protection registrations per 10,000 population aged under 18 - see p.442034SC PAF CF/C20: Reviews of child protection cases (BVPI 162) - see p.492035SC KIGS CH10: De-registrations from the Child Protection Register per 10,000 population aged under 18 - see p.512036SC PAF CF/C21: Duration on the Child Protection Register - see p.526012SC % of SSD directly employed posts for children and families vacant on 30 September - see p.174
Guidance / interpretationLow figures may be related to poor management of data. A very low level of re-registrations may, however, mean that a council is not re-registering some children who are in need. Higher numbers in relation to SN may suggest poor decision-making to end a protection plan, or remove from the register, or a lack of appropriate support for families after de-registration. There is also a possible interplay between staffing issues and re-registrations (6012SC).
Related measures
[If you have any queries about this indicator please contact: [email protected] and quote ref: 2028SC]

Staying safe
Kingston Upon Hull
KIGS CH121: Percentage of children subject to a child protection plan at 31 March who are White
2001-02 2002-03 2003-04 2004-05 2005-06 2006-07 2007-08 . = Data not applicableLA 99.1 98.0 97.5 95.2 94.7 98.1 95.2 .. = Data not availableSN 96.2 95.7 94.8 95.7 93.6 93.6 92.8 - = Data suppressed Eng 84.1 84.2 83.3 82.0 81.4 80.7 80.2 due to small numbers
KIGS CH122: Percentage of children subject to a child protection plan at 31 March who are of mixed ethnic origin
2001-02 2002-03 2003-04 2004-05 2005-06 2006-07 2007-08LA - - - - 2.7 - -SN 1.1 1.7 2.1 3.0 3.8 3.8 4.1Eng 5.8 6.2 6.4 6.9 7.3 7.3 7.6
KIGS CH123: Percentage of children subject to a child protection plan at 31 March who are Asian or Asian British
2001-02 2002-03 2003-04 2004-05 2005-06 2006-07 2007-08LA 0.0 0.0 0.0 - 0.0 0.0 0.0SN 1.8 1.9 1.7 0.9 1.3 1.7 1.5Eng 3.6 3.5 3.5 4.2 4.7 5.3 4.8
KIGS CH124: Percentage of children subject to a child protection plan at 31 March who are Black or Black British
2001-02 2002-03 2003-04 2004-05 2005-06 2006-07 2007-08LA 0.0 0.0 - 0.0 - 0.0 -SN 0.5 0.6 0.8 0.3 0.8 0.6 1.1Eng 4.4 4.8 5.5 5.4 5.5 5.3 5.8
Continued on following page
Traffic lights have not been applied to this indicator
2066SC - Ethnicity of children who are the subject of a child protection plan (White, mixed ethnic origin, Asian or Asian British, and Black or Black British)
Child protection data - child protection procedures
% of children subject to a child protection plan at 31 March who are White
0.010.020.030.040.050.060.070.080.090.0
100.0
2001-02 2002-03 2003-04 2004-05 2005-06 2006-07 2007-08
%
LA
SN
Eng
% of children subject to a child protection plan at 31 March who are of mixed ethnic origin
0.0
1.0
2.0
3.0
4.0
5.0
6.0
7.0
8.0
2001-02 2002-03 2003-04 2004-05 2005-06 2006-07 2007-08
%
LA
SN
Eng
% of children subject to a child protection plan at 31 March who are Asian or Asian British
0.0
1.0
2.0
3.0
4.0
5.0
6.0
2001-02 2002-03 2003-04 2004-05 2005-06 2006-07 2007-08
%
LA
SN
Eng
% of children subject to a child protection plan at 31 March who are Black or Black British
0.0
1.0
2.0
3.0
4.0
5.0
6.0
7.0
2001-02 2002-03 2003-04 2004-05 2005-06 2006-07 2007-08
%
LA
SN
Eng
[If you have any queries about this indicator please contact: [email protected] and quote ref: 2066SC]

Staying safe
Kingston Upon Hull
2066SC - Ethnicity of children who are the subject of a child protection plan (White, mixed ethnic origin, Asian or Asian British, and Black or Black British)
Child protection data - child protection procedures
Data definition
Those whose ethnicity is in the following categories: white; mixed; Asian or Asian British; black or black British.[Source - CPR3, Part B, Table 2, lines 1 to 3 (white); lines 4 to 7 (mixed);lines 8 to 11 (Asian or Asian British); lines 12 to 14 (black or black British)]
If children of any particular ethnic origin are over represented among those with a child protection plan, or on the register, in relation to the population breakdown for the area this suggests that they may not be accessing preventative support at an early enough stage to prevent concerns escalating in to child protection. If children of any particular ethnic origin are under represented, this suggests that concerns about their welfare are not being identified which may leave them at risk.This indicator needs to be considered alongside other indicators relating to ethnicity (2060SC). In small authorities, or those with low numbers on the register, this set of indicators needs to be treated with care – as a small number of children can skew the figures.
Measuring unit
Guidance/interpretation
DenominatorThe total number of children subject to a child protection plan, or on the Child Protection Register at 31 March (minus unborn).[Source - CPR3, Part B, Table 2: row 18 (minus row 17)]
Percentage to one decimal place
Numerator
[If you have any queries about this indicator please contact: [email protected] and quote ref: 2066SC]

Staying safeChild protection data - child protection procedures
Kingston Upon Hull
2003-04 2004-05 2005-06 2006-07 2007-08LA 93.8 98.1 99.0 100.0 100.0 . = Data not applicableSN 86.8 99.1 99.9 99.9 99.3 .. = Data not availableEng 95.5 98.8 99.4 99.5 99.4 - = Data suppressed
due to small numbers
Bands Low High
2003-08 0<92.5 92.5<95 95<97.5 97.5<100 100
Numerator
Continued on following page
2034SC - PAF CF/C20: Percentage of child protection cases which should have been reviewed during the year that were reviewed (BVPI 162)
This indicator tries to use reviews as a proxy for the measurement of the effectiveness of the interventions provided to children with a child protection plan or on the register.Guidance, Working Together to Safeguard Children , which came into effect from December 1999, requires that the first child protection review is held within three months of the initial child protection conference and thereafter at intervals of no more than six months. Reviews are a key element in delivering Child Protection Plans and effective reviews should ensure the provision of good quality interventions.
Guidance/interpretation
Denominator
iii. a review was held within 6 months of the end of the year (i.e. on or after 1 October)
[Source - CPR3, Part B, Table 9]
A review should be recorded in writing and should consider the child's safety, health and development against the intended outcomes set out in the child protection plan.
(Note that the only account taken of reviews in previous years is set out at i)
The number of children on the Child Protection Register, or having a child protection plan, at 31 March, continuously for at least the previous three months.
High figures indicate good performance. A high figure for CF/C20 might be expected to be linked with reasonably low figure for 2036SC PAF CF/C21, otherwise the efficacy of the reviews may be questionable, as well as having a potential impact on re-registrations (2028SC PAF CF/A3).
From 2003-04, the definition of this indicator changed to include children who had been on the Register for at least 3 months.
Percentage to one decimal placeMeasuring unit [Source - CPR3, Part B, Table 9]
Definition
ii. the maximum gap between reviews during the year was 6 months; and
i. the first review of the year was held within 6 months of the last review in the previous year (or within 3 months of the child being placed on the Register, if there was no review in the previous year);
Of the children in the denominator, the number of children whose cases had been reviewed so that:
2034SC - PAF CF/C20: Reviews of child protection cases (BVPI 162)
40
50
60
70
80
90
100
2003-04 2004-05 2005-06 2006-07 2007-08
%
Unbanded
Very good
Good
Acceptable
Ask questions aboutperformanceInvestigate urgently
SN
Eng
[If you have any queries about this indicator please contact: [email protected] and quote ref: 2034SC]

Staying safeChild protection data - child protection procedures
Kingston Upon Hull
2034SC - PAF CF/C20: Percentage of child protection cases which should have been reviewed during the year that were reviewed (BVPI 162)
2028SC PAF CF/A3: Re-registrations on the Child Protection Register - see p.452036SC PAF CF/C21: Duration on the Child Protection Register - see p.526012SC % of SSD directly employed posts for children and families vacant on 30 September - see p.174
Related measures2024SC % of children and young people on the child protection register who are not allocated to a social worker - see p.42
Guidance/interpretationPerformance has improved in this indicator, to the extent that few councils now record a result of less than 92.5%: nonetheless close attention still needs to be paid to this part of the child protection picture. A high figure, coupled with poor recruitment and retention figures (6012SC), should prompt further questions about how this is managed. A high figure, coupled with an increasing volume of child protection work, should also prompt some further questions. This indicator should also be looked at in conjunction with allocation data (2024SC).
[If you have any queries about this indicator please contact: [email protected] and quote ref: 2034SC]

Staying safe
Kingston Upon Hull
2001-02 2002-03 2003-04 2004-05 2005-06 2006-07 2007-08LA 35.2 54.1 51.0 46.4 48.5 45.9 33.7 . = Data not applicableSN 39.5 38.7 41.8 40.6 36.9 36.3 38.9 .. = Data not availableEng 25.8 26.3 28.3 28.1 28.1 28.9 29.7 - = Data suppressed
due to small numbers
6012SC % of SSD directly employed posts for children and families vacant on 30 September - see p.174
2028SC PAF CF/A3: Re-registrations on the Child Protection Register - see p.45
2036SC PAF CF/C21: Duration on the Child Protection Register - see p.522034SC PAF CF/C20: Reviews of child protection cases (BVPI 162) - see p.49
2027SC KIGS CH03: Child Protection registrations per 10,000 population aged under 18 - see p.442024SC % of children and young people on the child protection register who are not allocated to a social worker - see p.422023SC KIGS CH01: Children and young people on child protection register per 10,000 population aged under 18 - see p.41
Traffic lights have not been applied to this indicator
Denominator [Source - CPR3, Part B, Table 8, line 7, column 4]
This indicator tries to establish whether child protection plans have been effective.It is possible for an individual child to be de-registered by the same council more than once in the year. In such circumstances each occasion of de-registration should be counted in the numerator.
Guidance/interpretation
[Source - ONS mid year estimates] (2007-08 data uses the latest 2007 mid year estimates)The population aged under 18 in the council area divided by 10,000
2035SC - KIGS CH10: Children whose child protection plans were discontinued, or were de-registered, per 10,000 population aged under 18
Child protection data - child protection procedures
Related measures
Data definition
Rate per 10,000 population to one decimal placeMeasuring unit
The number of plans discontinued, or deregistrations, in the period between 1 April and 31 March.Numerator
This indicator needs to be considered alongside re-registration data (2028SC PAF CF A3 & 2036SC). If children in 2028SC and this indicator overlap, a comparatively high rate of de-registrations, allied with a high rate of re-registrations, would suggest a revolving door policy or practice: that is children’s plans have been discontinued too quickly, before risks have been satisfactorily reduced.Low de-registration and high registration (2027SC) and may be indicative of a risk-averse culture this would lead over time to increases in number of children on the CPR. Comparatively low deregistration figures indicate that child protection plans are not being progressed satisfactorily, which raises questions regarding allocation (2024SC), as well as staffing (6012SC to 6024SC), quality of case working, level of case holding and managerial oversight. Low figures for deregistration could also be linked to a poor outcome on frequency of child protection reviews (2034SC PAF CF/20).
2035SC - KIGS CH10: De-registrations from the child protection register per 10,000 population aged under 18
0
10
20
30
40
50
60
2001-02 2002-03 2003-04 2004-05 2005-06 2006-07 2007-08
LA
SN
Eng
[If you have any queries about this indicator please contact: [email protected] and quote ref: 2035SC]

Staying safeChild protection data - child protection procedures
Kingston Upon Hull
2001-02 2002-03 2003-04 2004-05 2005-06 2006-07 2007-08LA 4.8 6.3 4.1 6.4 12.5 8.6 18.9 . = Data not applicableSN 6.3 5.9 5.6 5.7 5.1 3.6 5.2 .. = Data not availableEng 9.9 8.4 6.7 6.0 5.8 5.8 5.3 - = Data suppressed
due to small numbers
Bands Low High
2001-08 · 0<10 10<15 15<20 20<=100
Data definition
Continued on following page
2036SC - PAF CF/C21: Percentage of children who ceased to be the subject of a child protection plan, or were de-registered, during the year ending 31 March, who had been registered, or the subject of a child protection plan, continuously for two years or more
Guidance/interpretation
Comparatively low deregistration figures indicate that child protection plans are not being progressed satisfactorily, which raises questions regarding allocation (2024SC), as well as staffing (6012SC to 6024SC), quality of case working, level of case holding and managerial oversight. Low figures for deregistration could also be linked to a poor outcome on frequency of child protection reviews (2034SC PAF CF/20).
There is often a close relationship between performance in this indicator and that for re-registrations (2028SC PAF CF/A3). A good (i.e. low) figure for de-registrations may be explained by a poor (i.e. high) figure for re-registrations. If the PAF CF/C21 figure is poor (high), then this may be explained by a poor (low) figure for the timely review of child protection cases (2034SC PAF CF/C20). It is not always clear what an extremely low figure for this indicator means. If children in 2028SC and this indicator overlap, a comparatively high rate of de-registrations, allied with a high rate of re-registrations, would suggest a revolving door policy or practice: that is children’s plans have been discontinued too quickly, before risks have been satisfactorily reduced.
Numbers in the numerator for some councils will be small and the measure may vary significantly from year to year
This indicator tries to establish whether child protection plans have been effective and the extent to which risk is being managed appropriately.Registration should ensure that children who are likely to suffer significant harm are protected and that they and their families are receiving the services necessary to bring about the required changes in the family situation. Professionals, the child and the family should be working towards specified outcomes which should lead to the child's name being taken off the Register within two years.
Percentage to one decimal placeMeasuring unit [Source - CPR3, Table 8, line 7, column 4 (also Table 9]
The number of children deregistered from the Child Protection Register, or who ceased to be the subject of a child protection plan in the period between 1 April and 31 March.This may count a child more than once if they were deregistered more than once during the year.
Denominator [Source - CPR3, Table 8, lines 5 and 6, column 4 (also Table 9)]
Of the children in the denominator, the number who had been on the Register continuously for two years or longer (i.e. for more than 729 days including day of de-registration).
Numerator
2036SC - PAF CF/C21: Duration on the child protection register
0
2
4
6
8
10
12
14
16
18
20
2001-02 2002-03 2003-04 2004-05 2005-06 2006-07 2007-08
%
Unbanded
Very good
Good
Acceptable
Ask questions aboutperformanceInvestigate urgently
SN
Eng
[If you have any queries about this indicator please contact: [email protected] and quote ref: 2036SC]

Staying safeChild protection data - child protection procedures
Kingston Upon Hull
2036SC - PAF CF/C21: Percentage of children who ceased to be the subject of a child protection plan, or were de-registered, during the year ending 31 March, who had been registered, or the subject of a child protection plan, continuously for two years or more
Related measures2023SC KIGS CH01: Children and young people on child protection register per 10,000 population aged under 18 - see p.41
2034SC PAF CF/C20: Reviews of child protection cases (BVPI 162) - see p.492035SC KIGS CH10: De-registrations from the Child Protection Register per 10,000 population aged under 18 - see p.516012SC % of SSD directly employed posts for children and families vacant on 30 September - see p.174
2024SC % of children and young people on the child protection register who are not allocated to a social worker - see p.422027SC KIGS CH03: Child Protection registrations per 10,000 population aged under 18 - see p.442028SC PAF CF/A3: Re-registrations on the Child Protection Register - see p.45
[If you have any queries about this indicator please contact: [email protected] and quote ref: 2036SC]

STAYING SAFELooked after children and care leavers data

Staying safeLooked after children and care leavers data
Kingston Upon Hull
2001-02 2002-03 2003-04 2004-05 2005-06 2006-07 2007-08LA 98.0 105.2 98.1 89.4 97.6 94.2 98.5 . = Data not applicableSN 76.8 78.5 76.5 77.1 73.8 75.1 74.1 .. = Data not availableEng 53.5 54.7 55.2 55.1 54.6 54.6 54.1 - = Data suppressed
due to small numbers
Data definition
Continued on following page
[Source - ONS mid year estimates] (2007-08 data uses the latest 2007 mid year estimates)
2042SC - KIGS CH39: Looked after children per 10,000 population aged under 18
This is an indicator intended to provide context for all indicators relating to looked after children and to provide some relative data on thresholds for LAC.Differences between council's rates will often reflect differences in deprivation between councils. Rates may also reflect differences in the age structure of the under 18 population between councils. Rates may be notably higher for councils that have a significant number of unaccompanied asylum seeker children looked after.Placement data is pertinent here, especially the percentage of children looked after who are placed with parents, or fostered by relatives and friends.
Guidance/interpretation
Rate per 10,000 to one decimal placeMeasuring unit
It is also important to consider the profile of the LAC population as high numbers can also suggest that young people are not being forced to leave care prematurely at 16. Conversely low numbers may indicate young people are leaving care prematurely.
There are no 'good' or 'bad' figures for this indicator, only rates relative to comparator groups and relative to the needs of children living in the council area.If numbers of LAC are significantly lower than comparators, it may indicate that thresholds for becoming looked after are too high, leaving some children inadequately protected. If the overall number of LAC is significantly lower than comparators and the rates of children with child protection plans (2023SC), as well as numbers of children in need, are higher, this suggests that tight gate keeping processes are in place, risk is well managed, and children supported in their communities. If the overall number of LAC is significantly higher than comparators this suggests ineffective gate keeping and /or delays in care plans being progressed. This needs to be considered, though, with data on timescales for LAC reviews (2064SC PAF CF/C68), adoptions (2058SC, 2059SC PAF CF/C23), staffing data (2024SC; 6012SC) as well as the sufficiency of the support/preventative services (6009SC, 6010SC PAF CF/E44).
Traffic lights have not been applied to this indicator
Numerator
The population aged under 18 in the council area divided by 10,000Denominator [Source - SSDA903]
The total number of children who were looked after at 31 March 2008, excluding any children who were looked after on that date under an agreed series of short term-placements (legal status codes V3 and V4) (under the provisions of Reg. 13 of the Arrangement for Placement of Children (General) Regulations, 1991).
2042SC - KIGS CH39: Looked after children per 10,000 population aged under 18
0
20
40
60
80
100
120
2001-02 2002-03 2003-04 2004-05 2005-06 2006-07 2007-08
LA
SN
Eng
[If you have any queries about this indicator please contact: [email protected] and quote ref: 2042SC]

Staying safeLooked after children and care leavers data
Kingston Upon Hull
2042SC - KIGS CH39: Looked after children per 10,000 population aged under 18
2060SC % of looked after children with a named social worker who is qualified as a social worker - see p.692064SC PAF CF/C68: Timeliness of reviews of children looked after - see p.57
2058SC The % of looked after children adopted during the year who were placed for adoption within 12 months of their best interest decision being made - see p.662059SC PAF CF/C23: Adoptions of children looked after (BVPI 163) - see p.67
Related measures2023SC KIGS CH01: Children and young people on child protection register per 10,000 population aged under 18 - see p.41
2068SC PAF CF/B79: % of children aged at least 10 and under 16 who were in foster placements or placed for adoption - see p.64
6022SC KIGS EX62: Gross expenditure on children looked after per capita aged under 18 - see p.167
6009SC KIGS EX77: Expenditure on family support services per capita aged under 18 - see p.1646010SC PAF CF/E44: Relative spend on family support - see p.1656012SC % of SSD directly employed posts for children and families vacant on 30 September - see p.174
[If you have any queries about this indicator please contact: [email protected] and quote ref: 2042SC]

Staying safeLooked after children and care leavers data
Kingston Upon Hull
2005-06 2006-07 2007-08 Data is not banded for 2005-06LA 17 54 96 . = Data not applicableSN 81 85 92 .. = Data not availableEng 79 85 90 - = Data suppressed
due to small numbers
Bands Low High
2006-08 0<80 80<85 85<90 90<95 95<=100
Data definition
Continued on following page
2064SC - PAF CF/C68: Percentage of looked after children cases which should have been reviewed during the year that were reviewed on time during the year
Percentage as a whole number
[Source - SSDA903]
Of the children in the denominator, the number of children whose cases had been reviewed (in accordance with the Review of Children's Cases Regulations 1991) so that:* the first review of the year was held within 183 days of the last review in the previous year (or within 91 days if the previous review was the child's initial review, or within four weeks of the child becoming looked after if there was no review in the previous year)* the maximum gap between 'six month' reviews during the year was 183 days * a review was held within 183 days of the year end (i.e. after 29 September)Do not count the first day a child starts to be looked after as a day in care, e.g. a child starts to be looked after on 02/04/07 and has a review on 20/04/07 – this is a gap of 18 days.The areas for consideration in children looked after reviews are set out in the schedules attached to the Review regulations; these include general considerations as well as education and health.
Numerator
Measuring unit[Source - SSDA903]
The total number of children who were looked after at 31 March 2008, excluding any children who were looked after on that date under an agreed series of short term-placements (legal status codes V3 and V4) (under the provisions of Reg. 13 of the Arrangement for Placement of Children (General) Regulations, 1991).
Denominator
2064SC - PAF CF/C68: Timeliness of reviews of looked after children
0
20
40
60
80
100
120
2005-06 2006-07 2007-08
%
Unbanded
Very good
Good
Acceptable
Ask questions aboutperformanceInvestigate urgently
SN
Eng
[If you have any queries about this indicator please contact: [email protected] and quote ref: 2064SC]

Staying safeLooked after children and care leavers data
Kingston Upon Hull
2064SC - PAF CF/C68: Percentage of looked after children cases which should have been reviewed during the year that were reviewed on time during the year
4015SC PAF CF/C18: Final warnings/reprimands and convictions of children looked after - see p.1314016SC PAF CF/C63: Participation of looked after children in reviews - see p.133
2068SC PAF CF/B79: % of children aged at least 10 and under 16 who were in foster placements or placed for adoption - see p.643072SC PAF CF/A2: Educational qualifications of children looked after [joint working] (BVPI 50) - see p.1103073SC The % of young people leaving care aged 16 or over with 5 or more GCSEs at grade A*-C or GNVQ equivalent - see p.1123074SC PAF CF/C24: Children looked after absent from school [joint working] - see p.114
Delays in LAC reviews affect care planning and may allow some children to ‘drift’ in care. Poor timeliness of LAC reviews may affect numbers of adoption orders made, timescales for placement for adoption, placement stability and may impact on keeping numbers of LAC high. Underlying reasons for delays need to be explored. These may include problems with the review system, such as insufficient independent review chairs, or a high real number of unallocated LAC cases.The scheduling of first reviews sometimes are not in the domain of the Independent Review Team, but rather with the locality or specialist teams; this can affect adversely timescales in relation to initial reviews.Consideration should also be given to indicators on reviews (4016SC PAF CF/C63), adoption (2059SC PAF CF/C23), health (1037SC PAF CF/C19), placement (2043SC PAF CF/A1, 2067SC PAF CF/D78, 2068SC PAF CF/B79), education (3072SC PAF CF/A2, 3073SC, 3074SC) and offending (4015SSC PAF CF/C18).
Related measures1037SC PAF CF/C19: Health of looked after children - see p.26
This indicator seeks to use reviews as a proxy for the measurement of the effectiveness of the monitoring of the care of looked after children and as a proxy outcome measure. Reviews are a key element in delivering a successful care plan. The review looks at the child’s progress to date and plans for the future. Effective and timely reviews should ensure that the care plan remains appropriate for the child and that the needs of the child are well met.
Guidance/interpretation
High figures indicate good performance and low figures indicate poor performance. With councils that do not score highly, consideration should be given to whether there is any pattern to the reviews that are out of time, which indicates systemic difficulties in the way that reviews are resourced and managed. Managers need to ensure that the recommendations reached at reviews are actioned so that the best possible outcome is achieved for the young person.
There is a statutory obligation to review the cases of looked after children, first within 28 days of their becoming looked after, then within a further three months, and subsequently at intervals of no more than six months until they cease to be looked after. The timeliness of the reviews, then, relates not just to the gap between reviews, but also to the start of the period of care itself. In 2004-05 data was collected on the timeliness of the latest review of those children looked after at 31 March. From 2005-06 onwards the indicator was defined to look at all the relevant reviews for a child looked after at 31 March, including ones in the previous year which establish the time frame for when reviews should occur.The denominator consists of the number of looked after children who qualify and who were looked after at March 31. It does not consist of the number of reviews of those children in the preceding year. If a child looked after at 31 March 2008 had more than one review in 2007-08 which meet the criteria for inclusion, the child is counted once in the denominator. The numerator counts only those children, from the denominator, all of whose reviews in the year were carried out within the specified time limit. If a child had two reviews within the timescale and one review outside of the timescale, the child would be excluded from the numerator as a result of the one review out of time.
2042SC KIGS CH39: Children looked after per 10,000 population aged under 18 - see p.552043SC PAF CF/A1: Stability of placements of children looked after (BVPI 49) - see p.592059SC PAF CF/C23: Adoptions of children looked after (BVPI 163) - see p.672060SC % of looked after children with a named social worker who is qualified as a social worker - see p.69
[If you have any queries about this indicator please contact: [email protected] and quote ref: 2064SC]

Staying safeLooked after children and care leavers data
Kingston Upon Hull
2004-05 2005-06 2006-07 2007-08LA 15 16 13 13 . = Data not applicableSN 13 13 13 13 .. = Data not availableEng 13 12 12 11 - = Data suppressed
due to small numbers
Bands High
2004-08 0<16.01 · . 16.01<20 20<=100
Data definition
Continued on following page
2043SC - PAF CF/A1: Percentage of looked after children at 31 March with three or more placements during the year (BVPI 49)
Most councils seem to have been successful in their efforts to keep within the limits of the highest banding (less than 16.01%). Questions still need to be asked, however, about adequate and appropriate placement choices, especially where figures are comparatively low. Indicators on which PAF CF/A1 may have an impact, and vice versa, are: placement type, distance from home, reviews, allocation and education.
Guidance/interpretation
Percentage as a whole number Measuring unit [Source - SSDA903]
The total number of children who were looked after at 31 March, excluding any children who were looked after on that date under an agreed series of short term-placements (legal status codes V3 and V4) (under the provisions of Reg. 13 of the Arrangement for Placement of Children (General) Regulations, 1991).
Denominator
High figures for this indicator were, by 2006-07, relatively rare. Where they do occur, high percentages of children with 3 or more placements may suggest: that children are being placed inappropriately in placements which do not match their needs; insufficient range and number of foster carers to meet demand; lack of appropriate support to children and /or to foster carers, poor care planning and poor assessments.
This indicator is an important measure of the stability of care that a child has experienced. On the whole stability is associated with better outcomes - placement instability has been highlighted by the Social Exclusion Unit as a key barrier to improving educational outcomes. Proper assessment of a child’s needs and an adequate choice of placements to meet the varied needs of different children are essential if appropriate stable placements are to be made. Inappropriate placements often break down and lead to frequent moves. The circumstances of some individual children will require 3 or more separate placements during a year if they are to be kept safe.
[Source - SSDA903]
Of the children looked after in the denominator, the number who had three or more separate placements (as defined by the SSDA903 collection) during the year. All placements of 24 hours or more are counted, regardless of duration. Please see 2007-08 Annual Performance Assessment (APA) indicators for full details of inclusions and exclusions.http://www.dfes.gov.uk/datastats1/guidelines/children/pdf/APA%20Definitions%20for%202008.pdf
Numerator
2043SC - PAF CF/A1: Stability of placements of looked after children
0
2
4
6
8
10
12
14
16
18
2004-05 2005-06 2006-07 2007-08
%
Unbanded
Very good
Good
Acceptable
Ask questions aboutperformanceInvestigate urgently
SN
Eng
[If you have any queries about this indicator please contact: [email protected] and quote ref: 2043SC]

Staying safeLooked after children and care leavers data
Kingston Upon Hull
2043SC - PAF CF/A1: Percentage of looked after children at 31 March with three or more placements during the year (BVPI 49)
Related measures1037SC PAF CF/C19: Health of looked after children - see p.26
2068SC PAF CF/B79: % of children aged at least 10 and under 16 who were in foster placements or placed for adoption - see p.64
2052SC KIGS CH44: % of children looked after in residential accommodation - see p.622059SC PAF CF/C23: Adoptions of children looked after (BVPI 163) - see p.672060SC % of looked after children with a named social worker who is qualified as a social worker - see p.692064SC PAF CF/C68: Timeliness of reviews of children looked after - see p.572067SC PAF CF/D78: Long term stability of children looked after - see p.61
3085SC PAF CF/C69: Distance children newly looked after are placed from home - see p.1064016SC PAF CF/C63: Participation of looked after children in reviews - see p.133
3071SC The % of children looked after who were pupils in year 11 who were eligible for GCSE (or equivalent) examinations who sat at least one GCSE or equivalent exam - see p.1083072SC PAF CF/A2: Educational qualifications of children looked after [joint working] (BVPI 50) - see p.1103073SC The % of young people leaving care aged 16 or over with 5 or more GCSEs at grade A*-C or GNVQ equivalent - see p.1123074SC PAF CF/C24: Children looked after absent from school [joint working] - see p.114
[If you have any queries about this indicator please contact: [email protected] and quote ref: 2043SC]

Staying safeLooked after children and care leavers data
Kingston Upon Hull
2003-04 2004-05 2005-06 2006-07 2007-08 This indicator does not have bandingLA 62.1 56.1 59.0 58.1 69.2 . = Data not applicableSN 63.6 63.8 68.8 66.8 66.3 .. = Data not availableEng 64.3 63.0 64.8 65.9 66.5 - = Data suppressed
due to small numbers
Data definition
It has become apparent recently that the data Ofsted has been using for this indicator does not exactly match the definition that has published since the indicator’s inception. Ofsted’s specification, in the numerator, was for the inclusion of all children placed for adoption, regardless of how long they were looked after. The data provided includes children placed for adoption only if they have been looked after for at least two and a half years. Consequently the data resulting from the two definitions are different for a large number of local authorities.Ofsted have decided to keep the data that appears in the APA toolkit for 2007-08 unchanged. To republish the data as originally conceived would mean it would become a different indicator for most local authorities. Keeping the situation unchanged allows continuity in assessment from last year to this.
2067SC - PAF CF/D78: Percentage of children aged under 16 at March 31 who had been looked after continuously for at least 2 1/2 years, who had lived in the same placement for at least two years, or were placed for adoption
2059SC PAF CF/C23: Adoptions of children looked after (BVPI 163) - see p.672068SC PAF CF/B79: % of children aged at least 10 and under 16 who were in foster placements or placed for adoption - see p.64
This indicator has replaced PAF CF/D35 as a measure indicating long-term stability. Preliminary research has shown it to be of more practical value to social work staff operationally than its predecessor.
Guidance/interpretation
Percentage to one decimal place
2043SC PAF CF/A1: Stability of placements of children looked after (BVPI 49) - see p.59
Generally, a high figure is an indicator of good performance and a low one of poor performance, though comparator data is important to consider here, as with most indicators.Poor outcome on long term stability (a low rate) suggest: insufficient support to young people and/or foster carers; insufficient range and number of placements; too many placements ‘over numbers’; lack of placement planning around permanence; lack of available long-term foster carers; difficulties in retaining foster carers. The age profile of the looked after population is important with high numbers of teenagers looked after posing a particular problem for this indicator.A high figure for 2059SC CF/PAF C23 or for 2034SC CF/PAF A1 is likely to adversely affect this indicator. Conversely a low figure for PAF C23 and PAF A1 is likely to see a higher figure for PAF D78.
Related measures
Measuring unit
[Source - SSDA903]
Of those in the denominator, the number who were in their current placement, for at least 2 years (i.e. for strictly more than 729 days inclusive of 31 March) or are placed for adoption (placement codes A3, A4, A5 and A6) on 31 March. Children who are placed for adoption at 31 March are to be included in the numerator regardless of how long they have been placed for adoption or how long they have been looked after.
Numerator
[Source - SSDA903]
Exclude children who had been looked after at any time during the 2.5 year period under an agreed series of short term-placements (legal status codes V3 and V4) (under the provisions of Reg. 13 of the Arrangement for Placement of Children (General) Regulations, 1991).
All children aged under 16 on 31 March of the year of measurement who had been looked after for 2.5 years or more (i.e. for more than 911 days inclusive of 31 March) on 31 March of the year of measurement.
Denominator
2067SC - PAF CF/D78: Long term stability of looked after children
0
10
20
30
40
50
60
70
80
2003-04 2004-05 2005-06 2006-07 2007-08
%
Unbanded
Very good
Good
Acceptable
Ask questions aboutperformanceInvestigate urgently
SN
Eng
[If you have any queries about this indicator please contact: [email protected] and quote ref: 2067SC]

Staying safeLooked after children and care leavers data
Kingston Upon Hull
2001-02 2002-03 2003-04 2004-05 2005-06 2006-07 2007-08LA 19.3 15.2 12.8 11.8 10.5 11.1 10.6 . = Data not applicableSN 15.6 15.2 13.7 14.3 13.7 12.8 12.1 .. = Data not availableEng 16.1 15.7 15.6 15.5 14.9 14.9 14.7 - = Data suppressed
due to small numbers
Data definition
2052SC - KIGS CH44: Percentage of looked after children in residential accommodation
Related measures
Low numbers of young people in residential care, however, may mean that some young people leave care too early (i.e. at 16) or that the council has some specialist fostering schemes that cater successfully for teenagers. High numbers, if placed with independent providers, suggest a system under pressure affected by: poor foster placement stability; lack of appropriate gate keeping; and poor care planning. This measure may be affected by the age structure of the council's looked after children - the older the group, the more likely this measure will be higher; the younger the group, the more likely that it will be lower.Included in this indicator are children with very complex needs in residential placements and boarding schools. If the indicator is high, some consideration should be made as to the extent to which looking after of this group of children, which constitutes good practice, affects the total figure. Conversely, a low figure may indicate poor practice in relation to this group of children, because their needs may not be being adequately met.This indicator should be considered with other placement data (2054SC, 2068SC PAF CF/B79).
This indicator is intended to establish the extent to which residential placements, which current good practice consider to be suitable only for a relatively small percentage of children, are used by the council, particularly in relation to their comparators.A low figure is considered good performance and a high figure, especially a very high figure, poor performance.
Percentage to one decimal placeMeasuring unit [Source - SSDA903]
Numerator
The total number of children looked after at 31 March 2008 excluding any children placed with parents (placement code P1) or who were looked after on that date under an agreed series of short term placements (legal status codes V3 and V4).
Denominator
Traffic lights have not been applied to this indicator
[Source - SSDA903]
Of the children in the denominator, the number of children who were looked after in residential accommodation (placement codes H1, H2, H3, H4, H5, R1, R2, R3, R5 and S1).
2068SC PAF CF/B79: % of children aged at least 10 and under 16 who were in foster placements or placed for adoption - see p.64
2042SC KIGS CH39: Children looked after per 10,000 population aged under 18 - see p.552054SC % of looked-after children fostered by relatives or friends - see p.63
Guidance/interpretation
2052SC - KIGS CH44: % of looked after children in residential accommodation
0
5
10
15
20
25
2001-02 2002-03 2003-04 2004-05 2005-06 2006-07 2007-08
%
LA
SN
Eng
[If you have any queries about this indicator please contact: [email protected] and quote ref: 2052SC]
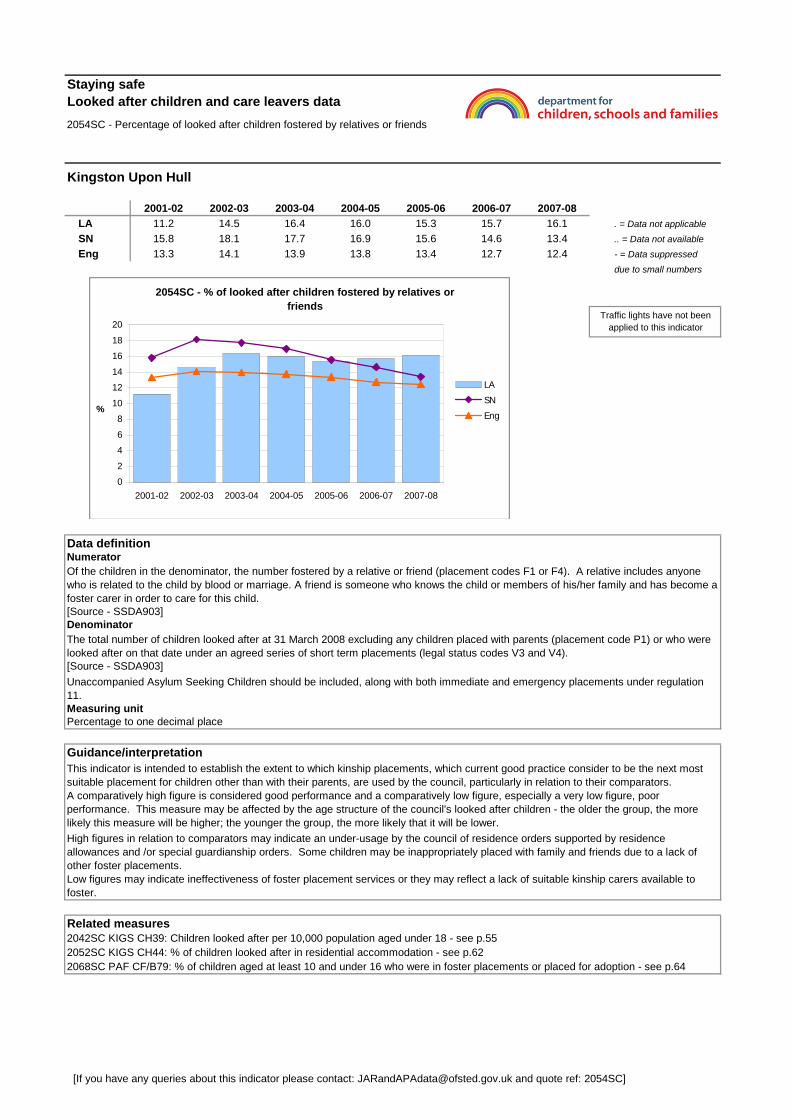
Staying safeLooked after children and care leavers data
Kingston Upon Hull
2001-02 2002-03 2003-04 2004-05 2005-06 2006-07 2007-08LA 11.2 14.5 16.4 16.0 15.3 15.7 16.1 . = Data not applicableSN 15.8 18.1 17.7 16.9 15.6 14.6 13.4 .. = Data not availableEng 13.3 14.1 13.9 13.8 13.4 12.7 12.4 - = Data suppressed
due to small numbers
Data definition
2054SC - Percentage of looked after children fostered by relatives or friends
Unaccompanied Asylum Seeking Children should be included, along with both immediate and emergency placements under regulation 11.
[Source - SSDA903]
Numerator
The total number of children looked after at 31 March 2008 excluding any children placed with parents (placement code P1) or who were looked after on that date under an agreed series of short term placements (legal status codes V3 and V4).
Denominator [Source - SSDA903]
Of the children in the denominator, the number fostered by a relative or friend (placement codes F1 or F4). A relative includes anyone who is related to the child by blood or marriage. A friend is someone who knows the child or members of his/her family and has become a foster carer in order to care for this child.
Traffic lights have not been applied to this indicator
Percentage to one decimal placeMeasuring unit
2068SC PAF CF/B79: % of children aged at least 10 and under 16 who were in foster placements or placed for adoption - see p.64
High figures in relation to comparators may indicate an under-usage by the council of residence orders supported by residence allowances and /or special guardianship orders. Some children may be inappropriately placed with family and friends due to a lack of other foster placements.Low figures may indicate ineffectiveness of foster placement services or they may reflect a lack of suitable kinship carers available to foster.
This indicator is intended to establish the extent to which kinship placements, which current good practice consider to be the next most suitable placement for children other than with their parents, are used by the council, particularly in relation to their comparators.A comparatively high figure is considered good performance and a comparatively low figure, especially a very low figure, poor performance. This measure may be affected by the age structure of the council's looked after children - the older the group, the more likely this measure will be higher; the younger the group, the more likely that it will be lower.
Guidance/interpretation
2052SC KIGS CH44: % of children looked after in residential accommodation - see p.62
Related measures2042SC KIGS CH39: Children looked after per 10,000 population aged under 18 - see p.55
2054SC - % of looked after children fostered by relatives or friends
0
2
4
6
8
10
12
14
16
18
20
2001-02 2002-03 2003-04 2004-05 2005-06 2006-07 2007-08
%
LA
SN
Eng
[If you have any queries about this indicator please contact: [email protected] and quote ref: 2054SC]

Staying safeLooked after children and care leavers data
Kingston Upon Hull
2003-04 2004-05 2005-06 2006-07 2007-08 This indicator does not have bandingLA 80.4 81.3 81.6 83.3 82.9 . = Data not applicableSN 78.6 78.2 80.9 82.3 83.3 .. = Data not availableEng 77.5 78.5 79.7 80.7 81.7 - = Data suppressed
due to small numbers
Data definition
Continued on following page
2068SC - PAF CF/B79: Percentage of children aged at least 10 and under 16 looked after at 31 March (excluding those placed with parents) who were in foster placements or placed for adoption
Measuring unit [Source - SSDA903]
The total number of children aged at least 10 and under 16 at 31 March 2008 who were looked after at 31 March 2008, excluding any children placed with parents (SSDA placement code P1) or who were looked after on that date under an agreed series of short term-placements (legal status codes V3 and V4) (under the provisions of Reg. 13 of the Arrangement for Placement of Children (General) Regulations, 1991).
Denominator [Source - SSDA903]
Of the children aged at least 10 and under 16 looked after at 31 March 2008 (excluding those placed with parents) the percentage who were in foster placements or placed for adoption.
Numerator
This indicator is intended to establish the extent to which foster care and placed for adoption placements, which current good practice consider to be suitable for the majority of children, are used by the council, particularly in relation to their comparators. It measures placement type as a proxy for good placement choice and for the appropriateness of the placements chosen.Most children’s needs are such that they will make better developmental progress in family settings rather than in residential care, although for a minority of children residential care will continue to offer the best solution. In most cases, caring for children in family settings also costs less than residential care.
Guidance/interpretation
Percentage to one decimal place
This indicator is a refined version of PAF B7, which looked at children of all ages, rather than this age group. Since most children under 10 have been, for some years, placed with either foster parents or prospective adopters, it was decided to focus on older children: the group more likely to go into residential care. The CSCI document 'Children_PIs_2006-07.doc' has the full rationale for the change to PAF B79 from PAF B7.http://www.csci.org.uk/Docs/children_PIs_2006-07.doc
High figures are an indicator of good performance and low figures of poor performance. A higher value indicates both a better outcome and a more efficient one, subject to placing children with parents (under care orders) where appropriate and providing residential care for the minority of children for whom this is best. A very high figure, however, raises questions because it is likely that there will always be some children needing some form of residential care.Consideration should also be given to data on placements (2034SC CF/PAF A1, 2052SC, 2054SC, 2058SC, 2059SC CF/PAF C23, 2067SC PAF CF/D78) , reviews (2064SC PAF CF/C68), distance from home (3085SC PAF CF/C69) and unit costs (6024SC PAF CF/B8).
2068SC - PAF CF/B79: Children aged at least 10 and under 16 looked after in foster placements or placed for adoption
0
10
20
30
40
50
60
70
80
90
2003-04 2004-05 2005-06 2006-07 2007-08
%
Unbanded
Very good
Good
Acceptable
Ask questions aboutperformanceInvestigate urgently
SN
Eng
[If you have any queries about this indicator please contact: [email protected] and quote ref: 2068SC]

Staying safeLooked after children and care leavers data
Kingston Upon Hull
2068SC - PAF CF/B79: Percentage of children aged at least 10 and under 16 looked after at 31 March (excluding those placed with parents) who were in foster placements or placed for adoption
2042SC KIGS CH39: Children looked after per 10,000 population aged under 18 - see p.552043SC PAF CF/A1: Stability of placements of children looked after (BVPI 49) - see p.592052SC KIGS CH44: % of children looked after in residential accommodation - see p.622054SC % of looked-after children fostered by relatives or friends - see p.63
Related measures
3085SC PAF CF/C69: Distance children newly looked after are placed from home - see p.1066024SC PAF CF/B8: Cost of services for children looked after - see p.168
2058SC The % of looked after children adopted during the year who were placed for adoption within 12 months of their best interest decision being made - see p.662059SC PAF CF/C23: Adoptions of children looked after (BVPI 163) - see p.672064SC PAF CF/C68: Timeliness of reviews of children looked after - see p.572067SC PAF CF/D78: Long term stability of children looked after - see p.61
[If you have any queries about this indicator please contact: [email protected] and quote ref: 2068SC]

Staying safeLooked after children and care leavers data
Kingston Upon Hull
2001-02 2002-03 2003-04 2004-05 2005-06 2006-07 2007-08LA 73 72 77 72 79 90 80 . = Data not applicableSN 84 84 82 86 84 83 85 .. = Data not availableEng 80 81 79 81 77 77 76 - = Data suppressed
due to small numbers
Data definition
2058SC - Percentage of looked after children adopted during the year who were placed for adoption within 12 months of the agency deciding that the child should be placed for adoption
[Source - SSDA903]
The number of children included in the denominator who were placed for adoption (placement codes A3, A4, A5 and A6) within 12 months (i.e. less than 365 days, inclusive of date child was placed for adoption) of the decision that they should be placed for adoption. This figure excludes children who were placed within 12 months of the decision that they should be placed for adoption, but whose placement for adoption broke down before being adopted.
2068SC PAF CF/B79: % of children aged at least 10 and under 16 who were in foster placements or placed for adoption - see p.64
Related measures2059SC PAF CF/C23: Adoptions of children looked after (BVPI 163) - see p.67
Guidance/interpretation
Timescales for placing children for adoption will be affected by how easy or difficult it is to place them. Older children with more complex needs will take longer to place, as will sibling groups, disabled children and children from black and ethnic minority groups. It is important to ensure that councils are not achieving a good outcome on timescales by only making adoption decisions for younger children and/or those with less complex needs.Delays in placing children for adoption will also occur due to: insufficient in-house adopters; lack of funding to purchase external adoptive placements; poor care planning; or court delays.Numbers in the numerator for some councils will be small and the measure may vary significantly from year to year; this could have an impact on the figure which indicates volatility, where really there is none.
Local information should be available to assess how often adoption was not the outcome once a decision had been reached to place the child for adoption.
This indicator is intended to show the effectiveness of an important part of the adoption process.A high figure is good performance and a low one poor performance.
Traffic lights have not been applied to this indicator
Percentage as a whole number Measuring unit [Source - SSDA903]
Numerator
The number of children who ceased to be looked after during the year ending 31 March as a result of the granting of an adoption order (reason episode ceased codes E11 and E12). Includes only those children who were adopted after having been looked after by the authority immediately prior to adoption. Children placed for adoption or freed for adoption remain looked after until the adoption order is granted.
Denominator
2058SC - % adopted during the year & placed for adoption within 12 months of adoption decision
0
10
20
30
40
50
60
70
80
90
100
2001-02 2002-03 2003-04 2004-05 2005-06 2006-07 2007-08
%
LA
SN
Eng
[If you have any queries about this indicator please contact: [email protected] and quote ref: 2058SC]

Staying safe
Kingston Upon Hull
2005-06 2006-07 2007-08LA 6.0 8.0 7.6 . = Data not applicableSN 8.4 8.9 8.8 .. = Data not availableEng 7.6 8.3 8.8 - = Data suppressed
due to small numbers
Bands Low High
2005-08 0<3 3<6 6<7 7<8 8<25 · · 25<=100 ·
Continued on following pagePercentage to one decimal place
Looked after children and care leavers data
Data definition
The number of children who ceased to be looked after during the year as a result of the granting of an adoption order excluding any unaccompanied asylum seeking children (counting only those children who were adopted after having been looked after by the council immediately prior to adoption). From 2005-06 onward, children ceasing to be looked after as a result of the granting of a special guardianship order should also be included. Children placed for adoption or freed for adoption remain looked after until the adoption order is granted.
Numerator
2059SC - PAF CF/C23: Number of looked after children adopted during the year as a percentage of the number of looked after children at 31 March (excluding unaccompanied asylum seekers) who had been looked after for six months or more on that day (BVPI 163)
[Source - SSDA903]
The total number of children who were looked after at 31 March and who at that date had been looked after for 6 months or more (i.e. 183 or more days inclusive of 31 March), excluding any unaccompanied asylum seeking children and children who were looked after on that date under an agreed series of short term placements (under the provisions of Reg. 13 of the Arrangement for Placement of Children (General) Regulations, 1991).
Denominator
Asylum seeker children were excluded from the denominator, from 2002-03 on, along with all children looked after for less than 6 months.Measuring unit
[Source - SSDA903]
2059SC - PAF CF/C23: Adoptions of looked after children (BVPI 163)
0
1
2
3
4
5
6
7
8
9
10
2005-06 2006-07 2007-08
%
Unbanded
Very good
Good
Acceptable
Ask questions aboutperformanceInvestigate urgently
SN
Eng
[If you have any queries about this indicator please contact: [email protected] and quote ref: 2059SC]

Staying safe
Kingston Upon Hull
Looked after children and care leavers data2059SC - PAF CF/C23: Number of looked after children adopted during the year as a percentage of the number of looked after children at 31 March (excluding unaccompanied asylum seekers) who had been looked after for six months or more on that day (BVPI 163)
3085SC PAF CF/C69: Distance children newly looked after are placed from home - see p.106
Consideration should be given to the age at adoption, as older children with more complex needs are more difficult to place, as are sibling groups, disabled children and children from black and ethnic minority groups. Other factors worth considering are the proportion of placements for adoption ending in adoption; the trend in numbers of children looked after for more than 6 months; the numbers of children returning to own families; the numbers of children looked after for fairly short periods; the number of adoption breakdowns and the numbers of special guardianship orders in the relevant council.
This is a complex indicator. Very important contextual data for this indicator is the actual trend in numbers of adoptions in each council. This is because an improvement in numbers of adoptions is not always evident in the final indicator value. Small numbers in this indicator can also lead to some variability in the indicator value year on year. This volatility means, therefore, that the data needs to be treated with some caution.
This indicator is designed to give some data on the effectiveness of the end of the adoption procedure and seeks to encourage the use of adoption.For most children the best place to grow up is with their birth parents. Where this is not possible, society has a clear responsibility to provide children with stability and permanence in their lives. The Government believes that more can and should be done to promote the wider use of adoption which offers the only legally secure placement for children unable to return to their birth families. This does not mean that adoption is appropriate for more than a minority of children.
Guidance/interpretation
2064SC PAF CF/C68: Timeliness of reviews of children looked after - see p.57
2058SC The % of looked after children adopted during the year who were placed for adoption within 12 months of their best interest decision being made - see p.66
2067SC PAF CF/D78: Long term stability of children looked after - see p.612068SC PAF CF/B79: % of children aged at least 10 and under 16 who were in foster placements or placed for adoption - see p.64
2043SC PAF CF/A1: Stability of placements of children looked after (BVPI 49) - see p.592042SC KIGS CH39: Children looked after per 10,000 population aged under 18 - see p.55Related measures
A high figure is, generally, considered good performance and a low figure poor performance. Comparatively low rate of adoptions may suggest: delays in permanency planning and care planning; failure to consider adoption as an option for every child not returning to parents; insufficient adopters to meet need, lack of interagency budget to purchase placements outside the council; court delays. The figures may be low, though, because of the prevalence of factors, already discussed, which can militate against a higher score, but over which the council has little of no influence.A very high figure, particularly sustained over some years, should prompt further enquiry. It may be the result from the prevalence of factors assisting a council to achieve a high figure, but it may also be a result of a council placing children inappropriately.Consideration should also be given to other indicators on adoption (2058SC), placement (2043SC PAF CF/A1, 2067SC PAF CF/D78, 2068SC PAF CF/B79), distance from home (3085SC PAF CF/C69).
[If you have any queries about this indicator please contact: [email protected] and quote ref: 2059SC]

Staying safeLooked after children and care leavers data
Kingston Upon Hull
2001-02 2002-03 2003-04 2004-05 2005-06 2006-07 2007-08LA 99.6 98.3 79.9 73.9 100.0 100.0 100.0 . = Data not applicableSN 94.4 95.0 95.7 96.4 96.4 96.1 99.1 .. = Data not availableEng 97.3 97.3 92.6 93.4 94.8 95.5 97.0 - = Data suppressed
due to small numbers
Data definition
Continued on following page
Traffic lights have not been applied to this indicator
2060SC - Percentage of looked after children with a named social worker who is qualified as a social worker
A high figure indicates good performance and a low figure indicates poor performance.A low number would suggest that further investigation is needed around the number, recruitment, retention, and allocation of social workers. A low number would also raise questions about the use and supervision of unqualified staff (see 6012SC).The consequences of a low figure for this indicator can be quite widespread. It can have an impact, for example, of the stability of placement, through drift and on the timeliness of reviews, when lack of social work input can cause delays (see 2043SC, 2059SC, 2064SC, 2085SC, 4016SC).A high number, coupled with poor recruitment and retention figures or with an increasing volume of looked after work, should also prompt further investigation (see above and 2024SC).
All looked after children should be allocated to a qualified social worker; where direct work with the child is being done by an unqualified worker or social work student, the council should ensure that that person is carefully supervised and the qualified worker has oversight of and control of the care plan, ensuring that statutory requirements are met. Data suggests that most looked after children appear to have a named worker, but inspection suggests that these are not always qualified as social workers.
This indicator tries to use allocation data as a proxy for the measurement of the effectiveness of the interventions provided to children looked after.
Percentage to one decimal placeMeasuring unit [Source - 2001-02 to 2005-06 - CSCI data collection; 2006-08 - Ofsted data collection]
Numerator
The number of children looked after at March 31 (excluding those looked after on that date under an agreed series of short term-placements (under the provisions of Reg. 13 of the Arrangement for Placement of Children (General) Regulations, 1991).
Denominator [Source - 2001-02 to 2005-06 - CSCI data collection; 2006-08 - Ofsted data collection]
The number of those children in the denominator who have a named social worker, who is qualified as a social worker, other than a team leader.
Guidance/interpretation
2060SC - % of looked after children with a named social worker who is qualified as a social worker
0
10
20
30
40
50
60
70
80
90
100
2001-02 2002-03 2003-04 2004-05 2005-06 2006-07 2007-08
%
LA
SN
Eng
[If you have any queries about this indicator please contact: [email protected] and quote ref: 2060SC]

Staying safeLooked after children and care leavers data
Kingston Upon Hull
2060SC - Percentage of looked after children with a named social worker who is qualified as a social worker
2064SC PAF CF/C68: Timeliness of reviews of children looked after - see p.573085SC PAF CF/C69: Distance children newly looked after are placed from home - see p.1064016SC PAF CF/C63: Participation of looked after children in reviews - see p.1336012SC % of SSD directly employed posts for children and families vacant on 30 September - see p.174
2043SC PAF CF/A1: Stability of placements of children looked after (BVPI 49) - see p.592059SC PAF CF/C23: Adoptions of children looked after (BVPI 163) - see p.67
2042SC KIGS CH39: Children looked after per 10,000 population aged under 18 - see p.55
Related measures2024SC % of children and young people on the child protection register who are not allocated to a social worker - see p.42
[If you have any queries about this indicator please contact: [email protected] and quote ref: 2060SC]

STAYING SAFEChildren with learning difficulties and/or disabilities data

Staying safeChildren with learning difficulties and/or disabilities data
Kingston Upon Hull
Possible responses:
1 - less than 50%2 - up to 75%3 - up to 90%4 - over 90%
LA response:2004-05 4 - over 90% . = Data not applicable2005-06 4 - over 90% .. = Data not available2006-07 4 - over 90%2007-08 5 - 100%
Percentage of SN & England responses (LA's response is highlighted)
1 2 3 4 5SN - 2004-05 10 10 40 40 .SN - 2005-06 0 20 30 50 .SN - 2006-07 0 10 20 70 .SN - 2007-08 0 0 20 20 60
Eng - 2004-05 13 25 23 39 .Eng - 2005-06 7 16 25 52 .Eng - 2006-07 3 11 24 63 .Eng - 2007-08 1 6 18 47 28
Data definition1 - less than 50%2 - up to 75%3 - up to 90%4 - over 90%
It should be noted that, for some local authorities, this indicator concerns small numbers of children.
5 - 100% N.B. This response was only available in 2007-08.
Traffic lights have not been applied to this indicator
5026SC - What percentage of children with disabilities aged 14+ had a transition plan to support their move from Children's Services to Adult Services?
5 - 100% N.B. This response was only available in 2007-08.
Guidance/interpretation
This indicator may prompt consideration of the extent to which the council keeps accurate and useful data on children with disabilities to whom they provide services, as well as other children with disabilities who are in need, and the extent to which threshold criteria are clearly thought out. It should also prompt consideration about how well children's and adult's services work together to see that needs of the eligible children are met appropriately.
This indicator only refers to young people in receipt of social care services, not all young people who should have a transition plan. Some children with disabilities receiving services from children’s social care may not meet the threshold criteria to receive services from adult social care raising the question of how their future support needs will be met.
[Source - 2004-05 to 2005-06 - CSCI data collection; 2006-08 - Ofsted data collection]
[If you have any queries about this indicator please contact: [email protected] and quote ref: 5026SC]

ENJOYING AND ACHIEVINGEarly Years and Foundation Stage

ENJOYING AND ACHIEVINGEarly years & foundation stage
Kingston Upon Hull
% of children achieving 78 points or more and 6 points or more in each of the Personal, Social andEmotional (PSE) and Communication, Language and Literacy (CLL) Scales
Year Area Nat2007 35 46
% inequality gapYear Area Nat2007 42 37
CL'sArea 57 0Nat 46 0
Source of data: DCSF Foundation Stage Profile 2007
Statistical Neighbour comparisons have not been given for this indicator, due to areas being at different levels of development with assessing the foundation stage. Assessment and moderation have improved since 2005 and the National Assessment Authority has an action plan to assign support officers to the Local Authorities with less developed moderation processes.
Improvement in young children's development measured by the foundation stage profile
Area NAT
Traffic lights have not been applied to this
indicator
Health warning: The Foundation Stage Profile is a statutory stage of the National Curriculum and measures the achievement of children in the summer term preceding a child's transition to a Key Stage 1 programme of study. The child will usually have reached the age of 5 by this time. This is the first year that schools and early years settings have been under a statutory obligation to send their Local Authorities full data for every individual child for the 13 assessment scales. In previous years, the percentage of children achieving a score of 78 points or more and 6 or more in each of the PSE and CLL scales have been based on a 10 per cent child level sample, which are subject to sampling error.
Data Definition: These data show the percentage of all eligible children on the Foundation Stage Profile in maintained schools and the private,voluntary and independent sectors who achieve a) 78 points or more across the 13 assessment scales and b) 6 points or more in each of the scales relating to the Personal, Social and Emotional (PSE) and Communication Language and Literacy (CLL) areas of learning (the percentage achieving a good level of overall achievement). PSE includes 3 assessment scales: Dispositions and Attitudes, Social Development and Emotional Development; CLL includes 4 scales: Language for Communication and Thinking, Linking Sounds and Letters, Reading and Writing. The remaining 6 assessment scales in the FSP are in Mathematical Development (3 scales), Knowledge and Understanding of the World (1 scale), Physical Development (1 scale) and Creative Development (1 scale). Also shown is the percentage gap in achievement between the mean score for the lowest 20 per cent of achieving children in a local authority, and the score of the median child in the local authority. This is presented as the difference divided by the median to give the inequality gap measuring the extent of under-achievement.
2007 data is based on full data for every individual child.
% Inequality gap between the mean score of the lowest 20% results and
the median
0
10
20
30
40
50
60
% of children achieving 78 points or more and 6 points or more in each of
the PSE and CLL scales
0
10
20
30
40
50
60
70
80
46
If you have any queries about this indicator please contact: [email protected] Please Quote Ref: 3102DE

ENJOYING AND ACHIEVINGKey Stage 1 data

ENJOYING AND ACHIEVINGKS1 data
Kingston Upon Hull
Level 2+ % Trend AnalysisSubject Year Area SN Nat Area SN NatReading 2003 80.94 83.63 84.88 V Level 2+ % Trend
2004 80.27 83.42 85.23 V 03/04 -0.67 -0.21 0.35 National2005 81.13 83.13 85.50 V 04/05 0.86 -0.29 0.27 Statistical Neighbours
2006 79.19 82.65 84.78 U 05/06 -1.93 -0.48 -0.72 2007 75.26 80.80 84.16 V 06/07 -3.93 -1.84 -0.62
Minimum Pupil Count:Maximum Pupil Count:
.. = data not available V = Validated datan/a = not applicable U = Unvalidated data
Level 2+ % APSSubject Year Area SN Nat Subject Year Area SN NatReading 2003 80.9351 83.6267 84.8805 Reading 1998
2004 80.2674 83.4155 85.23 19992005 81.1263 83.1268 85.5019 2000
2006 79.1946 82.6497 84.779 2001 2007 75.2625 80.8048 84.1604 2002 2003
2004
RAI, Ofsted Ref: 3002OF
[Source: DCSF Achievement + Attainment Tables]
Data Definition: The indicator shows the percentage of KS1 pupils who achieve at least level 2 in Reading. Trend: The trend for each year is generated by taking a three point moving average of the LA percentage figures. The rate of change is calculated by fitting a regression line to these moving averages. The rate of change for all 150 LAs are then ranked. The top 10% are classed as 'Well above', the next 20% 'Above', the next 40% 'In line', the next 20% 'Below', the final 10% 'Well below'. Similarly the rate of change for each LAs group of statistical neighbours is calculated and deducted from each LA rate of change. The differences are then ranked, and the same classification is used to compare the LA against their statistical neighbours, as is used in the national calculation. The trend indicates whether the change over time in the LA is greater or less than the change over time for the national or statistical neighbours.
SN NAT
Teacher assessment results on reading: achievement at KS1, level 2+ (all pupils) Ref. 3002OF
Year-on-Year Change
Well Above Above In Line Below Well Below
Area
Health warning: These figures include mainstream maintained schools only (i.e. no special schools or independent schools are included. Therefore figures may be different from DCSF published figures.
Level 2+ Reading
65
70
75
80
85
90
95
100
2003 2004 2005 2006 2007
If you have any queries about this indicator please contact: [email protected] Please Quote Ref: 3002OF

ENJOYING AND ACHIEVINGKS1 data
Kingston Upon Hull
Level 2+ % Trend AnalysisSubject Year Area SN Nat Area SN NatWriting 2003 78.53 81.38 82.67 V Level 2+ % Trend
2004 77.23 81.36 82.93 V 03/04 -1.30 -0.02 0.26 National2005 77.41 81.05 82.75 V 04/05 0.17 -0.31 -0.19 Statistical Neighbours
2006 74.05 79.89 81.71 U 05/06 -3.36 -1.17 -1.03 2007 69.62 77.49 80.68 V 06/07 -4.43 -2.40 -1.03
Minimum Pupil Count:Maximum Pupil Count:
.. = data not available V = Validated datan/a = not applicable U = Unvalidated data
Level 2+ %Subject Year Area SN NatWriting 2003 78.5314 81.3792 82.6723
20034 77.2342 81.3606 82.93092005 77.4061 81.0525 82.745
2006 74.0492 79.8852 81.7119 2007 69.6227 77.4885 80.6823
RAI, Ofsted Ref: 3003OF
Teacher assessment results on writing: achievement at KS1, level 2+ (all pupils) Ref. 3003OF
Year-on-Year Change
Area SN NAT
Below Well Below
Data Definition: The indicator shows the percentage of KS1 pupils who achieve at least level 2 in Writing. Trend: The trend for each year is generated by taking a three point moving average of the LA percentage figures. The rate of change is calculated by fitting a regression line to these moving averages. The rate of change for all 150 LAs are then ranked. The top 10% are classed as 'Well above', the next 20% 'Above', the next 40% 'In line', the next 20% 'Below', the final 10% 'Well below'. Similarly the rate of change for each LAs group of statistical neighbours is calculated and deducted from each LA rate of change. The differences are then ranked, and the same classification is used to compare the LA against their statistical neighbours, as is used in the national calculation. The trend indicates whether the change over time in the LA is greater or less than the change over time for the national or statistical neighbours.
[Source: DCSF Achievement + Attainment Tables]
Health warning: These figures include mainstream maintained schools only (i.e. no special schools or independent schools are included). Therefore figures may be different from DCSF published figures.
Well Above Above In Line
Level 2+ Writing
65
70
75
80
85
90
95
100
2003 20034 2005 2006 2007
If you have any queries about this indicator please contact: [email protected] Please Quote Ref: 3003OF

ENJOYING AND ACHIEVINGKS1 data
Kingston Upon Hull
Level 2+ % Trend AnalysisSubject Year Area SN Nat Area SN NatMaths 2003 87.19 88.20 88.99 V Level 2+ % Trend
2004 86.79 88.60 89.66 V 03/04 -0.40 0.40 0.67 National2005 88.53 90.26 91.39 V 04/05 1.74 1.67 1.72 Statistical Neighbours
2006 86.06 89.23 90.67 U 05/06 -2.48 -1.03 -0.72 2007 84.48 87.75 90.32 V 06/07 -1.57 -1.48 -0.35
Minimum Pupil Count:Maximum Pupil Count:
.. = data not available V = Validated datan/a = not applicable U = Unvalidated data
.. = data not available V = Validated datan/a = not applicable U = Unvalidated data
Level 2+ % APSSubject Year Area SN Nat Subject Year Area SN NatMaths 2003 87.1913 88.1984 88.9895 Maths 1998
2004 86.7906 88.599 89.6615 19992005 88.5324 90.264 91.3851 2000
2006 86.0552 89.2314 90.669 2001 2007 84.4807 87.7479 90.3225 2002 2003
2004
RAI, Ofsted Ref: 3004OF
Data Definition: The indicator shows the percentage of KS1 pupils who achieve at least level 2 in Mathematics. Trend: The trend for each year is generated by taking a three point moving average of the LA percentage figures. The rate of change is calculated by fitting a regression line to these moving averages. The rate of change for all 150 LAs are then ranked. The top 10% are classed as 'Well above', the next 20% 'Above', the next 40% 'In line', the next 20% 'Below', the final 10% 'Well below'. Similarly the rate of change for each LAs group of statistical neighbours is calculated and deducted from each LA rate of change. The differences are then ranked, and the same classification is used to compare the LA against their statistical neighbours, as is used in the national calculation. The trend indicates whether the change over time in the LA is greater or less than the change over time for the national or statistical neighbours.
Area SN NAT
[Source: DCSF Achievement + Attainment Tables]
Health warning: These figures include mainstream maintained schools only (i.e. no special schools or independent schools are included). Therefore figures may be different from DCSF published figures.
Teacher assessment results on mathematics: achievement at KS1, level 2+ (all pupils) Ref. 3004OF
Year-on-Year Change
Well Above Above In Line Below Well Below
Level 2+ Mathematics
65
70
75
80
85
90
95
100
2003 2004 2005 2006 2007
If you have any queries about this indicator please contact: [email protected] Please Quote Ref: 3004OF

ENJOYING AND ACHIEVINGKey Stage 2 data

ENJOYING AND ACHIEVINGKS2 data
Kingston Upon Hull
Level 4+ % Trend AnalysisSubject Year Area SN Nat Area SN NatEnglish 2003 66.65 70.44 75.47 V Level 4+ % Trend
2004 72.87 74.57 77.81 V 03/04 6.22 4.13 2.34 National2005 71.85 76.82 79.49 V 04/05 -1.02 2.25 1.68 Statistical Neighbours
2006 74.25 75.38 79.96 V 05/06 2.40 -1.44 0.47 2007 75.19 78.69 81.04 V 06/07 0.94 3.31 1.08
Minimum Pupil Count:Maximum Pupil Count:
APSSubject Year Area SN Nat Area SN NatEnglish 2003 25.55 26.12 26.82 V APS Trend
2004 26.09 26.43 26.96 V 03/04 0.54 0.31 0.14 NATIONAL2005 25.88 26.64 27.06 V 04/05 -0.21 0.21 0.10 STATISTICAL NEIGHBOURS
2006 26.37 26.79 27.45 V 05/06 0.49 0.15 0.39 2007 26.57 27.17 27.63 V 06/07 0.20 0.38 0.18
.. = data not available V = Validated datan/a = not applicable U = Unvalidated data
Level 4+ % APSSubject Year Area SN Nat Subject Year Area SN NatEnglish 2003 66.65 70.44 75.47 English 2003 25.55 26.12 26.82
2004 72.87 74.57 77.81 2004 26.09 26.43 26.962005 71.85 76.82 79.49 2005 25.88 26.64 27.06
2006 74.25 75.38 79.96 2006 26.37 26.79 27.45 2007 75.19 78.69 81.04 2007 26.57 27.17 27.63
RAI, Ofsted Ref: 3005OF
Test results on English: achievement at KS2, level 4+ and Average Point Scores (all pupils) Ref. 3005OF
Year-on-Year Change
Area SN NAT
Year-on-Year Change
Data Definition: The indicator represents two measures for KS2 data on English: Level 4+ attainment and Average Point Scores (APS). Level 4 data shows the percentage of KS2 pupils who achieve at least level 4 in English. APS are calculated from all pupils' test scores. Absent and disapplied pupils are excluded from the calculation of the APS, but included in the calculation of the % attaining level 4+. Trend: The trend for each year is generated by taking a three point moving average of the LA percentage figures. The rate of change is calculated by fitting a regression line to these moving averages. The rate of change for all 150 LAs are then ranked. The top 10% are classed as 'Well above', the next 20% 'Above', the next 40% 'In line', the next 20% 'Below', the final 10% 'Well below'. Similarly the rate of change for each LAs group of statistical neighbours is calculated and deducted from each LA rate of change. The differences are then ranked, and the same classification is used to compare the LA against their statistical neighbours, as is used in the national calculation. The trend indicates whether the change over time in the LA is greater or less than the change over time for the national or statistical neighbours. [Source: DCSF Achievement + Attainment Tables]
Below Well Below
Health warning: These figures include mainstream maintained schools only (i.e. no special schools or independent schools are included). Therefore figures may be different from DCSF published figures.
Well Above Above In Line
Level 4+ English
55
60
65
70
75
80
85
90
95
100
2003 2004 2005 2006 2007
APS English
22
27
32
37
42
47
2003 2004 2005 2006 2007
If you have any queries about this indicator please contact: [email protected] Please Quote Ref: 3005OF

ENJOYING AND ACHIEVINGKS2 data
Kingston Upon Hull
Level 4+ % Trend AnalysisSubject Year Area SN Nat Area SN NatMaths 2003 71.63 69.70 72.66 V Level 4+ % Trend
2004 73.28 72.15 74.20 V 03/04 1.65 2.45 1.54 National2005 72.62 73.56 75.51 V 04/05 -0.66 1.41 1.31 Statistical Neighbours
2006 74.28 73.07 76.43 V 05/06 1.66 -0.49 0.92 2007 75.74 76.33 77.84 V 06/07 1.46 3.26 1.41 Minimum Pupil Count:
Maximum Pupil Count:
APSSubject Year Area SN Nat Area SN NatMaths 2003 26.35 26.41 26.82 V APS Trend
2004 26.72 26.68 27.04 V 03/04 0.37 0.27 0.22 NATIONAL2005 26.55 26.80 27.10 V 04/05 -0.17 0.12 0.06 STATISTICAL NEIGHBOURS
2006 26.84 26.80 27.29 V 05/06 0.29 0.00 0.19 2007 26.88 27.02 27.35 V 06/07 0.04 0.22 0.06
.. = data not available V = Validated datan/a = not applicable U = Unvalidated data
Level 4+ % APSSubject Year Area SN Nat Subject Year Area SN NatMaths 2003 71.63 69.7 72.66 Maths 2003 26.35 26.41 26.82
2004 73.28 72.15 74.2 2004 26.72 26.68 27.042005 72.62 73.56 75.51 2005 26.55 26.8 27.1
2006 74.28 73.07 76.43 2006 26.84 26.8 27.29 2007 75.74 76.33 77.84 2007 26.88 27.02 27.35
RAI, Ofsted Ref: 3006OF
Data Definition: The indicator represents two measures for KS2 data on Mathematics: Level 4+ attainment and Average Point Scores (APS). Level 4 data shows the percentage of KS2 pupils who achieve at least level 4 in Mathematics. APS are calculated from all pupils' test scores. Absent and disapplied pupils are excluded from the calculation of the APS, but included in the calculation of the % attaining level 4+. Trend: The trend for each year is generated by taking a three point moving average of the LA percentage figures. The rate of change is calculated by fitting a regression line to these moving averages. The rate of change for all 150 LAs are then ranked. The top 10% are classed as 'Well above', the next 20% 'Above', the next 40% 'In line', the next 20% 'Below', the final 10% 'Well below'. Similarly the rate of change for each LAs group of statistical neighbours is calculated and deducted from each LA rate of change. The differences are then ranked, and the same classification is used to compare the LA against their statistical neighbours, as is used in the national calculation. The trend indicates whether the change over time in the LA is greater or less than the change over time for the national or statistical neighbours.
Year-on-Year Change
Area SN NAT
[Source: DCSF Achievement + Attainment Tables]
Health warning: These figures include mainstream maintained schools only (i.e. no special schools or independent schools are included). Therefore figures may be different from DCSF published figures.
Test results on mathematics: achievement at KS2, level 4+ and Average Point Scores (all pupils) Ref. 3006OF
Year-on-Year Change
Well Above Above In Line Below Well Below
APS Mathematics
22
24
26
28
30
32
34
36
38
40
2003 2004 2005 2006 2007
Level 4+ Mathematics
55
60
65
70
75
80
85
90
95
100
2003 2004 2005 2006 2007
If you have any queries about this indicator please contact: [email protected] Please Quote Ref: 3006OF

ENJOYING AND ACHIEVINGKS2 data
Kingston Upon Hull
Level 4+ % Trend AnalysisSubject Year Area SN Nat Area SN NatScience 2003 86.09 84.61 87.11 V Level 4+ % Trend
2004 85.36 84.86 86.34 V 03/04 -0.73 0.25 -0.77 National2005 86.02 86.12 87.17 V 04/05 0.66 1.26 0.83 Statistical Neighbours
2006 86.02 84.81 87.43 V 05/06 0.00 -1.31 0.26 2007 87.41 87.40 88.55 V 06/07 1.39 2.59 1.12 Minimum Pupil Count:
Maximum Pupil Count:
APSSubject Year Area SN Nat Area SN NatScience 2003 28.10 28.22 28.62 V APS Trend
2004 28.18 28.40 28.66 V 03/04 0.08 0.18 0.04 NATIONAL2005 28.55 28.69 28.95 V 04/05 0.37 0.29 0.29 STATISTICAL NEIGHBOURS
2006 28.38 28.48 28.90 V 05/06 -0.17 -0.21 -0.05 2007 28.69 28.87 29.03 V 06/07 0.31 0.39 0.13
.. = data not available V = Validated datan/a = not applicable U = Unvalidated data
Level 4+ % APSSubject Year Area SN Nat Subject Year Area SN NatScience 2003 86.09 84.61 87.11 Science 2003 28.1 28.22 28.62
2004 85.36 84.86 86.34 2004 28.18 28.4 28.662005 86.02 86.12 87.17 2005 28.55 28.69 28.95
2006 86.02 84.81 87.43 2006 28.38 28.48 28.9 2007 87.41 87.4 88.55 2007 28.69 28.87 29.03
RAI, Ofsted Ref: 3007OF
Test results on science: achievement at KS2, level 4+ and Average Point Scores (all pupils) Ref. 3007OF
Year-on-Year Change
Area SN NAT
Year-on-Year Change
Data Definition: The indicator represents two measures for KS2 data on Science: Level 4+ attainment and Average Point Scores (APS). Level 4 data shows the percentage of KS2 pupils who achieve at least level 4 in Science. APS are calculated from all pupils' test scores. Absent and disapplied pupils are excluded from the calculation of the APS, but included in the calculation of the % attaining Level 4+. Trend: The trend for each year is generated by taking a three point moving average of the LA percentage figures. The rate of change is calculated by fitting a regression line to these moving averages. The rate of change for all 150 LAs are then ranked. The top 10% are classed as 'Well above', the next 20% 'Above', the next 40% 'In line', the next 20% 'Below', the final 10% 'Well below'. Similarly the rate of change for each LAs group of statistical neighbours is calculated and deducted from each LA rate of change. The differences are then ranked, and the same classification is used to compare the LA against their statistical neighbours, as is used in the national calculation. The trend indicates whether the change over time in the LA is greater or less than the change over time for the national or statistical neighbours.
Well Above Above In Line Below Well Below
[Source: DCSF Achievement + Attainment Tables]
Health warning: These figures include mainstream maintained schools only (i.e. no special schools or independent schools are included). Therefore figures may be different from DCSF published figures.
APS Science
22
27
32
37
42
47
52
57
2003 2004 2005 2006 2007
Level 4+ Science
55
60
65
70
75
80
85
90
95
100
2003 2004 2005 2006 2007
If you have any queries about this indicator please contact: [email protected] Please Quote Ref: 3007OF

ENJOYING AND ACHIEVINGKS2 Data
Kingston Upon Hull
KS1 to KS2
Year Area Coverage % Nat Coverage %
2007 100.0 .. .. .. V
.. = data not available V = Validated data
n/a = not applicable U = Unvalidated data
RAI, Ofsted Ref: 3018OF
Traffic lights have not been applied to this indicator
Contextual Value Added measure KS1 to KS2 Ref. 3008OF
[Source: DCSF Achievement + Attainment Tables]
Health warning: The CVA measure is only descriptive of the results of the schools in the local area and should not be taken as a value-judgement of the effectiveness of the "local authority" as a head-office organisation. The CVA figures include pupils from maintained schools including special schools.
Data Definition: The local area level contextual value added (CVA) score reflects the average rate of progress of all pupils in the local area, not necessarily the overall effectiveness of the local area. The CVA measure is calculated by aggregating the CVA scores of pupils at schools within the local area.More information on CVA can be found on the DCSF website: www.dcsf.gov.uk/performancetables
If you have any queries about this indicator please contact: [email protected] Please Quote Ref: 3008OF

ENJOYING AND ACHIEVINGKey Stage 3 data

ENJOYING AND ACHIEVINGKS3 data
Kingston Upon Hull
Level 5+ % Trend AnalysisSubject Year Area SN Nat Area SN NatEnglish 2003 59.24 64.24 69.82 V Level 5+ % Trend
2004 55.74 64.82 71.90 V 03/04 -3.50 0.58 2.08 National2005 57.37 69.26 75.10 V 04/05 1.63 4.44 3.20 Statistical Neighbours
2006 60.73 67.32 73.81 V 05/06 3.36 -1.94 -1.29 2007 60.72 70.16 75.46 V 06/07 -0.01 2.84 1.65
Minimum Pupil Count:Maximum Pupil Count:
APSSubject Year Area SN Nat Area SN NatEnglish 2003 31.94 32.74 33.67 V APS Trend
2004 31.18 32.47 33.71 V 03/04 -0.76 -0.27 0.04 NATIONAL2005 31.02 32.86 33.97 V 04/05 -0.16 0.39 0.26 STATISTICAL NEIGHBOURS
2006 31.47 32.59 33.81 V 05/06 0.45 -0.27 -0.16 2007 31.16 32.73 33.71 V 06/07 -0.31 0.14 -0.10
.. = data not available V = Validated datan/a = not applicable U = Unvalidated data
Level 5+ % APSSubject Year Area SN Nat Subject Year Area SN NatEnglish 2003 59.24 64.24 69.82 English 2003 31.94 32.74 33.67
2004 55.74 64.82 71.9 2004 31.18 32.47 33.712005 57.37 69.26 75.1 2005 31.02 32.86 33.97
2006 60.73 67.32 73.81 2006 31.47 32.59 33.81 2007 60.72 70.16 75.46 2007 31.16 32.73 33.71
RAI, Ofsted Ref: 3009OF
[Source: DCSF Achievement + Attainment Tables]
Area SN NAT
Data Definition: The indicator represents two measures for KS3 data on English: Level 5+ attainment and Average Point Scores (APS). Level 5 data shows the percentage of KS3 pupils who achieve at least level 5 in English. APS are calculated from all pupils' test scores. Absent and disapplied pupils are excluded from the calculation of the APS, but included in the calculation of the % attaining Level 5+. Trend: The trend for each year is generated by taking a three point moving average of the LA percentage figures. The rate of change is calculated by fitting a regression line to these moving averages. The rate of change for all 150 LAs are then ranked. The top 10% are classed as 'Well above', the next 20% 'Above', the next 40% 'In line', the next 20% 'Below', the final 10% 'Well below'. Similarly the rate of change for each LAs group of statistical neighbours is calculated and deducted from each LA rate of change. The differences are then ranked, and the same classification is used to compare the LA against their statistical neighbours, as is used in the national calculation. The trend indicates whether the change over time in the LA is greater or less than the change over time for the national or statistical neighbours.
Health warning: These figures include mainstream maintained schools only (i.e. no special schools or independent schools are included). Therefore figures may be different from DCSF published figures.
Test results on English: achievement at KS3, level 5+ and Average Point Scores (all pupils) Ref. 3009OF
Year-on-Year Change
Well Above Above In Line Below Well Below
Year-on-Year Change
Level 5+ English
404550556065707580859095
100
2003 2004 2005 2006 2007
APS English
26
28
30
32
34
36
38
40
42
2003 2004 2005 2006 2007
If you have any queries about this indicator please contact: [email protected] Please Quote Ref: 3009OF

ENJOYING AND ACHIEVINGKS3 data
Kingston Upon Hull
Level 5+ % Trend AnalysisSubject Year Area SN Nat Area SN NatMaths 2003 55.80 66.38 71.64 V Level 5+ % Trend
2004 61.34 68.94 73.98 V 03/04 5.54 2.56 2.34 National2005 60.37 70.82 74.90 V 04/05 -0.97 1.88 0.92 Statistical Neighbours
2006 66.83 73.87 77.94 V 05/06 6.46 3.05 3.04 2007 66.33 72.99 76.92 V 06/07 -0.50 -0.88 -1.02
Minimum Pupil Count:Maximum Pupil Count:
APSSubject Year Area SN Nat Area SN NatMaths 2003 32.56 34.32 35.64 V APS Trend
2004 33.24 34.63 35.90 V 03/04 0.68 0.31 0.26 NATIONAL2005 33.16 34.98 36.25 V 04/05 -0.08 0.35 0.35 STATISTICAL NEIGHBOURS
2006 34.57 36.07 37.29 V 05/06 1.41 1.09 1.04 2007 34.28 35.81 37.03 V 06/07 -0.29 -0.26 -0.26
.. = data not available V = Validated datan/a = not applicable U = Unvalidated data
Level 5+ % APSSubject Year Area SN Nat Subject Year Area SN NatMaths 2003 55.8 66.38 71.64 Maths 2003 32.56 34.32 35.64
2004 61.34 68.94 73.98 2004 33.24 34.63 35.92005 60.37 70.82 74.9 2005 33.16 34.98 36.25
2006 66.83 73.87 77.94 2006 34.57 36.07 37.29 2007 66.33 72.99 76.92 2007 34.28 35.81 37.03
RAI, Ofsted Ref: 3010OF
Test results on mathematics: achievement at KS3, level 5+ and Average Point Scores (all pupils) Ref. 3010OF
Year-on-Year Change
Area SN
Year-on-Year Change
NAT
Data Definition: The indicator represents two measures for KS3 data on Mathematics: Level 5+ attainment and Average Point Scores (APS). Level 5 data shows the percentage of KS3 pupils who achieve at least level 5 in Mathematics. APS are calculated from all pupils' test scores. Absent and disapplied pupils are excluded from the calculation of the APS, but included in the calculation of the % attaining level 5+.Trend: The trend for each year is generated by taking a three point moving average of the LA percentage figures. The rate of change is calculated by fitting a regression line to these moving averages. The rate of change for all 150 LAs are then ranked. The top 10% are classed as 'Well above', the next 20% 'Above', the next 40% 'In line', the next 20% 'Below', the final 10% 'Well below'. Similarly the rate of change for each LAs group of statistical neighbours is calculated and deducted from each LA rate of change. The differences are then ranked, and the same classification is used to compare the LA against their statistical neighbours, as is used in the national calculation. The trend indicates whether the change over time in the LA is greater or less than the change over time for the national or statistical neighbours.
Well Above Above In Line Below Well Below
[Source: DCSF Achievement + Attainment Tables]
Health warning: These figures include mainstream maintained schools only (i.e. no special schools or independent schools are included). Therefore figures may be different from DCSF published figures.
APS Mathematics
26
28
30
32
34
36
38
40
42
2003 2004 2005 2006 2007
Level 5+ Mathematics
404550556065707580859095
100
2003 2004 2005 2006 2007
If you have any queries about this indicator please contact: [email protected] Please Quote Ref: 3010OF

ENJOYING AND ACHIEVINGKS3 data
Kingston Upon Hull
Level 5+ % Trend AnalysisSubject Year Area SN Nat Area SN NatScience 2003 50.39 62.97 69.38 V Level 5+ % Trend
2004 50.66 61.09 67.08 V 03/04 0.27 -1.88 -2.30 National2005 55.26 65.57 70.78 V 04/05 4.60 4.48 3.70 Statistical Neighbours
2006 56.85 67.35 73.28 V 05/06 1.59 1.78 2.50 2007 58.53 68.60 73.94 V 06/07 1.68 1.25 0.66
Minimum Pupil Count:Maximum Pupil Count:
APSSubject Year Area SN Nat Area SN NatScience 2003 30.55 32.63 33.84 V APS Trend
2004 30.27 32.28 33.37 V 03/04 -0.28 -0.35 -0.47 NATIONAL2005 31.09 32.71 33.81 V 04/05 0.82 0.43 0.44 STATISTICAL NEIGHBOURS
2006 31.45 33.25 34.46 V 05/06 0.36 0.54 0.65 2007 31.61 33.44 34.55 V 06/07 0.16 0.19 0.09
.. = data not available V = Validated datan/a = not applicable U = Unvalidated data
Level 5+ % APSSubject Year Area SN Nat Subject Year Area SN NatScience 2003 50.39 62.97 69.38 Science 2003 30.55 32.63 33.84
2004 50.66 61.09 67.08 2004 30.27 32.28 33.372005 55.26 65.57 70.78 2005 31.09 32.71 33.81
2006 56.85 67.35 73.28 2006 31.45 33.25 34.46 2007 58.53 68.6 73.94 2007 31.61 33.44 34.55
RAI, Ofsted Ref: 3011OF
Data Definition: The indicator represents two measures for KS3 data on Science: Level 5+ attainment and Average Point Scores (APS). Level 5 data shows the percentage of KS3 pupils who achieve at least level 5 in Science. APS are calculated from all pupils' test scores. Absent and disapplied pupils are excluded from the calculation of the APS, but included in the calculation of the % attaining Level 5+. Trend: The trend for each year is generated by taking a three point moving average of the LA percentage figures. The rate of change is calculated by fitting a regression line to these moving averages. The rate of change for all 150 LAs are then ranked. The top 10% are classed as 'Well above', the next 20% 'Above', the next 40% 'In line', the next 20% 'Below', the final 10% 'Well below'. Similarly the rate of change for each LAs group of statistical neighbours is calculated and deducted from each LA rate of change. The differences are then ranked, and the same classification is used to compare the LA against their statistical neighbours, as is used in the national calculation. The trend indicates whether the change over time in the LA is greater or less than the change over time for the national or statistical neighbours.
Year-on-Year Change
Area SN NAT
[Source: DCSF Achievement + Attainment Tables]
Health warning: These figures include mainstream maintained schools only (i.e. no special schools or independent schools are included). Therefore figures may be different from DCSF published figures.
Test results on science: achievement at KS3, level 5+ and Average Point Scores (all pupils) Ref. 3011OF
Year-on-Year Change
Well Above Above In Line Below Well Below
APS Science
20
25
30
35
40
45
50
55
60
2003 2004 2005 2006 2007
Level 5+ Science
404550556065707580859095
100
2003 2004 2005 2006 2007
If you have any queries about this indicator please contact: [email protected] Please Quote Ref: 3011OF

ENJOYING AND ACHIEVINGKS3 Data
Kingston Upon Hull
KS2 to KS3
Year Area Coverage % Nat Coverage %
2007 98.7 .. - .. V
.. = data not available V = Validated data
n/a = not applicable U = Unvalidated data
RAI, Ofsted Ref: 3018OF
Traffic lights have not been applied to this indicator
Contextual Value Added measure KS2 to KS3 Ref. 3012OF
[Source: DCSF Achievement + Attainment Tables]
Health warning: The CVA measure is only descriptive of the results of the schools in the local area and should not be taken as a value-judgement of the effectiveness of the "local authority" as a head-office organisation. The CVA figures include pupils from maintained schools including special schools.
Data Definition: The local area level contextual value added (CVA) score reflects the average rate of progress of all pupils in the local area, not necessarily the overall effectiveness of the local area. The CVA measure is calculated by aggregating the CVA scores of pupils at schools within the local area.More information on CVA can be found on the DCSF website: www.dcsf.gov.uk/performancetables
If you have any queries about this indicator please contact: [email protected] Please Quote Ref: 3012OF

ENJOYING AND ACHIEVINGGCSE/Equivalents data

ENJOYING AND ACHIEVINGGCSE/Equivalents Data
Kingston Upon Hull
% 5+ A*-C Summary StatisticsGCSE Year Area SN Nat Area SN Nat
2003 32.37 44.80 51.86 V
2004 35.13 45.37 52.89 V 03/04 2.76 0.57 1.032005 45.01 49.70 55.52 V 04/05 9.88 4.33 2.63
2006 53.68 53.41 58.23 V 05/06 8.67 3.71 2.71 2007 53.29 57.56 60.86 V 06/07 -0.39 4.15 2.63
% 5+ A*-C (including English and Maths)GCSE Year Area SN Nat Area SN Nat
2003 .. .. ..2004 .. .. .. 03/04 .. .. ..2005 27.17 35.14 43.00 V 04/05 .. .. ..
2006 26.48 36.21 44.72 V 05/06 -0.69 1.07 1.72 2007 30.76 38.77 46.52 V 06/07 4.28 2.56 1.80
.. = data not available V = Validated datan/a = not applicable U = Unvalidated data
%5+ A*-C %1+ A*-C (including English and Maths)GCSE Year Area SN Nat GCSE Year Area SN Nat
2003 32.37 44.8 51.86 2003 #N/A #N/A #N/A2004 35.13 45.37 52.89 2004 #N/A #N/A #N/A2005 45.01 49.7 55.52 2005 27.17 35.14 43
2006 53.68 53.41 58.23 2006 26.48 36.21 44.72 2007 53.29 57.56 60.86 2007 30.76 38.77 46.52
Ref: 3013OF 3014OFRAI, Ofsted
Health warning: These figures include mainstream schools only (i.e. no special schools or independent schools are included). Therefore figures may be different from DCSF published figures. Discontinuous Yearly Data . From 2004, the figures are calculated from a wider range of GCSE-equivalent pre-16 qualifications as well as GCSEs. Therefore, extra care should be taken when comparing post 2004 performance with previous years that do not include the wider range of qualifications. For 5 A*-C including English and Maths, 2005 figures may include Statistics counted as Maths. 2006 figures count only English and Maths GCSE or equivalent.
Percentage achieving 5+ A*-C (all pupils) and Percentage achieving 5+ A*-C (all pupils) - including English and Mathematics Ref. 3013OF, Ref. 3104OF
Year-on-Year Change
Year-on-Year Change
Area SN NAT
Data Definition: These indicators show the percentage of all GCSE-eligible pupils in mainstream maintained secondary schools who attained at least five grades of C or above. A GCSE-eligible pupil is defined as a pupil who is aged 15 at the beginning of the school year. The new 5+ A*-C GCSEs (and equivalent) including English and Maths GCSEs, was announced in the 14-19 Education and Skills White Paper and subsequently confirmed in the Driving Forward 14-19 Reform: Implementation Plan published in December 2005. Pupils counted must have achieved at least a grade C English GCSE, and at least a grade C Maths GCSE, and at least the equivalent of another three C+ GCSEs.
[Source: DCSF Achievement + Attainment Tables]
Well BelowWell Above Above In Line Below
Percentage of pupils achieving 5+ A*-C (including English and Maths)
25
35
45
55
65
75
85
95
2005 2006 2007
Percentage of pupils acheiving 5+ A*-C
25
35
45
55
65
75
85
95
2005 2006 2007
If you have any queries about this indicator please contact: [email protected] Please Quote Ref: 3013OF, 3104OF

ENJOYING AND ACHIEVINGGCSE/Equivalents Data
Kingston Upon Hull
KS2 to KS4
Year Area Coverage % Nat Coverage %
2006 989.4 96.4 1000.6 95.3 V
2007 987.1 97.0 1000.9 88.1 V
KS2 to KS4
YearNumber
of Schools
Lowest Median Highest
2006 18 957.2 990.9 1066.7 V
2007 .. .. .. .. V
.. = data not available V = Validated data
n/a = not applicable U = Unvalidated data
RAI, Ofsted Ref: 3018OF
KS2-KS4 CVA - Distribution of School CVA measures in the area
Traffic lights have not been applied to this indicator
Contextual Value Added measure KS2 to GCSE/equivalents Ref. 3105OF
[Source: DCSF Achievement + Attainment Tables]
Health warning: The LA CVA score is the average rate of progress of all pupils in the LA and reflects the effectiveness of the groups of schools in the LA, not necessarily the overall effectiveness of the LA. The CVA figures include pupils from maintained schools including special schools. It excludes pupils in pupil referral units, Hospital schools, FE sector institutions and sixth form centres/consortia. Schools opened after January 06 are also excluded from the LA CVA score.
Data Definition: The LA level contextual value added (CVA) score reflects the average rate of progress of all pupils in the LA. The LA CVA measure is calculated by aggregating the CVA scores of pupils at schools within the LA and applying an adjustment to take account of the number of pupils in the calculation – for most LAs this adjustment is very small. Pupils at the end of Key Stage 4 by summer for who we have prior attainment data are included in the school and LA level CVA measures. The CVA measures are centred around 1000. A CVA score of 1006.0 means that, on average pupils within the LA achieved one grade higher in one GCSE subject than similar pupils nationally. Similarly, a value added measure of 994.0 would suggest that, on average, pupils within the LA achieved one grade lower in one GCSE subject than similar pupils nationally. The coverage shows the percentage of pupils within the LA at the end of Key Stage 4 who were included in KS2-KS4 CVA measure. Along with the LA CVA score, the distribution of CVA scores of schools within the LA is shown. This shows the lowest, highest and median – or mid point – of CVA scores for the individual schools within the LA.More information on CVA can be found on the DCSF website: www.dcsf.gov.uk/performancetables
If you have any queries about this indicator please contact: [email protected] Please Quote Ref: 3105OF

ENJOYING AND ACHIEVINGGCSE/Equivalents Data
Kingston Upon Hull
KS3 to GCSE/Equivalents
Year Area Coverage % Nat Coverage %
2007 1001.6 96 1001.4 89.7 V
.. = data not available V = Validated data
n/a = not applicable U = Unvalidated data
RAI, Ofsted Ref: 3018OF
Traffic lights have not been applied to this indicator
Contextual Value Added measure KS3 to GCSE/equivalents Ref. 3018OF
[Source: DCSF Achievement + Attainment Tables]
Health warning: The LA CVA score is the average rate of progress of all pupils in the LA and reflects the effectiveness of the groups of schools in the LA, not necessarily the overall effectiveness of the LA. The CVA figures include pupils from maintained schools including special schools. It excludes pupils in pupil referral units, Hospital schools, FE sector institutions and sixth form centres/consortia. Schools opened after January 06 are also excluded from the LA CVA score.
Data Definition: The LA level contextual value added (CVA) score reflects the average rate of progress of all pupils in the LA. The LA CVA measure is calculated by aggregating the CVA scores of pupils at schools within the LA and applying an adjustment to take account of the number of pupils in the calculation – for most LAs this adjustment is very small. Pupils at the end of Key Stage 4 by summer for who we have prior attainment data are included in the school and LA level CVA measures. The CVA measures are centred around 1000. A CVA score of 1006.0 means that, on average pupils within the LA achieved one grade higher in one GCSE subject than similar pupils nationally. Similarly, a value added measure of 994.0 would suggest that, on average, pupils within the LA achieved one grade lower in one GCSE subject than similar pupils nationally. The coverage shows the percentage of pupils within the LA at the end of Key Stage 4 who were included in KS3-KS4 CVA measure. Along with the LA CVA score, the distribution of CVA scores of schools within the LA is shown. This shows the lowest, highest and median – or mid point – of CVA scores for the individual schools within the LA.More information on CVA can be found on the DCSF website: www.dcsf.gov.uk/performancetables
If you have any queries about this indicator please contact: [email protected] Please Quote Ref: 3018OF

ENJOYING AND ACHIEVINGGCSE/Equivalents data
Total secondary schools in Kingston Upon Hull, City of 2003: 15Kingston Upon Hull, City of 2004: 15
2005: 152006: 142007: 14
Traffic lights have not been applied to this data
Percentage of KS4 schools below Floor Target
Area SN Nat Area SN Nat Area SN Nat Area SN Nat2003 6.67% 1.60% 1.36% 2003 20.00% 4.80% 3.62% 2003 33.33% 8.00% 7.24% 2003 46.67% 16.00% 13.25%2004 6.67% 0.00% 0.87% 2004 6.67% 3.20% 2.33% 2004 20.00% 7.20% 6.01% 2004 46.67% 12.80% 11.08%2005 0.00% 0.00% 0.36% 2005 0.00% 0.80% 1.29% 2005 0.00% 5.60% 3.55% 2005 6.67% 9.60% 7.43%2006 0.00% 0.00% 0.23% 0.00% 0.00% 0.49% 0.00% 0.00% 1.53% 0.00% 4.00% 4.36%2007 0.00% 0.00% 0.03% 0.00% 0.00% 0.13% 7.14% 0.00% 0.56% 7.14% 1.61% 2.10%
[If you have any queries about this indicator please contact: [email protected] - Please quote REF: 3061DE]
[Source: Revised GCSE School and College Achievement and Attainment tables.]
Health warning: N.B. This data shows the % of schools who fail to meet each floor target - this is not the same as showing what % of students failed to get 5 A* to Cs. Traffic lights have not been applied to this indicator, as to have any school not meeting the 2007 floor target is deemed to be a poor outcome. Please note that the target is assessed at three time points, but only two of these time points have been exceeded so far.All schools with pupils aged 15 on 31st August will have been included under the current target. In a minority of cases it is possible that a school is shown as failing the floor targets, although they had no pupils taking GCSEs.
Data definition: This indicator shows the % of schools failing to meet each floor target. By 2008, 60% of those aged 16 should achieve the equivalent of 5 GCSEs at grades A* to C; and in all schools at least 20% of pupils achieve this standard by 2004, rising to 25% by 2006 and 30% by 2008. The target includes all Maintained Mainstream schools, including Academies and City Technology Colleges published with GCSE and equivalent results in the secondary school performance tables. It excludes all non-maintained schools, all special schools, all hospital schools, all pupil referral units, schools that closed ahead of publication of the tables, and schools that opened after the Annual School Census (be that through mergers, amalgamations or new establishments).GCSE and equivalent results are cumulative, i.e. all of the results achieved by those pupils in a particular year (winter and summer sessions) are counted, as well as any results they obtained in earlier years.
Floor Target (2004 Spending Review PSA): by 2008, 60% of those aged 16 to achieve the equivalent of 5 GCSEs at grades A* to C; and in all schools at least 20% of pupils achieve this standard by 2004, rising to 25% by 2006 and 30% by 2008
The SN figure is calculated as the total number of schools not reaching a certain floor target for all statistical neighbours, divided by the total number of schools for all statistical neighbours.
School level figures are adjusted for pupils recently arrived from overseas and additionally for pupils taken on by the school who were permanently excluded from previous schools.
30%25%
3061DE: Percentage of schools not attaining KS4 floor targets
20%15%
Area SN NAT
% of KS4 schools below 25% Floor Target
0%
5%
10%
15%
20%
25%
30%
35%
2003 2004 2005 2006
% of KS4 schools below 30% Floor Target
0%
10%
20%
30%
40%
50%
2003 2004 2005 2006
% of KS4 schools below 15% Floor Target
0.0%
1.0%
2.0%
3.0%
4.0%
5.0%
6.0%
7.0%
2003 2004 2005 2006
% of KS4 schools below 20% Floor Target
0%
5%
10%
15%
20%
25%
2003 2004 2005 2006
Area SN NAT
% of KS4 schools below 25% Floor Target
0%
5%
10%
15%
20%
25%
30%
35%
2003 2004 2005 2006 2007
% of KS4 schools below 30% Floor Target
0%
10%
20%
30%
40%
50%
2003 2004 2005 2006 2007
% of KS4 schools below 15% Floor Target
0.0%
1.0%
2.0%
3.0%
4.0%
5.0%
6.0%
7.0%
2003 2004 2005 2006 2007
% of KS4 schools below 20% Floor Target
0%2%4%6%8%
10%12%14%16%18%20%22%
2003 2004 2005 2006 2007

ENJOYING AND ACHIEVINGSchool Inspection findings

ENJOYING AND ACHIEVINGInspection findings
Area SN NAT
All phases 2.06 2.12 2.07
Primary 0.00 2.15 1.88
Secondary 13.33 0.79 2.65
Special 0.00 0.00 1.89
PRU 0.00 12.50 5.36
RAI, Ofsted Ref:3087OF
Percentage of schools requiring special measures since September 2005
Kingston Upon Hull
Data Definition:This indicator shows the percentage of local authority maintained schools which were inspected under the Section 5 framework and placed in special measures between September 2005 and the end of the spring 2008 term (4th April 2008). The number of schools placed in a category is a cumulative total over the full period, and each school is only included once. The total number of schools used in the calculation is the number of schools open as at 30th April 2008, rather than the number of schools inspected during the period.
[Source: Ofsted Section 5 inspection data]Schools numbers source: DCSF: Schools and Pupils in England: January 2007 (Final)
Health warning: Although the number of schools placed in a category is taken over the full period, the total number of schools is a snapshot view of schools open as at 4th April 2008. Therefore the percentage figure does not take account of schools who have opened or closed over the period. This data may also include schools that will close on 4th April 2008.
Percentage of schools requiring special measures since Sept 2005
If you have any queries about this indicator please contact: [email protected] Please Quote Ref: 3087OF

ENJOYING AND ACHIEVINGInspection findings
Area SN NAT
All phases 7.22 3.42 3.30
Primary 1.41 2.76 2.81
Secondary 33.33 5.56 6.38
Special 0.00 0.00 0.80
PRU 20.00 16.67 4.91
RAI, Ofsted Ref:3088OF
Percentage of schools requiring a 'Notice To Improve' since September 2005
Kingston Upon Hull
Data Definition: This indicator shows the percentage of local authority maintained schools which were inspected under the Section 5 framework and given a notice to improve between September 2005 and the end of the spring 2008 term (4th April 2008). The number of schools placed in a category is a cumulative total over the full period, and each school is only included once. The total number of schools used in the calculation is the number of schools open as at 30th April 2008, rather than the number of schools inspected during the period. [Source: Ofsted Section 5 inspection data]Schools numbers source: DCSF: Schools and Pupils in England: January 2007 (Final)
Health warning: Although the number of schools given a notice to improve is taken over the full period, the total number of schools is a snapshot view of schools open as at 4th April 2008. Therefore the percentage figure does not take account of schools who have opened or closed over the period. This data may also include schools that will close on 4th April 2008.
Percentage of schools placed in notice to improve category since Sept 2005
If you have any queries about this indicator please contact: [email protected] Please Quote Ref: 3088OF

ENJOYING AND ACHIEVINGAttendance data

ENJOYING AND ACHIEVINGAttendance data
Kingston Upon Hull Summary Statistics
AttendanceArea SN Nat Area SN Nat NATIONAL
2003 93.39 93.74 94.20 STATISTICAL NEIGHBOURS2004 94.24 94.06 94.51 03/04 0.85 0.33 0.312005 94.38 94.20 94.58 04/05 0.14 0.14 0.07
2006 94.20 93.91 94.25 05/06 -0.18 -0.29 -0.32 Minimum Pupil Count: 2007 94.03 94.54 94.83 06/07 -0.18 0.62 0.58 Maximum Pupil Count:
[Source: DCSF Absence Data]
RAI, Ofsted Ref: 3034OF
Attendance at primary schools
Year-on-Year ChangeAttendance %
Health warning: These figures include mainstream maintained schools only (i.e. no special schools or independent schools are included). Therefore figures may be different from DCSF published figures.
Data Definition: The data above are based on maintained primary and middle deemed primary schools open as at December 2007.
Well Above Below
If you have any queries about this indicator please contact: [email protected] Please Quote Ref: 3034OF

ENJOYING AND ACHIEVINGAttendance data
Kingston Upon Hull Summary Statistics
Area SN Nat Area SN Nat2003 88.59 90.91 91.742004 89.19 91.04 91.97 03/04 0.60 0.14 0.232005 89.22 91.45 92.20 04/05 0.04 0.41 0.23
2006 89.44 91.43 92.09 05/06 0.21 -0.02 -0.11 Minimum Pupil Count: 2007 89.43 91.58 92.31 06/07 0.00 0.15 0.22 Maximum Pupil Count:
[Source: DCSF Absence Data]
RAI, Ofsted Ref: 3035OF
Attendance at secondary schools
Health warning: These figures include mainstream maintained schools only (i.e. no special schools or independent schools are included). Therefore figures may be different from DCSF published figures.
Year-on-Year ChangeAttendance %
Data Definition: The data above are based on maintained secondary and middle deemed secondary schools open as at December 2007.
Traffic lights have not been
applied to this indicator
If you have any queries about this indicator please contact: [email protected] Please Quote Ref: 3035OF

ENJOYING AND ACHIEVINGExclusions data

ENJOYING AND ACHIEVINGExclusions Data
Kingston Upon Hull, City of
Type Year Area SN Nat Traffic lights havefixed 2005 2.51% 0.97% 1.04% not been applied
2006 n/a n/a n/a to this indicator2007 1.43% 0.81% 1.11%
permanent 2005 0.14% .. 0.03%2006 0.07% .. 0.02%2007 0.06% .. 0.02%
.. = Data not available# = Exclusion rate based on less than 3 pupils
[If you have any queries about this indicator please contact: [email protected] - Please quote REF: 3091DE]
3091DE: Percentage of fixed term and permanent exclusions in relation to the number of pupils in primary phase
Data Definition: A fixed period exclusion refers to a pupil who is excluded from a school but remains on the register of that school because they are expected to return when the exclusion period is completed. A permanent exclusion refers to a pupil who is excluded and their name is removed from the school register. Where a student receives more than one fixed period exclusion during the year, each exclusion will be counted separately. Fixed term exclusions of less than a day are counted as one full day. Exclusion rates based on less than 3 pupils are not shown (indicated by #). This missing data means that SN figures could be misleading, so they are not given for permanent exclusions (indicated by ..) This indicator shows the number of fixed period and permanent exclusions expressed as a percentage of the number (headcount) of pupils in the local authority. The national figures are DCSF published figures. They are mean averages of the sum of each type of exclusion in all LAs, divided by the sum of the pupils in all LAs. However the SN figures have been added by Ofsted to assist inspectors. They are median averages of the %s for all of the LA's statistical neighbours.
[Source: DCSF Pupil Level Annual School Census (permanent exclusions) and the Termly Exclusions Survey (fixed-term exclusions).]
Health warning:The two types of exclusions are shown together to present a fuller picture of exclusions policies within the area: fixed term exclusions can be used as a strategy to prevent permanent exclusions, so are not necessarily a negative outcome for children and young people. For this reason, LA's fixed term exclusion rates do not have traffic lights. Please use with caution: high exclusion rates are a measure of how an area deals with behavioural issues - but a high rate may not always be an indication that an area has particularly poor behaviour. All %s are based on low numbers of students. Due to changes in the data collection information on fixed period exclusions the data is not available for maintained primary schools for 2006.

ENJOYING AND ACHIEVINGExclusions Data
Kingston Upon Hull, City of N.B. Fixed term exclusions do not have traffic lights
Type Year Area SN Natfixed 2005 15.13% 9.10% 9.94%
2006 15.02% 10.05% 10.40%2007 10.17% 10.33% 10.83%
permanent 2005 0.32% 0.21% 0.24%2006 0.28% 0.25% 0.24%2007 0.28% 0.21% 0.22%
.. = Data not available# = Exclusion rate based on less than 3 pupils
[If you have any queries about this indicator please contact: [email protected] - Please quote REF: 3092DE]
Health warning:The two types of exclusions are shown together to present a fuller picture of exclusions policies within the area: fixed term exclusions can be used as a strategy to prevent permanent exclusions, and so are not necessarily a negative outcome for children and young people. For this reason, LA's fixed term exclusion rates do not have traffic lights. Please use with caution: high exclusion rates are a measure of how an area deals with behavioural issues - but a high rate may not always be an indication that an area has particularly poor behaviour. All %s are based on low numbers of students.
3092DE: Percentage of fixed term and permanent exclusions in relation to the number of pupils in secondary phase
[Source: DCSF Pupil Level Annual School Census (permanent exclusions) and the Termly Exclusions Survey (fixed-term exclusions).
Data Definition:A fixed period exclusion refers to a pupil who is excluded from a school but remains on the register of that school because they are expected to return when the exclusion period is completed. A permanent exclusion refers to a pupil who is excluded and their name is removed from the school register. Where a student receives more than one fixed period exclusion during the year, each exclusion will be counted separately. Fixed term exclusions of less than a day are counted as one full day. Exclusion rates based on less than 3 pupils are not shown (indicated by #). This indicator shows the number of fixed period and permanent exclusions expressed as a percentage of the number (headcount) of pupils in the Local Authority. The National figures are DCSF published figures. They are mean averages of the sum of each type of exclusion in all LAs, divided by the sum of the pupils in all LAs. However the SN figures have been added by Ofsted to assist inspectors. They are median averages of the %s for all of the LA's statistical neighbours. Includes middle schools deemed secondary schools.
Well above Well belowBelowIn lineAbove

ENJOYING AND ACHIEVINGEducation otherwise than at school data

ENJOYING AND ACHIEVING
Kingston Upon Hull, City of
AreaStatistical
NeighboursLower
Quartile MedianUpper
QuartileQuartileposition Improving?
2002-03Under 6 hours a week (159a) 68.9% 12.0% 1.8% 11.0% 20.9%6-12 (inclusive) hours a week (159b) 23.0% 13.7% 3.3% 12.2% 20.0%13-19 (inclusive) hours a week (159c) 5.4% 19.0% 7.5% 16.1% 25.9%20 hours or more a week (159d) 2.7% 52.0% 32.2% 52.0% 75.0% Worst Q'tile Not Improving
2003-04Under 6 hours a week (159a) 2.7% 4.8% 0.0% 3.9% 13.0%6-12 (inclusive) hours a week (159b) 3.6% 3.9% 1.0% 5.8% 12.8%13-19 (inclusive) hours a week (159c) 3.6% 12.6% 2.0% 10.3% 20.4%20 hours or more a week (159d) 90.1% 74.2% 50.5% 70.6% 93.2% 2nd Q'tile Improving
2004-05Under 6 hours a week (159a) 0.8% 4.9% 0.0% 3.0% 11.7%6-12 (inclusive) hours a week (159b) 0.8% 2.3% 0.0% 3.8% 10.2%13-19 (inclusive) hours a week (159c) 0.0% 7.9% 0.5% 6.1% 15.4%20 hours or more a week (159d) 98.4% 84.0% 55.3% 80.3% 93.4% Best Q'tile Improving
N/A = Not applicable or null accepted
Data definitionThe percentage of permanently excluded pupils provided with alternative tuition of the following average hours per week:a. 5 hours or less;b. 6-12 hours;c. 13-19 hours; ord. 20 hours or more.
Target setting: Local.
[Source: Best Value Performance Indicators (BVPIs) 159a, 159b, 159c & 159d]
[Data contact: [email protected] - Please quote REF: 3067AC]
Health warning: BVPI 159 was not collected by the Audit Commission from data period 2005/2006. SN figures have been added by Ofsted to assist inspectors. They are median averages of the %s for all of the LA's statistical neighbours.
Education otherwise than at school data3067AC: Percentage of permanently excluded pupils provided with alternative tuition(BVPI 159a, 159b, 159c & 159d)
England
* = Doubts expressed about the reliability of the council's arrangements for producing the data
Provision is calculated from the 16th school day after the governors uphold the head teacher's decision to exclude, or from the date the exclusion appeal panel uphold the decision to exclude.
Scope: Metropolitan Authorities, London Boroughs, Unitary Authorities, County Councils, Council of the Isles of Scilly, Common Council of the City of London.

ENJOYING AND ACHIEVINGLooked after children and care leavers data

Enjoying and achievingLooked after children and care leavers data
Kingston Upon Hull
2005-06 2006-07 2007-08 This indicator does not have bandingLA 5.3 - 4.6 . = Data not applicableSN 6.9 6.7 6.8 .. = Data not availableEng 12.1 11.7 11.9 - = Data suppressed
due to small numbers
Data definition
Continued on following page
3085SC - PAF CF/C69: Percentage of children newly looked after in the year, and still looked after at 31 March, who were placed at 31 March more than 20 miles from their home address from which first placed
Numerator:
Denominator:
The postcode of the address from which the child/young person was first looked after will be related to the postcode of the address of their placement at 31 March. The distance in miles 'as the crow flies' between the address from which a looked after child was taken into care and that of the placement where the child was placed at 31 March has been collected from 2004-05.
[Source - SSDA903]
Of the children in the denominator, the number who were placed at March 31 more than 20 miles from their home address from which first placed (Counting only those children who are more than 20 miles but less than 999.9 miles from their home address).
* Children missing from care at 31 March 2008 (placement codes M1, M2 and M3)* Unaccompanied Asylum Seeker children* Looked after children subject to an agreed pattern of short term placements (legal status codes V3 and V4)
All children newly accommodated (SSDA903 reason for new episode code of S) in the year prior to 31 March and still accommodated at 31 March, excluding:
* Children placed for adoption (placement codes A3, A4, A5 and A6)
Measuring unit
All such cases are excluded on the grounds that the distance from home may exceed the stated limit but may be unavoidable and / or in the child's best interests. [Source - SSDA903]
* Children where the council cannot provide the distance data (e.g. because the parent(s) refused to divulge their address or were of no fixed abode or where the child is currently abroad) (distance value of 999.9)
Percentage to one decimal place
* Children placed at home with parent(s) (placement code P1)
3085SC - PAF CF/C69: Distance children newly looked after are placed from home
0
2
4
6
8
10
12
14
2005-06 2006-07 2007-08
%
Unbanded
Very good
Good
Acceptable
Ask questions aboutperformanceInvestigate urgently
SN
Eng
[If you have any queries about this indicator please contact: [email protected] and quote ref: 3085SC]

Enjoying and achievingLooked after children and care leavers data
Kingston Upon Hull
3085SC - PAF CF/C69: Percentage of children newly looked after in the year, and still looked after at 31 March, who were placed at 31 March more than 20 miles from their home address from which first placed
Guidance/interpretation
2068SC PAF CF/B79: % of children aged at least 10 and under 16 who were in foster placements or placed for adoption - see p.64
There is evidence that while in some cases a distant or out-of-authority placement may be the right decision for a child, for many children such placements are not in their best interests. Children placed at a distance from home (especially out-of-authority) are likely to achieve poorer educational and other outcomes than those placed within their home area. Local authorities will find it harder to act as an attentive corporate parent where children are living far away. In general, children will be less likely to thrive if they are living well away from their own communities. This indicator addresses the capacity of councils to have sufficient placements near to home to allow contact with natural parent(s), siblings and other relatives and local communities to be facilitated. Apart from in very few cases, the further from home a child is placed, the harder it is to maintain links with their family and for them to return to their community when they leave school or care.A key issue with this indicator is the reasoning behind why a child would be placed far from home and involves elements of both placement choice and placement availability (2043SC, 2059SC, 3085SC). Educational performance is also an important element to be considered (3071SC-3074SC).The results for this indicator need to be treated with caution. While it is true of all indicators that no one p.i. should ever be used on its own to make a judgement, it is particularly the case with this indicator. So, for example, the extent to which children thrive may not be influenced by distance at all. Also, a move of 5 miles in an urban area can have the same, or worse, dislocating consequences for a child as one of 30 miles in a rural area. In 2006-07, 39% of authorities had figures of between 1 and 5 in their numerator: results should be interpreted carefully for all authorities where numbers of children newly placed are small.
Related measures1037SC PAF CF/C19: Health of looked after children - see p.262043SC PAF CF/A1: Stability of placements of children looked after (BVPI 49) - see p.59
2067SC PAF CF/D78: Long term stability of children looked after - see p.612059SC PAF CF/C23: Adoptions of children looked after (BVPI 163) - see p.67
3073SC The % of young people leaving care aged 16 or over with 5 or more GCSEs at grade A*-C or GNVQ equivalent - see p.1123074SC PAF CF/C24: Children looked after absent from school [joint working] - see p.114
3071SC The % of children looked after who were pupils in year 11 who were eligible for GCSE (or equivalent) examinations who sat at least one GCSE or equivalent exam - see p.1083072SC PAF CF/A2: Educational qualifications of children looked after [joint working] (BVPI 50) - see p.110
[If you have any queries about this indicator please contact: [email protected] and quote ref: 3085SC]

Enjoying and achievingLooked after children and care leavers data
Kingston Upon Hull
2001/02 2002/03 2003/04 2004/05 2005/06 2006/07 2007/08LA 33.3 66.7 54.3 79.1 55.6 60.6 68.3 . = Data not applicableSN 57.4 58.3 60.0 64.5 63.5 68.2 65.4 .. = Data not availableEng 54.1 57.9 56.8 59.1 64.0 65.6 67.7 - = Data suppressed
due to small numbers
Data definition
Continued on following page
3071SC - Percentage of looked after children who were pupils in year 11 and eligible for GCSE (or equivalent) examinations who sat at least one GCSE or equivalent examination
This indicator measures the extent to which a council is able to ensure that children looked after are able to sit GSCE or equivalent exams.Educational attainment is one of the most important determinants of future outcomes and no attainment can be achieved if a looked after child does not get to sit an exam. There is clearly a need for cooperation between local authorities, schools, and other partners with an interest, to improve the attainment of children looked after. This should be orchestrated through the children’s trust partnership arrangements. The indicator includes those children looked after for at least one year and emphasises the council’s corporate responsibility for the education of vulnerable children.
Guidance/interpretation
Percentage to one decimal place
Conversely, frequent moves between placements (2043SC PAF CF/A1), school absence (3074SC PAF CF/C24) offending (4015SC PAF CF/C18) and distance from home (3085SC PAF CF/C69) may be related to poor educational attainment.
A high figure is an indicator of good performance and a low figure of poor performance.This is a potentially volatile indicator because it can deal with quite small numbers of young people; small changes can have large consequences for the resulting indicator values. It is, nonetheless, a good guide to the extent to which a council is successfully helping its cohort of young people get to the exam room door. As always with educational indicators, though, consideration needs to be given to the proportion of children educated out-of-authority. Sometimes the more proximate the council's corporate parenting support system is to the child, the more effective that support tends to be.A sustained high, or improving, figure in this indicator, in the three years prior to the end of the relevant period, should feed through to an improved 3072SC PAF CF/A2 figure over time and, to a lesser extent, to an improved 3073SC.
Measuring unit Unaccompanied asylum seeker children are still included in this measure if they have been looked after for at least one year
N.B. In 2006-07, for this indicator and 3074SC CF/C24, the data for 30 September 2006 relates to the school year 2005-2006, i.e. the school year that ended in July 2006.
[Source - OC2 question 6a]
Numerator
The number of children looked after at 30 September who at that time had been looked after continuously by the council for at least 12 months who were in, or should have been in, School Year 11 in the school year prior to the 30 September date who were eligible for GCSE (or equivalent) examinations.
Denominator [Source - OC2 question 6b]Of the children in the denominator, the number who on 30 September had sat at least one GCSE or equivalent examination
Traffic lights have not been applied to this indicator
This indicator differs from 3072SC PAF CF/A2 and 3073SC, however, in that it provides snapshots of those looked after for at least a year at 30 September, as opposed to aggregate data on those who ceased to be looked after, after being looked after for any period, in the year prior to the relevant 31 March. It also includes unaccompanied asylum seeking children looked after for one year, whereas the other two indicators require such children to be looked after for at least two.
3071SC - % of looked after children in year 11 eligible for GCSE (or equivalent) who sat at least one GCSE/equivalent exam
0
10
20
30
40
50
60
70
80
90
2001/02 2002/03 2003/04 2004/05 2005/06 2006/07 2007/08
%
LA
SN
Eng
[If you have any queries about this indicator please contact: [email protected] and quote ref: 3071SC]

Enjoying and achievingLooked after children and care leavers data
Kingston Upon Hull
3071SC - Percentage of looked after children who were pupils in year 11 and eligible for GCSE (or equivalent) examinations who sat at least one GCSE or equivalent examination
3072SC PAF CF/A2: Educational qualifications of children looked after [joint working] (BVPI 50) - see p.110
4015SC PAF CF/C18: Final warnings/reprimands and convictions of children looked after - see p.1314016SC PAF CF/C63: Participation of looked after children in reviews - see p.1335022SC PAF CF/A4 Employment, education and training for care leavers [joint working] (BVPI 161) - see p.157
3073SC The % of young people leaving care aged 16 or over with 5 or more GCSEs at grade A*-C or GNVQ equivalent - see p.1123074SC PAF CF/C24: Children looked after absent from school [joint working] - see p.1143085SC PAF CF/C69: Distance children newly looked after are placed from home - see p.106
Related measures2043SC PAF CF/A1: Stability of placements of children looked after (BVPI 49) - see p.59
[If you have any queries about this indicator please contact: [email protected] and quote ref: 3071SC]

Enjoying and achievingLooked after children and care leavers data
Kingston Upon Hull
2003-04 2004-05 2005-06 2006-07 2007-08LA 32.5 50.0 73.9 40.9 68.6 . = Data not applicableSN 54.3 51.8 62.3 60.4 61.4 .. = Data not availableEng 48.6 50.4 53.0 55.1 57.3 - = Data suppressed
due to small numbers
Bands Low High
2003-08 0<25 25<45 45<50 50<70 70<=100
Data definition
Continued on following page
3072SC - PAF CF/A2: Percentage of young people leaving care aged 16 or over with at least one GCSE at grade A*-G or a GNVQ (BVPI 50)
Numerator
Measuring unit
N.B. *Young people who died (SSDA903 reason episode ceased code E2) during the year ending 31 March 2008 aged 16 or over are included.*From 2003-04 the definition of this indicator changed to exclude children whose date of birth suggests that they would not have taken exams before leaving care and Unaccompanied Asylum Seeking Children (UASC) who had been looked after for less than 2 years at the time that they left care. For the year ending 31 March 2007, the data will be come from exams sat in the years 2004 or 2005 or 2006, depending on the age of the young person who ceases to be looked after.
[Source - SSDA903]
Of the young people in the denominator, the number who on leaving care had obtained at least 1 GCSE at grade A*-G or a GNVQ. Qualifications gained before the young person was looked after and qualifications from examinations sat while the young person was looked after are included, even if the results were announced after the young person ceased to be looked after. Qualifications gained from examinations sat after the young person ceased to be looked after are not included. GCSE short courses, part one or full GNVQs at either foundation or intermediate level, and GNVQ language units are included; NVQs are not.
DenominatorThe number of young people who ceased to be looked after during the year at the age of 16 or over regardless of how long they had been looked after, excluding:* those aged 15 at 31 August in the preceding year who leave between 1 April and 31 May of the year and those aged 14 at 31 August in the preceding year who leave care before 31 March of the year;* unaccompanied asylum seeking children (UASC) who have been looked after for less than two years at the time that they leave care (i.e. less than 730 days inclusive of the date they leave care); and* young people who ceased being looked after who had only been looked after during the year under an agreed series of short term placements (legal status codes V3 and V4).[Source - SSDA903]
Percentage to one decimal place
3072SC - PAF CF/A2: Educational qualifications of looked after children
0
10
20
30
40
50
60
70
80
2003-04 2004-05 2005-06 2006-07 2007-08
%
Unbanded
Very good
Good
Acceptable
Ask questions aboutperformanceInvestigate urgently
SN
Eng
[If you have any queries about this indicator please contact: [email protected] and quote ref: 3072SC]

Enjoying and achievingLooked after children and care leavers data
Kingston Upon Hull
3072SC - PAF CF/A2: Percentage of young people leaving care aged 16 or over with at least one GCSE at grade A*-G or a GNVQ (BVPI 50)
Guidance/interpretation
3071SC The % of children looked after who were pupils in year 11 who were eligible for GCSE (or equivalent) examinations who sat at least one GCSE or equivalent exam - see p.108
Related measures
Research has shown that the family and social backgrounds of looked after children suggest a higher likelihood of lower achievement and that looked after children achieve less well than their peers. Adverse factors in the backgrounds of children looked after, though, need to be taken into account. The high percentage of children with statements of special needs, for example, in the looked after population is an important element (around 27% in the looked after population compared to around 3% in the general school-age population). Other factors include not having English as a first language or coming from poorer families (as evidenced by use of free school meals). See the DCSF website for tables on attainment analysed against some of these factors: http://www.dfes.gov.uk/rsgateway/DB/SFR/s000759/index.shtml
This indicator provides data on achievement by LAC at all pass grades in order to evaluate the effectiveness of the council's corporate parenting in the area of attainment.Educational attainment is one of the most important determinants of future outcomes and a measure that is supported by readily available information. There is clearly a need for cooperation between local authorities, schools, and other partners with an interest, to improve the attainment of children looked after. This should be orchestrated through the children’s trust partnership arrangements. The indicator includes the majority of children looked after (for specific exclusions see the denominator), regardless of how long they have been looked after, as this emphasises the council’s corporate responsibility for the education of vulnerable children.
Frequent moves between placements (2043SC CF/A1), school absence (3074SC CF/C24) and offending (4015SC CF/C18) may be related to educational attainment. So too may distance from home (3085SC PAF CF/C69) and the timeliness of reviews (2064SC PAF CF/C68). Low scores in this indicator will feed through to employment, education and training for care leavers (5022SC PAF CF/A4).
High figures indicate good performance and low figures, generally, indicate low performance.This is, though, a volatile indicator because it often deals with quite small numbers of young people. Small changes can have large consequences for the resulting indicator values. In addition, the presence in the cohort of: young people looked after for a brief period, over whose education a council can have limited or non-existent influence; young people with severe disabilities, who are unable to take any exams; and young people with mental health issues, can also have a significant effect on a council’s resulting indicator score.Consistent high performance in this indicator is, therefore, is difficult to maintain and is good evidence of a council's corporate parenting in relation to attainment.As always with educational indicators, though, consideration needs to be given to the proportion of children educated out-of-authority. Sometimes the more proximate the council's corporate parenting support system is to the child, the more effective that support tends to be.The most recent target set for children looked after to achieve 1 A*-G GCSE was the national Quality Protects target for 2002-03 of 75%. The England average for this indicator in 2006-07 was 55%, an increase on the previous year, but still well short of this target. Overall performance remains very distant from the comparable figure for the general population of 16 year olds which, in 2006, was 98%.
4016SC PAF CF/C63: Participation of looked after children in reviews - see p.133
The construction of this indicator is similar to 3073SC, but differs from 3071SC, in that it provides aggregate data on those who ceased to be looked after, after being looked after for any period, in the three years previous to the relevant 31 March, rather than a snapshot of those looked after for at least a year. It also only includes unaccompanied asylum seeking children when they have been looked after for at least two years, rather than one.
5022SC PAF CF/A4 Employment, education and training for care leavers [joint working] (BVPI 161) - see p.157
4015SC PAF CF/C18: Final warnings/reprimands and convictions of children looked after - see p.131
Performance on this indicator has made only slow progress because, often as a result of the small numbers involved and the fact that much depends on exactly when the young person ceases to be looked after, a good result in one year for a council does not necessarily lead to a good result the following year.
3073SC The % of young people leaving care aged 16 or over with 5 or more GCSEs at grade A*-C or GNVQ equivalent - see p.1123074SC PAF CF/C24: Children looked after absent from school [joint working] - see p.1143085SC PAF CF/C69: Distance children newly looked after are placed from home - see p.106
2043SC PAF CF/A1: Stability of placements of children looked after (BVPI 49) - see p.592064SC PAF CF/C68: Timeliness of reviews of children looked after - see p.57
[If you have any queries about this indicator please contact: [email protected] and quote ref: 3072SC]

Enjoying and achievingLooked after children and care leavers data
Kingston Upon Hull
2002-03 2003-04 2004-05 2005-06 2006-07 2007-08LA 0.0 4.3 13.5 8.5 - - . = Data not applicable
SN 6.7 5.4 5.0 7.8 11.1 14.7 .. = Data not available
Eng 7.5 7.2 8.0 8.5 9.9 10.7 - = Data suppressed
due to small numbers
Data definition
Continued on following page
3073SC - Percentage of young people leaving care aged 16 or over with five or more GCSEs at grade A*- C or GNVQs equivalent to grades A*- C
Measuring unit
For the year ending 31 March 2008, the data will be come from exams sat in the years 2005 or 2006 or 2007, depending on the age of the young person who ceases to be looked after.
[Source - SSDA903]
Each young person is counted only once, even if they ceased to be looked after more than once.N.B. Young people who died (reason episode ceased code E2) during the year ending 31 March aged 16 or over are included.
* young people who ceased being looked after who had only been looked after during the year under an agreed series of short term placements (legal status codes V3 and V4).
* unaccompanied asylum seeking children (UASC) who have been looked after for less than two years at the time that they leave care; and
* those aged 15 at 31 August in the preceding year who leave between 1 April and 31 May of the year and those aged 14 at 31 August in the preceding year who leave care before 31 March of the year;
Numerator
The number of young people who ceased to be looked after during the year to 31st March aged 16 or over regardless of how long they had been looked after but excluding:
Denominator
[Source - SSDA903]N.B. The PI data from 2002-2006 was sourced from data collected by CSCI.The 903 data collection for 2006-07 and 2007-08 was not configured to include GNVQ equivalencies. Consequently, Ofsted has collected GNVQ data and matched it with the relevant GCSE data from the 903 collection to calculate the final value for 2006-07 and 2007-08.
Of the young people in the denominator: the number who on leaving care had obtained at least 5 GCSE at grade A* - C or GNVQ at foundation or intermediate level equivalent to grade A*-C. Qualifications gained before the young person was looked after and qualifications from exams sat while the young person was looked after are included, even if the results were announced after the young person ceased to be looked after. Qualifications gained from examinations sat after the young person ceased to be looked after are not included.
Traffic lights have not been applied to this indicator
Percentage to one decimal place
3073SC - % of young people leaving care with 5 or more GCSEs at grade A*-C or GNVQ equivalents
0
2
4
6
8
10
12
14
16
2002-03 2003-04 2004-05 2005-06 2006-07 2007-08
%
LA
SN
Eng
[If you have any queries about this indicator please contact: [email protected] and quote ref: 3073SC]

Enjoying and achievingLooked after children and care leavers data
Kingston Upon Hull
3073SC - Percentage of young people leaving care aged 16 or over with five or more GCSEs at grade A*- C or GNVQs equivalent to grades A*- C
Placements moves (2043SC CF/A1), distance from home (3085SC CF/C69), school absence (3074SC CF/C24) and offending (4015SC CF/C18) may be related to lower educational attainment. Similarly, low scores on frequency of review (2064SC CF/68) and participation at review (2022SC CF/63) may have an adverse effect. Lower scores in this indicator may feed through to a lower score in the indicator on employment, education and training for care leavers (5022SC PAF CF/A4).
This indicator provides data on the highest achieving LAC in order to evaluate the effectiveness of the council's corporate parenting in the area of attainment.High figures indicate good performance and low figures indicate, generally, poor performance, though both need to be seen in relation to comparator data and great caution needs to be exercised in the assessment of a council's performance here.This is a very volatile indicator because it often deals with quite small numbers of young people. Small changes can have large consequences for the resulting indicator values. In addition, the presence in the cohort of: young people looked after for a brief period, over whose education a council can have limited or non-existent influence; young people with severe disabilities, who are unable to take any exams; and young people with mental health issues, can also have a significant effect on a council’s resulting indicator score.
Guidance/interpretation
2043SC PAF CF/A1: Stability of placements of children looked after (BVPI 49) - see p.592064SC PAF CF/C68: Timeliness of reviews of children looked after - see p.57
As always with educational indicators, though, consideration needs to be given to the proportion of children educated out-of-authority. Sometimes the more proximate the council's corporate parenting support system is to the child, the more effective that support tends to be.The England average for this indicator in 2006-07 was 10%. Overall performance remains very distant from the comparable figure for the general population of 16 year olds which, in 2007, was 62%.Performance on this indicator has made only slow progress because, often as a result of the small numbers involved and the fact that much depends on exactly when the young person ceases to be looked after, a good result in one year for a council does not necessarily lead to a good result the following year.
4016SC PAF CF/C63: Participation of looked after children in reviews - see p.1335022SC PAF CF/A4 Employment, education and training for care leavers [joint working] (BVPI 161) - see p.157
4015SC PAF CF/C18: Final warnings/reprimands and convictions of children looked after - see p.131
3071SC The % of children looked after who were pupils in year 11 who were eligible for GCSE (or equivalent) examinations who sat at least one GCSE or equivalent exam - see p.1083072SC PAF CF/A2: Educational qualifications of children looked after [joint working] (BVPI 50) - see p.1103074SC PAF CF/C24: Children looked after absent from school [joint working] - see p.1143085SC PAF CF/C69: Distance children newly looked after are placed from home - see p.106
Related measures
[If you have any queries about this indicator please contact: [email protected] and quote ref: 3073SC]

Enjoying and achievingLooked after children and care leavers data
Kingston Upon Hull
2001/02 2002/03 2003/04 2004/05 2005/06 2006/07 2007/08LA 18.4 21.9 13.5 18.7 19.0 17.6 16.6 . = Data not applicableSN 13.6 14.3 13.1 13.3 14.4 11.6 13.8 .. = Data not availableEng 11.8 12.0 12.4 12.3 12.6 13.3 13.0 - = Data suppressed
due to small numbers
Bands Low High
2001-08 0<5 5<10 10<15 15<20 20+
Data definition
Continued on following page
Denominator [Source - OC2 Question 2d]
Percentage to one decimal place
3074SC - PAF CF/C24: Percentage of children who had been looked after continuously for at least 12 months and were of school age, who missed a total of at least 25 days of schooling for any reason during the previous school year
Measuring unit
N.B. In 2006-07, for this indicator and 3071SC, the data for 30 September 2006 relates to the school year 2005-2006, i.e. the school year that ended in July 2006.
[Source - OC2 Question 2a]
Of the children in the denominator, the number who missed a total of at least 25 days of education of any kind for any reason during the previous school year.
The number of children looked after at 30 September who had been looked after continuously at that date for at least 12 months and were old enough to receive full time schooling during the school year that ended in the previous July.
Numerator
3074SC - PAF CF/C24: Looked after children absent from school
0
5
10
15
20
25
2001/02 2002/03 2003/04 2004/05 2005/06 2006/07 2007/08
%
Unbanded
Very good
Good
Acceptable
Ask questions aboutperformanceInvestigate urgently
SN
Eng
[If you have any queries about this indicator please contact: [email protected] and quote ref: 3074SC]

Enjoying and achievingLooked after children and care leavers data
Kingston Upon Hull
3074SC - PAF CF/C24: Percentage of children who had been looked after continuously for at least 12 months and were of school age, who missed a total of at least 25 days of schooling for any reason during the previous school year
3073SC The % of young people leaving care aged 16 or over with 5 or more GCSEs at grade A*-C or GNVQ equivalent - see p.112
4015SC PAF CF/C18: Final warnings/reprimands and convictions of children looked after - see p.131
Related measures
The rates of looked after children missing 25 days or more of school are not directly comparable to data for all children in a council area. The data collected by the DCSF from schools on absence differentiate between authorised and unauthorised absence, whereas C24 does not. The data from schools do not allow the calculation of rates of children missing at least 25 days of school.As always with educational indicators, though, consideration needs to be given to the proportion of children educated out-of-authority. Sometimes the more proximate the council's corporate parenting support system is to the child, the more effective that support tends to be.Low figures generally indicate good performance and high figures generally indicate poor performance.Where there has been a recent rise in the indicator value score, consideration needs to be given to whether the council is using a dedicated data collection resource, whether in-council or commissioned from a third party. Some preliminary research has shown that the advent of the use of such a resource increases the indicator value because it reveals the true figure. Better data management and the gathering of better intelligence is evidence of good corporate parenting and it is this, rather than the increased value, on which assessment of performance should focus in this instance.Consideration needs to be given to the proportion of children that may not have a school place for some time following a placement move, particularly where it was not anticipated. Also frequent moves between placements (2043SC PAF CF/A1) and offending (4015SC PAF CF/C18) may be related to school attendance. There may be connections between participation in, and timeliness of, reviews (4016SC CF/C63 & 2064SC PAF CF/C68) where school non-attendance should be addressed.Low scores in this indicator will feed through to educational attainment (3071SC, 3073SC & 3072SC PAF CF/A2) and, later, to employment, education and training for care leavers (5022SC PAF CF/A4). Perhaps most notably there is a likely link between attendance, which is declining on average, and the very slow progress made by many councils in 3072SC PAF CF/A2.
2043SC PAF CF/A1: Stability of placements of children looked after (BVPI 49) - see p.592064SC PAF CF/C68: Timeliness of reviews of children looked after - see p.573071SC The % of children looked after who were pupils in year 11 who were eligible for GCSE (or equivalent) examinations who sat at least one GCSE or equivalent exam - see p.108
5022SC PAF CF/A4 Employment, education and training for care leavers [joint working] (BVPI 161) - see p.1574016SC PAF CF/C63: Participation of looked after children in reviews - see p.133
This indicator is a measure of the effectiveness of the local authority as the corporate parent for the children it looks after. It attempts to ensure that they have the maximum opportunity to benefit from their education. Access to school is a key factor in improving the stability of their lives. Continuous attendance will lead to improving education achievement. Local authorities, schools and other partners with an interest need to work together to ensure that when children become looked after they continue to access school, or that if a change of school is unavoidable, appropriate school provision is arranged before the care placement is finalised. Procedures should be in place to ensure that the absence of looked after children for any reason is closely monitored and dealt with appropriately.
Guidance/interpretation
3072SC PAF CF/A2: Educational qualifications of children looked after [joint working] (BVPI 50) - see p.110
3085SC PAF CF/C69: Distance children newly looked after are placed from home - see p.106
[If you have any queries about this indicator please contact: [email protected] and quote ref: 3074SC]

ENJOYING AND ACHIEVINGChildren with learning difficulties and/or disabilities data

ENJOYING AND ACHIEVINGChildren with learning difficulties and/or disabilities data
Kingston Upon Hull, City of
Type Year Area SN NatPrimary 2005 6.47% 5.83% 8.50% Traffic lights have
2006 n/a n/a n/a not been applied2007 12.44% 7.60% 10.18% to this indicator
Secondary 2005 48.98% 25.27% 28.70%2006 29.46% 28.91% 31.56%2007 23.89% 33.33% 33.40%
0% = Data not available# = Less than 3 pupils
[If you have any queries about this indicator please contact: [email protected] - Please quote REF: 3106DE]
3106DE: Percentage of fixed term exclusions for pupils with statements in mainstream schools (broken down into Primary and Secondary phase)
In 2005/06 no termly exclusions data was collected for primary schools. The termly exclusions survey which previously collected this data was discontinued as the collection of fixed period exclusions was moved to the School Census. However, primary schools made their first return under the new arrangements for the academic year 2006/07.
Health warning:Please use with caution: high exclusion rates are a measure of how an area deals with behavioural issues - but a high rate may not always be an indication that an area has particularly poor behaviour. All %s are based on low numbers of students.
[Source: School Census, although prior to 2006 it was collected via the DCSF Termly Exclusions Survey (fixed-term exclusions). Statistical Neighbours comparisons calculated by Ofsted.]
Data Definition: A fixed period exclusion refers to a pupil who is excluded from a school but remains on the register of that school because they are expected to return when the exclusion period is completed. Where a student receives more than one fixed period exclusion during the year, each exclusion will be counted separately. Fixed term exclusions of less than a day are counted as one full day. Exclusion rates based on less than 3 pupils are not shown (indicated by #). This indicator shows the number of fixed period exclusions expressed as a percentage of the number (headcount) of pupils in the local authority. The national figures are DCSF published figures. They are median averages of the sum of each type of exclusion in all LAs, divided by the sum of the pupils in all LAs. However, the SN figures have been added by Ofsted to assist inspectors. They are median averages of all the % for all the local authorities statistical neighbours (as in 3099DE).

ENJOYING AND ACHIEVING
3095DE: Percentage of pupils with a statement of special educational needs (SEN)
Kingston Upon Hull, City of
Traffic lights have notYear LA SN Nat been applied to this
2006 3.2% 3.2% 2.9% indicator2007 3.1% 3.1% 2.8%2008 3.1% 3.1% 2.8%
.. = Data not available
graph to follow
[If you have any queries about this indicator please contact: [email protected] - Please quote REF: 3095DE]
Children with learning difficulties and/or disabilities data
Data Definition:Data is taken from January for each year. The % is calculated by dividing the total number of children with statements of SEN by the total number of children. Figures includes Nursery, Primary, Middle, Secondary, Independent and Special schools, Pupil Referral Units, City Technology Colleges and Academies. The national figures are DCSF published figures. Statistical Neighbours comparisons calculated by Ofsted.
Health warning:Please note that this data refers to the local authority where the pupil attends school, which may not be the local authority where they live.Numbers of statements should be reducing steadily over time. If not, this could be an indication that inclusion or funding policies are not being effective in supporting early intervention and would need following up in the inspection. SN figures have been added by Ofsted to assist inspectors. They are median averages of the %s for all of the LA's Statistical Neighbours.
[Source: DCSF Schools' Census (SC).]
Area SN NAT
% of pupils with a statement of SEN (all school types)
0.0%
1.0%
2.0%
3.0%
4.0%
5.0%
2006 2007 2008
%

ENJOYING AND ACHIEVING
3063DE: DCSF SEN2 – number of new statements of special educational needs SEN
Kingston Upon Hull, City of
No. of children for whom statements were newly made this year
Year LA Nat Traffic lights have not2005 143 24,040 been applied to this 2006 137 22,600 indicator2007 100 23,510
% of children with new statements placed in mainstream schools.
Year LA SN Nat2005 77.6% 62.9% 72.3%2006 66.4% 63.1% 69.3%2007 63.0% 57.1% 68.7%
.. = Data not available# = 1 or 2 pupils or a rate based on 1 or 2 pupils
[If you have any queries about this indicator please contact: [email protected] - Please quote REF: 3063DE]
Children with learning difficulties and/or disabilities data
Health warning: Please note that data refers to the local authority where the child lives (as they issue their statement), but they may go to a school in another local authority.Numbers of new statements should be reducing steadily over time. If not, this could be an indication that inclusion or funding policies are not being effective in supporting early intervention and would need following up in the inspection. Comparisons with other LAs can be misleading because of different responses to the national drive to reduce the number of statements overall through early intervention and funding arrangements. SN figures have been added by Ofsted to assist inspectors. They are median averages of the %s for all of the LA's Statistical Neighbours.
[Source:. DCSF SEN2 Survey 2006-2008. Statistical Neighbours comparisons calculated by Ofsted.]
Data Definition:Data is taken from the SEN2 survey, which local authorities complete each January. This indicator refers to all new statements issued by the local authority in the calendar year (i.e. data shown for 2007 is taken from the January 2008 return). Data includes resourced provision/units/special classes in maintained mainstream schools and SEN units in maintained mainstream schools.
Area SN NAT
% of children with new statements placed in mainstream schools
0.0%
10.0%
20.0%
30.0%
40.0%
50.0%
60.0%
70.0%
80.0%
90.0%
2005 2006 2007
%
Number of children for whom statements were newly made
0
20
40
60
80
100
120
140
160
2005 2006 2007
LA
0
5,000
10,000
15,000
20,000
25,000
30,000
Nat

ENJOYING AND ACHIEVINGChildren with learning difficulties and/or disabilities data
Kingston Upon Hull, City of
Percentage of new statements of SEN prepared within 18 weeks, including and excluding 'exceptions'
AreaStatistical
NeighboursLower
Quartile MedianUpper
QuartileQuartileposition Improving?
2004-05
BVPI43a - % of statements of SEN issued within 18 weeks - excluding 'exceptions' 90.9% 98.6% 93.0% 98.1% 100.0% Worst Q'tile Improving
BVPI43b - % of statements of SEN issued within 18 weeks - including 'exceptions' 66.7% 76.3% 65.9% 77.9% 90.2% 3rd Q'tile Improving
2005-06
BVPI43a - % of statements of SEN issued within 18 weeks - excluding 'exceptions' 97.0% 98.2% 95.7% 99.4% 100.0% 3rd Q'tile Improving
BVPI43b - % of statements of SEN issued within 18 weeks - including 'exceptions' 89.9% 79.6% 72.5% 85.9% 95.4% 2nd Q'tile Improving
2006-07
BVPI43a - % of statements of SEN issued within 18 weeks - excluding 'exceptions' 97.9% 100.0% 97.5% 100.0% 100.0% 3rd Q'tile Improving
BVPI43b - % of statements of SEN issued within 18 weeks - including 'exceptions' 97.8% 91.7% 80.5% 91.3% 98.5% 2nd Q'tile Improving
.. = Data not available
Data Definition:
[Data contact: [email protected] - Please quote REF: 3070AC]
Health warning: SN figures have been added by Ofsted to assist inspectors. They are median averages of the %s for all of the LA's statistical neighbours.
3070AC: BVPI – Percentage of new statements of special educational needs prepared within 18 weeks
England
* = Doubts expressed about the reliability of the council's arrangements for producing the data.
Percentage of proposed statements of Special Educational Need issued by the authority in a financial year and prepared within 18 weeks including and excluding exceptions under the Education (Special Educational Needs) (England) (Consolidation) Regulations 2001 and set out in Annex A of the SEN Code of Practice.
The end of the period is the date on which the authority issues the proposed statement or the date on which the authority notifies the parent that a statement is not necessary.
[Source: Best Value Performance Indicators (BVPIs) 43a and 43b]
Scope: Metropolitan Authorities, London Boroughs, Unitary Authorities, County Councils, Council of the Isles of Scilly, Common Council of the City of London.
Further guidance: The 'exceptions' are those set out in the Education (Special Educational Needs) (England) (Consolidation) Regulations 2001, paragraphs 12.5, 12.7 and 12.9. The regulations are reproduced in Annex A of the SEN Code of Practice 2001. See www.teachernet.gov.uk/SEN
Refusal to assess: where a request is refused, it should not be included in the count. If an order to carry out an assessment is later made by the SEN and Disability Tribunal (SENDIST), the authority must notify the child’s parent that they will make an assessment within 4 weeks of the date of the order. (See Part IV, section 25 – (2) of the Consolidation Regulations 2001).
A Note in Lieu is not part of the statutory requirement but the Code of Practice makes it clear that it is good practice to issue one following the notice to parents.

ENJOYING AND ACHIEVINGChildren with learning difficulties and/or disabilities data
Kingston Upon Hull, City of
Year Area SN Nat Traffic lights have 2005 # .. 0.31% not been applied2006 0.00% .. 0.23% to this indicator2007 0.00% .. 0.20%
.. = Data not available# = Exclusion rate based on less than 3 pupils
[If you have any queries about this indicator please contact: [email protected] - Please quote REF: 3097DE]
3097DE: Percentage of permanent exclusions in relation to the number of pupils in special schools
Data Definition: A permanent exclusion refers to a pupil who is excluded and their name is removed from the school register. This indicator shows the number of permanent exclusions during the academic year expressed as a percentage of the number (headcount) of pupils in maintained and non-maintained special schools in the Local Authority. Data will be missing if the local authority does not have any schools of this type. Exclusion rates based on less than 3 pupils are not shown (indicated by #). This missing data means that SN figures could be misleading, so they are not provided (indicated by ..) Dual registered pupils are not included. The National figures are DCSF published figures. They are mean averages of the number of exclusions in all LAs, divided by the sum of the pupils in all LAs.
[Source: DCSF Pupil Level Annual School Census (permanent exclusions). Statistical Neighbours comparisons calculated by Ofsted.]
Health warning:There should be no permanent exclusions of pupils in special schools because the statement review process should be used to identify placements which are no longer appropriate. The LA should be able to provide details of these exclusions if there are concerns.Please use with caution - %s are based on low numbers of students. These figures are based on the local authority in which the pupil studies. This may not be the same authority in which they live, and who maintains their statement of Special Educational Needs.
% of permanent exclusions
0.00%
0.05%
0.10%
0.15%
0.20%
0.25%
0.30%
0.35%
2005 2006 2007
%
LA SN Nat

ENJOYING AND ACHIEVINGChildren with learning difficulties and/or disabilities data
Kingston Upon Hull, City of
Year Area SN Nat2005 21.08% 15.61% 18.91% Traffic lights have 2006 n/a n/a n/a not been applied2007 13.83% 13.86% 17.38% to this indicator
.. = Data not available# = Exclusion rate based on less than 3 pupils
[If you have any queries about this indicator please contact: [email protected] - Please quote REF: 3099DE]
3099DE: Percentage of fixed period exclusions of one day or more in relation to the number of pupils in special schools
Data Definition: A fixed period exclusion refers to a pupil who is excluded from a school but remains on the register of that school because they are expected to return when the exclusion period is completed. Where a student receives more than one fixed period exclusion during the year, each exclusion will be counted separately. Fixed term exclusions of less than a day are counted as one full day. This indicator shows the number of fixed period exclusions during the academic year expressed as a percentage of the number (headcount) of pupils in maintained special schools in the Local Authority. Please note that non-maintained special schools are excluded. Data will be missing if the local authority does not have any schools of this type. Exclusion rates based on less than 3 pupils are not shown (indicated by #). The National figures are DCSF published figures. They are mean averages of the number of exclusions in all LAs, divided by the sum of the pupils in all LAs. However the SN figures have been added by Ofsted to assist inspectors. They are median averages of the %s for all of the local authorities' statistical neighbours.
[Source: DCSF Termly Exclusions Survey (fixed-term exclusions). Statistical Neighbours comparisons calculated by Ofsted.]
Health warning:Fixed term exclusions may have risen in order to avoid permanent exclusions but should be used sparingly by special schools. The LA should be able to provide details of these exclusions if there are concerns.Please use with caution - %s are based on low numbers of students. These figures are based on the local authority in which the pupil studies. This may not be the same authority in which they live, and who maintains their statement of SEN (where applicable). Due to changes in the data collection information on fixed period exclusions the data for this is not available for maintained special schools for 2006.
% of fixed exclusions
0.00%
5.00%
10.00%
15.00%
20.00%
25.00%
2005 2006 2007
%
LA SN Nat

Youth offending information
MAKING A POSITIVE CONTRIBUTION

Youth Offending Information Kingston-upon-Hull
2061YJ: Recidivism - the rate of re-offending
Number in cohort
Number Re-0ffending
YOT Performance
YJB Statistical Neighbour
England and Wales
Over time (a)
Against neighbour
(b)
Against England & Wales(c)
2002 cohort after 12 months 253 120 47.4% 40.9% 38.4% - 6.5% 9.0%2003 cohort after 12 months 274 136 49.6% 44.9% 39.5% 2.2% 4.7% 10.2%2004 cohort after 12 months 302 132 43.7% 42.1% 38.1% -5.9% 1.6% 5.6%2005 cohort after 12 months 321 166 51.7% 43.1% 37.4% 8.0% 1.0% -0.7%
(a) Variation over time: % change between data periods.(b) Variation against statistical neighbour: % difference between YOT and statistical neighbour(c) Variation against England & Wales: % difference between Youth Offending Team and national average
Source: Youth Offending Team case management systems & YJB MIS.If you have any queries concerning this data please contact Nick Read on 020 7271 3068 Ref: 2061YJ
Over time (a)
Against neighbour
(b)
Against England & Wales(c)
YOT Performance
Statistical Neighbour
England and Wales Over time (a)
Against neighbour
(b)
Against England & Wales(c)
Data Definition: Between October and December each year, a cohort of offenders is identified and the disposal or pre-court decision recorded. These offenders are tracked for 2 years and any re-offending recorded. The re-offending rate is calculated by dividing the number of those who re-offend into the total number in the cohort. Full counting rules are posted on the YJB website.
Variation
KPI Performance Variation
0%
25%
50%
75%
100%
2002 cohort after 12months
2003 cohort after 12months
2004 cohort after 12months
2005 cohort after 12months
YOT Performance Statistical Neighbour England and Wales
-10%
-5%
0%
5%
10%
15%
2002 cohort after 12months
2003 cohort after 12months
2004 cohort after 12months
2005 cohort after 12months
Over time (a) Against neighbour (b) Against England & Wales(c)

Youth Offending Information Kingston-upon-Hull
2062YJ: Number of first timers in the youth justice system
YOT Area
YJB Statistical Neighbour National
(a) (b) (c)
Apr-Jun 06 97 144 24,283 - -32.4% n/aJul-Sep 06 104 128 21,845 7.2% -18.4% n/aOct-Dec 06 115 141 23,552 10.6% -18.3% n/aJan-Mar 07 138 140 24,050 20.0% -1.7% n/aApr-Jun 07 185 132 24,932 34.1% 40.6% n/aJul-Sep 07 136 110 22,168 -26.5% 23.3% n/aOct-Dec 07 152 94 19,953 11.8% 61.0% n/aJan-Mar 08 72 91 19,441 -52.6% -21.1% n/a
(a) Variation over time: % change between data periods(b) Variation against statistical neighbour: % difference between YOT and statistical neighbour(c) Since this is an absolute measure, not a proportion of population, no average between the YOT England & Wales total is calculated
Variation
Source: Youth Offending Team case management systems & YJB MIS.If you have any queries concerning this data please contact Nick Read on 020 7271 3068 Ref: 2062YJ
KPI Performance
Data Definition: A First Time Entrant is a young person receiving his/her first substantive outcome, i.e. a Reprimand, Final Warning or Court Order. The target is to reduce year on year, the number of first time entrants to the youth justice system by identifying children and young people at risk of offending or involvement in anti-social behaviour through a YISP or other evidence based targeted means of intervention designed to reduce those risks and strengthen protective factors as demonstrated by using ONSET or other effective means of assessment and monitoring. Full counting rules are posted on the YJB website.
(d) Prior to Jan 2008 there has been a re-submission of the FTE data that collected. This re-submission was part of a data validation exercise.
Variation
(d)
0
50
100
150
200
Apr-Jun06
Jul-Sep06
Oct-Dec06
Jan-Mar07
Apr-Jun07
Jul-Sep07
Oct-Dec07
Jan-Mar08
19,000
21,000
23,000
25,000
27,000
YOT Area Statistical Neighbour National
-60%
-40%
-20%
0%
20%
40%
60%
80%
Apr-Jun06
Jul-Sep06
Oct-Dec06
Jan-Mar07
Apr-Jun07
Jul-Sep07
Oct-Dec07
Jan-Mar08
YOT Performance Statistical Neighbour
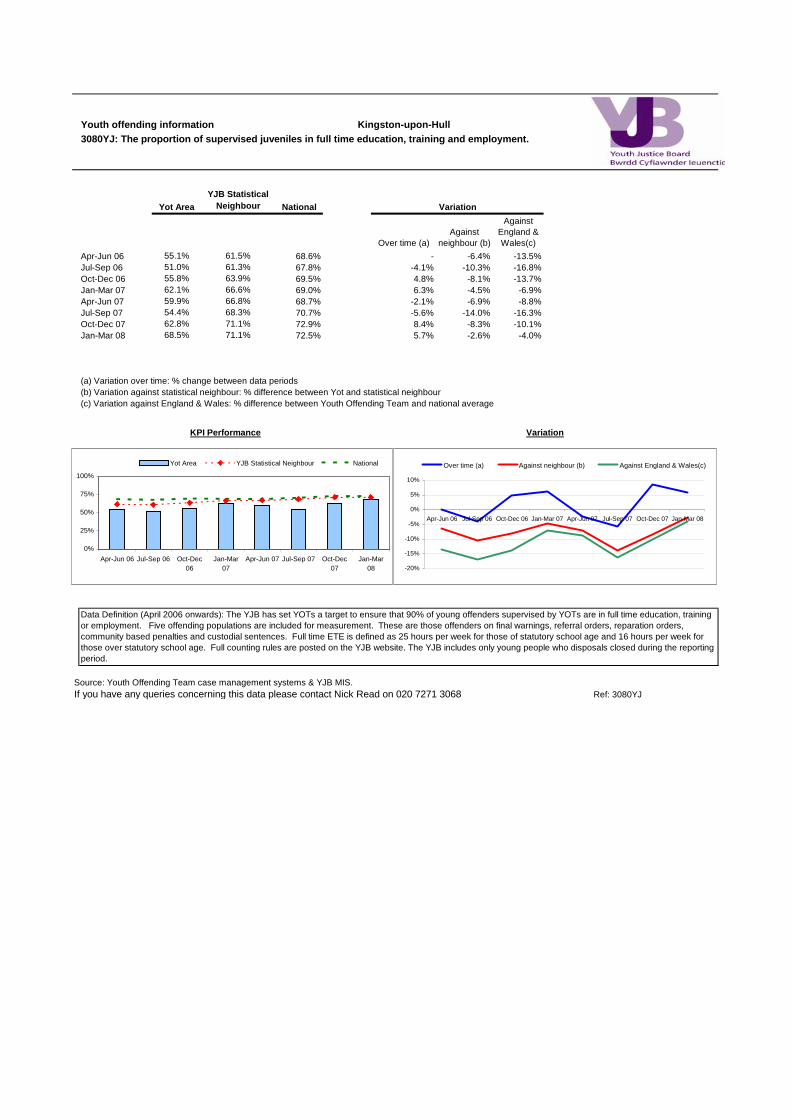
Youth offending information Kingston-upon-Hull
Yot AreaYJB Statistical
Neighbour National
Over time (a)Against
neighbour (b)
Against England & Wales(c)
Apr-Jun 06 55.1% 61.5% 68.6% - -6.4% -13.5%Jul-Sep 06 51.0% 61.3% 67.8% -4.1% -10.3% -16.8%Oct-Dec 06 55.8% 63.9% 69.5% 4.8% -8.1% -13.7%Jan-Mar 07 62.1% 66.6% 69.0% 6.3% -4.5% -6.9%Apr-Jun 07 59.9% 66.8% 68.7% -2.1% -6.9% -8.8%Jul-Sep 07 54.4% 68.3% 70.7% -5.6% -14.0% -16.3%Oct-Dec 07 62.8% 71.1% 72.9% 8.4% -8.3% -10.1%Jan-Mar 08 68.5% 71.1% 72.5% 5.7% -2.6% -4.0%
(a) Variation over time: % change between data periods(b) Variation against statistical neighbour: % difference between Yot and statistical neighbour(c) Variation against England & Wales: % difference between Youth Offending Team and national average
Source: Youth Offending Team case management systems & YJB MIS.If you have any queries concerning this data please contact Nick Read on 020 7271 3068 Ref: 3080YJ
Data Definition (April 2006 onwards): The YJB has set YOTs a target to ensure that 90% of young offenders supervised by YOTs are in full time education, training or employment. Five offending populations are included for measurement. These are those offenders on final warnings, referral orders, reparation orders, community based penalties and custodial sentences. Full time ETE is defined as 25 hours per week for those of statutory school age and 16 hours per week for those over statutory school age. Full counting rules are posted on the YJB website. The YJB includes only young people who disposals closed during the reporting period.
3080YJ: The proportion of supervised juveniles in full time education, training and employment.
Variation
KPI Performance Variation
-20%
-15%
-10%
-5%
0%
5%
10%
Apr-Jun 06 Jul-Sep 06 Oct-Dec 06 Jan-Mar 07 Apr-Jun 07 Jul-Sep 07 Oct-Dec 07 Jan-Mar 08
Over time (a) Against neighbour (b) Against England & Wales(c)
0%
25%
50%
75%
100%
Apr-Jun 06 Jul-Sep 06 Oct-Dec06
Jan-Mar07
Apr-Jun 07 Jul-Sep 07 Oct-Dec07
Jan-Mar08
Yot Area YJB Statistical Neighbour National

Participation and other activity information
MAKING A POSITIVE CONTRIBUTION

MAKING A POSITIVE CONTRIBUTIONParticipation and other activity information
Kingston Upon Hull, City of
% Reached Year-on-Year Change
2005 22.7% .. 25.0% 25.1% 04/05 n/a n/a n/a n/a
2006 27.0% .. 25.0% 27.6% 05/06 4.3% .. n/a 2.5%
2007 23.3% .. 25.0% 28.0% 06/07 -3.7% .. n/a 0.5%
Additional information:
No. of Young people reached Year-on-Year ChangeYear Area Year Area
2005 5,678 04/05 n/a
2006 6,740 05/06 18.7% .. = data not available2007 5,886 06/07 -12.7% n/a = not applicable
[If you have any queries about this indicator please contact: [email protected] - Please quote REF: 4021OF]
4021OF: Contact - Percentage of young people aged 13 to 19 reached by publicly funded youth services
YearYear Nat AverageNat targetArea Nat
average
Health warning: Data is supplied by external parties and Ofsted are unable to validate its accuracy. The NYA's annual audit is a voluntary survey, and not all services choose, or are able, to submit data each year. The National figure is a median average based on submissions of 128 services for 2004-05, 138 for 2005-06 and 139 for 2006-07. Missing data means it is not possible to calculate a robust figure for statistical neighbours or show traffic lights.
Data Definition: The current definition of a contact with a young person is that the face and name of the young person are known to the Youth Worker. It is an 'informed' contact where the Youth Worker is consciously building a relationship with the young person. The young person may attend events occasionally, or the young person may seek information or advise, or the young person may be involved in issue-based session/s with a group at a school (but attendance at school assemblies does not count). The percentage of young people reached divides the young people reached aged 13-19 by the total 13-19 population. The benchmark of 25% of the target population contacted can include figures from (contacts only): Local authority provided services and commissioned services; Youth provision secured through grants to voluntary and community organisations and partnerships . The calculation does not take account of other young people in the 11-25 age group who may have used the service during the period. The Year-on-Year change calculations simply deduct one % from another.
Nat targetSNSN AreaTraffic lights have not been applied to this indicator
[Source: Office of National Statistics (ONS) Mid Year Population Estimates of 2004, 2005 and 2006. National Youth Agency (NYA) Annual Audits of financial years 2004-05, 2005-06 and 2006-07. Calculations performed by Ofsted.]
% of young people aged 13-19 reached by publicly funded Youth Services
0.0%
5.0%
10.0%
15.0%
20.0%
25.0%
30.0%
2005 2006 2007
% R
each
ed
Area NAT TARGET NAT

MAKING A POSITIVE CONTRIBUTIONParticipation and other activity information
Staffing ratio Year-on-Year ChangeYear Area SN Nat Year Area SN Nat
2005 1: 350 .. 1: 651 04/05 n/a .. n/a
2006 1: 336 .. 1: 587 05/06 -4.1% .. -8.0%
2007 1: 361 .. 1: 611 06/07 7.3% .. -8.0%
Additional information:
No. of FTE Youth Workers Year-on-Year ChangeYear Area Year Area
2005 71 04/05 n/a
2006 74 05/06 4.2%
2007 70 06/07 -5.8%
.. = data not availablen/a = not applicable
[If you have any queries about this indicator please contact: [email protected] - Please quote REF: 4022OF]
4022OF: Ratio of full-time equivalent youth workers to young people aged 13 to 19
Health warning:Data is supplied by external parties and Ofsted are unable to validate its accuracy. The NYA's annual audit is a voluntary survey, and not all services choose, or are able, to submit data. The National figure is a median average based on submissions of 137 services for 2004-05, 144 for 2005-06 and 140 for 2006-07. Missing data means it is not possible to calculate a robust figure for Ofsted's Statistical Neighbours or show traffic lights. The Youth Worker to young people ratio is an indication of the local authority's investment in the youth service. It is background information to help inspectors form a view of the service. However, it is not in itself an indication of the quality of the service provided, or its effect on young people. Caution should be employed when interpreting this indicator. The 2006 National figure has changed since the previous APA.
Data Definition:Data is for 13-19 year olds only, and does not include other young people in the 11-25 age group, although they may choose to use the service. Youth Workers excludes volunteers. The full-time equivalent calculation comprises professional youth workers, youth workers with other qualifications, and youth support workers. FTE is considered to be the equivalent of 1924 hours a year (52 weeks) based on a 37-hour week.[Source: Office of National Statistics (ONS) Mid Year Population Estimates of 2004, 2005 and 2006. National Youth Agency (NYA) Annual Audits of financial years 2004-05, 2005-06 and 2006-07. Calculations performed by Ofsted.]
Kingston Upon Hull, City o
Traffic lights have not been applied to this indicator
Ratio of full-time equivalent Youth Workers to young people aged 13-19
0
100
200
300
400
500
600
700
2005 2006 2007
Rat
io
AREA NAT

Looked after children and care leavers data
MAKING A POSITIVE CONTRIBUTION

Making a positive contributionLooked after children and care leavers data
Kingston Upon Hull
2001/02 2002/03 2003/04 2004/05 2005/06 2006/07 2007/08LA 2.7 4.5 3.9 2.5 2.4 2.0 2.9 . = Data not applicableSN 3.4 3.0 3.2 2.5 2.4 2.4 2.3 .. = Data not availableEng 2.9 2.9 2.8 2.5 2.3 2.3 2.3 - = Data suppressed
due to small numbers
Bands Low High
2001-08 · 0<1 1<3 · · · . 3+ ·
Data definition
Continued on following page
divided by
4015SC - PAF CF/C18: Percentage of children aged 10 or over who had been looked after continuously for at least 12 months, who were given a final warning/reprimand or convicted during the year for an offence committed while they were looked after, expressed as a ratio of the percentage of all children aged 10 or over given a final warning/reprimand or convicted for an offence in the police force area
[Source - OC2, Question 7b]
The number of children looked after at 30 September aged 10 or over, who had been looked after continuously for at least 12 months and who had, during these 12 months, been given a final warning/reprimand for or convicted of an offence that had been committed while they were looked after.
This is a ratio consisting of:Numerator
Denominator [Source - OC2, Question 7a]
The total number of children looked after at 30 September aged 10 or over, who had been looked after continuously for at least 12 months.
The total number of children (aged 10-17) living in the local police force area who had been given a final warning/reprimand or convicted for an offence during the previous calendar year.[Source - the Home Office]N.B. Data for 2006-07 has been updated with 2006 Home Office data. Data for 2007-08 uses 2006 data.
Ratio to one decimal place.Measuring unit
4015SC - PAF CF/C18: Final warnings/reprimands and convictions of looked after children
0.0
0.5
1.0
1.5
2.0
2.5
3.0
3.5
4.0
4.5
5.0
2001/02 2002/03 2003/04 2004/05 2005/06 2006/07 2007/08
Unbanded
Very good
Good
Acceptable
Ask questions aboutperformanceInvestigate urgently
SN
Eng
[If you have any queries about this indicator please contact: [email protected] and quote ref: 4015SC]

Making a positive contributionLooked after children and care leavers data
Kingston Upon Hull
4015SC - PAF CF/C18: Percentage of children aged 10 or over who had been looked after continuously for at least 12 months, who were given a final warning/reprimand or convicted during the year for an offence committed while they were looked after, expressed as a ratio of the percentage of all children aged 10 or over given a final warning/reprimand or convicted for an offence in the police force area
5022SC PAF CF/A4 Employment, education and training for care leavers [joint working] (BVPI 161) - see p.157
Related measures2064SC PAF CF/C68: Timeliness of reviews of children looked after - see p.573071SC The % of children looked after who were pupils in year 11 who were eligible for GCSE (or equivalent) examinations who sat at least one GCSE or equivalent exam - see p.1083072SC PAF CF/A2: Educational qualifications of children looked after [joint working] (BVPI 50) - see p.1103073SC The % of young people leaving care aged 16 or over with 5 or more GCSEs at grade A*-C or GNVQ equivalent - see p.112
4016SC PAF CF/C63: Participation of looked after children in reviews - see p.1333074SC PAF CF/C24: Children looked after absent from school [joint working] - see p.114
In 2006-07 the percentage of looked after children that received a final warning/reprimand or conviction (the numerator) was 9.6%. This is still above the previous PSA target level of 7.2% that was to be achieved by 2004. Although the looked after offending rate has been falling in the past few years, the rate of offending in the 10 to 17 year old population as a whole has fallen more sharply. Consideration, therefore, should be given to the trend of the looked after offending rate within the council as this is, by itself, good evidence of good (or, indeed, poor) performance.There is a relationship between offending and educational attendance & attainment (3071SC, 3073SC, 3072SC CF/A2 & 3074SC CF/C24) and a young persons situation as a care leaver (5022SC CF/A4), as well as a potential one with the conduct of reviews (4016SC CF/C63 & 2064SC PAF CF/C68). The nature of the complex ratio that forms this indicator means that making a clear link is not straightforward, hence the need to consider the looked after component on its own.
Nearly one in three councils had relatively small numbers of looked after children, that is fewer than 10, that fell into the required category for inclusion in 4015SC PAF CF/C18 in 2006-07. Small changes in numbers can have large consequences to the end result and the measure may, therefore, be subject to large swings from year to year. It is important to look separately at the numerator and denominator for this indicator. The trend data is also key, because a council may be successfully reducing its looked after numerator ratio while the denominator ratio for the police force area is reducing at a faster rate.
A figure of one shows that children looked after are given final warnings/reprimands or are convicted at the same rate as all children in the area; less than one would show children looked after are given final warnings/reprimands or convicted less than all children. Such low values would be unlikely and may be due to poor data quality. Consideration should always be given to the proportion of the relevant young people who are placed outside of authority and the extent to which data is captured effectively on these young people.
Offending is both a factor in the past history of a significant number of children who become looked after and is a measure of the quality of care and support children receive once in care.Caution should be exercised in the interpretation of this indicator. It is a complex ratio rather than a number of young people in the area as it compares final warnings/ reprimands or convictions for children looked after by each council with the rate for all children in the police force area, which may cover several adjoining councils. Those councils may either be advantaged or disadvantaged by the denominator.
Guidance/interpretation
[If you have any queries about this indicator please contact: [email protected] and quote ref: 4015SC]

Making a positive contribution
Kingston Upon Hull
2005-06 2006-07 2007-08LA 90 86 92 . = Data not applicableSN 77 89 92 .. = Data not availableEng 79 87 91 - = Data suppressed
due to small numbers
Bands Low High
2005-06 0<65 65<75 75<85 85<95 95<=1002006-08 0<70 70<80 80<90 90<95 95<=100
Continued on following page
Denominator[Source - SSDA903]
Looked after children and care leavers data4016SC - PAF CF/C63: Number of children and young people who communicated their views specifically for each of their statutory reviews as a percentage of the number of children and young people who had been looked after at 31 March for more than four weeks
Of the children in the denominator, the number of children who communicated their views for each of their statutory reviews during the year ending 31 March using a range of mechanisms including personal participation, written or electronic communication or independent representation (method of participation codes PN1, PN2, PN3, PN5 and PN6).
NumeratorData definition
[Source - SSDA903]
The number of children who were looked after at 31 March who had been reviewed during the year to 31 March 2008. Excludes those who started to be looked after (reason for new episode of S) on or after 4 March. It excludes children looked after under a series of short term breaks (legal status codes V3 and V4). Children under the age of four at the time of a review (method of participation code PN 0) should be excluded.
* Any reviews before their fourth birthday and coded as PN0 should be disregarded.* The participation code[s] for the review[s] following their fourth birthday should determine their inclusion in the numerator.* The child should be counted in the denominator.
For children who reach four years of age during the year and who are due to have one or more reviews between their fourth birthday and the end of the year:
There was a change to CF/C63, in 2005-06, from the coverage of participation at the most recent review of each relevant looked after child to the coverage of participation in all reviews.The denominator should consist of the number of looked after children who qualify and who were looked after at March 31 [i.e. not the number of reviews of those children in the preceding year]. Therefore, if a child who is looked after at 31 March 2007 has had three reviews in 2006-07 which meet the criteria for inclusion, the child is counted in the denominator, and the numerator should report only those children from the denominator all of whose reviews in the year involved their participation.Children who reach four years of age during the year.
Percentage as a whole numberMeasuring unit
4016SC - PAF CF/C63: Participation of looked after children in reviews
0
10
20
30
40
50
60
70
80
90
100
2005-06 2006-07 2007-08
%
Unbanded
Very good
Good
Acceptable
Ask questions aboutperformanceInvestigate urgently
SN
Eng
[If you have any queries about this indicator please contact: [email protected] and quote ref: 4016SC]

Making a positive contribution
Kingston Upon Hull
Looked after children and care leavers data4016SC - PAF CF/C63: Number of children and young people who communicated their views specifically for each of their statutory reviews as a percentage of the number of children and young people who had been looked after at 31 March for more than four weeks
The extent to which a child participates in their reviews may have an impact on the outcomes for the child in key areas, as well as the indicators can cover them, such as health (1037SC CF/C19), offending (4015SC PAF CF/C18), educational attendance & attainment (3071SC, 3073SC, 3072SC CF/A2 & 3074SC CF/C24) and a young persons later situation as a care leaver (5022SC CF/A4).
There is a statutory obligation to review the cases of looked after children, first within 28 days of their becoming looked after, then within a further three months, and subsequently at intervals of no more than six months until they cease to be looked after. Councils need to ensure that the views expressed by children and young people are given due consideration and action taken where appropriate to achieve agreed outcomes for the young person.Where children have not participated, councils also need to ensure that they have a good understanding of the reasons for this and plans in place to minimise non-participation. Consideration should be given to: the age of these children, in relation to the appropriate engagement of the very youngest children; children placed out-of-authority, in relation to the facilitation of effective participation of those distant from the council area; the extent to which children had a severe disability; and the extent to which the children did not want to participate in their review. All of these factors can have a bearing on the indicator value.
The indicator measures participation in the review process as a proxy for the measurement of the effectiveness of the monitoring of the care of looked after children.The active participation of looked after children in planning their care should contribute to improved outcomes. To ensure that the views of looked after children and young people are listened to, good practice dictates that they should either attend and participate in the review meeting, or should at least be able to express their views by some other appropriate method. The indicator measures the percentage of looked after children who did so at all their statutory reviews. The definition of the indicator allows for a wide range of ways in which this might happen. Only if the child or young person does not attend or express their views by any other means are they considered not to have participated in the review.
Guidance/interpretation
2060SC % of looked after children with a named social worker who is qualified as a social worker - see p.692043SC PAF CF/A1: Stability of placements of children looked after (BVPI 49) - see p.591037SC PAF CF/C19: Health of looked after children - see p.26Related measures
2064SC PAF CF/C68: Timeliness of reviews of children looked after - see p.57
3074SC PAF CF/C24: Children looked after absent from school [joint working] - see p.1143073SC The % of young people leaving care aged 16 or over with 5 or more GCSEs at grade A*-C or GNVQ equivalent - see p.1123072SC PAF CF/A2: Educational qualifications of children looked after [joint working] (BVPI 50) - see p.110
3071SC The % of children looked after who were pupils in year 11 who were eligible for GCSE (or equivalent) examinations who sat at least one GCSE or equivalent exam - see p.108
4015SC PAF CF/C18: Final warnings/reprimands and convictions of children looked after - see p.1315022SC PAF CF/A4 Employment, education and training for care leavers [joint working] (BVPI 161) - see p.1576012SC % of SSD directly employed posts for children and families vacant on 30 September - see p.174
[If you have any queries about this indicator please contact: [email protected] and quote ref: 4016SC]

Post-16 education and training data
ACHIEVING ECONOMIC WELL-BEING

ACHIEVING ECONOMIC WELL-BEINGPost 16 education & training data
Kingston Upon Hull, City of
Percentage of young people by LA achieving level 2 by age 19 Traffic lights have not been applied
Year Area SN Nat to this indicator2005 54.4% 60.1% 65.7%2006 58.1% 61.8% 67.7%2007 60.0% 62.7% 69.8%
Percentage of young people by LA achieving level 3 by age 19
Year Area SN Nat2005 29.5% 34.1% 43.1%2006 31.0% 33.9% 44.3%2007 31.4% 34.4% 45.4%
Health Warning:
[If you have any queries about this indicator please contact: [email protected] - Please quote REF: 5038LS]
The DCSF Statistical First Release explains the differences in more detail: http://www.dfes.gov.uk/rsgateway/DB/SFR/s000774/index.shtml.
5038LS: Percentage of young people by local authority/district achieving level 2 and level 3 by age 19
Data Definition:This indicator shows the percentage of young people by LA achieving level 2 & 3. This includes those that were of 19 years of age at the end of the academic year which begins from September to the end of August of each year.
Source: Learning & Skills Council
This indicator is not traffic lighted as Local authority figures are measured in a different way to national/regional/LLSC level figures. Please use with caution when comparing LA and national %s. Some of the LSC's data indicates which local Learning & Skills Council the young person studies in, but not which local authority. Around 3% (20,000 young people) are not accounted for. Statistical neighbour figures have been added by Ofsted to assist inspectors, and are median averages of the %s for all of the LA's statistical neighbours. The data above is not final, as providers are allowed to resubmit data in January and February whilst the data matching is done in December – and DCSF’s contractors have re-matched data using the latest available data. They continue to refine their data matching techniques and in some cases this leads to small changes to earlier years as well.
Percentage of young people by LA achieving level 2 by age 19
0.0%
20.0%
40.0%
60.0%
80.0%
100.0%
2005 2006 2007
Area 'SN' 'NAT'
Percentage of young people by LA achieving level 3 by age 19
0.0%
20.0%
40.0%
60.0%
80.0%
100.0%
2005 2006 2007
Area 'SN' 'NAT'

ACHIEVING ECONOMIC WELL-BEINGPost 16 education and training data
Kingston Upon Hull
A Level Area SN Nat Area SN Nat2003 262.02 257.08 265.66 V
2004 268.86 263.51 272.16 V 03/04 6.84 6.43 6.502005 285.76 267.44 277.21 V 04/05 16.90 3.93 5.05
2006 749.32 709.56 740.10 V 05/06 n/a n/a n/a 2007 762.00 733.07 747.99 V 06/07 12.68 23.51 7.89
A Level Area SN Nat Area SN Nat2003 73.10 73.79 76.79 V
2004 72.43 74.79 77.52 V 03/04 -0.67 1.00 0.732005 73.38 75.61 78.36 V 04/05 0.95 0.82 0.84
2006 195.02 198.27 202.62 V 05/06 n/a n/a n/a 2007 202.39 201.37 203.05 V 06/07 7.37 3.10 0.43
.. = data not available V = Validated datan/a = not applicable U = Unvalidated data
CE/VCE A/ASAverage point score per GCE/VCE A/AS entry
Subject Area SN Nat Subject Area SN Nataps/studen 2003 262.02 257.08 265.66 aps/entry 2003 73.1 73.79 76.79
2004 268.86 263.51 272.16 2004 72.43 74.79 77.522005 285.76 267.44 277.21 2005 73.38 75.61 78.36
2006 749.32 709.56 740.1 2006 195.02 198.27 202.62 2007 762 733.07 747.99 2007 202.39 201.37 203.05
RAI, Ofsted Ref: 5003OF 5004OFAbove In Line
Year-on-Year Change
SN NAT
Below Well Below
Health warning: These figures include mainstream schools only (i.e. no special schools or independent schools are included). Therefore figures may be different from DCSF published figures. Discontinuous data. Before 2006 the average point scores were based on the UCAS tariff. 2006 figures are based on the QCA tariff, a new scoring system that extends to cover all Level 3 qualifications. Details of the QCA scoring system can be found on DCSF website http://www.dfes.gov.uk/performancetables/16to18_06/d3.shtml. Therefore, extra care should be taken when comparing 2006 figure with those from previous years as they do not include the wider range of qualifications and are based on a different point scoring system.
Schools with sixth forms: average point scores of students entered for GCE/VCE A/AS and average point scores per GCE/VCE A/AS entry Ref. 5003OF, Ref. 5004OF
Average point score of 16-18 year old students entered for GCE/VCE A/AS
Data Definition: Data only includes students in mainstream maintained schools. For data on level 3 qualifications in colleges please refer to indicator 5008OF. The average point score per student entered is calculated as the sum of the points awarded to each 16-18 year old student, divided by the number of 16-18 year old students studying in the schools in the area. The average point score per examination entry is calculated as the sum of the points awarded to each 16-18 year old student, divided by the total number of entries. [Source: DCSF Achievement + Attainment Tables]
Year-on-Year Change
Area
Average point score per GCE/VCE A/AS
Well Above
GCE/VCE Average Point Score per entry
0
50
100
150
200
250
300
350
400
450
500
2003 2004 2005 2006 2007
GCE/VCE Average Point Score per student entered
0
100
200
300
400
500
600
700
800
900
2003 2004 2005 2006 2007
If you have any queries about this indicator please contact: [email protected] Please Quote Ref: 5003OF 5004OF

ACHIEVING ECONOMIC WELL-BEINGPost 16 education and training data
Kingston Upon Hull
2003/04 2004/05 2005/06 2003/04 2004/05 2005/06 2003/04 2004/05 2005/06GFE/Tertiary Colleges4 Notional Level 3 1,796 1,788 1,560 66 67 67 64 68 70Notional Level 2 1,998 1,828 1,616 60 63 66 56 61 66Notional Level 1 2,487 2,713 3,030 68 75 74 61 65 69Sixth Form Colleges4
Notional Level 3 5,941 6,013 5,699 74 76 77 80 82 83Notional Level 2 1,535 1,221 1,377 68 76 76 74 73 78Notional Level 1 983 1,123 1,132 47 53 56 67 64 71Specialist CollegesNotional Level 3 n/a n/a n/a n/a n/a n/a 66 69 74Notional Level 2 n/a n/a n/a n/a n/a n/a 62 68 73Notional Level 1 n/a n/a n/a n/a n/a n/a 62 65 78
continued on following page
Indicator: Further Education institutions/sixth form colleges/specialist colleges: success data by level
Success rate by notional level for students aged 16-18 at the start of courses with the expected end years 2003/04, 2004/05, and 2005/06
Institution and Notional levelArea Starts excluding transfers Area Rate (%) National Rate3 (%)

ACHIEVING ECONOMIC WELL-BEINGPost 16 education and training data
Kingston Upon Hull
Indicator: Further Education institutions/sixth form colleges/specialist colleges: success data by level
Institution and Qualification Type1, 2
GFE/Tertiary Colleges4
A Level Subjects 173 83 87AS level Subjects 490 57 67GNVQ Level 3 85 64 66NVQ Level 3 85 79 71Other Long Level 3 727 69 65GCSE Subjects (Grades A*- G) 386 72 68GNVQ Level 2 79 43 69NVQ Level 2 294 65 65Other Long Level 2 857 65 66GNVQ Level 1 11 91 72NVQ Level 1 234 76 72Other Long Level 1 2,785 74 69Sixth Form Colleges4
A Level Subjects 1,782 89 93AS level Subjects 3,546 72 79GNVQ Level 3 82 83 74NVQ Level 3 5 100 n/aOther Long Level 3 284 67 75GCSE Subjects (Grades A*- G) 1,017 79 82GNVQ Level 2 25 68 77NVQ Level 2 4 75 70Other Long Level 2 331 67 70GNVQ Level 1 6 67 79NVQ Level 1 n/a n/a n/aOther Long Level 1 1,126 56 71Specialist CollegesA Level Subjects n/a n/a n/aAS level Subjects n/a n/a 76GNVQ Level 3 n/a n/a n/aNVQ Level 3 n/a n/a n/aOther Long Level 3 n/a n/a 73GCSE Subjects (Grades A*- G) n/a n/a n/aGNVQ Level 2 n/a n/a n/aNVQ Level 2 n/a n/a n/aOther Long Level 2 n/a n/a 75GNVQ Level 1 n/a n/a n/aNVQ Level 1 n/a n/a 72Other Long Level 1 n/a n/a 78
Source: Learning and Skills Council (LSC) - calculations performed by Ofsted
If you have any queries about this indicator please contact: [email protected] Please quote ref 5007OF
Health Warning1. The data is for students aged 16-18, therefore excluding students aged 19+2. The data excludes the Key Skills qualification
Area Starts excluding transfers
Success rate by qualification type for students aged 16-18 at the start of courses with the expected end year 2005/06
Area Rate (%) National Rate3 (%)
Data Definition:1. Grades A-E for GCE A and AS Levels, Grades A*-G for GCSEs, pass, merit and distinction for GNVQs and achieved for NVQs, are classified as passes.2. Qualifications are grouped according to their NVQ level or notional equivalent according to the categorisation of each qualification on the Learning and Skills Council’s qualification database. Data are presented for long (>=24 weeks) qualifications at notional levels 1 (includes level E), 2 and 3. Key skills qualifications and qualifications with unknown, unspecified, mixed or invalid notional levels are excluded.3. Where “n/a” appears, there were less than 500 starts nationally or there were too few colleges to produce a valid national rate.4. Separate benchmarking data have been used for areas with very high widening participation factors. 5. n/a indicates that data for the relevant section is not applicable as there is no data for the relevant college type.6.The student success rate is based on the local authority of where the young person studies, and not on the local authority of where the young personlives.7. Success rate is defined as the number of qualifications learners have fully achieved divided by the number of qualifications started, excluding transfers out. For programmes of study of two years or more, success is calculated across the whole programme, that is, from the start to the end of the qualification.

ACHIEVING ECONOMIC WELL-BEINGPost-16 education and training
Kingston-upon-Hull
NVQ Success Rate for all work-based learners living in the area.
Overall success rate Year-on-year changeYear Area National Year Area Nat2004 48.5% 46.0%2005 52.0% 50.4% 04/05 +3.5% +4.5%2006 57.8% 56.7% 05/06 +5.8% +6.3%2007 64.4% 64.8%
Timely success rate Year-on-year changeYear Area National Year Area Nat2004 28.7% 28.2%2005 32.0% 31.3% 04/05 +3.3% +3.1%2006 38.5% 36.7% 05/06 +6.5% +5.4%2007 48.7% 45.7%
Success rate by learning programme (2007) Success rate by learner characteristics (2007)Programme Overall National Timely National Characteristic Overall National Timely National
All-WBL NVQ 64.4% 64.8% 48.7% 45.7% Male 65.2% 65.1% 45.3% 44.2%AA Framework 63.3% 57.7% 38.6% 37.4% Female 63.0% 64.5% 54.2% 47.4%
AA NVQ 3.9% 6.5% 3.7% 5.4% White 64.3% 59.9% 48.5% 41.6%A Framework 58.7% 61.3% 48.4% 43.9% Non-white 68.0% 65.4% 58.3% 46.2%
A NVQ 4.1% 3.8% 2.7% 3.1% LDD 60.8% 65.1% 51.3% 46.0%NVQ only 87.0% 64.9% 81.8% 47.5% Non-LDD 64.9% 59.7% 48.4% 41.1%
Data Definition:
Health warning:
NVQ success rate for all work-based learners living in the area and aged under 19 at the start of their programme (split by learning programme, gender, ethnicity and disability)
Traffic Lights have not been applied to
this indicator
In contrast to other school and college indicators presented in this toolkit, WBL analysis is based on the local authority where the young person lives, not the local authority where they study. The overall success rate measures the percentage of work-based learners who successfully completed their apprenticeship framework or the main NVQ element of their programme at any time. Learners are counted in the later of their planned end year and their actual end year. The timely success rate measures the percentage of work-based learners who successfully completed their framework or NVQ by their planned end date, or within one month of it. Learners are counted in their planned end year. For more details please see the LSC's WBL Success Rate Methodology 2005/06.
The figures in all the success rate calculations are limited to learners aged under 19 as at 1st August in the year which they started their learning.
These figures use a different methodology from those which has historically been used by the LSC and the inspectorates. The change should not have a significant effect on performance at local authority level. The matching process used to generate the dataset for calculating this indicator means that not every learner could be allocated to a local authority which could have an impact on the figures.
[Source: Learning & Skills Council Individual Learner Record. Data supplied to Ofsted by the Adult Learning Inspectorate.]
Overall success rate
0.0%
20.0%
40.0%
60.0%
80.0%
100.0%
2004 2005 2006
%
Timely success rate
0.0%
20.0%
40.0%
60.0%
80.0%
100.0%
2004 2005 2006
%
AREA NAT

ACHIEVING ECONOMIC WELL-BEINGPost-16 education and trainingNVQ success rate for all work-based learners living in the area and aged under 19 at the start of their programme (split by learning programme, gender, ethnicity and disability)
Interpretation:
2007 data update:- As above, data are based on learners aged under 19 at 1st August 2006. --
-
--
Source: LSC Work-based Learning (WBL) Qualification Success Rate (QSR) master file period 15 2006/07.
In the ethnic group figures, the "white" category includes those classified as White-Irish and White-Other, as well as White-British. The "non-white" category includes all other ethnic groups, including those whose ethnic group was unknown or not stated.
There are considerable variations in NVQ success rates across different sectors within work-based learning. There are also significant differences in the proportions of learners with different characteristics within sectors. Variations in success rates between groups of learners with different characteristics may, therefore, relate in part to the different sectors they are learning in.
For apprenticeship programmes, the NVQ success rate figures show the success rate for the NVQ element of the framework. This includes the breakdown of success rates by learner characteristics.
The methodology used here is broadly equivalent to that used in FE colleges but takes account of the different nature of work-based learning programmes.
The disability/learning need figures do not distinguish between learners with a disability, those with a learning need and those with both. Typically, the number with learning needs is higher than those with a disability. In most cases, the learning needs identified are either moderate learning difficulties or dyslexia.
Many learners living in the area may be with learning providers based outside the local authority area.
Figures for disability/learning need are based on learners' self-declaration. A proportion, usually under 10%, of learners do not respond to the relevant questions. They are included in the non-disabled/learning need group.
Data are not directly comparable to previous years as Ofsted methodology differs from that of the former ALI's.
Data are based on period 15 2006/07 (31st October 2007) in line with the work-based learning Provider Performance Reports 2006/07.LA are based on postcode using the Office of National Statistics (ONS) National Statistics Postcode Directory.
Where it is not possible to identify a learners local authority (LA), the LA of the delivery provider has been assigned, followed by the LA of the providers contract address. This provides 98% coverage of learners allocated to LA.
Overall and timely success rate and success rate by learner characteristic are based on those who have achieved a framework and NVQ.
If you have any queries concerning this data please contact [email protected] & quote REF: 5039AL

ACHIEVING ECONOMIC WELL-BEINGPost 16 education and training data
Kingston-upon-Hull
Year-on-year ChangeYear Area National Year Area Nat2004 10.6% 15.5%2005 9.5% 15.2% 04/05 -1.1% -0.3%2006 8.0% 14.5% 05/06 -1.5% -0.6%2007 10.0% 15.2%
Proportion of WBLs by Gender Year-on-year ChangeYear Year
Male Female Male Female Male Female Male Female2004 64.7% 35.3% 61.6% 38.4%2005 67.8% 32.2% 62.3% 37.7% 04/05 +3.1% -3.1% +0.7% -0.7%2006 66.8% 33.2% 62.2% 37.8% 05/06 -1.0% +1.0% -0.1% +0.1%2007 65.0% 35.0% 61.8% 38.2%
Proportion of WBLs by Ethnicity Year-on-year ChangeYear Year
White Non-White White Non-White White Non-White White Non-White2004 99.0% 1.0% 93.8% 6.2%2005 98.7% 1.3% 94.0% 6.0% 04/05 -0.3% +0.3% +0.2% -0.2%2006 98.2% 1.8% 93.7% 6.3% 05/06 -0.5% +0.5% -0.4% +0.4%2007 98.9% 1.1% 93.2% 6.8%
Health warning:
Interpretation:
2007 data update:- As above, data are based on learners aged under 19 at 1st August 2006. --
--
Source: LSC Work-based Learning (WBL) Individualised Learner Record (ILR) period 3 2007/08.
If you have any queries concerning this data please contact [email protected] & quote REF: 3079AL
Figures for disability/learning need are based on learners' self-declaration and so they may be an underestimate. A proportion, usually under 10%, of learners do not respond to the relevant questions. They are excluded from the calculation.
[Source: Learning & Skills Council Individual Learner Record. Data supplied to Ofsted by the Adult Learning Inspectorate.]
In the ethnic group figures, the "white" category includes those classified as White-Irish and White-Other, as well as White-British. The "non-white" category includes all other ethnic groups, including those whose ethnic group was unknown or not stated.
The disability/learning need figures do not distinguish between learners with a disability, those with a learning need and those with both. Typically, the number with learning needs is higher than those with a disability. In most cases, the learning needs identified are either moderate learning difficulties or dyslexia.
The learners do not necessarily live within the local authority where the learning provider is based. The registered address of the learning provider may be their head quarters rather than the site which the learner attended.
National
Area National
In contrast to other school and college indicators presented in this toolkit, WBL analysis is based on the local authority where the young person lives, not the local authority where they study. The number of work-based learners living in the area who were aged under 19 at 1st August in the relevant year with the relevant gender, ethnic group or disability/learning need status, as a percentage of all work-based learners living in the area within the same age group.
Data Definition:
Area National
Area National
Area
Traffic Lights have not
been applied to this
indicator
Proportion of WBLs with Learning Difficulties and/or Disabilities
Personal characteristics of Work-based learners living in the area aged under 19 (gender, ethnicity and disability)
Data are not directly comparable to previous years as Ofsted methodology differs from that of the former ALI's.
Data are based on period 3 2007/08 (31st October 2007) in line with the work-based learning Provider Performance Reports 2006/07.
Where it is not possible to identify a learners local authority (LA), the LA of the delivery provider has been assigned, followed by the LA of the providers contract address. This provides 99% coverage of learners allocated to LA.LA are based on postcode using the Office of National Statistics (ONS) National Statistics Postcode Directory.
Proportion of WBLs with Learning Difficulties and/or Disabilities
0%
5%
10%
15%
20%
2004 2005 2006
Area National
Proportion of WBLs by Gender
0%
20%
40%
60%
80%
100%
Male Female Male Female
Area National
2004 2005 2006
Proportion of WBLs by Ethnicity
0%
20%
40%
60%
80%
100%
White Non-White White Non-White
Area National
2004 2005 2006

ACHIEVING ECONOMIC WELL-BEINGPost 16 education and training data
Kingston Upon Hull, City of
Year-on-Year ChangeYear Area SN Nat Year Area % SN % Nat % Traffic lights have not2004 447 240 320 2003/04 .. .. .. been applied to this 2005 603 330 440 2004/05 34.9% 37.3% 37.6% indicator2006 720 499 650 2005/06 19.4% 51.4% 47.7%
.. = Data not available
graph to follow
[If you have any queries about this indicator please contact: [email protected] - Please quote REF: 5048DE]
5048DE: Increase in the number of young people completing an apprenticeship
Data Definition: This indicator includes all learners up to the age of 24 (for consistency with national performance indicators). It shows the increase in the number of young people completing an apprenticeship.
[Source: Learning & Skills Council - http://www.lsc.gov.uk/providers/Data/statistics/learner/Apprenticeship_completions.htm
Health warning: The Local Authority is based on the home postcode of the learner, and only includes those learners who could be matched to an English local authority - 98-99% of the overall total. Figures are not shown where there are less than 10 completions in a local authority. SN figures have been added by Ofsted to assist inspectors. They are median averages of the %s for all of the LA's statistical neighbours.
Area SN NAT
Year-on-year changeIncrease in number of young people completing an
apprenticeship
0.0%
10.0%
20.0%
30.0%
40.0%
50.0%
60.0%
2004/05 2005/06

Inspections findings
ACHIEVING ECONOMIC WELL-BEING

ACHIEVING ECONOMIC WELL - BEINGInspection findings
Kingston Upon Hull
Childminder Full Day CareSessional Day Care
Out of School Day
Care
Creche Day Care
TOTAL
4 ‘Steady State’ refers to changes in the number of places offered by existing providers.
5 Net Change: numbers may not add up due to rounding.
1 Joiners are childcare providers who have been newly registered; existing providers who have moved to a local authority from another local authority; and existing day care providers who have started to offer a new type of childcare provision.
2 Leavers are childcare providers who have been deregistered due to cancellations or voluntary resignations; existing providers who have moved from a local authority to another; and existing multiple day care providers who have ceased to offer a particular type of childcare provision between 01 April 2005 and 31 March 2008.
3 Registered Places are the maximum number of children that providers are registered to care for, not the number of places occupied, nor the number of children who may benefit from receiving places through providers offering sessions at different times of the day. The number of registered places is likely to be higher than the actual number of registered places as not all providers will immediately inform Ofsted that they have ceased their provision.
7.7% -3.5%Percentage Change: SN -7.8% 20.5% -24.0%
Percentage Change: NAT -5.5% 20.2%
8.0%
Percentage Change: SN -5.7% 21.8% -23.5%
-15.6%
-23.5% -2.3% -2.0%
5.5%
-0.4% 11.7% 4.0%
8.2% 10.5%
Percentage Change: Area -3.3% 14.8% -26.3%
191
Net Change 5 -35 322 -118 -264 -7 -102
Steady State 4 37
Leavers 689 892 266
16 3114 21
718 105 2667
998 116 2960
Joiners 617 1099 127
Number of Registered Places 3 1011 2495 330
10.5% 11.3% -3.6%
857 292 4985
Percentage Change: NAT -7.9% 18.1% -17.1%
Percentage Change: Area -8.2% 8.3% -31.6%
-8 -1 -28
-21.6% -5.6% -8.5%
Net Change -17 4 -6
24 6 186
Leavers 2 139 24 12 32 7 214
Joiners 1 122 28 6
Changes in childcare providers and places (since April 2005 benchmark)
Number of Childcare Settings 191 52 13 29 17 302
Number of settings and places in your local authority at 31 March 2008 and percentage change from 01 April 2005 by provider type
If you have any queries about this indicator please contact: [email protected] Please quote ref: 5040OF

ACHIEVING ECONOMIC WELL - BEINGInspection findings
Changes in childcare providers and places (since April 2005 benchmark)
Early Years Definitions of Childcare Types
Crèches: Facilities that provide occasional care for children under eight and are provided on particular premises on more than five days a year. They need to be registered where they run for more than two hours a day, even when individual children attend for shorter periods. Some are in permanent premises and care for children while parents are engaged in particular activities, for example shopping or sport. Others are established on a temporary basis to care for children while their parents are involved in time-limited activities, for example a conference or exhibition.
Multiple Day Care Types: Some providers offer more than one type of day care, for example operating full day care and an out of school club. In this profile, these multiple day care types have been counted separately. In the other sections, they multiple day care types have been shown as single entities under their own category, to avoid double counting of inspections and actions issued.
Childminder: A childminder is registered to look after one or more children under the age of eight to whom they are not related on domestic premises for reward and for a total of more than two hours in any day.
Full Day Care: Facilities that provide day care for children under eight for a continuous period of four hours or more in any day in premises which are not domestic premises. Examples are day nurseries and Children’s centres, and some family centres.
Sessional Day Care: Facilities where children under eight attend day care for no more than five sessions a week, each session being less than a continuous period of four hours in any day. Where two sessions are offered in any one day, there is a break between sessions with no children in the care of the provider. This is intended to cover provision which offers children part-time care and the opportunity to engage in activities with their peer group, e.g. playgroups.
Out of School Care: Facilities that provide day care for children under eight which operate during one or more of the following periods: before school; after school; and during the school holidays. The total care provided is for more than two hours in any day and for more than five days a year. A main purpose of the provision is to look after children in the absence of their parents. This form of care can include children from three years old and children over eight may use it. Examples are summer camps, holiday play schemes, breakfast clubs, after school clubs. Open Access Schemes are included. These may be permanent of short term schemes and generally cater for older children, however, children aged five to seven may attend. The main purpose of the provision is to provide supervised play opportunities for children in a safe environment in the absence of their parents.
If you have any queries about this indicator please contact: [email protected] Please quote ref: 5040OF

ACHIEVING ECONOMIC WELL-BEINGInspection Findings
Kingston Upon Hull
Number of colleges inspected in Kingston Upon Hull = 1
3b: How far programmes or the curriculum meet external requirements, and are responsive to local circumstances
Key Grade 1 Outstanding1 2 3 4 Grade 2 Good
LA 1 0 1 0 0 1 Grade 3 SatisfactoryNat 294 104 137 48 5 Grade 4 Inadequate
.. = data not available
Data definition
Health warning
5029OF: How far programmes or the curriculum meet external requirements, and are responsive to local circumstances (Key Question 3b)
Due to the small number of colleges in general and with the inspection cycle not yet complete, care should be taken when drawing conclusions or making comparisons with the national figure. The current cycle incorporates risk assessment when scheduling inspections and as a result stronger colleges may not be inspected until towards the end of the cycle and therefore care must be taken when evaluating these figures. The number of judgements may be less than the number of inspections if inspectors did not have sufficient evidence to record an outcome. Some colleges may have closed since their inspection.
TotalNo
[Source: Ofsted Post 16 Education & Training Inspection (2005-07 Common Inspection Framework)]
These judgements reflect the outcomes of the inspections undertaken between 4th October 2005 and 31st March 2008. A full description of how these judgements are made by inspectors can be found at http://intranet/NR/rdonlyres/1900C398-C1DC-4531-A08D-2E29915CC416/0/collegeInspectionHandbook.doc. The figures represent the number of colleges inspected so far in the 4 year cycle that received an outstanding, good, satisfactory or inadequate judgement. Please note figures may be blank where there were no colleges in the LA, or none have been inspected during this period. Where a college has been inspected twice within the cycle, all inspections are shown.
Grade
If you have any queries about this indicator please contact: [email protected]. Please Quote Ref: 5029OF

Employment and NEET data
ACHIEVING ECONOMIC WELL-BEING

ACHIEVING ECONOMIC WELL-BEINGEmployment and NEET data
Kingston upon Hull
Traffic lights have not beenapplied to this indicator.
Age YearArea No. Adjusted
EET
Area No. Adjusted
NEETArea % SN % Nat %
16-18 05-06 27,459 4,449 13.9% 11.6% 8.2%
06-07 23,095 3,787 14.1% 11.3% 7.7%
07-08 9,348 1,189 11.3% 9.5% 6.7%
.. = Data not available
If you have any queries about this indicator please contact: [email protected]. Please quote ref 5041DE.
5041DE: Connexions Partnership data: number and proportion of 16-18-year-olds not in education, employment or training (NEET)
58% of young people who were previously NEET, but who have lost contact with the service, are NEET.
[Source: Connexions Customer Information System - CCIS, supplied to Ofsted by DCSF]
8% of young people who are previously in employment education or training, but who have lost contact with the service, are NEET, and;
Data Definition: Young people can only be counted in the NEET group once they have completed compulsory education. Data is taken from the Partnership's submissions of November to January for each year. The numerator is the number of young people not in education, employment or training (NEET), and the denominator is the number of young people who are NEET + number of young people who are EET. The figures for this indicator are average figures taken from November to January of each year. The data is for a single local authority and not the whole Partnership area.
Health warning: Young people undertaking personal development opportunities are counted as NEET for the purposes of this indicator. All NEET and EET figures are adjusted by the DCSF to allow for young people whose current activity is not known. This assumes that: -

ACHIEVING ECONOMIC WELL-BEINGEmployment and NEET data
Kingston upon Hull
Year Area % Nat %
Maintained schools 2004 5.0% 23.0%
Independent schools 2004 3.0% 6.0% Traffic lights have not been
Sixth form college 2004 17.0% 8.0% applied to this indicator.
Other FE 2004 22.0% 23.0%
Total FT Education 2004 47.0% 60.0%
Work Based Learning 2004 14.0% 9.0%
Part-time education 2004 6.0% 5.0%
Total Education and WBL 2004 67.0% 74.0%
Year Area % Nat %
Maintained schools 2005 5.0% 23.0%
Independent schools 2005 3.0% 6.0%
Sixth form college 2005 18.0% 9.0%
Other FE 2005 25.0% 25.0%
Total FT Education 2005 51.0% 63.0%
Work Based Learning 2005 15.0% 8.0%
Part-time education 2005 5.0% 5.0%
Total Education and WBL 2005 71.0% 76.0%
Year Area % Nat %
Maintained schools 2006 5.0% 23.0%
Independent schools 2006 3.0% 6.0%
Sixth form college 2006 20.0% 9.0%
Other FE 2006 27.0% 27.0%
Total FT Education 2006 55.0% 65.0%
Work Based Learning 2006 13.0% 8.0%
Part-time education 2006 4.0% 5.0%
Total Education and WBL 2006 72.0% 78.0%
.. = Data not available
If you have any queries about this indicator please contact: [email protected]. Please quote ref 5047DE.
Health warning: The local participation estimates for end 2006 academic year is the latest published information available. Local estimates lag a year behind national estimates as the LSC's Individual Learner Record (ILR) data is not sufficiently complete at that stage to produce reliable local authority figures. The figures include only those young people in full time education and work based learning, and those in other forms of education and training (employer funded training, private training organisations, etc) are excluded. This indicator measures those that had their 17th birthday within the academic years highlighted above. Figures for the 14 individual Inner London LAs cannot be estimated reliably so data is not shown. Figures will not match Connexions data shown in this dataset.
5047DE: Connexions Partnership data: increase in participation rates of 17-year-olds in education and training
Data Definition: This indicator shows the % participating in each type of education and training. Training only covers Work Based Learning (training funded by the government). It does not include other forms of training that are privately or employer funded, as robust information is not available at LA level.
[Source: DCSF: Participation rates Statistical First Release]

ACHIEVING ECONOMIC WELL-BEINGEmployment and NEET data
Kingston upon Hull
Traffic lights have not beenapplied to this indicator.
Age Year Area No. Cohort Average Area % SN % Nat %
16-18 05-06 1,095 9,897 11.1% 7.8% 6.6%
06-07 2,129 8,911 23.9% 9.0% 6.9%
07-08 1,189 11,382 10.4% 6.7% 5.6%
.. = Data not available
If you have any queries about this indicator please contact: [email protected]. Please quote ref 5042DE.
Health warning: The period that the data measures is taken as the average between April and March for each year excluding July to September: these 3 months are excluded because a significant proportion of young people will be in transition between activities.
5042DE: Connexions Partnership data: proportion of 16-18-year-olds whose current activity is not known
[Source: Connexions Customer Information System - CCIS, supplied to Ofsted by DCSF]
Data Definition: The numerator is the number whose activity is not known, and the denominator is the total cohort recorded on Connexions Customer Information System (CCIS). Young people who have lost touch with services, or whose records are not up to date, are recorded as "activity not known". A low % will give assurance that tracking requirements are being followed. The data is for a single local authority and not the whole Partnership area.

ACHIEVING ECONOMIC WELL-BEINGEmployment and NEET data
Kingston upon Hull
Traffic lights have not been
applied to this indicator.
Age Year Area No. EET Average NEET Unadjusted Area % SN % Nat %
16-18 05-06 1,248 1,111 112.3% 151.6% 153.7%
06-07 864 991 87.2% 110.5% 120.2%
07-08 1,399 1,045 133.9% 186.6% 150.4%
.. = Data not available
If you have any queries about this indicator please contact: [email protected]. Please quote ref 5044DE.
Health warning: This indicator uses the unadjusted NEET figure. The way the data is counted changed in April 2006. This figure will be lower than in previous years as it no longer counts very short duration NEET. Destination is compared with previous month and only where different does an instance of joining/leaving NEET occur. This will exclude those who are in employment one month, leave that job and find another within the next reporting period.
5044DE: Connexions Partnership data: 16-18-year-olds leaving the NEET group to re-engage in employment, education or training
[Source: Connexions Customer Information System - CCIS, supplied to Ofsted by DCSF]
Data Definition: Young people are classed as being in this age group once they have completed compulsory education. Data is a cumulative total of young people who left the NEET group in the financial years 2005-06, 2006-07 and 2007-08 to re-engage in education, employment or training. The calculation divides the cumulative number of young people leaving the NEET group to become EET by the average number of 16-18 year old NEETs. A high % figure indicates a lot of movement into and out of the NEET group. Data is for a single local authority, and not the whole Partnership area. As young people could enter and leave the NEET group during the year, the percentage figure could be over 100%.

ACHIEVING ECONOMIC WELL-BEINGEmployment and NEET data
Kingston upon Hull
16-19 teenage mothers who are in education, employment or training (EET).
Year Area No. Recorded on CCIS Area % SN % Nat %
05-06 79 297 26.6% 19.6% 25.5%
06-07 156 385 40.5% 26.7% 30.3%
07-08 82 312 26.3% 24.1% 28.0%
16-19 NEET with Learning Disabilities & Difficulties
YearArea No. Adjusted
EET
Area No. Adjusted
NEETArea % SN % Nat %
05-06 349 81 18.8% 18.0% 15.7%
06-07 1,260 332 20.9% 17.4% 15.1%
07-08 791 219 21.7% 16.8% 13.7%
16-18 NEET by ethnic group category
YearArea No. Adjusted
NEET
Area No. Adjusted
EET
Area NEET %
SN NEET%
Nat NEET %
White 06-07 1,490 9,132 14.0% 11.5% 8.1%
White and Black Caribbean 06-07 # 18 #VALUE! 10.3% 14.5%
White and Black African 06-07 .. 12 #VALUE! 14.5% 8.6%
White and Asian 06-07 .. 17 #VALUE! 10.5% 6.6%
Other Mixed Background 06-07 11 36 23.4% 9.5% 10.0%
Black Caribbean 06-07 # 1 #VALUE! 10.3% 10.7%
Black African 06-07 .. 37 #VALUE! 5.4% 5.7%
Other Black Background 06-07 # 9 #VALUE! 16.1% 9.3%
Indian 06-07 # 15 #VALUE! 4.9% 3.1%
Pakistani 06-07 # 22 #VALUE! 5.3% 7.8%
Bangladeshi 06-07 # 21 #VALUE! 3.5% 8.3%
Other Asian Background 06-07 # 23 #VALUE! 9.3% 4.7%
Chinese 06-07 .. 17 #VALUE! 0.5% 1.7%
Other 06-07 # 45 #VALUE! 8.8% 6.2%
No Ethnicity Information 06-07 34 190 15.2% 11.6% 5.2%
Total 06-07 1,726 9,595 15.2% 11.2% 7.7%
YearArea No. Adjusted
NEET
Area No. Adjusted
EET
Area NEET %
SN NEET%
Nat NEET %
White 07-08 1,593 11,185 12.5% 10.1% 7.2%
White and Black Caribbean 07-08 # 21 #VALUE! 9.9% 12.1%
White and Black African 07-08 # 15 #VALUE! 11.1% 7.9%
White and Asian 07-08 # 16 #VALUE! 7.0% 5.8%
Other Mixed Background 07-08 11 33 24.0% 7.3% 8.5%
Black Caribbean 07-08 # 2 #VALUE! 4.0% 8.9%
Black African 07-08 # 37 #VALUE! 4.2% 4.7%
Other Black Background 07-08 # 9 #VALUE! 18.8% 8.0%
Indian 07-08 # 18 #VALUE! 2.0% 2.6%
Pakistani 07-08 # 19 #VALUE! 6.2% 6.5%
Bangladeshi 07-08 # 27 #VALUE! 3.5% 6.9%
Other Asian Background 07-08 # 33 #VALUE! 6.3% 4.0%
Chinese 07-08 # 26 #VALUE! 3.0% 1.3%
Other 07-08 # 70 #VALUE! 10.1% 6.5%
No Ethnicity Information 07-08 33 186 15.1% 8.4% 4.6%
Total 07-08 1,793 11,696 13.3% 0.9% 6.9%
Where the % NEET is above SN, it will be highlighted in red.
5045DE: Connexions Partnership data: young people at particular risk of becoming NEET

ACHIEVING ECONOMIC WELL-BEINGEmployment and NEET data
Kingston upon Hull
5045DE: Connexions Partnership data: young people at particular risk of becoming NEET
.. = Data not available
# = Less than 10
If you have any queries about this indicator please contact: [email protected]. Please quote ref 5045DE.
Data Definition: For the 16-19 teenage mothers calculation, the numerator is the number of 16-19 year old mothers in employment, education or training, and the denominator is the number of 16-19 year old mothers recorded on CCIS. However, for the LDD calculation, the numerator is the number of 16-19 year olds with learning disabilities or difficulties (LDD) who are NEET, and the denominator is the number of 16-19 year olds with LDD NEET + EET. Similarly, on the ethnic group calculation, the numerator is the number of 16-18 year olds who are NEET and the denominator is the number of 16-18 year olds EET + NEET. The data for each year is taken as of December. Data is for a single local authority, and not the whole partnership area. Data is suppressed where there are less than 10 NEETs in the LA in a particular ethnic group.
[Source: Connexions Customer Information System - CCIS, supplied to Ofsted by DCSF]
Health warning: For the LDD and ethnic indicators the NEET and EET figures are adjusted by the DCSF to allow for young people whose current activity is not known. This assumes that: 8% of young people who are previously in employment, education, or training, but who have lost contact with the service, are NEET, and;
58% of young people who were previously NEET, but who have lost contact with the service, are NEET.
The total for 2006 omits the number that refused to give their ethnicity as this figure was not available for preceding years.

ACHIEVING ECONOMIC WELL-BEINGEmployment and NEET data
Kingston upon Hull
Traffic lights have not beenapplied to this indicator.
Year
Area No. of those
continuing in learning
Number completing Year
11Area % SN % Nat %
05-06 2,641 3,284 80.4% 83.8% 85.9%
06-07 2,831 3,363 84.2% 84.9% 87.2%
07-08 3,083 3,485 88.5% 88.0% 89.3%
.. = Data not available
If you have any queries about this indicator please contact: [email protected]. Please quote ref 5046DE.
Health warning: n/a
5046DE: Connexions Partnership data: proportion of young people completing year 11 who continue in learning
[Source: Connexions Customer Information System - CCIS, supplied to Ofsted by DCSF]
Data Definition: This indicator is calculated by dividing the numerator of the number of year 11 completers continuing in learning and dividing it by the denominator which is the number of year 11 completers.

Looked after children and care leavers data
ACHIEVING ECONOMIC WELL-BEING

Achieving economic well-beingLooked after children and care leavers data
Kingston Upon Hull
2004-05 2005-06 2006-07 2007-08LA 0.58 0.89 0.88 0.87 . = Data not applicableSN 0.69 0.70 0.69 0.84 .. = Data not availableEng 0.70 0.76 0.76 0.78 - = Data suppressed
due to small numbers
Bands Low High
2004-08 0<0.4 0.4<0.5 0.5<0.6 . 0.6+
Data definition
Continued on following page
divided byAll young people who were looked after whose 19th birthday is defined as follows (each young person is counted only once even if they ceased to be looked after more than once):
divided byAll those young people aged 18-24 surveyed.
The number of young people in the population aged 18-24 surveyed for the Labour Force Survey (LFS) who were engaged in education, training or employment.
Denominator
The responsibility for obtaining, recording and returning this information rests with the council that had looked after the young person before he or she ceased to be looked after. If the council does not know what has happened to the young person, the person should be included in the denominator, but not in the numerator of this component of the indicator.
5022SC - PAF CF/A4: Ratio of the percentage of those young people who were looked after on 1 April in their 17th year (aged 16), who were engaged in education, training or employment at the age of 19 to the percentage of all young people in the population who were engaged in education, training or employment at the age of 19 (BVPI 161)
a. looked after on 1 April year ‘t-2’ at the age of 16 and who ceased to be looked after before their 19th birthday; orThe number of young people whose 19th birthday falls in the year ending 31 March of the reporting year 't', who were:
The number of young people, in denominator 1, in contact within the period 3 months before to 1 month after their 19th birthday and were engaged in education, training or employment, whether full time or part time (activity at 19 codes F1, F2, F3, P1, P2 and P3).
Numerator
N.B. For 2006-07, data is on young people looked after on 1 April 2004.[Source - SSDA903]
Young people who had been looked after on 1 April of year 't-2' under an agreed series of short term placements (legal status codes V3 and V4) are excluded.
b. who were looked after and turned 17 on the 1 April year ‘t-2’ and who ceased to be looked after before their 19th birthday
[Source - Labour Force Survey (ONS)]Measuring unitRatio to two decimal places [N.B. ratio may be a value greater than 1]
5022SC - PAF CF/A4: Employment, education and training for care leavers (BVPI 161)
0
0.1
0.2
0.3
0.4
0.5
0.6
0.7
0.8
0.9
1
2004-05 2005-06 2006-07 2007-08
Unbanded
Very good
Good
Acceptable
Ask questions aboutperformanceInvestigate urgently
SN
Eng
[If you have any queries about this indicator please contact: [email protected] and quote ref: 5022SC]

Achieving economic well-beingLooked after children and care leavers data
Kingston Upon Hull
5022SC - PAF CF/A4: Ratio of the percentage of those young people who were looked after on 1 April in their 17th year (aged 16), who were engaged in education, training or employment at the age of 19 to the percentage of all young people in the population who were engaged in education, training or employment at the age of 19 (BVPI 161)
5037SC % of care leavers at age 19 who are living in suitable accommodation (as judged by the council) - see p.161
To be counted as 'in touch' for the purposes of this item, there should be "contact" between the council and the young person sometime within the timeframe of 3 months before and one month after the young person's 19th birthday. Consideration might be given the nature of that contact and the extent to which it is meaningful or perfunctory. Account should also be taken of the reluctance of the young people to be 'in touch'; this can have a very strong influence on this indicator.
Guidance/interpretationResearch shows that care leavers experience high levels of unemployment and are at risk of homelessness and social exclusion. This indicator shows the performance of local authorities in improving outcomes for young people leaving their care, so that they are enabled to achieve, to make a positive contribution and to be offered the opportunity to secure their future economic well being.
Using the new definition of this indicator, introduced in 2004-05 – which applies a denominator of the percentage of local young people in education, employment and training to the percentage of care leavers in education, employment and training, to produce a ratio of one to the other - an outturn ratio of 0.92, for example, shows that the level of care leavers in education, employment and training is at 92% of the level of young people in education, employment and training in the local population.
Numbers of young people in the numerator may be small in some smaller councils and the measure therefore subject to large swings from year to year. Nearly one council in three had fewer than 20 care leavers in the numerator for 2006-07. Small changes in the 19 year-old cohort can have large consequences for the end result.
Data for the percentage of all young people in employment, training or education were derived from the Labour Force Survey. Since these figures are from a survey and relate to the population aged 18-24 rather than at age 19 they are subject to a margin of error. More importantly, the denominator covers a wider age-range than the numerator because the LFS is a national sample survey and limiting results to those aged 19 at council level could produce unreliable results. Ideally the LFS would have sufficient coverage to provide an estimate for 19 year olds at a local level so that the comparison with data on formerly looked after children at age 19 could be as precise as possible. Sample error, however, would be too great for this and hence the 18-24 year old cohort is used. Data on the regional and national variation in the percentage of 19 year olds in employment, education and training in 2003 suggests that the difference between single years of age is not marked.
Consideration needs to be given to the type, duration and quality of the education, employment or training that it being received by the care leavers, as well as the extent to which it will assist the young people in later life.Although there are links with this indicator to the education and offending history of the relevant young people, the most direct connections can be made with the indicators cover pathway plans and personal advisers (2038SC) and the suitability of care leavers' accommodation (5037SC). High scores on all three would indicate the possibility of good outcomes for the young people; low scores would indicate the reverse. Any significant variations between these indicators should prompt further questions about the data, and the practice that lies behind it.
Related measures2038SC % of eligible, relevant and former relevant children that have pathway plans, have been allocated a personal adviser and are resident outside the council's boundaries - see p.159
4015SC PAF CF/C18: Final warnings/reprimands and convictions of children looked after - see p.1314016SC PAF CF/C63: Participation of looked after children in reviews - see p.133
3071SC The % of children looked after who were pupils in year 11 who were eligible for GCSE (or equivalent) examinations who sat at least one GCSE or equivalent exam - see p.1083072SC PAF CF/A2: Educational qualifications of children looked after [joint working] (BVPI 50) - see p.1103073SC The % of young people leaving care aged 16 or over with 5 or more GCSEs at grade A*-C or GNVQ equivalent - see p.1123074SC PAF CF/C24: Children looked after absent from school [joint working] - see p.114
[If you have any queries about this indicator please contact: [email protected] and quote ref: 5022SC]

Achieving economic well-beingLooked after children and care leavers data
Kingston Upon Hull
Number of young people in LA who are:. = Data not applicable
2002-03 2003-04 2004-05 2005-06 2006-07 2007-08 .. = Data not availableEligible 80 84 68 44 34 48 - = Data suppressed
Relevant 30 46 25 21 23 20 due to small numbersFormer Relevant 37 70 159 153 179 134
Pathway plans2002-03 2003-04 2004-05 2005-06 2006-07 2007-08
Percentage with pathway plans who are EligibleLA 45.0 60.0 72.1 93.0 97.0 77.0SN 71.4 88.7 93.7 93.9 94.1 92.6Eng 68.7 75.3 79.6 81.6 86.1 86.3
Percentage with pathway plans who are RelevantLA 57.0 70.0 80.0 71.0 87.0 100.0SN 75.4 91.3 97.4 94.6 92.9 95.1Eng 74.6 81.7 85.2 83.6 85.4 90.1
Percentage with pathway plans who are Former RelevantLA 81.0 83.0 44.7 61.0 63.0 75.0SN 67.8 86.2 91.5 93.6 93.4 96.4Eng 70.8 78.3 82.6 85.8 88.9 92.8
Personal adviser2002-03 2003-04 2004-05 2005-06 2006-07 2007-08
Percentage with allocated personal adviser who are EligibleLA 100.0 98.0 100.0 100.0 100.0 100.0SN 93.1 96.1 93.1 97.5 99.3 97.5Eng 88.6 91.5 93.9 94.4 95.5 95.3
Percentage with allocated personal adviser who are RelevantLA 97.0 100.0 100.0 100.0 100.0 100.0SN 100.0 92.8 95.9 95.0 97.3 100.0Eng 88.1 91.9 92.8 91.5 91.8 94.6
Percentage with allocated personal adviser who are Former RelevantLA 95.0 97.0 63.8 71.0 100.0 90.0SN 95.3 91.2 93.9 91.0 91.5 97.7Eng 84.4 86.9 88.1 87.0 89.8 92.6
Resident outside council2002-03 2003-04 2004-05 2005-06 2006-07 2007-08
Percentage resident outside the council's boundaries who are EligibleLA 19.0 19.0 16.2 9.0 9.0 23.0SN 20.1 20.3 25.5 27.7 23.9 35.0Eng 27.5 28.4 32.1 32.7 33.7 33.8
Percentage resident outside the council's boundaries who are RelevantLA 10.0 11.0 8.0 5.0 9.0 15.0SN 10.8 23.7 20.9 20.0 29.2 31.6Eng 21.3 24.8 28.5 28.8 26.9 27.2
Percentage resident outside the council's boundaries who are Former RelevantLA 22.0 11.0 16.4 18.0 12.0 17.0SN 12.5 19.8 26.2 22.0 25.1 30.1Eng 22.6 25.3 28.4 30.0 30.9 31.7
Continued on following page
2038SC - Percentage of eligible, relevant and former relevant children that have pathway plans, have been allocated a personal adviser and are resident outside the council's boundaries
Traffic lights have not been applied to this indicator
[If you have any queries about this indicator please contact: [email protected] and quote ref: 2038SC]

Achieving economic well-beingLooked after children and care leavers data
Kingston Upon Hull
2038SC - Percentage of eligible, relevant and former relevant children that have pathway plans, have been allocated a personal adviser and are resident outside the council's boundaries
5037SC % of care leavers at age 19 who are living in suitable accommodation (as judged by the council) - see p.161
Allocated personal adviser: percentage to one decimal place.
Related measures
Number of young people as at 31.3.07: whole number% of with pathway plans: percentage to one decimal place
Once a young person is 'former relevant' they do not lose this status even if they are living with their family. Even if they are at home they should have a Pathway Plan, regularly reviewed, and a Personal Adviser. The level of support offered, however, should be appropriate to their needs, so if all is going well at home they may not need intensive services. They remain 'former relevant' for statistical purposes.
Guidance/interpretation
Resident outside the council's boundaries: percentage to one decimal place.
A Pathway plan sets out in writing, the manner in which the responsible authority proposes to meet the needs of the care leaver and the date by which, and by whom, any action required to implement any aspect of the plan will be carried out.
For complete detail, see Children Leaving Care Act 2000 regulations and guidance.
Former relevant: Young people aged 18-21 who have been either eligible or relevant or both. Include young people of 21 and over if they are still being helped by the responsible authority.
Eligible: a child who is aged 16 or 17 and has been looked after by a local authority for 13 weeks, or periods which amounted in all to this prescribed period, which began after they reached the age of 14 and ended after they reached the age of 16. The plan should be in place when it is most appropriate: for many young people this means on their 16th birthday; for those who started to be looked after just before their 16th birthday, this will mean when they are 16¼.Exclude any children who were looked after under an agreed series of short term-placements (under the provisions of Reg. 13 of the Arrangement for Placement of Children (General) Regulations, 1991).
Relevant: a child who is aged 16 or 17; is not being looked after by any local authority; and was, before last ceasing to be looked after, looked after by a local authority for 13 weeks, or periods which amounted in all to this prescribed period, which began after they reached the age of 14.
Data definition
[Source - 2002-03 to 2005-06 - CSCI data collection; 2006-08 - Ofsted data collection]
Resident outside the council's boundaries: eligible, relevant and former relevant children who are living in the area of another local authority remain the responsibility of the authority which looked after them.
Allocated personal adviser: to carry out the functions laid out in section 12 of the Children (Leaving Care) (England) Regulations 2001.
5022SC PAF CF/A4 Employment, education and training for care leavers [joint working] (BVPI 161) - see p.157
Where a 'relevant' young person returns home and, six months later, this is successful and they remain under 18, then they become 'qualifying' and would not become 'former relevant' at 18.Where figures for pathway plans and personal advisers are consistently low, this would suggest further investigation is needed in relation to leaving care indicators on education, employment and training and accommodation (5022SC and 5037SC).
Measuring unit
[If you have any queries about this indicator please contact: [email protected] and quote ref: 2038SC]

Achieving economic well-beingLooked after children and care leavers data
Kingston Upon Hull
2001-02 2002-03 2003-04 2004-05 2005-06 2006-07 2007-08LA 75.0 80.6 81.6 72.5 93.6 95.9 96.8 . = Data not applicableSN 65.6 74.9 72.6 87.1 87.9 83.6 90.2 .. = Data not availableEng 69.4 74.5 79.6 83.9 87.9 87.3 88.4 - = Data suppressed
due to small numbers
Data definition
5037SC - Percentage of care leavers at age 19 who are living in suitable accommodation (as judged by the council)
a. looked after on 1 April year 't-2' at the age of 16 and who ceased to be looked after before their 19th birthday; or
Numerator
The number of young people whose 19th birthday falls in the year ending 31 March of the reporting year 't', who were:Denominator [Source - SSDA903]
Of the young people in the denominator, the number whose accommodation was deemed to be ‘suitable’ (accommodation at 19 codes ending in a 1).
Traffic lights have not been applied to this indicator
This indicator measures suitability of accommodation as a proxy for the effectiveness of care leaving services.To be counted as 'in touch' for the purposes of this item, there should be "contact" between the council and the young person sometime within the timeframe of 3 months before and one month after the young person's 19th birthday. Consideration might be given the nature of that contact and the extent to which it is meaningful or perfunctory.
[Source - SSDA903]
Young people who had been looked after on 1 April of year ‘t-2’ under an agreed series of short term placements (legal status codes V3 and V4) are excluded.
b. who were looked after and turned 17 on the 1 April year 't-2' and who ceased to be looked after before their 19th birthday
N.B. If the council does not know what has happened to the young person, the person should be included in the denominator but not in the numerator for this indicator.
Percentage to one decimal placeMeasuring unit
Guidance/interpretation
There are no hard and fast rules on whether accommodation is deemed 'suitable'; the decision will depend on the circumstances of the individual case, and councils have to use their judgment. The classification set out in the 903 Frequently Asked Questions is intended to give an indication of the kinds of accommodation that would generally be considered 'suitable' or 'unsuitable'.
5022SC PAF CF/A4 Employment, education and training for care leavers [joint working] (BVPI 161) - see p.157
Related measures2038SC % of eligible, relevant and former relevant children that have pathway plans, have been allocated a personal adviser and are resident outside the council's boundaries - see p.159
Accommodation is to be regarded as suitable if it provides safe, secure and affordable provision for young people. It would generally include short-term accommodation designed to move young people on to stable long-term accommodation, but would exclude emergency accommodation used in a crisis. Accommodation that clearly exposes the person to risk of harm or social exclusion by reason of its location or other factors should be coded as 'unsuitable'. Accommodation that is 'Emergency accommodation' (e.g. night shelter, direct access, emergency hostel), 'Bed and breakfast' or 'In custody' (categories V, W, and X) should usually be considered 'unsuitable'.The suitability of the accommodation, though, is a subjective judgement and consideration should be given to the council's evidence supporting such judgement.
5037SC - % of care leavers at age 19 who are living in suitable accommodation
0
20
40
60
80
100
120
2001-02 2002-03 2003-04 2004-05 2005-06 2006-07 2007-08
%
LA
SN
Eng
[If you have any queries about this indicator please contact: [email protected] and quote ref: 5037SC]

Social care
SERVICE MANAGEMENT

Service managementSocial care
Kingston Upon Hull
2001-02 2002-03 2003-04 2004-05 2005-06 2006-07 2007-08LA 503 544 587 599 786 813 787 . = Data not applicableSN 329 375 440 510 525 558 609 .. = Data not availableEng 280 315 361 400 427 456 495 - = Data suppressed
due to small numbers
Data definition
Definition up to 2006-07:
Definition for 2007-08:
£ per head
Related
Any significant variation between an area’s budget for children’s social care services and its comparator group needs to be explored.Significantly higher spend suggests a strong commitment to children’s services, but there is a need to explore value for money and partners’ contributions. A high level of spend does not always result in more effective services delivering better outcomes.Conversely, significantly lower budgets suggest a lack of commitment to children’s social care services and the impact of this on the range and quality of services and outcomes for children and young people will need to be explored.
There may be patterns of local expenditure on children's services, especially in relation to pooled budgets with partner agencies under the children's trust arrangements, that may impact on this indicator.
This measure will reflect the differences in costs incurred in different parts of England. It will also reflect differences in deprivation.
Total gross expenditure on children and families services (excluding supporting people).[Source - PSS EX1 Incl SSMSS sheet column M line P1*1,000]Denominator The population aged under 18 in the council area.[Source - ONS mid year estimates] (2007-08 data uses the latest 2007 mid year estimates)Measuring unit
Guidance/interpretation
6006SC - KIGS EX61: Gross expenditure on services to children per capita aged under 18
Numerator
Total gross expenditure on children and families services (excluding supporting people).[Source - PSS EX1 Incl SSMSS sheet column S line B1*1,000]
Traffic lights have not been applied to this indicator
6009SC KIGS EX77: Expenditure on family support services per capita aged under 18 - see p.1646010SC PAF CF/E44: Relative spend on family support - see p.1656022SC KIGS EX62: Gross expenditure on children looked after per capita aged under 18 - see p.1676024SC PAF CF/B8: Cost of services for children looked after - see p.168
6006SC - KIGS EX61: Gross expenditure on services to children per capita aged under 18
0
100
200
300
400
500
600
700
800
900
2001-02 2002-03 2003-04 2004-05 2005-06 2006-07 2007-08
£
LA
SN
Eng
[If you have any queries about this indicator please contact: [email protected] and quote ref: 6006SC]

Service managementSocial care
Kingston Upon Hull
2001-02 2002-03 2003-04 2004-05 2005-06 2006-07 2007-08LA 82 92 99 103 207 89 103 . = Data not applicableSN 44 48 50 66 61 70 101 .. = Data not availableEng 42 46 52 60 64 71 76 - = Data suppressed
due to small numbers
Definition up to 2006-07:Expenditure on family support services.
Definition for 2007-08:Expenditure on family support services.[Source - PSS EX1 Incl SSMSS sheet line OC7 column M * 1,000]Denominator
6024SC PAF CF/B8: Cost of services for children looked after - see p.168
Related measures
Data definition
Guidance/interpretation
There may be patterns of local expenditure on children's services, especially in relation to pooled budgets with partner agencies under the children's trust arrangements, that may impact on this indicator.
This measure will reflect the differences in costs incurred in different parts of England (see pp.110-111 of the PAF volume 2005-06 (CSCI, November 2006)). It will also reflect differences in deprivation.
The population aged under 18 in the council area.[Source - ONS mid year estimates] (2007-08 data uses the latest 2007 mid year estimates)
£ per headMeasuring unit
6010SC PAF CF/E44: Relative spend on family support - see p.165
6009SC - KIGS EX77: Expenditure on family support services per capita aged under 18
Numerator
[Source - PSS EX1 Incl SSMSS sheet line BC7 column S * 1,000]
Traffic lights have not been applied to this indicator
6022SC KIGS EX62: Gross expenditure on children looked after per capita aged under 18 - see p.167
Some of the variation in this measure may be accounted for by different interpretations of the guidance for PSSEX1, particularly in what is included in 'other children's services' (PSSEX1 row BE3) and in attribution of 'overheads' via SSMSS.
6006SC KIGS EX61: Gross expenditure on services to children per capita aged under 18 - see p.163
Any significant variation between an area’s budget for children’s social care services and its comparator group needs to be explored.If expenditure on family support is significantly lower than comparators this may be due to strong cost effective commissioning arrangements to deliver preventative services, and /or effective pooled budgets with partners. In the absence of these, low expenditure on family support indicates insufficient family support services which is likely to result in more children being looked after and/or more children with child protection plans.High spend on family support should be helping to reduce the numbers of looked after children and/or children with child protection plans. If these numbers remain high it suggests that family support services are ineffectively targeted.
6009SC - KIGS EX77: Expenditure on family support services per capita aged under 18
0
50
100
150
200
250
2001-02 2002-03 2003-04 2004-05 2005-06 2006-07 2007-08
£
LA
SN
Eng
[If you have any queries about this indicator please contact: [email protected] and quote ref: 6009SC]

Service managementSocial care
Kingston Upon Hull
2001-02 2002-03 2003-04 2004-05 2005-06 2006-07 2007-08LA 35 35 40 42 51 39 40 . = Data not applicableSN 34 35 34 36 35 36 40 .. = Data not availableEng 37 38 38 39 39 40 41 - = Data suppressed
due to small numbers
Bands Low High
2001-08 · 0<27 27<32 32<43 · . 43<48 48<=100 ·
Definition up to 2006-07:
Definition for 2007-08:
Definition up to 2006-07:
Definition for 2007-08:
Measuring unit
Continued on following page
Numerator
Incl SSMSS column F (Total Expenditure Including joint arrangements) - column E (Grants to Voluntary Organisations): Total (including joint arrangements)) lines (OC7 (Total family support services) + OD2 (Youth offender teams) + OD3 (Other youth justice services) + OE1 (Adoption services) + OE3 (Other children's and families services) + 50% of OE2 (Leaving care services) + a proportionate share of OA1 (Commissioning and social work)).Denominator Gross total cost for all children's services during the year.
Percentage as a whole number
Incl SSMSS column I (Gross total cost (Current expenditure including capital charges): Total (including joint arrangements)) lines (BC7
[Source - PSS EX1]That part of the denominator that represents expenditure on children in need but not looked after.
[Source - PSS EX1]
6010SC - PAF CF/E44: Gross expenditure on children in need but not looked after, as a percentage of gross expenditure on all children’s services
Data definition
Incl SSMSS column I (Gross total cost (Current expenditure including capital charges): Total (including joint arrangements)) line B1 (Total children's and families services).
Incl SSMSS column F (Total Expenditure Including joint arrangements) - column E (Grants to Voluntary Organisations): line P1 (Total children's and families services) minus N4 (Total asylum seekers).
N.B. In years previous to 2007-08, expenditure on asylum seekers was not included in the Children's and famillies services section. Therefore, to remain consistant with previous years data, N4 must be deducted from P1.
6010SC - PAF CF/E44: Relative spend on family support
0
10
20
30
40
50
60
2001-02 2002-03 2003-04 2004-05 2005-06 2006-07 2007-08
%
Unbanded
Good
Acceptable
Ask questions aboutperformance
SN
Eng
[If you have any queries about this indicator please contact: [email protected] and quote ref: 6010SC]

Service managementSocial care
Kingston Upon Hull
6010SC - PAF CF/E44: Gross expenditure on children in need but not looked after, as a percentage of gross expenditure on all children’s services
6022SC KIGS EX62: Gross expenditure on children looked after per capita aged under 18 - see p.1676024SC PAF CF/B8: Cost of services for children looked after - see p.168
Related measures6006SC KIGS EX61: Gross expenditure on services to children per capita aged under 18 - see p.1636009SC KIGS EX77: Expenditure on family support services per capita aged under 18 - see p.164
The most recent Children in Need census data, for 2005, may provide some historical evidence on the balance between costs of looked after children's services and other costs.Any significant variation between an area’s budget for children’s social care services and its comparator group needs to be explored.If expenditure on family support is significantly lower than comparators this may be due to strong cost effective commissioning arrangements to deliver preventative services, and /or effective pooled budgets with partners. In the absence of these, low expenditure on family support indicates insufficient family support services which is likely to result in more children being looked after and/or an increase in the number of children with child protection plans.High spend on family support should be helping to reduce the numbers of looked after children and/or children with child protection plans. If these numbers remain high it suggests that family support services are ineffectively targeted.
Guidance/interpretationThis indicator acts as a proxy for access to preventative services. Adequate provision of such services can prevent children being looked after later. A low figure would indicate that a council was providing a relatively small amount of preventative services.There may be patterns of local expenditure on children's services, especially in relation to pooled budgets with partner agencies under the children's trust arrangements, that may impact on this indicator.
[If you have any queries about this indicator please contact: [email protected] and quote ref: 6010SC]

Service managementSocial care
Kingston Upon Hull
2001-02 2002-03 2003-04 2004-05 2005-06 2006-07 2007-08LA 236 261 262 240 273 309 310 . = Data not applicableSN 168 187 218 237 252 255 251 .. = Data not availableEng 129 142 161 176 187 196 202 - = Data suppressed
due to small numbers
Data definition
Definition up to 2006-07:
Definition for 2007-08:
Denominator
£ per head
Guidance/interpretation
Related measures
The numerator covers expenditure by the council on services for looked after children other than social work. It includes the costs of children's homes and boarding schools as well as fostering, lodgings, independent living and a range of specialist placements, and all associated overheads.
6022SC KIGS EX62: Gross expenditure on children looked after per capita aged under 18 - see p.1676024SC PAF CF/B8: Cost of services for children looked after - see p.168
This measure will in part reflect whether the council is in a low or high cost area. It will also reflect the characteristics of the population of the area. If the area is relatively deprived expenditure may be higher - see commentary on 6024SC CF/B8. Similarly the rate will reflect the make-up of children looked after by the council: if there are high proportions of adolescents or disabled children expenditure per head may be higher. If, however, a significant proportion of the looked after children are placed at home with parents the rate may be lower.
If the number of disabled children receiving support is significantly lower than comparators this suggests that an inadequate range of support is in place.
6009SC KIGS EX77: Expenditure on family support services per capita aged under 18 - see p.1646010SC PAF CF/E44: Relative spend on family support - see p.165
6022SC - KIGS EX62: Gross expenditure on looked after children per capita aged under 18
Traffic lights have not been applied to this indicator
Numerator
2042SC KIGS CH39: Children looked after per 10,000 population aged under 18 - see p.556006SC KIGS EX61: Gross expenditure on services to children per capita aged under 18 - see p.163
Total gross expenditure on looked after children + secure accommodation.
Total gross expenditure on looked after children + secure accommodation.
The population aged under 18 in the council area.[Source - ONS mid year estimates] (2007-08 data uses the latest 2007 mid year estimates)Measuring unit
6022SC - KIGS EX62: Gross expenditure on looked after children per capita aged under 18
0
50
100
150
200
250
300
350
2001-02 2002-03 2003-04 2004-05 2005-06 2006-07 2007-08
£
LA
SN
Eng
[If you have any queries about this indicator please contact: [email protected] and quote ref: 6022SC]

Service managementSocial care
Kingston Upon Hull N.B. England figures are not banded
2001-02 2002-03 2003-04 2004-05 2005-06 2006-07 2007-08LA 501 532 538 615 654 648 657 . = Data not applicableACA Grp 1 486 529 575 644 693 731 741 .. = Data not availableEng 487 560 618 676 716 753 772 - = Data suppressed
due to small numbers
Bands for ACA group 1Low High
2001-02 £0<£333 £333<£357 £357<£476 £476<£532 >=£5322002-03 £0<£348 £348<£373 £373<£498 £498<£556 >=£5562003-04 £0<£366 £366<£393 £393<£524 £524<£585 >=£5852004-05 £0<£383 £383<£411 £411<£548 £548<£612 >=£6122005-06 £0<£394 £394<£423 £423<£564 £564<£630 >=£6302006-07 £0<£409 £409<£439 £439<£585 £585<£653 >=£6532007-08 £0<£429 £429<£461 £461<£614 £614<£686 >=£686
Data definition
Definition for 2007-08:Gross total cost for children looked after in foster care and children's homes during the year.
£ per weekContinued on following page
The total number of weeks children (other than asylum seeking children) spent in foster care, children's homes, residential schools and placed for adoption (placement codes A1, A2, F1 to F6, H3 to H5 and S1 as defined by the SSDA903 collection) during the year. Children's homes include community homes, voluntary homes and hostels and private registered children's homes. Any placements that formed part of an agreed series of short term-placements (under the provisions of Reg. 13 of the Arrangement for Placement of Children (General) Regulations, 1991) and any time spent in respect of respite care are included. Calculation based on the total number of days of care divided by 7.[Source - PSSEX1]
Denominator
Definition up to 2006-07:
[Source - PSS EX1 Incl. SSMSS column I (Gross total cost (Current expenditure including capital charges): Total (including joint arrangements)) lines BB1 (Children's homes) + BB3 (Fostering services).
[Source - PSS EX1 Incl. SSMSS column F (Total Expenditure Including joint arrangements) - column E (Grants to Voluntary Organisations): lines OB1 (Children's homes) + OB3 (Fostering services).]
6024SC - PAF CF/B8: Average gross weekly expenditure per looked after child in foster care or in a children’s home
Gross total cost for children looked after in foster care and children's homes during the year.
Numerator
Measuring unit
6024SC - PAF CF/B8: Cost of services for looked after children
0
100
200
300
400
500
600
700
800
900
2001-02 2002-03 2003-04 2004-05 2005-06 2006-07 2007-08
£
Unbanded
Good
Acceptable
Ask questions aboutperformance
ACA Grp 1
Eng
[If you have any queries about this indicator please contact: [email protected] and quote ref: 6024SC]

Service managementSocial care
Kingston Upon Hull N.B. England figures are not banded
6024SC - PAF CF/B8: Average gross weekly expenditure per looked after child in foster care or in a children’s home
Related 2068SC PAF CF/B79: % of children aged at least 10 and under 16 who were in foster placements or placed for adoption - see p.646006SC KIGS EX61: Gross expenditure on services to children per capita aged under 18 - see p.163
This measure will reflect the differences in costs incurred in different parts of England. It will also reflect differences in deprivation.There may be patterns of local expenditure on children's services, especially in relation to pooled budgets with partner agencies under the children's trust arrangements, that may impact on this indicator.
Unlike all other indicators that relate to children looked after, this one includes data on children in receipt of respite care. Consideration could be given to these elements if costs have risen considerably year on year without an obvious change in overall numbers of children looked after or an increase in the use of fostering agencies.
The cost of services is an important aspect of efficient delivery of services. Other things being equal, such as quality and all children's needs being adequately met, a lower cost is generally held to be more efficient. With this indicator the overall cost of looking after children (in residential or foster care) can be assessed allowing for potential changes in costs of particular forms of care such as fostering, arising from changes to quality and supply. Performance against all of the measures in the cost and efficiency performance area will be taken as evidence of progress against the improvement in social care efficiency target of at least 2.5% year-on-year required at a national level by the Government.
6009SC KIGS EX77: Expenditure on family support services per capita aged under 18 - see p.1646010SC PAF CF/E44: Relative spend on family support - see p.1656022SC KIGS EX62: Gross expenditure on children looked after per capita aged under 18 - see p.167
High costs may indicate that high numbers of looked after children are being placed with expensive independent providers. If this is the case need to explore the strategy to address it. High costs may also be linked to the cost of covering high levels of sickness absence among residential staff. It is also possible for high costs to occur when numbers looked after reduce, because the cohort remaining may have a proportionately greater need for specialist placements, which are likely to be more expensive.
This indicator can be improved by commissioning foster care and residential care at lower unit cost and, more importantly, by shifting the pattern of care away from residential to foster care. Moving children from residential to foster care may increase the unit costs of both as more dependent children are cared for in both settings, but still decrease CF/B8.
Guidance/interpretation
[If you have any queries about this indicator please contact: [email protected] and quote ref: 6024SC]

School places and admissions data
SERVICE MANAGEMENT

ENJOYING AND ACHIEVINGSchool places and admissions data
Kingston Upon Hull, City of
Year Area SN Nat Traffic lights have 2005 12.0% 14.0% 13.0% not been applied
2006 19.0% 17.5% 14.0% to this indicator2007 13.0% 17.5% 14.0%
.. = Data not available
[If you have any queries about this indicator please contact: [email protected] - Please quote REF: 3089DE]
3089DE: Percentage of primary schools with 25% or more surplus places
Data Definition: This indicator shows the % of primary schools with 25% or more surplus places, the data for which is collected from LAs between June and beginning of August and reflects the position as at January for each year. It does not include schools with less than 30 surplus places. Consequently a significant number of local authorities will have a value of zero.It includes first, infant and junior schools with and without nurseries, as well as Middle schools which have been deemed primary.The number on roll includes a headcount of part-time pupils but excludes full-time and part-time pupils in designated nursery classes.SN figures have been added by Ofsted to assist inspectors. They are median averages of the %s for all of the LA's statistical neighbours.
[Source: Statistical Neighbours comparisons calculated by Ofsted.]
Health warning:Low surplus place numbers are good. LAs should take action to reduce the number of surplus places overall and to reduce the number of schools with more than 25% surplus places.Data does not include academies, city technology colleges (CTCs), nursery units, nursery schools, special schools and PRUs
% of primary schools with 25% or more surplus places
0.0%
2.0%
4.0%
6.0%
8.0%
10.0%
12.0%
14.0%
16.0%
18.0%
20.0%
2005 2006 2007
%
Area SN NAT

ENJOYING AND ACHIEVINGSchool places and admissions data
Kingston Upon Hull, City of
Year Area SN Nat Traffic lights have2005 13.0% 13.0% 7.0% not been applied
2006 13.0% 7.0% 8.0% to this indicator2007 8.0% 10.0% 10.0%
.. = Data not available
[If you have any queries about this indicator please contact: [email protected] - Please quote REF: 3090DE]
3090DE: Percentage of secondary schools with 25% or more surplus places
Data Definition:This indicator shows the % of primary schools with 25% or more surplus places, the data for which is collected from LAs between June and beginning of August and reflects the position as at January for each year.It does not include schools with less than 30 surplus places. Consequently a significant number of local authorities will have a value of zero.It includes secondary schools with 11-16s, 11-18s, and non-standard age ranges, plus middle schools deemed secondary.
[Source: Statistical neighbours comparisons calculated by Ofsted.]
Health warning:Low surplus place numbers are good. LAs should take action to reduce the number of surplus places overall and to reduce the number of schools with more than 25% surplus places. SN figures have been added by Ofsted to assist inspectors. They are median averages of the %s for all of the LA's statistical neighbours.Data does not include academies, city technology colleges (CTCs), nursery units, nursery schools, special schools and PRUs
Area SN NAT
% of secondary schools with 25% or more surplus places
0.0%
2.0%
4.0%
6.0%
8.0%
10.0%
12.0%
14.0%
2005 2006 2007
%

Staffing and related dataRecruitment & retention
SERVICE MANAGEMENT

Service managementStaffing and related data - recruitment and retention
Kingston Upon Hull
2004-05 2005-06 2006-07 2007-08LA 3.1 10.4 4.6 7.1 . = Data not applicableSN 10.3 11.8 10.4 12.5 .. = Data not availableEng 12.1 12.5 11.0 10.9 - = Data suppressed
due to small numbers
Data definition
2064SC PAF CF/C68: Timeliness of reviews of children looked after - see p.573085SC PAF CF/C69: Distance children newly looked after are placed from home - see p.1064016SC PAF CF/C63: Participation of looked after children in reviews - see p.133
2034SC PAF CF/C20: Reviews of child protection cases (BVPI 162) - see p.492036SC PAF CF/C21: Duration on the Child Protection Register - see p.522043SC PAF CF/A1: Stability of placements of children looked after (BVPI 49) - see p.592060SC % of looked after children with a named social worker who is qualified as a social worker - see p.69
2020SC % of initial assessments within 7 working days of referral - see p.372022SC PAF CF/C64: Timing of core assessments - see p.392024SC % of children and young people on the child protection register who are not allocated to a social worker - see p.422028SC PAF CF/A3: Re-registrations on the Child Protection Register - see p.45
Numerator
Related measures2016SC KIGS CH142: % of referrals that are repeat referrals within 12 months - see p.34
NB: this former DIS measure has been subdivided to seek data specifically on staff working with children and families: DIS 3119 reported on the whole workforce for the CSSR.
The number of vacant social care directly employed posts which councils are seeking to fill or will seek to fill at 30 September. If a post is "filled" by agency or temporary staff, include it if the intention at 30 September is to fill or seek to fill it on a permanent basis.
Percentage to one decimal place
Traffic lights have not been applied to this indicator
6012SC - Percentage of social care staff directly employed posts for children and families vacant on 30 September
If, for example, vacancy levels are high, the reasons for this and the area’s strategy to address it need to be explored.
High vacancy levels may indicate significant or wider problems that can impact adversely on services (see 2016SC, 2020SC, 2022SC, 2024SC, 2028SC, 2034SC, 2036SC, 2043SC, 2060SC, 2064SC, 3085SC, 4016SC).
Guidance/interpretation
Measuring unit [Source - 2004-05 to 2005-06 - CSCI data collection; 2006-08 - Ofsted data collection]The total number of social care directly employed posts at 30 September who are working specifically with children and families.Denominator [Source - 2004-05 to 2005-06 - CSCI data collection; 2006-08 - Ofsted data collection]
6012SC - % of social care staff directly employed posts for children and families vacant on 30 September
0
2
4
6
8
10
12
14
2004-05 2005-06 2006-07 2007-08
%
LA
SN
Eng
[If you have any queries about this indicator please contact: [email protected] and quote ref: 6012SC]

Service managementStaffing and related data - recruitment and retention
Kingston Upon Hull
2001-02 2002-03 2003-04 2004-05 2005-06 2006-07 2007-08LA 10 14 28 39 55 82 90 . = Data not applicableSN 27 36 47 51 61 72 78 .. = Data not availableEng 32 36 45 52 57 64 71 - = Data suppressed
due to small numbers
Data definition
6016SC - Percentage of residential child care workers who have obtained the NVQ Level 3 in Health and Social Care (Children and Young People)
Ensuring staff are appropriately trained is an important component of the quality of a service.Guidance/interpretation
NB: this question was formerly QP14Percentage as a whole number
N.B. Values of 0 (nil) were changed to "." (not applicable) for some LAs in the years prior to 2007-08. England averages for all years have increased as a result. The SN values for some LAs may also have increased as a result.Numerator
Measuring unit
The total number of staff working for the local authority as residential childcare workers at 31 March who needed to be trained to NVQ level 3. Exclude staff who have already been trained to a higher level.
Denominator
Of the people in the denominator, the total number who, at 31 March, had obtained the NVQ Level 3 in Health and Social Care (Children and Young People), at any time.N.B. This was previously called Level 3 in the NVQ 'Caring for Children and Young People'.
Traffic lights have not been applied to this indicator
6012SC % of SSD directly employed posts for children and families vacant on 30 September - see p.174Related measures
[Source - 2001-02 to 2005-06 - CSCI data collection; 2006-08 - Ofsted data collection]
[Source - 2001-02 to 2005-06 - CSCI data collection; 2006-08 - Ofsted data collection]
6016SC - % of residential child care workers who have obtained the NVQ Level 3 in Health and Social Care (Children and Young
People)
0102030405060708090
100
2001-02 2002-03 2003-04 2004-05 2005-06 2006-07 2007-08
%
LA
SN
Eng
[If you have any queries about this indicator please contact: [email protected] and quote ref: 6016SC]

SERVICE MANAGEMENTStaffing and related data
Kingston Upon Hull, City of
Year Area SN Nat Traffic lights have not2005 1.4% 0.6% 0.7% been applied to this
2006 0.4% 0.5% 0.6% indicator2007 0.6% 0.5% 0.6%
.. = Data not available
graph to follow
[If you have any queries about this indicator please contact: [email protected] - Please quote REF: 6049DE]
6049DE: Percentage of unfilled full time vacancies in relation to number of full time equivalent teachers employed as at January
Data Definition:This indicator shows the number of advertised vacancies in maintained nursery, primary, secondary and special schools for full-time permanent appointments (or appointments of at least one term's duration) as a percentage of teachers in post ie full-time regular teachers in (or on secondment from) maintained nursery, primary and secondary schools, plus full-time regular divided service, peripatetic, advisory and miscellaneous teachers. Vacancies being filled on a temporary basis of less than one term are counted as vacant posts.The Statistical Neighbours figure is a median average of the percentage figures for each of the local authorities' neighbours.
[Source: DCSF annual 618G survey (http://www.teachernet.gov.uk/management/ims/datacollections/618G/LA_618G_documentation/) Statistical Neighbours comparisons calculated by Ofsted.]
Health warning:There is no benchmark figure. A lower percentage is better than a higher percentage with positive impact on capacity. The number of years for which the data has been collected is small and therefore trends cannot yet be clearly determined. The vacancy numbers show the position on the survey day in January.Analysis is based on small numbers of vacancies. For this reason data does not have traffic lights. Please use with caution when comparing local authorities with Statistical Neighbours or the National figures. SN figures have been added by Ofsted to assist inspectors. They are median averages of the %s for all of the LA's Statistical Neighbours.
Area SN NAT
% of unfilled full-time vacancies
0.0%
0.2%
0.4%
0.6%
0.8%
1.0%
1.2%
1.4%
1.6%
2005 2006 2007
%

Statistical Neighbours
APPENDICES

APPENDIX 1National Foundation for Educational Research (NFER) statistical neighbours
Kingston Upon Hull
Stoke-on-TrentMiddlesbroughHartlepoolSalfordSouth TynesideSouthamptonPlymouthBarnsleyRotherhamHalton
[Data contact: [email protected]]
The NFER groups have been used on the majority of indicators in the datasets from July 2007; affecting the 2007 & 2008 APA and the JAR toolkits from block 16 onwards. Key exceptions are indicators from the Healthcare Commission, Youth Justice Board and HMI Probation, as data may not be at local authority level.
The NFER's Children's Services statistical neighbours benchmarking groups were published in February 2007 and are designed to be used across all children's services data. Please see the DCFS website for further information on the model: http://www.dfes.gov.uk/rsgateway/DB/STA/t000712/index.shtml. They replace the old Ofsted and CIPFA groups previously used by Ofsted and CSCI.
7001OF: List of NFER statistical neighbours for Kingston Upon Hull
Statistical neighbour models provide one method for benchmarking progress. For each LA, these models designate a number of other LAs deemed to have similar characteristics. These designated LAs are known as statistical neighbours. Any LA may compare its performance (as measured by various indicators) against its statistical neighbours to provide an initial guide as to whether their performance is above or below the level that might be expected. Statistical neighbour comparisons are usually presented in addition to a National comparison.

APPENDIX 1B
(NfER statistical neighbours)
Map showing the position of the local authority and its statistical neighbours

Kingston Upon Hull and its Statistical Neighbours (NFER)
Plymouth
Southampton
Halton
Salford
Stoke-on-Trent
Barnsley
Rotherham
Middlesbrough
Hartlepool
South Tyneside
Kingston upon Hull, City of

APPENDIX 2Youth Justice Board statistical neighbours
Kingston upon Hull
CoventryLiverpoolLeicester CityPlymouthGreenwichSalfordBarking and DagenhamStoke-on-TrentBristol
YOT area Local Authorities covered by the dataLeicestershire Leicestershire and RutlandWessex Isle of Wight, Hampshire, Southampton and PortsmouthCornwall Cornwall and Isles of ScillySouth Tees Redcar and Cleveland, and MiddlesboroughTower Hamlets and City of London (one YOT) Tower Hamlets and City of LondonHalton and Warrington (one YOT) Halton and WarringtonShropshire Telford and Wrekin (one YOT) Shropshire and Telford & WrekinReading and Wokingham (one YOT) Reading and WokinghamBournemouth and Poole (one YOT) Bournemouth and PooleWorcestershire and Herefordshire (one YOT) Worcestershire and Herefordshire
If you have any queries concerning this data please contact Nick Read on 020 7271 3068
The majority of YOT areas match local authority boundaries. Please see below for the exceptions, and check whether this affects your local authority or its statistical neighbours.
The list above shows each Youth Offending Team (YOT) and the 9 other YOTs in its family. The first YOT listed is the closest ‘relative’; the last YOT listed is the most distant ‘relative’.
7002OF: List of Youth Justice Board statistical neighbours for Kingston Upon Hull

APPENDIX 3Association of Consulting Actuaries (ACA) statistical neighbours
Kingston Upon Hull
Barnsley South TynesideBlackburn with Darwen StaffordshireBlackpool Stockton on TeesBournemouth Stoke-on-TrentCity of Derby SuffolkCity of Nottingham SunderlandCity of Plymouth Telford and WrekinCity of York TorbayCornwall WorcestershireCumbria #N/ADarlington #N/ADerbyshire #N/ADevon #N/ADoncasterDorsetDurhamEast Riding of YorkshireGatesheadHartlepoolHerefordshireLancashireLeicester CityLeicestershireLincolnshireMiddlesbroughNewcastle Upon TyneNorfolkNorth East LincolnshireNorth LincolnshireNorth TynesideNorth YorkshireNorthumberlandNottinghamshirePooleRedcar and ClevelandRotherhamRutlandSheffieldShropshireSomerset
[Data contact: [email protected]]
7003OF: List of ACA statistical neighbours for Kingston Upon Hull (used for social care indicator 6024SC)

APPENDIX 4Government Office Regions
Kingston Upon Hull - Yorkshire & Humberside
Barnsley #N/ADoncaster #N/ARotherham #N/ASheffield #N/ABradford #N/ACalderdale #N/AKirklees #N/ALeeds #N/AWakefield #N/AEast Riding of Yorkshire #N/ANorth East Lincolnshire #N/ANorth Lincolnshire #N/ANorth Yorkshire #N/ACity of York
#N/A#N/A#N/A#N/A#N/A#N/A#N/A#N/A#N/A#N/A#N/A#N/A#N/A#N/A#N/A#N/A#N/A#N/A#N/A#N/A#N/A#N/A#N/A#N/A#N/A#N/A
[Data contact: Ade Alao (0207 972 4845) [email protected]
7004OF: List of Government Office Regions Local Authorities for Kingston Upon Hull (used for 1032OF)