Kingdom of Cambodia Nation - Religion - King Low-Cost ...
120
Low-Cost Experiments for Biology Education Kingdom of Cambodia Nation - Religion - King Teacher Training Department 2012
Transcript of Kingdom of Cambodia Nation - Religion - King Low-Cost ...

Low-Cost Experiments for Biology Page 1 of 119
Low-Cost Experiments for Biology Education
Kingdom of Cambodia Nation - Religion - King
Teacher Training Department 2012
Low-Cost Experiments for Biology Page 2 of 119
Low-Cost Experiments for Biology
Published by the Ministry of Education, Youth and Sport of the Kingdom of Cambodia
Printed in Cambodia, 2013 (First edition)
The development and publication of this document has been funded by the General Directorate for Development Cooperation and Humanitarian Aid (DGD) with technical support from the Flemish Association for Development Cooperation and Technical Assistance (VVOB). The Flemish and the Belgian governments cannot be held responsible for the content of this publication.
Copyright Notice Unless otherwise noted in the materials excluded and rights reserved list below, material in this publication is licensed under a Creative Commons Attribution-NonCommercial-ShareAlike 3.0 Unported License. This means that you may distribute, copy, remix and build upon this work non-commercially without prior permission of the publisher, as long as you credit and license your new creations under identical terms. More information on this license is available at http://creativecommons.org/licenses/by-nc-sa/3.0/
Material excluded and rights reserved Some material in this publication is not being made available under the terms of this license. These are Third-Party materials that are being used under fair use or with permission. The publisher will not be liable on any legal basis (including negligence) for any loss or damage suffe .lairetam ytraP-drihT fo esu eht hguorht der

Low-Cost Experiments for Biology Page 3 of 119
Prologue
The main objective of this guide is to enable science teacher trainers and teachers to introduce practical
activities to their students, thus improving their critical thinking and problem solving skills. Practical activities allow linking theory with practice and daily life. Moreover, with practical activities you can address specific
skills and attitudes with students such as team work, accuracy and creativity. Practical activities offer a
motivating and engaging encounter with biology and may stimulate students to develop a stronger interest in
science.
All experiments are designed with low-cost materials. Many of the main concepts in biology can be
illustrated with low-cost materials. For students and teachers it stimulates creativity, but developing oneʼs
own experiment material is likely to give more satisfaction than using a purchased set. Using low-cost
materials poses fewer problems on costs, maintenance and the supply of spare parts.
This guide complements other learning materials developed by the Ministry of Education, Youth and Sport
(MoEYS), in cooperation with VVOB. These include the manual on student centred approaches, multimedia
materials and biology posters with activity sheets.
To ensure optimal use of the experiments in this manual, we suggest following advice:
1. Prepare all the material for the experiment before the start of the lesson.
2. Stimulate students to think, to predict, to observe and to explain during the practical activity. In this way, they will grow familiar with the scientific method.
3. Allow as much hands-on time as possible for students.
4. Revise student understanding after doing the experiment and adjust your lesson plan if necessary.
The Ministry hopes that you all will make the best use of the materials to improve the quality of science education.

Low-Cost Experiments for Biology Page 4 of 119
Preface
This manual was developed by the Ministry of Education, Youth and Sport, in cooperation with VVOB.
Its objective is to improve science teacher training by introducing student centred approaches. This manual
contains a set of science experiments that will help teacher trainers to achieve understanding with their
students of the main biology concepts outlined in the RTTC curriculum. All experiments have been tested by
teacher trainers and teachers.
Complementary to the manual is a set of DVDs with short movie clips of all experiments in this manual in
order to help teacher trainers with integrating experiments in their lessons. For each experiment we include
a set of objectives, a link to the relevant lesson in the curriculum, the material needed to do the experiment,
a detailed description of the procedure, observations, an explanation and additional questions. Where appropriate we add ideas for variations.
We are convinced that this manual will contribute to an improvement of science education in Cambodia.
However, do not hesitate to send us your comments and suggestions.
We are looking forward to receiving your comments. We wish you an inspiring experience and many
satisfying science lessons with this manual.
The authors

Low-Cost Experiments for Biology Page 5 of 119
Manual Development Committee
1. Management Committee
H.E. Im Sethy Minister, Ministry of Education, Youth and Sport H.E. Nath Bunroeun Secretary of state, Ministry of Education, Youth and Sport
H.E. Ou Eng General Director of Education, Ministry of Education, Youth and Sport
2. Approval Committee
Mr. Leang Seng Hak Director, Teacher Training Department
Mr. Eng Kimly Director, Department of Curriculum Development
Mr. Eung Ngor Hok Director, General Secondary Education Department
3. Committee of Authors
Ms. Eang Senglim Official, Teacher Training Department
Ms. Yim Yihup Official, Department of Curriculum Department
Ms. Ean Sarin Official, General Secondary Education Department
Ms. Long Puntheany Biology Teacher Trainer, Teacher Training Center Kandal Ms. Hou Chansara Biology Teacher Trainer, Teacher Training Center Kandal
Ms. Som Dany Biology Teacher Trainer, Teacher Training Center Kandal
Ms. Toun Vannak Biology Teacher, Hun Sen Takhmao High School
Ms. Tun Yom Biology Teacher, Hun Sen Serei Pheap High School
Ms. Chea Yeth Biology Teacher, Hun Sen Kampong Kantuot High School Mr. Uon Virak Technical Advisor/Facilitator, VVOB
Mr. Stefaan Vande Walle SEAL Programme Coordinator, VVOB
4. Technical Advisor
Mr. Chea Phon Vice-director, Teacher Training Department

Low-Cost Experiments for Biology Page 6 of 119
Low-Cost Experiments for Biology

Low-Cost Experiments for Biology Page 7 of 119
Table of contents
Introduction ................................................................................................................................. 8
1. Experiments on the structure of plants ................................................................................. 9
1.1 Growing plants on sponges ........................................................................................................... 91.2 Transportation of water through plant leaves .............................................................................. 12
1.3 Flowers change colours ............................................................................................................... 15
2. Experiments on diffusion and osmosis ............................................................................... 17
2.1 Diffusion ....................................................................................................................................... 17
2.2 Osmosis in plant tissues .............................................................................................................. 192.3 Osmosis in eggs .......................................................................................................................... 22
3. Experiments about the sense of taste ................................................................................ 26
3.1 Sensitivity of sense of taste ......................................................................................................... 26
3.2 Relationship between sense of taste and smell .......................................................................... 29
3.3 Adaptation of sense of taste ........................................................................................................ 32
4. Experiments about respiration ............................................................................................ 34
4.1 Comparison between inhaled and exhaled air ............................................................................ 34
4.2 Holding your breath ..................................................................................................................... 38
4.3 Cellular respiration ....................................................................................................................... 41
4.4 Chemicals in tobacco smoke ....................................................................................................... 454.5 Breathing ..................................................................................................................................... 47
4.6 Model of spirometer ..................................................................................................................... 51
5. Experiments about the sense of sight ................................................................................. 54
5.1 The dissection of a cowʼs eye ...................................................................................................... 54
5.2 Accommodation of the lens ......................................................................................................... 615.3 Role of the iris .............................................................................................................................. 64
5.4 The “blind” spot on the retina ....................................................................................................... 67
5.5 Location on the retina of the different types of photoreceptors ................................................... 70
5.6 Investigating how our eyes judge distances ............................................................................... 73
5.7 Visualisation by our eyes ............................................................................................................. 755.8 Advantage of having two eyes ..................................................................................................... 77
5.9 Judgment of distance ................................................................................................................... 78
5.10 We see with our eyes... and our brain ......................................................................................... 80
6. Experiments about the sensory system .............................................................................. 83
6.1 Sensitivity of human senses to temperature................................................................................ 836.2 Sensation of touch receptor by stimuli ......................................................................................... 85
6.3 Reaction time in seeing the object ............................................................................................... 88
6.4 Eye – and hand coordination ....................................................................................................... 91
7. Experiments about the heart .............................................................................................. 94
7.1 The dissection of a pig heart ....................................................................................................... 947.2 Constructing a model of the heart valves .................................................................................. 104
8. Other experiments ............................................................................................................ 106
8.1 Extraction of DNA ...................................................................................................................... 106
8.2 What is the effect of a solution on bacteria growth? .................................................................. 109
8.3 Models for the digestive system ................................................................................................ 113
References .............................................................................................................................. 119

Low-Cost Experiments for Biology Page 8 of 119
Introduction
With the publication of this manual of biology experiments, we want to
give science teachers, and in particular biology teachers, a practical
working tool for their invaluable work.
Often a lifelong interest in biology and science is engendered at the secondary school level. In our opinion this interest cannot be
encouraged enough. This series of 34 educational experiments has
been produced with the conviction in mind that they will provide
didactic, original and even entertaining support in the teaching of the various biology concepts.
You can also access videos of these experiments on YouTube and on
the krou website (http//krou.moeyes.gov.kh).
Each experiment has an accompanying text with conclusion, clarification and background information.
Low-Cost Experiments for Biology Page 9 of 119
Biology Experiments
1. Experiments on the structure of plants
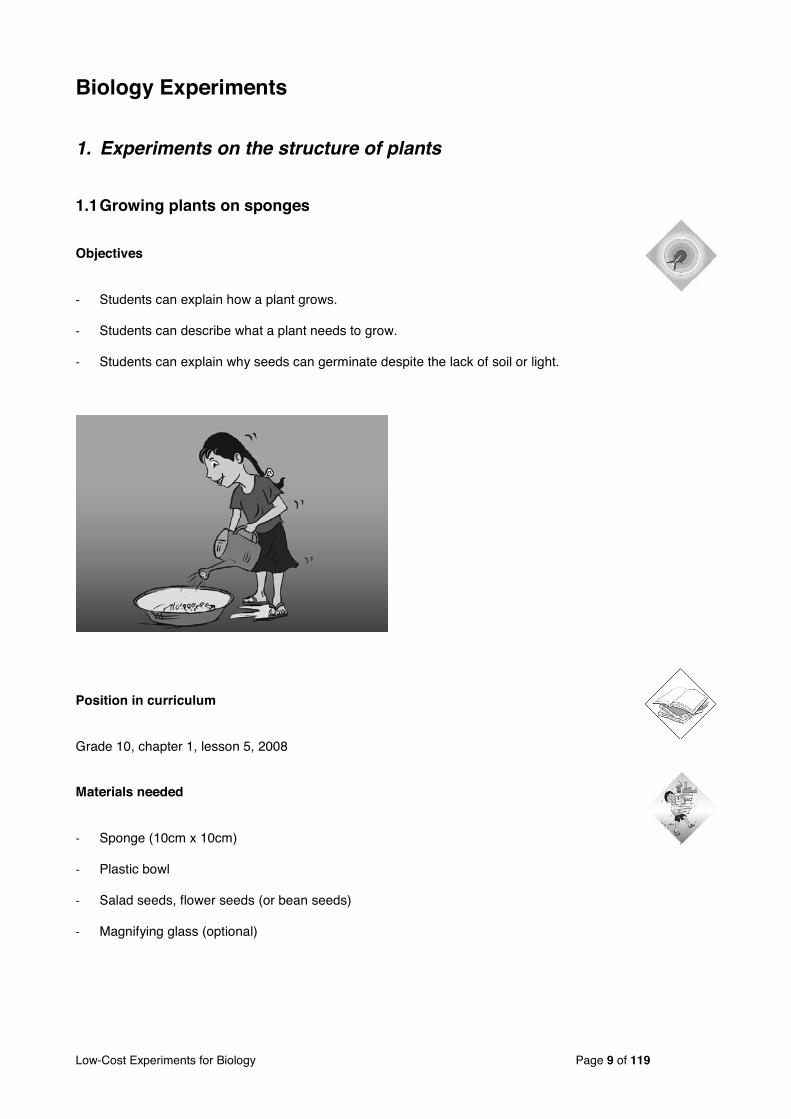
1.1 Growing plants on sponges
Objectives
Students can explain how a plant grows.
Students can describe what a plant needs to grow.
Students can explain why seeds can germinate despite the lack of soil or light.
Position in curriculum
Grade 10, chapter 1, lesson 5, 2008
Materials needed
Sponge (10cm x 10cm)
Plastic bowl
Salad seeds, flower seeds (or bean seeds)
Magnifying glass (optional)
Low-Cost Experiments for Biology Page 10 of 119
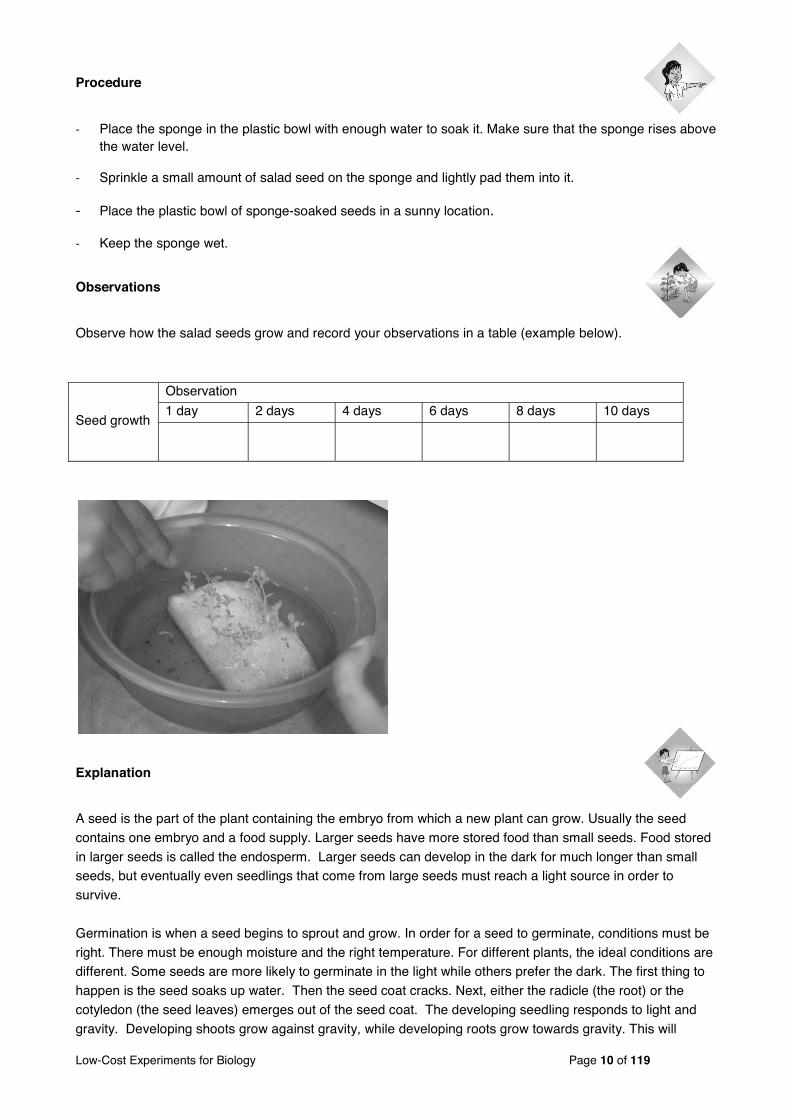
Procedure
Place the sponge in the plastic bowl with enough water to soak it. Make sure that the sponge rises above the water level.
Sprinkle a small amount of salad seed on the sponge and lightly pad them into it.
Place the plastic bowl of sponge-soaked seeds in a sunny location.
Keep the sponge wet.
Observations
Observe how the salad seeds grow and record your observations in a table (example below).
Seed growth
Observation
1 day 2 days 4 days 6 days 8 days 10 days
Explanation
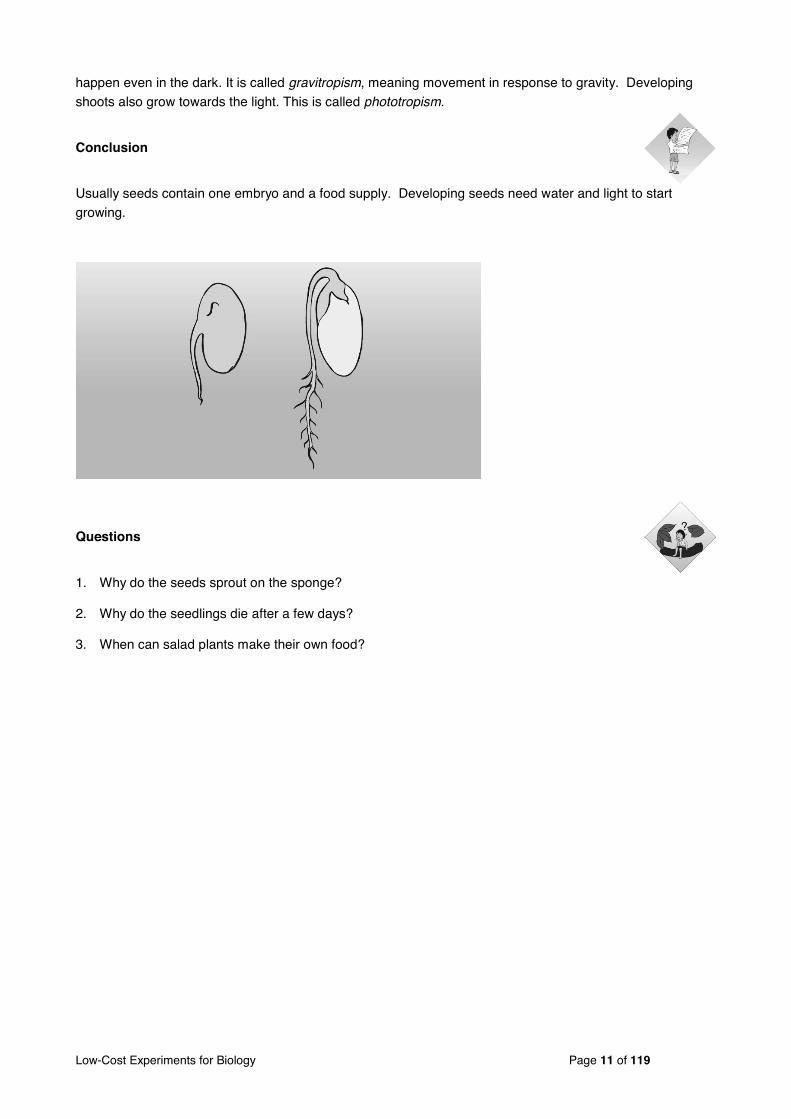
A seed is the part of the plant containing the embryo from which a new plant can grow. Usually the seed
contains one embryo and a food supply. Larger seeds have more stored food than small seeds. Food stored
in larger seeds is called the endosperm. Larger seeds can develop in the dark for much longer than small seeds, but eventually even seedlings that come from large seeds must reach a light source in order to
survive.
Germination is when a seed begins to sprout and grow. In order for a seed to germinate, conditions must be
right. There must be enough moisture and the right temperature. For different plants, the ideal conditions are different. Some seeds are more likely to germinate in the light while others prefer the dark. The first thing to
happen is the seed soaks up water. Then the seed coat cracks. Next, either the radicle (the root) or the
cotyledon (the seed leaves) emerges out of the seed coat. The developing seedling responds to light and
gravity. Developing shoots grow against gravity, while developing roots grow towards gravity. This will
Low-Cost Experiments for Biology Page 11 of 119
happen even in the dark. It is called gravitropism, meaning movement in response to gravity. Developing
shoots also grow towards the light. This is called phototropism.
Conclusion
Usually seeds contain one embryo and a food supply. Developing seeds need water and light to start
growing.
Questions
1. Why do the seeds sprout on the sponge?
2. Why do the seedlings die after a few days?
3. When can salad plants make their own food?
Low-Cost Experiments for Biology Page 12 of 119
1.2 Transportation of water through plant leaves
Objectives
Students can describe the transportation of water in plants.
Students can explain the role of stomata in transporting.
Students can explain the formation of water droplets in the top bottle.
Students can relate the experiment to the water cycle on Earth.
Position in curriculum
Grade 8, chapter 3, lesson 2, 2010 Grade 9, chapter 1, lesson 1, 2011
Grade 12, chapter 2, lesson 1, 2010
Materials needed
Large plant leaf with long stem
2 plastic bottles (500ml)
Water
Clay
Nail (slightly smaller than the size of leafʼs branch)
Procedure
Roll the clay and put it in the bottle neck.
Make a hole in the plug with the nail so the stem fits in it.
Insert the stem of the leaf through the clay. Be careful not to break the stem or crush the leaf.
Press the clay plug inward around the stem to seal it.
Fill one bottle with water and push the plug with the leaf in it into the top of the bottle. The end of the stem should be in the water.
Carefully, turn the other bottle upside down on top of the first bottle. Again press the clay gently around any opening in order to seal the connection between the two bottles.
Make the same structure but without the plant leaf. This will serve as a control experiment. In this way you can determine if any observations are caused by the presence of the leaf or not.

Low-Cost Experiments for Biology Page 13 of 119
Observations
After one hour observe the experiment and record your observations in a table (example below).
Observation Bottle with the leaf Bottle without leaf
Top bottle Bottom bottle Top bottle Bottom bottle

Low-Cost Experiments for Biology Page 14 of 119
Explanation
A plant loses water vapour through holes or pores called stomata. Plants often obtain too much ground water through their roots and get rid of what is not needed through these holes. Although you may not see it, plants
give off litres of water each day. Leaves release millions tons of water vapour into the air every day. This is
an earth process we never consider, but without it we could never live on this planet.
The entire amount of water on Earth is always the same – none is ever lost. The earthʼs waters are naturally recycled through rain, clouds, lakes, rivers, oceans, and especially by plant transpiration. We call this the
water cycle.
Conclusion
Water and minerals within plants are transported by a process called transpiration. Stomata play an
important role in this process.
Questions
1. Why do small droplets appear in the top bottle?
2. How can you be sure that the plant leaf is responsible for the formation of the droplets?
3. Which part of plant functions as transporter?
4. How would you measure the amount of water that is transported by the plant leaf?

Low-Cost Experiments for Biology Page 15 of 119
1.3 Flowers change colours
Objectives
- Students realize how vital the roles of the roots and the stems are to the plants.
- Students can describe the transportation process in plant tissues.
- Students can explain the function of stomata in the transportation system of plants.
- Students can observe and make inferences from experimental data.
Position in curriculum
Grade 7, chapter 2, lesson 3, 2009
Grade 8, chapter 3, lesson 2, 2010
Materials needed
- 2 types of flowers (any flower which is white such as morning glory, and white bougainvillea)
- 2 plastic bottles (500ml)
- Food colouring or dyes
- Water

Low-Cost Experiments for Biology Page 16 of 119
Procedure
Fill the 2 plastic bottles half with water
Drop 20-30 droplets of food colouring into each bottle
Cut the branch of flower long enough and put it in each plastic bottle. Make sure the branch is under the water surface. In the case of cut flowers, it is very important for the stem tubes to be filled with water. The reason is this, no water can move up if the stem tubes are filled with air.
Leave them for 2-3 hours.
Observations
Observation
2 hours 3 hours 4 hours 5 hours
Morning glory
flower
White bougainvillea
flower
Explanation
The flower drank the coloured water and as the water travelled up the stem and into the petals, it carried the
food colouring with it. As the food colouring reached the petals, they take on the colour of the water. Putting food colour in the water of the plants does not harm them. But like coloured dyes, chemicals that pollute the
waters can get into the soil and ground water, contaminating our vegetables and plants. Some pollutants and
chemicals, just like the coloured, may even travel up the plant and affect the way the plant grows.
Incidentally, this is similar to why flamingos are pink. Flamingos eat a lot of shrimp and shellfish and they
absorb the pink and red colours into their feathers, making them pink.
Conclusion
Flowers absorb water and transport it through the stems to the leaves in a process called transpiration.
Substances dissolved in the water such as food colouring or pollutants are also transported, contaminating
vegetables and plants.

Low-Cost Experiments for Biology Page 17 of 119
2. Experiments on diffusion and osmosis
2.1 Diffusion
Objectives
Students can demonstrate diffusion of a dissolved substance.
Students can explain the process of diffusion and give an example.
Students can explain how temperature affects the rate of diffusion.
Position in curriculum
Grade 7, chapter 2, lesson 3, 2009 Grade 8, chapter 3, lesson 1, 2010
Materials needed
Pot or plastic bottle (1.5 or 2L)
Cold water
2 soda bottles (or other small glass bottles)
Marbles (or stones)
Food colouring (few drops)
Ice cubes
Iron wire
Cooking stove
Iron pot
Pliers
Procedure
Heat approx. ¼ litre water.
Use scissors to cut the iron wire into pieces of about 20cm and tie it to the soda bottleʼs neck
Fill the pot nearly full of cold water (the colder the better, use ice cubes if possible)
Fill the small bottle with hot water (2/3 full).
If necessary, drop some marbles in the bottle, so the bottle will sink (if the bottle is heavy enough, the marbles are no need to use)

Low-Cost Experiments for Biology Page 18 of 119
Drop the food colouring into the hot water in the bottle and observe its spreading in the water.
Then place this hot bottle into the pot of cold water. Make sure that the bottle is small enough to submerge in the cold water.
Observations
Observe the speed of diffusion in the bottle of hot water.
Observe the speed of diffusion when the bottle of hot water is placed into the cold water.
Compare both speeds.
Explanation
Diffusion is the movement of particles from an area of higher concentration to an area of lower concentration.
The result of diffusion is a gradual mixing of material. In a phase with uniform temperature, the diffusion process will eventually result in complete mixing or a state of equilibrium.
Conclusion
Diffusion is the movement of particles from an area of higher concentration to an area of lower concentration.
Questions
1. Why does food colouring spread faster in the hot water?
2. What can you see when the hot bottle was placed into pot of cold water?
3. Predict what would happen if you repeated the experiment but with cold water for the bottle and the pot.

Low-Cost Experiments for Biology Page 19 of 119
2.2 Osmosis in plant tissues
Introduction
This experiment on osmosis allows students to observe and collect their own data, which they can process in a table or graph. It can also be used to teach students about the importance of a control when doing a
science experiment.
Position in curriculum
Grade 7, chapter 2, lesson 3, 2009
Grade 8, chapter 3, lesson 1, 2010
Objectives
Students are able to demonstrate osmosis using plant tissue.
Students can explain osmosis and give an example in plants.
Students can explain the difference between osmosis and diffusion.
Materials needed
Small bowls or cups
Water
Sugar
Salt
Potato
Knife
Tissue
Pencil or pen
Procedure
Label three plastic bowls water, salt, and salt respectively
Fill the bowls about 1/3 with water
Dissolve salt into water. Keep adding salt until no salt dissolves anymore.
Repeat the procedure to make a sugar solution.
Use a knife the peel the skin of potato and make potato slices of approx. 6 cm long and 0.5 cm thick. Try to make the strips as identical as possible.
Measure the strips and write the length down.
Put one strip of potato in each solution

Low-Cost Experiments for Biology Page 20 of 119
Observations
After 30 minutes, take the potato strips out of the bowls.
Dry the strips with paper tissue.
Feel the strips and record you observations in a table.
Measure the strips and record you observations in a table.
Solution
Observations
Length of potato strip potatoʼs characteristics
Water
Sugar
Salt
Explanation
Osmosis is the movement of water molecules across a membrane from an area of higher concentration to an area of lower concentration. Osmosis is of great importance in biological processes
where the solvent is water. The transport of water and other molecules across biological membranes is
essential to many processes in living organisms. Biological systems use osmosis to pass water and some
nutrients between cells.
In order to understand osmosis three concepts are important:
1. Diffusion
2. Membrane structure and permeability
3. Water concentration (or activity) in the presence of dissolved compounds
Low-Cost Experiments for Biology Page 21 of 119
Diffusion is the net movement of molecules from a region of high concentration to a region of lower
concentration due to random motion of molecules. In a solution with equal concentration, some molecules
will be moving out of a certain region and at the same time other molecules are moving into that region. Molecules move in all directions and are in continual motion.
Some membranes have such a structure that water molecules are small enough to pass through and sugar
molecules are too large (and too polar) to pass through. If there was a membrane with twice as many water molecules on one side as there were on the other side, more water would flow from a higher concentration to
a lower concentration of water. Eventually the concentration of water on each side of the membrane would
be equal and the flow of water would be diffusing through the membrane in both directions at the same rate.
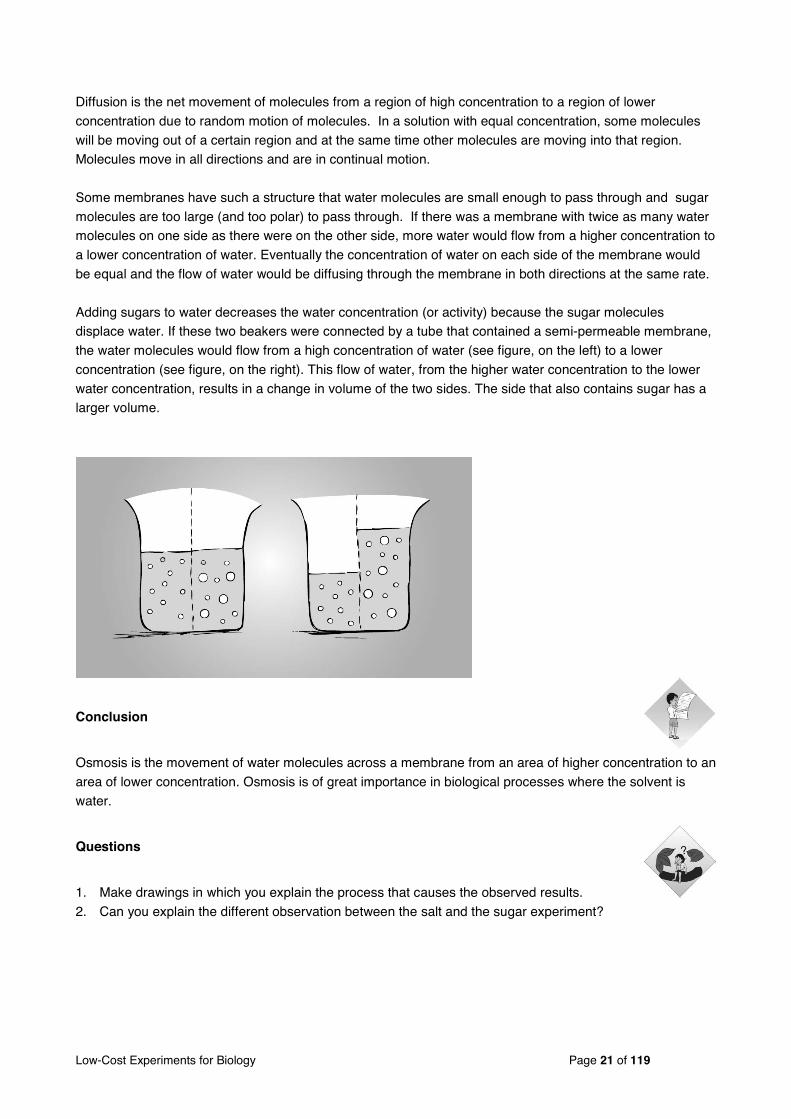
Adding sugars to water decreases the water concentration (or activity) because the sugar molecules displace water. If these two beakers were connected by a tube that contained a semi-permeable membrane,
the water molecules would flow from a high concentration of water (see figure, on the left) to a lower
concentration (see figure, on the right). This flow of water, from the higher water concentration to the lower
water concentration, results in a change in volume of the two sides. The side that also contains sugar has a larger volume.
Conclusion
Osmosis is the movement of water molecules across a membrane from an area of higher concentration to an
area of lower concentration. Osmosis is of great importance in biological processes where the solvent is
water.
Questions
1. Make drawings in which you explain the process that causes the observed results.
2. Can you explain the different observation between the salt and the sugar experiment?

Low-Cost Experiments for Biology Page 22 of 119
2.3 Osmosis in eggs
Objectives
Students are able to demonstrate osmosis using chicken eggs.
Students can explain osmosis and give an example in egg inner membrane.
Students can explain the difference between osmosis and diffusion.
Position in curriculum
Grade 7, chapter 2, lesson 3, 2009
Grade 8, chapter 3, lesson 1, 2010
Materials needed
3 large eggs
3 2-liter plastic bottles (preferably wider rather than taller)
White vinegar 150ml
Water
Blue food colouring (or another dark colour)
Syrup 50ml
Toothpick
Tape measure (or a piece of string and ruler)
Pen
Paper
Foil or plastic wrap (optional)
Procedure
This activity is completed in three parts. It is suggested that the first part of the activity is done in the afternoon or evening, the second part of the activity can be done the following afternoon or evening, and the
third part the following day.

Low-Cost Experiments for Biology Page 23 of 119
Part 1
Place each egg in a separate plastic bottle.
Pour vinegar into each bottle until it completely covers each egg. You may cover the bottles with foil or plastic wrap to reduce the smell.
Leave the bottles on the table in safe place for approximately 24 hours. The vinegar will react with the eggshell and remove it, leaving only the inner membrane. The eggs will look like the one below when the shell is removed. It is ok if all the shell is not removed, as long as the majority of the shell is removed.
Empty the vinegar out of each of the bottles and wash them thoroughly.
Lightly rinse each of the eggs with water.
Place the eggs back into the bottles.
Label each of the glasses 1 thru 3 and use the table provided at the end of this activity to keep track of the four different eggs.
Measure each egg around at the widest point using a tape measure or a piece of string. To use a piece of string, Take a piece of string and wrap it around the egg once. Mark with your finger the length of string that is needed to go around the egg once and measure it using a ruler. Record the length around for each egg using the table provided.
Put all eggs into 3 glasses
Cover one egg with water, one with water and a drop of blue food colouring, and one with molasses or syrup.
You may also cover the glasses with plastic wrap or foil to lessen the smell. Wait several hours (such as until the morning) to see what happens to the eggs!

Low-Cost Experiments for Biology Page 24 of 119
Part 3
Carefully remove the eggs from the substances and rinse them carefully with water.
Just as before, measure the eggs around at the widest part using either a tape measure or string and a ruler.
Record the measurements in the table.
Finally, place the eggs back inside the glasses after they have been properly washed or place them in new cups or glasses.
Use a toothpick to carefully pop each of the membranes of the eggs.
What did you notice about what was inside? Did any of the outside substance make it to the inside of the egg? Record your observations in the appropriate space in the table provided.
Observations
Record your observations in the table below.
Egg Substance Width before Width after
What was inside egg?
Other observation
Egg1
Egg2
Egg3
Explanation
A hard outer shell surrounds all chicken eggs. But did you know that underneath that shell is a membrane
similar to what surrounds cells? In this experiment, we have removed the shell in order to examine more
closely this membrane.
Osmosis is simply diffusion through a membrane. Substances will naturally try to “even out” meaning that, if
they are able to move through the membrane, they will try and obtain the same density on either side of the
membrane. Substances will move from an area of higher concentration (or density) to an area of lower
concentration through the membrane. Once the concentration is equal on both sides of the membrane, it is
said that the substance has achieved equilibrium.
Conclusion
In a process called osmosis substances move from an area of higher concentration (or density) to an area of
lower concentration through a semi-permeable membrane.

Low-Cost Experiments for Biology Page 25 of 119
Questions
1. In which substances did the width of the eggs increase? Explain your answer?
2. In which substances did the width of the eggs decrease? Explain your answer?
3. In which substances did the width of the eggs stay the same? Explain your answer?

Low-Cost Experiments for Biology Page 26 of 119
3. Experiments about the sense of taste
3.1 Sensitivity of sense of taste
Objectives
Students can explain the importance of the sensory system in daily life;
Students can perform an experiment to investigate the role of the aggregation state of on the taste;
Students can describe the role of salivary glands in tasting food.
Position in curriculum
Grade 12, Chapter 3, lesson 2, 2010
Materials needed
Grain sugar and spoon
Paper serviette (napkin)
Sugar water in a glass
Stopwatch
Procedure
Dry your tongue with the paper napkin
Put some sugar on your tongue
Record how long it takes to taste the sugar
Dry your tongue again
Take some sugar water into your mouth
Record how long it takes to taste the sugar

Low-Cost Experiments for Biology Page 27 of 119
Observations
The time to taste the grain sugar:……………………….. The time to taste the sugar water:………………………
Explanation
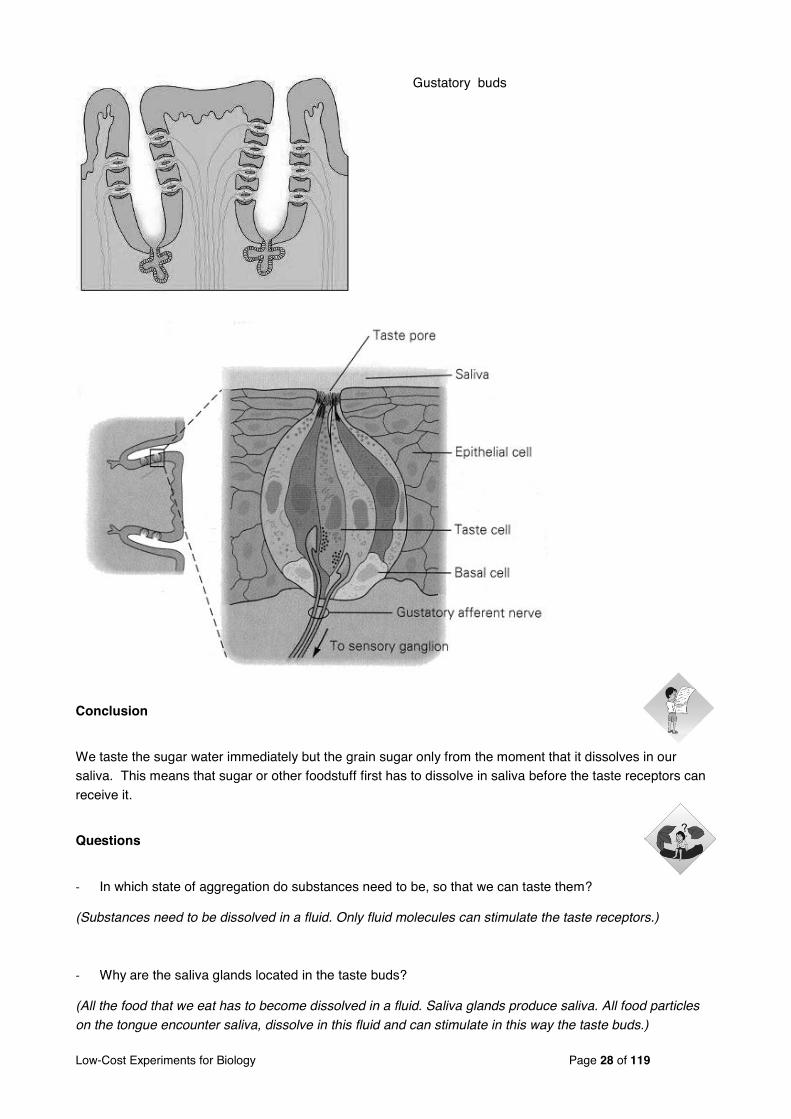
The taste receptors are situated in taste buds on the tongue (figure 1) and the palate. Figure 2 shows the
cross-section of 1 taste bud. There are several gustatory buds drawn. We recognize the saliva gland coloured in blue. Each gustatory bud contains 60 to 100 taste receptor cells and support cells. An action
potential is generated in the receptor cell when a food molecule binds on his villi. So food molecules first
have to dissolve in saliva (or water or any other fluid) before they can reach the villi. The action potential
causes an electric impulse that passes through the nerve (see figure 3) to the brain.
Taste buds
Low-Cost Experiments for Biology Page 28 of 119
Gustatory buds
Conclusion
We taste the sugar water immediately but the grain sugar only from the moment that it dissolves in our saliva. This means that sugar or other foodstuff first has to dissolve in saliva before the taste receptors can
receive it.
Questions
In which state of aggregation do substances need to be, so that we can taste them?
(Substances need to be dissolved in a fluid. Only fluid molecules can stimulate the taste receptors.)
Why are the saliva glands located in the taste buds?
(All the food that we eat has to become dissolved in a fluid. Saliva glands produce saliva. All food particles
on the tongue encounter saliva, dissolve in this fluid and can stimulate in this way the taste buds.)

Low-Cost Experiments for Biology Page 29 of 119
3.2 Relationship between sense of taste and smell
Objectives
Students can explain the importance of the sensory system in daily life;
Students can perform an experiment to test the sense of taste;
Students can interpret experiment results.
Position in curriculum
Grade 12, Chapter 3, lesson 2, 2010
Materials needed
6 glasses or cups
Grain sugar
Water
Sugar water or honey
Lime juice
Chips
Coffee (or other food)
Low-Cost Experiments for Biology Page 30 of 119
Procedure
part 1
Take a little bit of sugar or salt on the top of your finger and hold it against your palate.
Repeat this for the cheeks.
part 2
One person closes the eyes and nose.
The other person gives him/her different food.
Write a (+) for a good answer
and (–) for a wrong answer
Rinse the mouth with water after every tasting
Repeat the tasting with open nose (and closed eyes)
Observations
part 1
We also taste with the palate.
part 2
Nose Closed Nose Open
Lemon juice
Honey or sugar solution
Chips
Fruit juice
Coffee

Low-Cost Experiments for Biology Page 31 of 119
Explanation
The taste buds are scattered around all the places that food and drink touch: the cheeks, throat, palate (roof of the mouth) but are concentrated on the tongueʼs upper surface.
We only taste the 5 primary tastes with our taste receptors in the mouth. The complete taste of food is a
result of the cooperation of the taste and smell receptors.
All the tastes are composed of the 5 primary tastes sweet, sour, acid, salt and umami. But if we want to taste the full taste of food, we also need to use the smell receptors. The sensitivity of the smell receptors is much
higher than those of the taste receptors.
Conclusion
We only taste the primary tastes with our taste receptors in the mouth. The complete taste of food is a result
of the cooperation of the taste and smell receptors.
All tastes are composed of the 5 primary tastes sweet, sour, acid, salt and umami. But if we want to taste the
full taste of food, we also need to use the smell receptors. The sensitivity of the smell receptors is much
higher than those of the taste receptors.
Questions
1. Can you explain why we taste less when we have a cold?
(A cold is a viral disease which infects the mucous membrane of the nose. The mucous membrane swells
and less air with smell particles from the food we eat enter the nose. The smell receptors are less stimulated
and as they help to form the taste, we taste less. )

Low-Cost Experiments for Biology Page 32 of 119
3.3 Adaptation of sense of taste
Objectives
Students can explain the importance of the sensory system in daily life;
Students can perform an experiment to test the adaptation of the sense of taste;
Students can explain the adaptation of the sense of tastes.
Position in curriculum
Grade 12, chapter 3, lesson 2, 2010
Materials needed
Grain sugar or sugar water or salt
Water
Spoon
2 glasses
Procedure
Fill half-full glass 1 with water and 1 spoon of sugar or salt and glass 2 with same amount of water and 3 spoons of sugar or salt. Stir well.
Taste from glass 1 (and spit out)
Taste from glass 2 (and spit out)
Taste again from glass 1 (and spit out)
Observation
How does the water taste? (Salty)
How does the water taste? (Saltier)
How does the water taste? (Normal, not salty anymore)
Low-Cost Experiments for Biology Page 33 of 119
Explanation
Taste adaptation is a gradual decline of taste intensity with prolonged stimulation. This means that a taste gets less strong after tasting it for a while. The taste receptor cells generate and send less frequently
impulses to the brain when they are stimulated with the same food molecule for a long time.
However, during a normal meal the taste of food does not seem to decrease or disappear.
During eating, the presence of saliva, the interactions between taste and smell particles and mouth
movements affect the duration of taste intensities. This also explains in part why results of adaptation experiments can differ between individuals.
Conclusion
A certain taste becomes less strong after tasting it for a while. The taste receptors are subject to adaptation.
The taste buds on the tongue react on the amount of salt in the water. They are only sensitive for little
differences in the amount of salt. They can adapt the level around which they are sensitive for salt.
Questions
1. Does adaptation also exist for other senses?
(Yes, also for the sense of sight, sense of smell and sense of touch.)

Low-Cost Experiments for Biology Page 34 of 119
4. Experiments about respiration
4.1 Comparison between inhaled and exhaled air
Objectives
Students can explain the importance of external (and internal) respiration;
Students can compare the amount of O2 and CO2 in inhaled and exhaled air.
Students can link the conclusion of the experiment with the theory about respiration.
Position in curriculum
Grade 8, Chapter 4, lesson 2, 2010
Materials needed
2 equal glasses
Thermometer
2 small candles
Matches
Freshly made limewater *
Test tube
Straw
*How to prepare limewater (Ca(OH)2 – solution):
Dissolve CaO2 in (distilled) water and stir well. Filter the mixture. You obtain a clear solution: limewater.
Procedure part 1
Breathe out in a glass.
Measure the temperature in the classroom.
Breathe out several times on the thermometer.

Low-Cost Experiments for Biology Page 35 of 119
Observation part 1
The temperature of the exhaled air is higher than the temperature of the classroom Remark: as the temperature in Cambodia is relatively high, the difference between the temperature of
inhaled and exhaled air is not so big.
Procedure part 2
Light the 2 candles
Breathe out several times in one glass.
Put this glass on top of a candle and at the same time, put the other glass on top of the other candle.
Observation part 2
The candle under the glass with exhaled air extinguishes first.
Remark: the 2 candles must be equally strong. Breathe in and out in the glass without moving the glass
away from your mouth. Try to let as less air as possible enter the glass while you put it above the candle.

Low-Cost Experiments for Biology Page 36 of 119
Conclusion part 2
A candle needs oxygen to burn. The candle filled with exhaled air extinguishes first so the exhaled air contains less oxygen.
Procedure part 3 (A)
The gas in soda water is CO2
A. How can we prove CO2 in a gas?
Fill half of the 2 test tubes with limewater
Put some drops of soda-water in test tube 1
Put some drops of normal water in test tube 2
Observation part 3(A)
The clear, colourless solution of test tube 1 becomes white and turbid.
The clear, colourless solution of test tube 2 stays the same.
Conclusion part 3(A)
We can prove the presence of CO2 by adding limewater.
Low-Cost Experiments for Biology Page 37 of 119
B. What is the difference in CO2 content of inhaled and exhaled air?
Procedure part 3(B)
Fill 2 test tubes half with lime water.
Put some air from the classroom in the limewater from test tube 1 by shaking the test tube.
Breathe out through the straw in the test tube 2.
Observation part 3(B)
The clear, colourless solution of test tube 1 becomes only a little bit white and turbid.
The clear, colourless solution of test tube 2 becomes fully white and turbid.
Explanation
Exhaled air has a much higher percentage of CO2 compared to inhaled air and a lower percentage of oxygen
(but this difference is not so big). The body can only absorb a small amount of the oxygen from each lungful
of air, so much of the inhaled oxygen is breathed out again. Oxygen content of inhaled air is 21 %, that of the
exhaled air is 15.5-17 %. The CO2 content of the inhaled air is 0.04 %, compared to 4 % in exhaled air (100 x higher concentration).
The humidity of inhaled air is dependent on the geographical location. It is about 0 % in dry climates.
Humidity of exhaled air (water vapour) is 6 %. This is because during its passage through the mucous airways, water dissolves into the air. The temperature of exhaled air is higher than that of inhaled air, but
when the temperature of the classroom air exceeds 25°C, the difference will be very small.
Final conclusion
Exhaled air:
contains more water vapour
is warmer
contains less O2
contains more CO2
than inhaled air.
Question
1. Link the conclusions with the way the respiration system functions. Explain each difference.
It is better to start with this experiment before you give the theory about respiration but if this is not possible,
then let the pupils/students explain in which part of the theory they learned more about what they just have
seen in this experiment.
Low-Cost Experiments for Biology Page 38 of 119
4.2 Holding your breath
Objectives
Students can understand the importance of respiration
Students can compare the breath in different conditions
Students can collect experimental data and make a graph of the results
Position in curriculum
Grade 8, chapter 4, lesson 2, 2010
Materials needed
Stopwatch
Plastic bag
Pen or pencil
Procedure
Divide students into groups of 4 or 5 students.
Let students predict how long they can hold their breath.
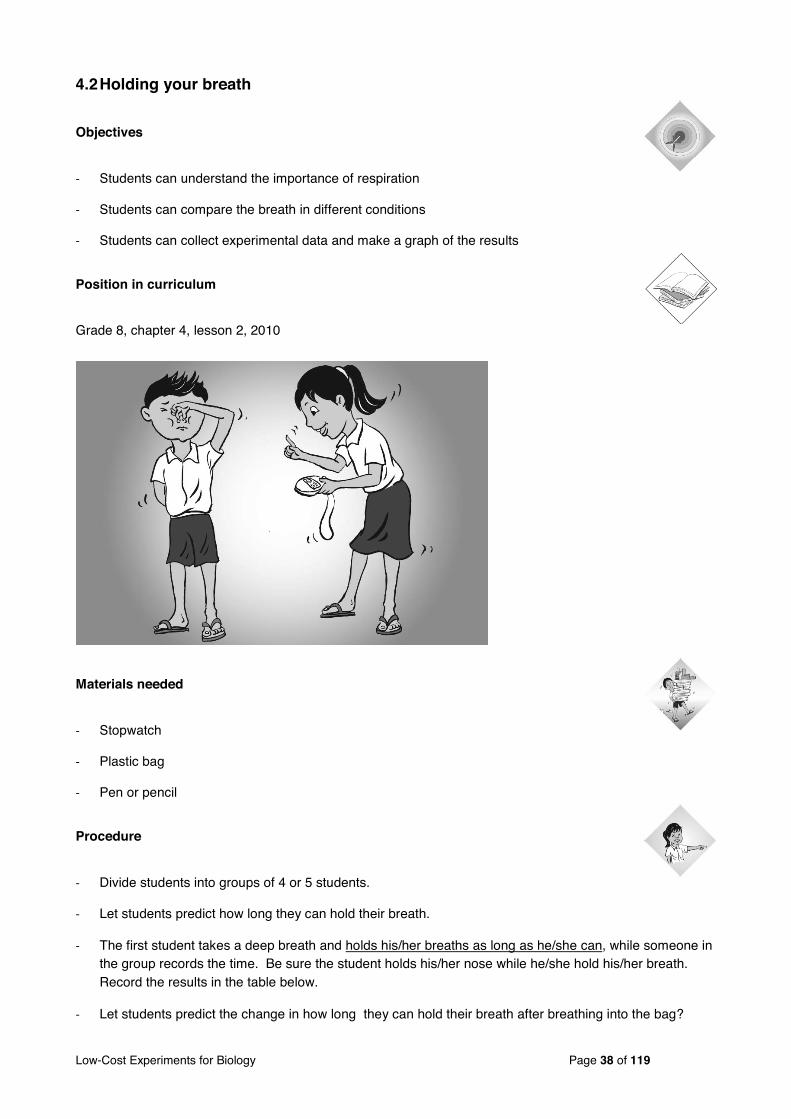
The first student takes a deep breath and holds his/her breaths as long as he/she can, while someone in the group records the time. Be sure the student holds his/her nose while he/she hold his/her breath. Record the results in the table below.
Let students predict the change in how long they can hold their breath after breathing into the bag?
Low-Cost Experiments for Biology Page 39 of 119
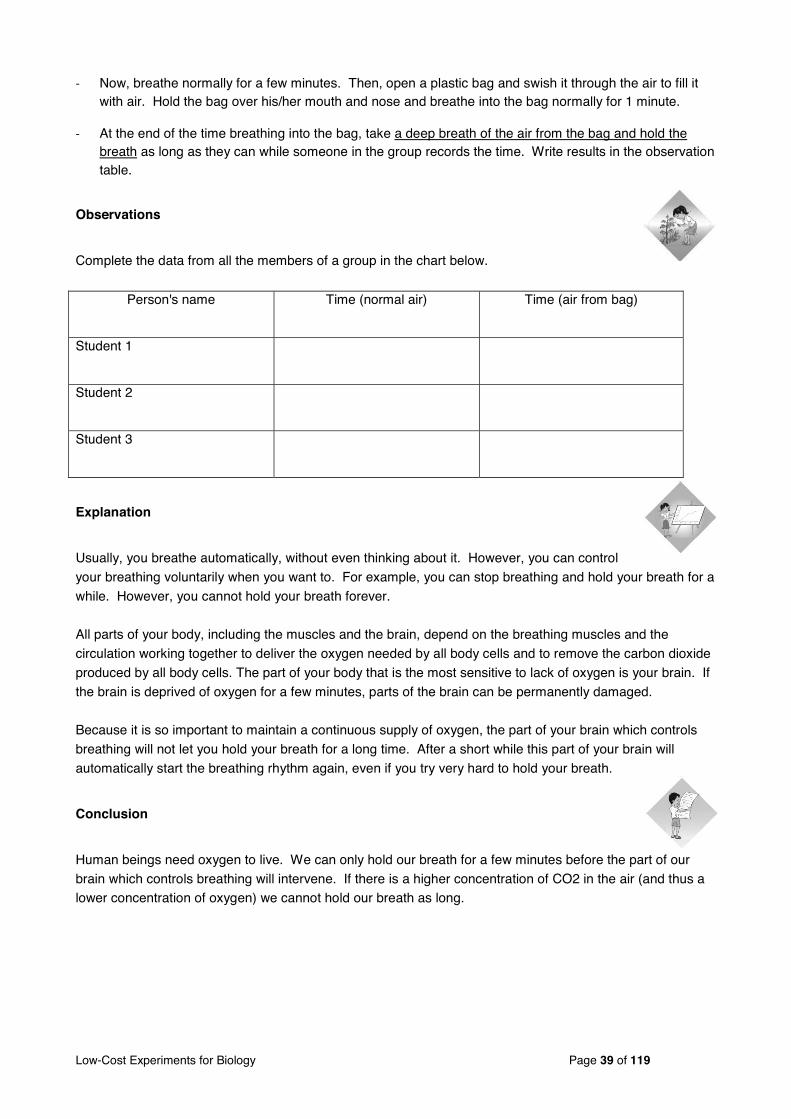
Now, breathe normally for a few minutes. Then, open a plastic bag and swish it through the air to fill it with air. Hold the bag over his/her mouth and nose and breathe into the bag normally for 1 minute.
At the end of the time breathing into the bag, take a deep breath of the air from the bag and hold the breath as long as they can while someone in the group records the time. Write results in the observation table.
Observations
Complete the data from all the members of a group in the chart below.
Person's name Time (normal air) Time (air from bag)
Student 1
Student 2
Student 3
Explanation
Usually, you breathe automatically, without even thinking about it. However, you can control
your breathing voluntarily when you want to. For example, you can stop breathing and hold your breath for a
while. However, you cannot hold your breath forever.
All parts of your body, including the muscles and the brain, depend on the breathing muscles and the
circulation working together to deliver the oxygen needed by all body cells and to remove the carbon dioxide
produced by all body cells. The part of your body that is the most sensitive to lack of oxygen is your brain. If
the brain is deprived of oxygen for a few minutes, parts of the brain can be permanently damaged.
Because it is so important to maintain a continuous supply of oxygen, the part of your brain which controls
breathing will not let you hold your breath for a long time. After a short while this part of your brain will
automatically start the breathing rhythm again, even if you try very hard to hold your breath.
Conclusion
Human beings need oxygen to live. We can only hold our breath for a few minutes before the part of our
brain which controls breathing will intervene. If there is a higher concentration of CO2 in the air (and thus a lower concentration of oxygen) we cannot hold our breath as long.

Low-Cost Experiments for Biology Page 40 of 119
Questions
1. While you are breathing into the plastic bag, what happens to the concentration of carbon dioxide in the bag?
a. What happens to the levels of carbon dioxide in your lungs?
b. What happens to the levels of carbon dioxide in your blood?
c. What happens to the levels of carbon dioxide in your brain?
d. While you are breathing into the plastic bag, what happens to the levels of oxygen in the bag?
e. In your lungs, blood, and brain?
2. Why would it be very unhealthy to hold your breath for too long?
3. Were the results similar for all members of your group?
Low-Cost Experiments for Biology Page 41 of 119
4.3 Cellular respiration
Objectives
Students can explain the importance of (external and) internal respiration;
Students can make observations from an experiment demonstrated by the teacher;
Students can interpret experiment results;
Students can link the conclusion of the experiment with the theory about internal respiration.
Position in curriculum
Grade 8, Chapter 4, lesson 3, 2010
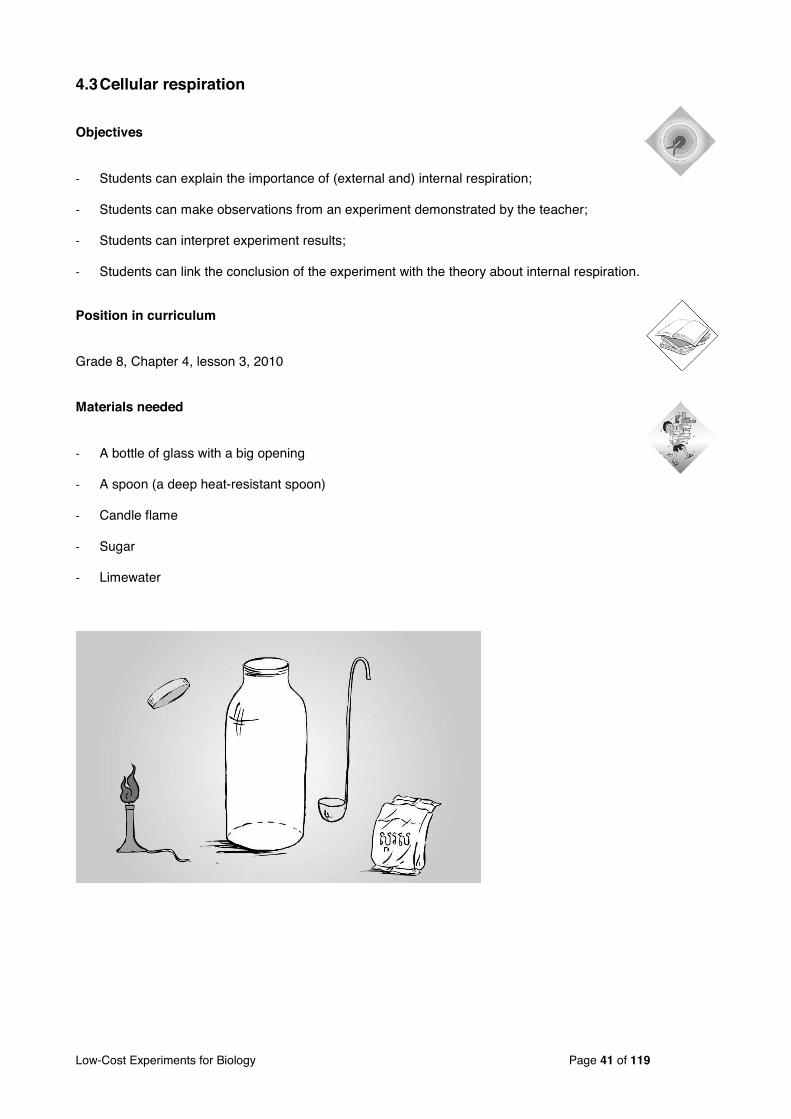
Materials needed
A bottle of glass with a big opening
A spoon (a deep heat-resistant spoon)
Candle flame
Sugar
Limewater
Low-Cost Experiments for Biology Page 42 of 119
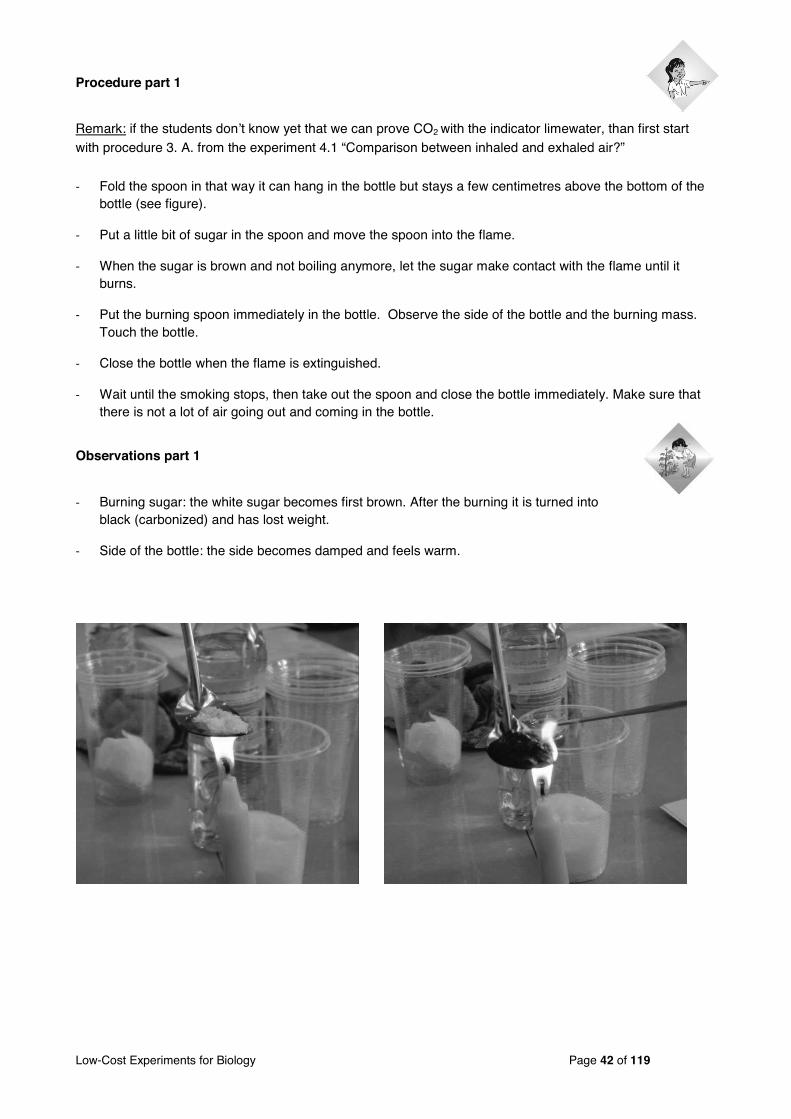
Procedure part 1
Remark: if the students donʼt know yet that we can prove CO2 with the indicator limewater, than first start with procedure 3. A. from the experiment 4.1 “Comparison between inhaled and exhaled air?”
Fold the spoon in that way it can hang in the bottle but stays a few centimetres above the bottom of the bottle (see figure).
Put a little bit of sugar in the spoon and move the spoon into the flame.
When the sugar is brown and not boiling anymore, let the sugar make contact with the flame until it burns.
Put the burning spoon immediately in the bottle. Observe the side of the bottle and the burning mass. Touch the bottle.
Close the bottle when the flame is extinguished.
Wait until the smoking stops, then take out the spoon and close the bottle immediately. Make sure that there is not a lot of air going out and coming in the bottle.
Observations part 1
Burning sugar: the white sugar becomes first brown. After the burning it is turned into black (carbonized) and has lost weight.
Side of the bottle: the side becomes damped and feels warm.

Low-Cost Experiments for Biology Page 43 of 119
Procedure part 2
Open the bottle a little bit (make the opening as small as possible) and add approx. 5 ml limewater.
Close the bottle and shake it. The air in the bottle mixes with the limewater. Observe the colour and transparency of the limewater.
Observations part 2
Limewater: the transparent, colourless limewater becomes white and turbid.
Explanation
Cellular respiration is the main way for a cell to gain useful energy. Respiration converts
biochemical energy from nutrients to energy stored in adenosine triphosphate (ATP). The waste products CO2 and water are released. The reactions involved in respiration are catabolic reactions that
involve the oxidation of one molecule and the reduction of another.
Nutrients commonly used by animal and plant cells in respiration include glucose, amino acids and fatty
acids. A common oxidizing agent (electron acceptor) is molecular oxygen (O2). The energy released in respiration is used to synthesize ATP to store this energy. The energy stored in ATP can then be used to
drive processes requiring energy, including biosynthesis, locomotion or transportation of molecules across
cell membranes. The chemical reaction of the oxidation of glucose (= respiration of glucose) is:
C6H12O6 + 6 O2 6 CO2 + 6 H2O + energy
We can examine the oxidation of glucose by burning sugar.
Conclusion
Burning sugar forms CO2, water and heat. The burning process needs oxygen. When there is
no more oxygen, the burning stops.

Low-Cost Experiments for Biology Page 44 of 119
Questions
1. Which gas is formed by burning glucose?
2. Link the conclusion of this experiment with the theory about the internal respiration.
Write down the overall chemical reaction that takes place: C6H12O6 + 6 02 -> 6 CO2 + 6 H2O + energy
3. What is the name of the opposite reaction that takes place in plant cells? Photosynthesis

Low-Cost Experiments for Biology Page 45 of 119
4.4 Chemicals in tobacco smoke
Objectives
Students can explain the importance of a healthy respiration;
Students can recognize the toxic chemicals in tobacco smoke;
Students can interpret experiment results;
Position in curriculum
Grade 7, chapter 5, lesson 2, 2009
Materials needed
Cigarette
Empty plastic bottle with lid. Make a small opening in the lid to put the cigarette in (see figure)
Cotton wool
Matches
Procedure
Put some cotton wool near the opening of the bottle.
Take off the filter of the cigarette and put the cigarette through the opening that you made in the lid
Light the cigarette with the match
Squeeze the bottle to push the air out and then restore the shape of the bottle so the air comes back into the bottle.
When the cigarette is burned out, remove the cotton wool from the bottle.
Smell and look at the cotton wool
You can repeat this experiment with new, white cotton wool and a cigarette with filter.

Low-Cost Experiments for Biology Page 46 of 119
Observations
The cotton wool becomes black.
Explanation
A cigarette is a small roll of finely-cut tobacco leaves wrapped in a cylinder of thin paper for smoking. Most
cigarettes are filtered and include reconstituted tobacco and other additives. Statistically each cigarette
smoked shortens a personʼs lifespan by 11 minutes. Smokers who die of tobacco-related diseases lose on average 14 years of life. Cigarette use by pregnant women has also been proven to cause birth defects,
including mental and physical disabilities.
The smoke of cigarettes contains tar: a black adhesive liquid, nicotine and CO2. Cigarette tar refers to the
toxic chemicals that are added during the production of tobacco cigarettes. The tar in tobacco cigarettes is a major cause of lung cancer, emphysema and bronchitis. The toxins from the tar can damage lung cells that
protect against tumours. Cigarette tar also damages cilia in the lungs, which protect the lining of the lungs.
Conclusion
The smoke of cigarettes contains tar: a black adhesive liquid (and nicotine and CO2).
Low-Cost Experiments for Biology Page 47 of 119
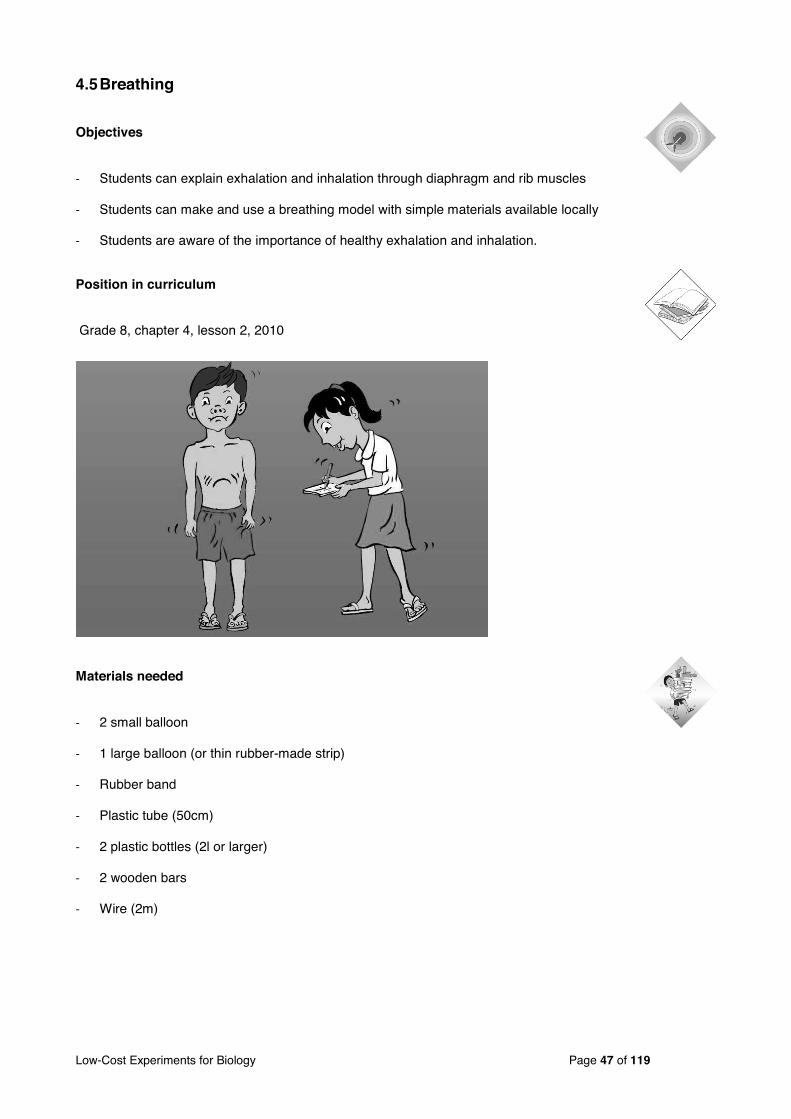
4.5 Breathing
Objectives
Students can explain exhalation and inhalation through diaphragm and rib muscles
Students can make and use a breathing model with simple materials available locally
Students are aware of the importance of healthy exhalation and inhalation.
Position in curriculum
Grade 8, chapter 4, lesson 2, 2010
Materials needed
2 small balloon
1 large balloon (or thin rubber-made strip)
Rubber band
Plastic tube (50cm)
2 plastic bottles (2l or larger)
2 wooden bars
Wire (2m)

Low-Cost Experiments for Biology Page 48 of 119
A. Model diaphragmatic breathing
Description
The balloons represent the lungs, the tube that comes out the bottle is the trachea, and the 2 (smaller) tubes
are the branches. The plastic bottle is a representation of the chest (ribs and muscles between the ribs) and
the big balloon underneath is the diaphragm. Make sure that no air can escape from the connection between the trachea and chest, trachea and branches and the branches with the smaller balloons.
Usage
As shown in the scheme, when you pull down the “diaphragm” (diaphragm contracts), a lower pressure is
created in the chest. The lungs stretch out and more air comes automatically in the lungs. This is inhaling by
diaphragmatic breathing. When the diaphragm relax (push the “diaphragm” upward), the pressure in the
chest increases and air moves out.

Low-Cost Experiments for Biology Page 49 of 119
B. Model chest breathing
Description
The model consists of two bars in wood and some circles in metal that go through the wood. The longest bar represents the spine, the shortest one the breastbone (sternum). The metal circles represent the ribs.
Breathing in Breathing out
Low-Cost Experiments for Biology Page 50 of 119
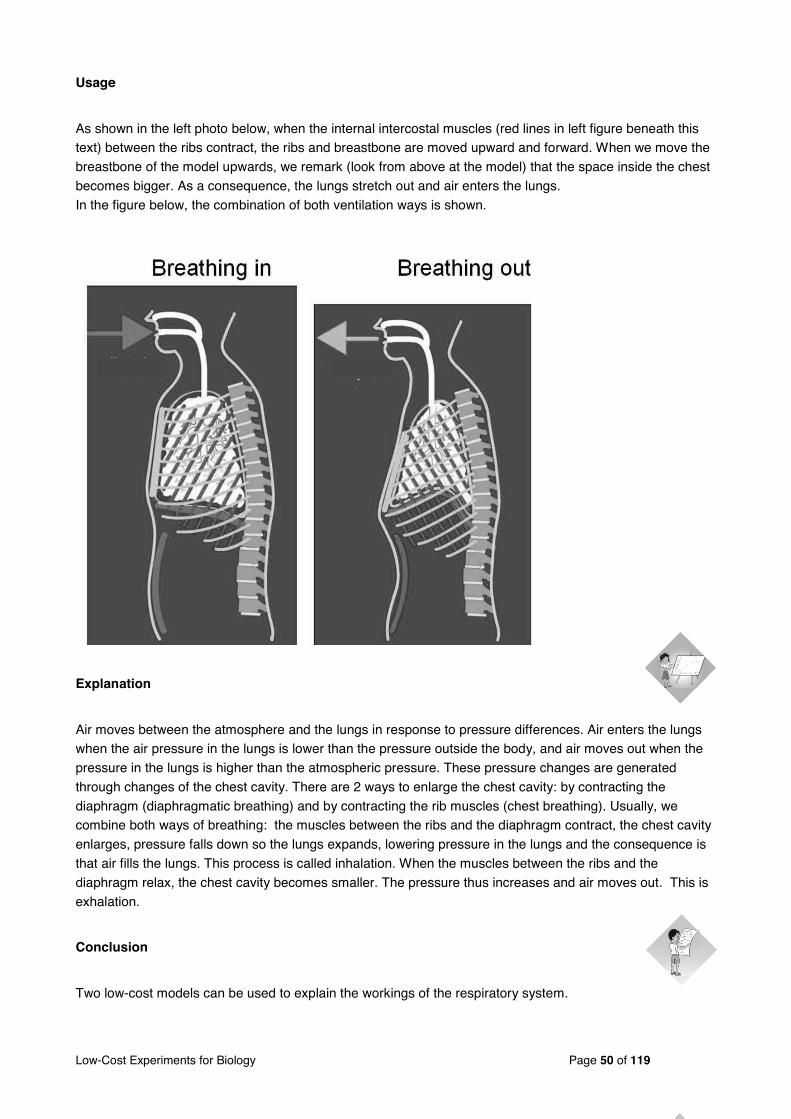
Usage
As shown in the left photo below, when the internal intercostal muscles (red lines in left figure beneath this text) between the ribs contract, the ribs and breastbone are moved upward and forward. When we move the
breastbone of the model upwards, we remark (look from above at the model) that the space inside the chest
becomes bigger. As a consequence, the lungs stretch out and air enters the lungs.
In the figure below, the combination of both ventilation ways is shown.
Explanation
Air moves between the atmosphere and the lungs in response to pressure differences. Air enters the lungs when the air pressure in the lungs is lower than the pressure outside the body, and air moves out when the
pressure in the lungs is higher than the atmospheric pressure. These pressure changes are generated
through changes of the chest cavity. There are 2 ways to enlarge the chest cavity: by contracting the
diaphragm (diaphragmatic breathing) and by contracting the rib muscles (chest breathing). Usually, we combine both ways of breathing: the muscles between the ribs and the diaphragm contract, the chest cavity
enlarges, pressure falls down so the lungs expands, lowering pressure in the lungs and the consequence is
that air fills the lungs. This process is called inhalation. When the muscles between the ribs and the
diaphragm relax, the chest cavity becomes smaller. The pressure thus increases and air moves out. This is
exhalation.
Conclusion
Two low-cost models can be used to explain the workings of the respiratory system.

Low-Cost Experiments for Biology Page 51 of 119
4.6 Model of spirometer
Objectives
Students can explain advantages of spirometer
Students can make and use this model properly
Students can calculate volume of air in lungs by using spirometer
Students can be healthy being aware of their lungsʼ air capacity
Position in curriculum
Grade 8, chapter 4, lesson 2, 2010
Materials needed
Plastic bottle (5 litre bottle)
Plastic tube (diameter of 1-2cm and length of 3m)
Glue
Scissors
1 large container
Coloured markers

Low-Cost Experiments for Biology Page 52 of 119
Description
The model is made of a big bottle (5 litre). Before cutting the bottom away, write the marks 0 litre, 1 litre,. Start with 0 litre at the top of the bottle. Make a hole in the top of the bottle and fit a tube in it. Remove the
bottom of the model.
Usage
Put the model in a big basin of water. The level of water in the basin has to equal the 0 litre mark of the
bottle. Breathe in and breathe out deeply in the tube. The bottle will rise in the water. When you have
completely breathed out, verify which mark is closest to the water level. If this is for example 3,5 litre, than
your vital capacity is 3,5 litre.

Low-Cost Experiments for Biology Page 53 of 119
Background knowledge
A spirometer is an apparatus for measuring the volume of air inhaled and exhaled by the lungs. In medicine, it is used as a first test of the health condition of the patient's lungs. Lung diseases such as asthma,
bronchitis and emphysema can be ruled out with these tests.
Lung volumes and lung capacities refer to the volume of air associated with different phases of the
respiratory cycle. Lung volumes are directly measured. Lung capacities are calculated from lung volumes. The average total lung capacity of an adult human male is about 6 litres of air, but only a small amount of
this capacity is used during normal breathing. This volume is called breathing air. An average human
breathes 12-20 times per minute. The figure below shows the different lung volumes. The vital capacity is the
maximum amount of air you can breathe out after breathing in as deeply as possible. For healthy persons, the vital capacity depends on gender (higher in males than females), length of the person (higher in larger
persons) and age of the person (higher in adults than children). Persons that do a lot of sports also have a
higher vital capacity. The total lung capacity is the viral capacity plus the remaining air.
Conclusion
A spirometer is an apparatus for measuring the volume of air inhaled and exhaled by the
lungs. The vital capacity is the maximum amount of air you can breathe out after breathing in as deeply as
possible. A working spirometer can be made with low-cost materials.

Low-Cost Experiments for Biology Page 54 of 119
5. Experiments about the sense of sight
5.1 The dissection of a cowʼs eye
Introduction
The following experiments are best done by each student/pupil. They have to feel and see it with their own body. Let the students/pupils describe the observations. Let them search for an explanation or conclusion.
The background knowledge is information for the teacher. You can teach it to the students/pupils AFTER you
have done the experiment. The purpose of the experiments is that students/pupils discover themselves the
new lesson content.
Objectives
Students can perform a dissection of a cowʼs eye.
Students can name the different parts of a cowʼs eye.
Students understand how light is collected and transmitted to the brain.
Position in curriculum
Grade 12, Chapter 3, lesson 2, 2010
Low-Cost Experiments for Biology Page 55 of 119
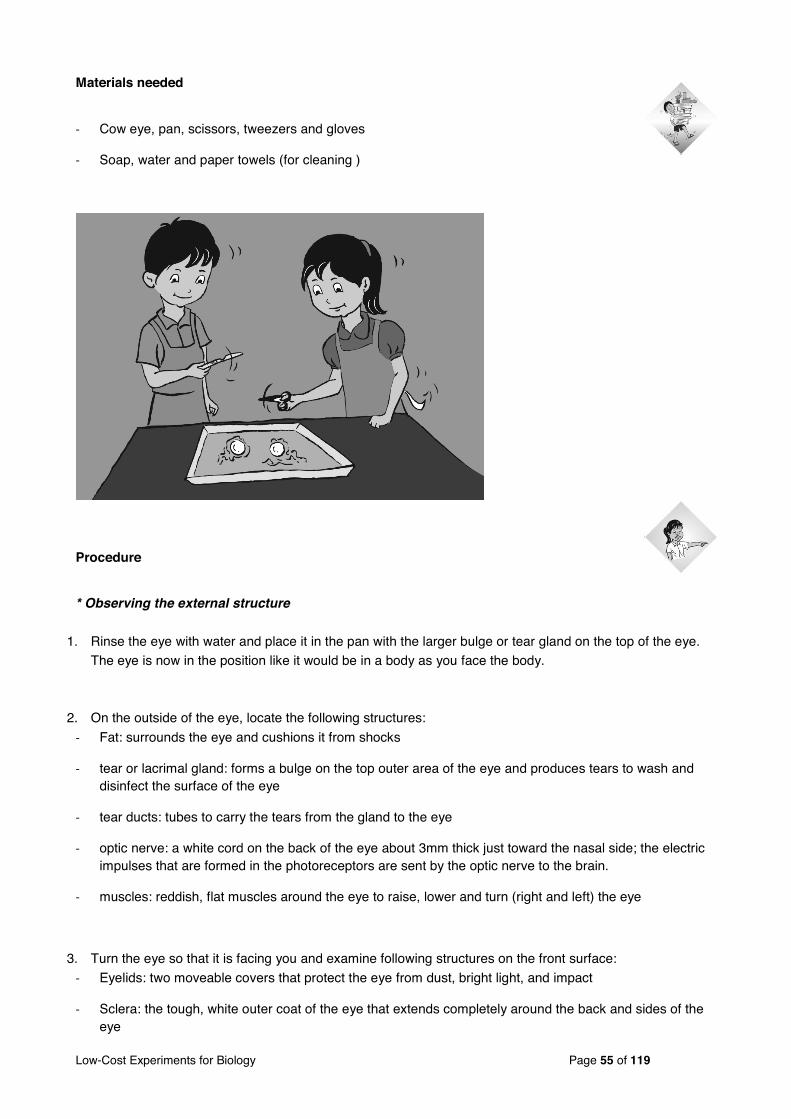
Materials needed
Cow eye, pan, scissors, tweezers and gloves
Soap, water and paper towels (for cleaning )
Procedure
* Observing the external structure
1. Rinse the eye with water and place it in the pan with the larger bulge or tear gland on the top of the eye.
The eye is now in the position like it would be in a body as you face the body.
2. On the outside of the eye, locate the following structures:
Fat: surrounds the eye and cushions it from shocks
tear or lacrimal gland: forms a bulge on the top outer area of the eye and produces tears to wash and disinfect the surface of the eye
tear ducts: tubes to carry the tears from the gland to the eye
optic nerve: a white cord on the back of the eye about 3mm thick just toward the nasal side; the electric impulses that are formed in the photoreceptors are sent by the optic nerve to the brain.
muscles: reddish, flat muscles around the eye to raise, lower and turn (right and left) the eye
3. Turn the eye so that it is facing you and examine following structures on the front surface:
Eyelids: two moveable covers that protect the eye from dust, bright light, and impact
Sclera: the tough, white outer coat of the eye that extends completely around the back and sides of the eye

Low-Cost Experiments for Biology Page 56 of 119
Cornea: a clear covering over the front of the eye that allows light to come into the eye (The cloudy nature of the cornea is caused by the death of this tissue. It is transparent as long as the organism is alive.)
Iris: round black tissue that you can see through the cornea; it controls the amount of light that enters the inner part of the eye (is coloured in human eyes)
Pupil: the round opening in the centre of the eye that allows light to enter and whose size is controlled by the iris
Pierce with the sharp point of the scissors through the white part of the eye or sclera just behind the edge of the cornea. Make a hole large enough for your scissors.
Carefully cut around the eye as shown with the black line in the photo.
After completing the cut, carefully remove the front of the eye and put it in your dissecting pan.
Place the back part of the eye in the pan with the inner part facing upward.
Locate the following internal structures of the eye:
a. cornea: is the transparent front part of the eye that covers the iris, pupil and anterior chamber. Cut
into the cornea to notice the thickness.
b. aqueous humour: fluid in the front of the eye that runs out when the eye is cut
c. iris: black (in humans coloured) tissue of the eye that contains muscle fibres
d. ciliary body or muscle: located on the back of the iris. The
lens is held in place by the suspensory ligaments that join
with the smooth muscle in the ciliary body.
e. lens: can be seen through the pupil; The normal lens is
convex shaped and somewhat elastic. Remove the lens by cutting with the scissors around the edges of the lens.
f. vitreous humour: clear gel that fills the space between the
lens and the retina of the eyeball

Low-Cost Experiments for Biology Page 57 of 119
g. retina: yellow-brown tissue in the back of the eye where light is focused; connects to the optic nerve.
The retina is attached to the back of the eye at just one spot: the optic nerve. Use the tweezers to separate the retina from the back of the eye and see a shiny, blue-green layer called the tapetum lucidum. This layer assists night vision by reflecting light back through the retina. Humans donʼt
have a tapetum, but cats and cows do.
h. choroid: The choroid coat is dark and relatively thin. Use the tweezers to separate the choroid from
the outer sclera. Verify that the eye has three distinct layers: the retina, choroid and sclera. The
choroid contains an extensive network of blood vessels that bring nourishment and oxygen to the choroid and the other two layers. The dark colour, caused by pigments, absorbs light to avoid
reflection inside the eye.
choroid
retina
Low-Cost Experiments for Biology Page 58 of 119
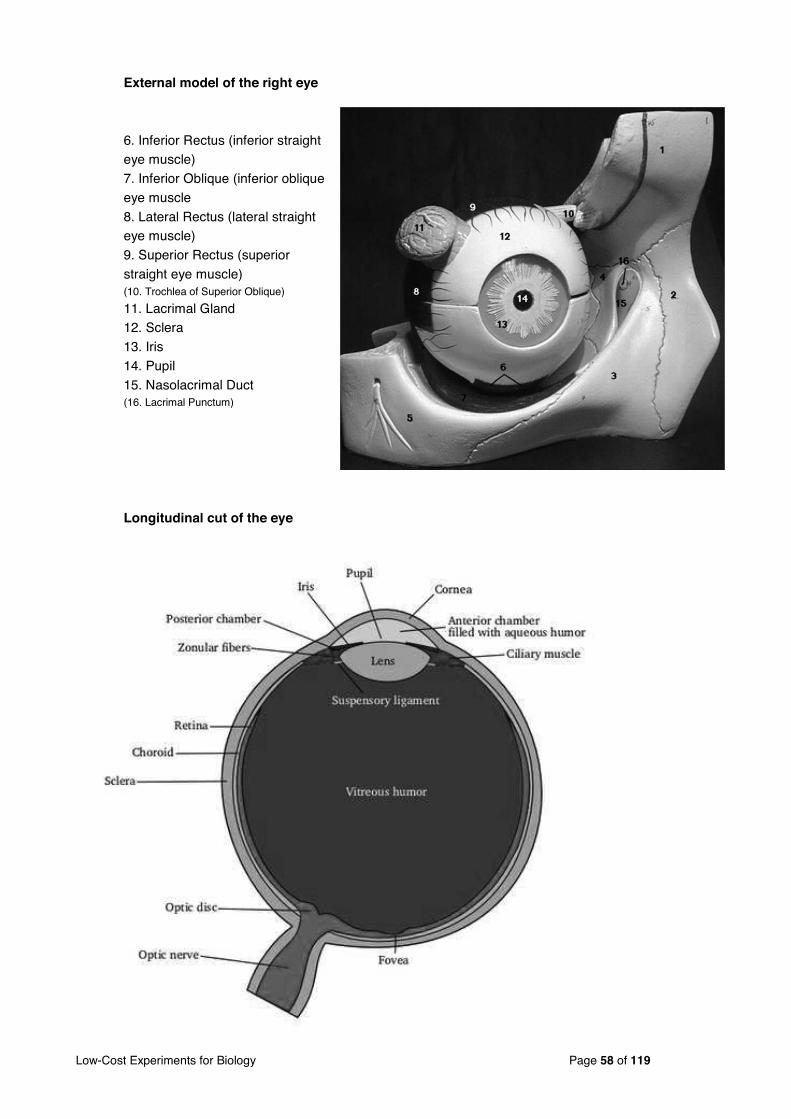
External model of the right eye
6. Inferior Rectus (inferior straight eye muscle)
7. Inferior Oblique (inferior oblique
eye muscle
8. Lateral Rectus (lateral straight eye muscle)
9. Superior Rectus (superior
straight eye muscle) (10. Trochlea of Superior Oblique)
11. Lacrimal Gland 12. Sclera
13. Iris
14. Pupil
15. Nasolacrimal Duct (16. Lacrimal Punctum)
Longitudinal cut of the eye
Low-Cost Experiments for Biology Page 59 of 119
Explanation
We see because the light that hits the eyes is processed through the photoreceptors into electric impulses. These photoreceptors are located in the retina of the eye. The impulses are sent by the optic nerve to the
brain which interprets what we see. To understand how the eye works, we study the anatomy of the eye. The
cowʼs or pig eye is similar to the eyes of all mammals including humans. The model of a human eye can be
used during the dissection to maximize studentsʼ understanding of the anatomy.
Conclusion
Cow eye consists 3 main layers; sclera, retina, and choroid. We see because the light that hits the eyes is processed through the photoreceptors into electric impulses. These photoreceptors are located in the retina
of the eye. The impulses are sent by the optic nerve to the brain which interprets what we see.
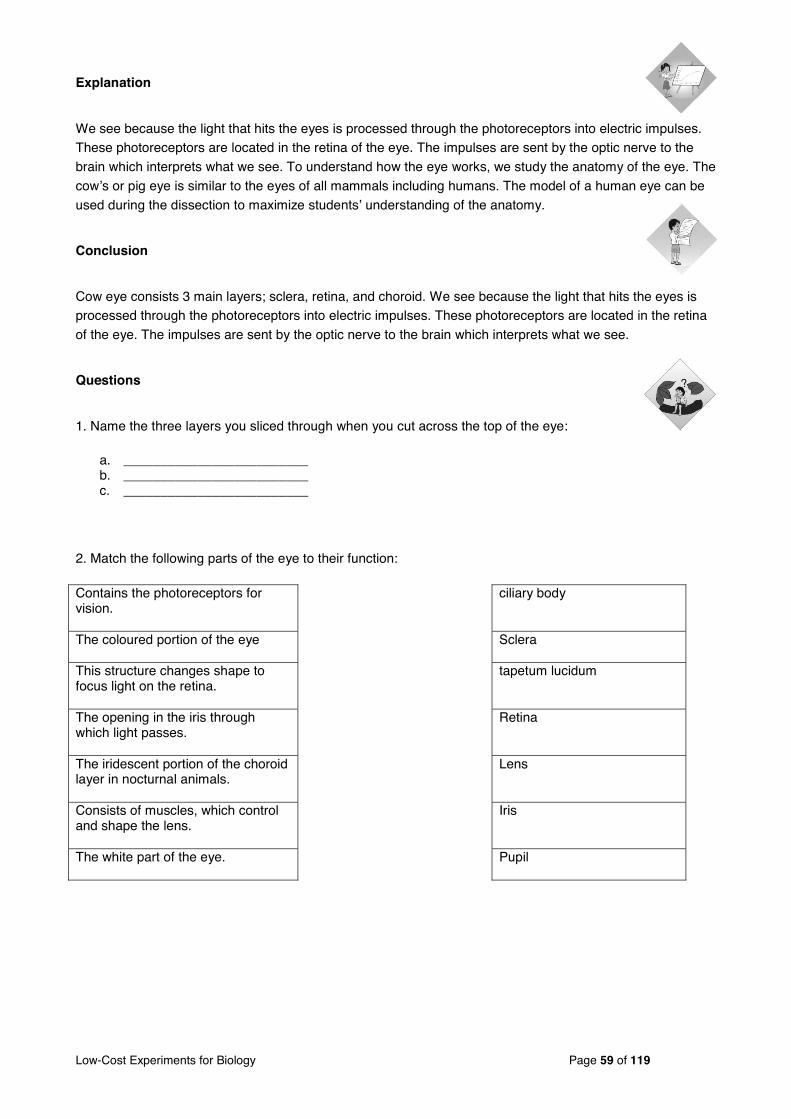
Questions
1. Name the three layers you sliced through when you cut across the top of the eye:
a. _________________________ b. _________________________ c. _________________________
2. Match the following parts of the eye to their function:
Contains the photoreceptors for vision.
ciliary body
The coloured portion of the eye Sclera
This structure changes shape to focus light on the retina.
tapetum lucidum
The opening in the iris through which light passes.
Retina
The iridescent portion of the choroid layer in nocturnal animals.
Lens
Consists of muscles, which control and shape the lens.
Iris
The white part of the eye. Pupil

Low-Cost Experiments for Biology Page 60 of 119
3. Use the pictures below to name the parts of the eye:


Low-Cost Experiments for Biology Page 62 of 119
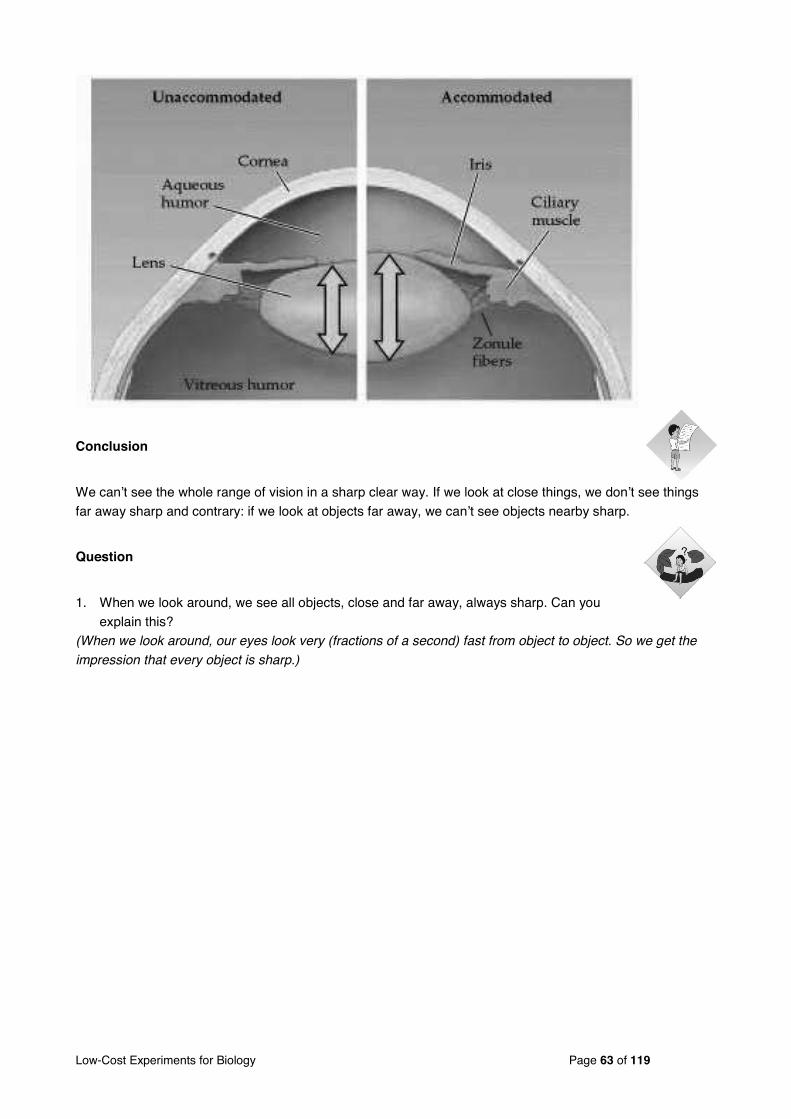
Explanation
The lens changes shape to focus the light reflecting from distant or close objects onto the retina. This adjustment to suit the distance between the eye and the viewed object is called accommodation. To focus on
a very close object, the ciliary muscle contracts, rounding the lens so that it can bend incoming light rays at
sharper angles. Looking a long time to a close object often causes a warm and tired feeling in the eyes. This
is because the ciliary muscle remains contracted while looking to nearby objects. To relieve this eyestrain,
look a certain time into the distance. When you view a faraway object, the ciliary muscle relaxes and the lens flattens.
snel :egami esolC denettalf si snel :egami tnatsiD is rounded
Low-Cost Experiments for Biology Page 63 of 119
Conclusion
We canʼt see the whole range of vision in a sharp clear way. If we look at close things, we donʼt see things
far away sharp and contrary: if we look at objects far away, we canʼt see objects nearby sharp.
Question
1. When we look around, we see all objects, close and far away, always sharp. Can you
explain this? (When we look around, our eyes look very (fractions of a second) fast from object to object. So we get the
impression that every object is sharp.)

Low-Cost Experiments for Biology Page 64 of 119
5.3 Role of the iris
Objectives
Students can explain the importance of light for the sense of sight;
Students can make observations from an experiment on their own body;
Students explain the relationship between light and pupil.
Students can explain in their own words how the eye copes with differing amounts of light
Position in curriculum
Grade 12, Chapter 3, lesson 2, 2010
Materials needed
No material is needed.
Procedure
A student closes one eye during 1 minute.
The student opens his/ her eye and the second student looks immediately at the diameter of the pupil and compares it with the other eye.
Observation
The pupil of the eye that was closed for a time is bigger than the pupil of the other eye. The pupil becomes
very fast smaller. It might be difficult to see with people with dark eyes (as nearly everyone in Cambodia), look very carefully.
Explanation
The iris regulates the amount of light entering the eye. An opening in the iris, the pupil, admits light. In bright
light, the pupil becomes smaller so that the retina doesnʼt receive excess stimulation. In dim light, the pupil
dilates, letting more light strike the retina. The pupil in the iris regulates thus the amount of light falling into
the retina. The image of an object is sharper when it is projected with the correct amount of light.

Low-Cost Experiments for Biology Page 65 of 119
Source: Arteveldehogeschool

Low-Cost Experiments for Biology Page 66 of 119
Source: Arteveldehogeschool
Receptors in the retina register dim light and send this information to the brain stem. As a consequence, an
impulse goes to the radial muscles in the iris. They contract, so the pupil becomes bigger.
The receptors in the retina register the bright light and send an impulse to the brain stem. A second impulse lets the circular muscles in the iris contract. The pupil becomes smaller.
Conclusion
The diameter of the pupil depends on the amount of light that reaches the eye. In bright light, the pupils become smaller. In the dark, they become wider (bigger).

Experiment Manual Biology Page 67 of 119
5.4 The “blind” spot on the retina
Objectives
Students can explain the importance of light for the sense of sight;
Students can make observations from an experiment on their own body;
Students can give the reason why we sometimes enable to see the object and sometimes doesnʼt.
Position in curriculum
Grade 11, Chapter 4, lesson 2
Grade 9, chapter 5, lesson 12
Materials needed
Paper with the pictures below.
Procedure
Hold this paper more or less 40cm in front of your eyes.
Close your left eye and look with your right eye to the square. You see in the corner of your eye the triangle.
Keep on fixing on the square and bring this paper closer to your eyes.
Observation
At a certain moment the triangle disappears from view.
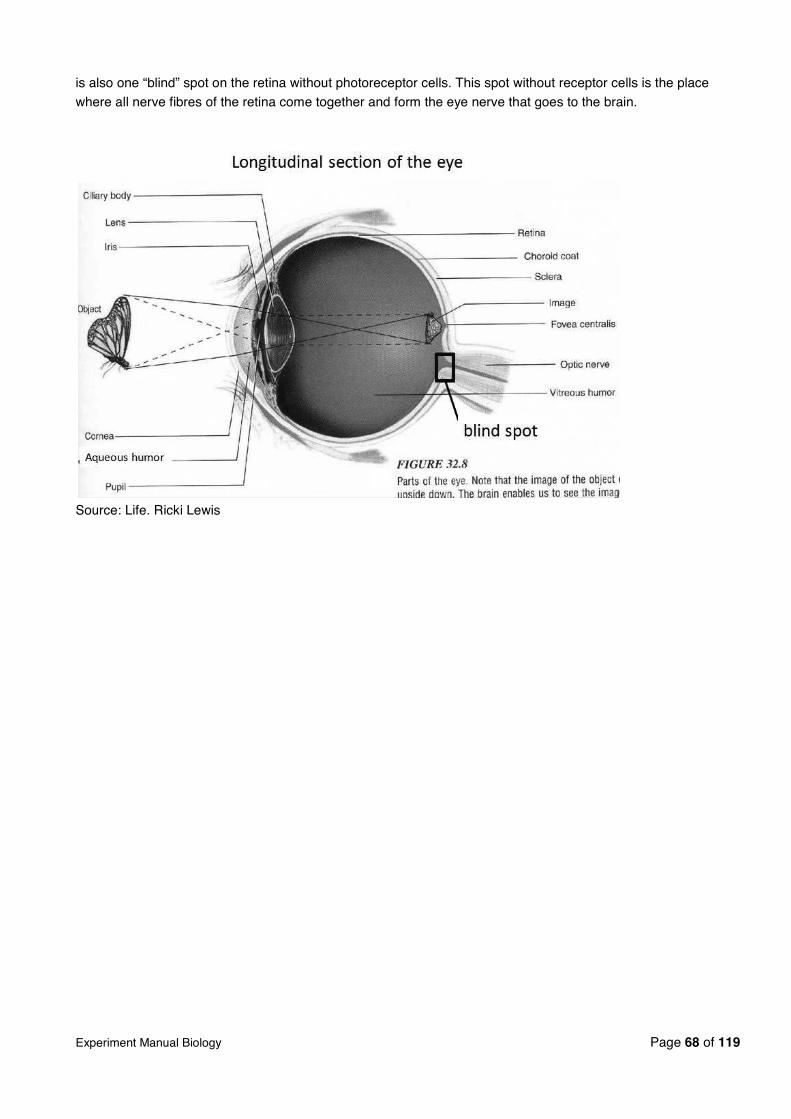
Explanation
The retina is built of several cell layers. The middle layer contains the photoreceptor cells. These cells
convert light in an electric impulse. There are two types, called rods and cones. Rods provide black-and
white vision in dim light and enable us to see at night. Cone cells detect colour. Rods and cones synapse with neurons, which form another layer of the retina. The fibres of the neurons form the optic nerve which
leads to the visual cortex in the brain. When the eye focuses on an object, the light beams coming from that
object touch the retina on the fovea centralis. This spot in the retina is situated right opposite the lens. There
Experiment Manual Biology Page 68 of 119
is also one “blind” spot on the retina without photoreceptor cells. This spot without receptor cells is the place
where all nerve fibres of the retina come together and form the eye nerve that goes to the brain.
Source: Life. Ricki Lewis
Experiment Manual Biology Page 69 of 119
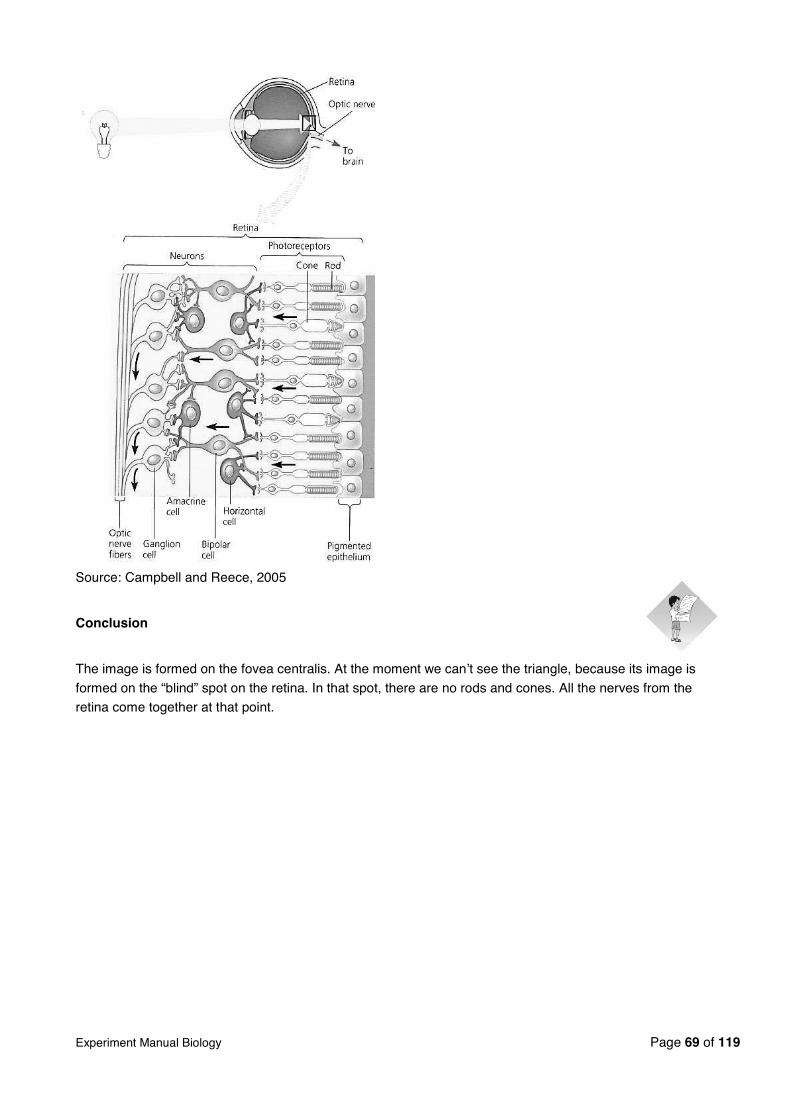
Source: Campbell and Reece, 2005
Conclusion
The image is formed on the fovea centralis. At the moment we canʼt see the triangle, because its image is
formed on the “blind” spot on the retina. In that spot, there are no rods and cones. All the nerves from the
retina come together at that point.

Experiment Manual Biology Page 70 of 119
5.5 Location on the retina of the different types of photoreceptors
Objectives
Students can explain how human vision works;
Students can make observations from an experiment on their own body;
Students can interpret experiment results;
Students can interpret an abstract scheme of the retina.
Students can explain the different role of cones and rods in their own words.
Position in curriculum
Grade 12, Chapter 3, lesson 2, 2010
Materials needed
coloured bar or colour pencil (one of the two persons is not allowed to look at the bar because he/she mustnʼt know its colour)
measuring stick
Procedure
Discuss the research question: Where are the rods and single-cone cells located in the retina?
Close your left eye. Look with your right eye to a letter on a white paper, like this letter X.
The person that sits on your left moves the coloured bar from the left side towards the letter X. Start with a distance from at least 50 cm.
Observation
From which distance do you see the bar? ……………………cm
From which distance do you see the colour of the bar?...........................cm

Experiment Manual Biology Page 71 of 119
Zones of the retina
Horizontal cut through the right eye, seen from above The retina of the right eye, seen through the lens
Where does the ray of light coming from the coloured bar touch the retina first?
Mark the right sequence from the following possibilities:
Starts with:
• 7 - 5 - 2 - 3 – 1 or 6 - 4 – 1 (correct)
Then thouches:
• 1 - 3 - 2 - 5 - 7 (correct) or 1 - 4 – 6
Explanation
The retina is built of several cell layers. The middle layer contains the photoreceptor cells, the rods and cones. Rods provide black-and white vision in dim light and enable us to see at night. Cones cells detect
colour. The picture shows the distribution of rods and cones on the retina. Rods are concentrated around
the edges of the retina and cones around the centre. The fovea centralis, a zone in the retina directly
opposite the lens, only contains cones. The distribution of rods and cones helps explain why human vision
works as it does. To see detail in bright light, it is best to look directly at the object because this focuses light on the central retina area that is dense with cones. At night we can see an object more clearly from the
corner of the eye. From this perspective, the light bouncing off the object stimulates the rod-rich region of the
eye. Only rods are sensitive enough to respond to dim light. More background information is given in the
“Blind” spot experiment.

Experiment Manual Biology Page 72 of 119
Conclusion
As rods provide black-and white vision and cone cells detect colour, this experiment shows that rod cells are
concentrated around the edges of the retina and cone cells are located toward the centre of the retina.
Questions
1. When do we see an object most clear at night: directly before us or more in the corner
of our eye? (At night we can see an object more clearly from the corner of the eye. From this perspective, the light
bouncing off the object stimulates the rod-rich region of the eye. Only rods are sensitive enough to
respond to dim light.)
2. If you already did the experiment “Blind spot”, point the number in the figure which represents the blind spot. (Number 2 is the blind spot (number 1 is the fovea centralis)).
Experiment Manual Biology Page 73 of 119
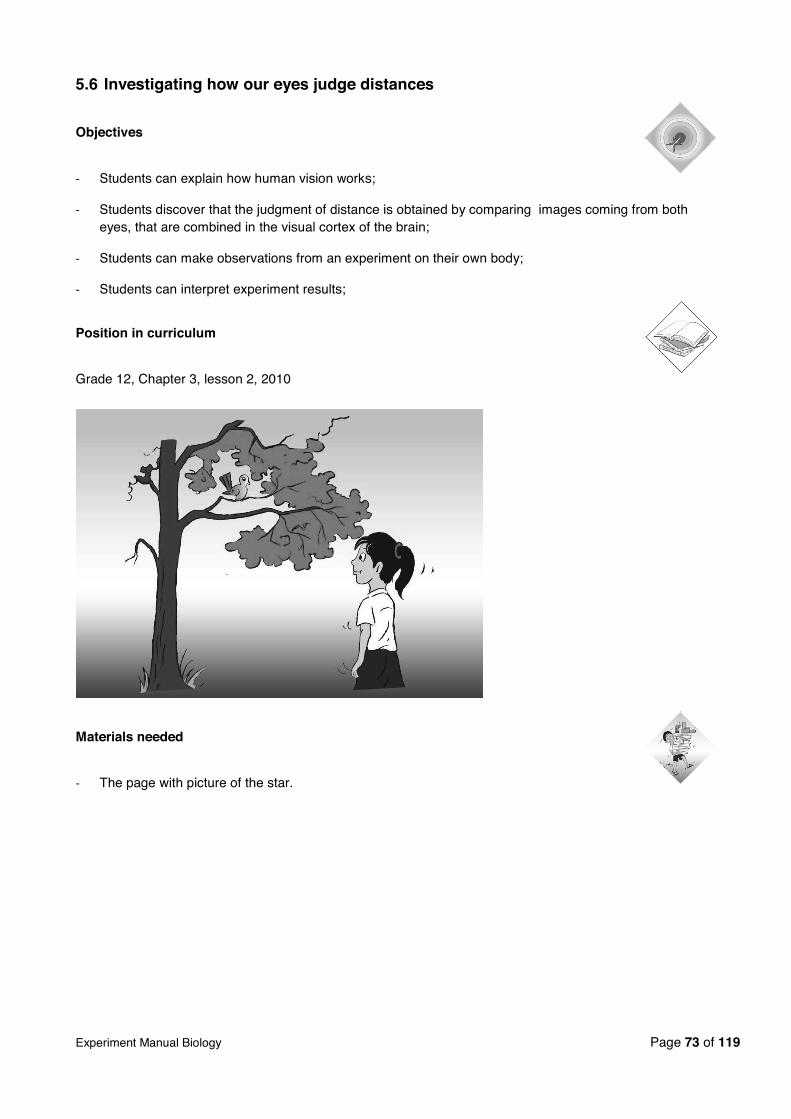
5.6 Investigating how our eyes judge distances
Objectives
Students can explain how human vision works;
Students discover that the judgment of distance is obtained by comparing images coming from both eyes, that are combined in the visual cortex of the brain;
Students can make observations from an experiment on their own body;
Students can interpret experiment results;
Position in curriculum
Grade 12, Chapter 3, lesson 2, 2010
Materials needed
The page with picture of the star.
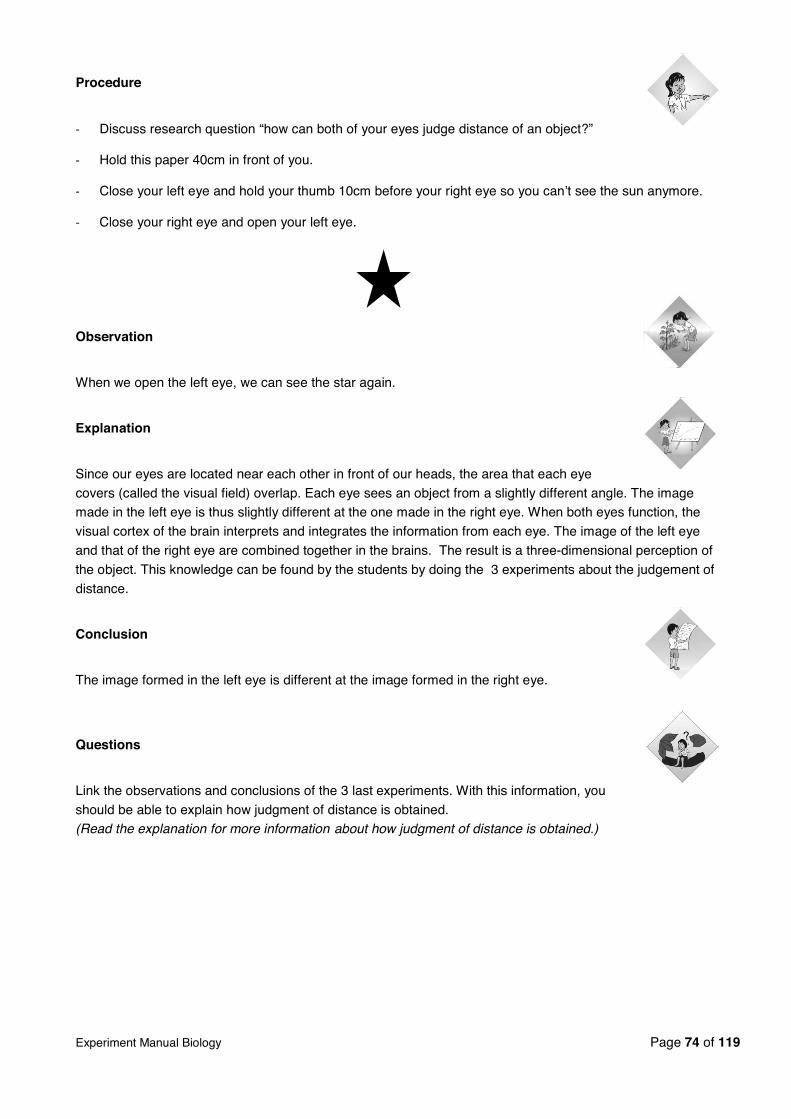
Experiment Manual Biology Page 74 of 119
Procedure
Discuss research question “how can both of your eyes judge distance of an object?”
Hold this paper 40cm in front of you.
Close your left eye and hold your thumb 10cm before your right eye so you can t see the sun anymore.
Close your right eye and open your left eye.
Observation
When we open the left eye, we can see the star again.
Explanation
Since our eyes are located near each other in front of our heads, the area that each eye
covers (called the visual field) overlap. Each eye sees an object from a slightly different angle. The image made in the left eye is thus slightly different at the one made in the right eye. When both eyes function, the
visual cortex of the brain interprets and integrates the information from each eye. The image of the left eye
and that of the right eye are combined together in the brains. The result is a three-dimensional perception of
the object. This knowledge can be found by the students by doing the 3 experiments about the judgement of
distance.
Conclusion
The image formed in the left eye is different at the image formed in the right eye.
Questions
Link the observations and conclusions of the 3 last experiments. With this information, you
should be able to explain how judgment of distance is obtained. (Read the explanation for more information about how judgment of distance is obtained.)
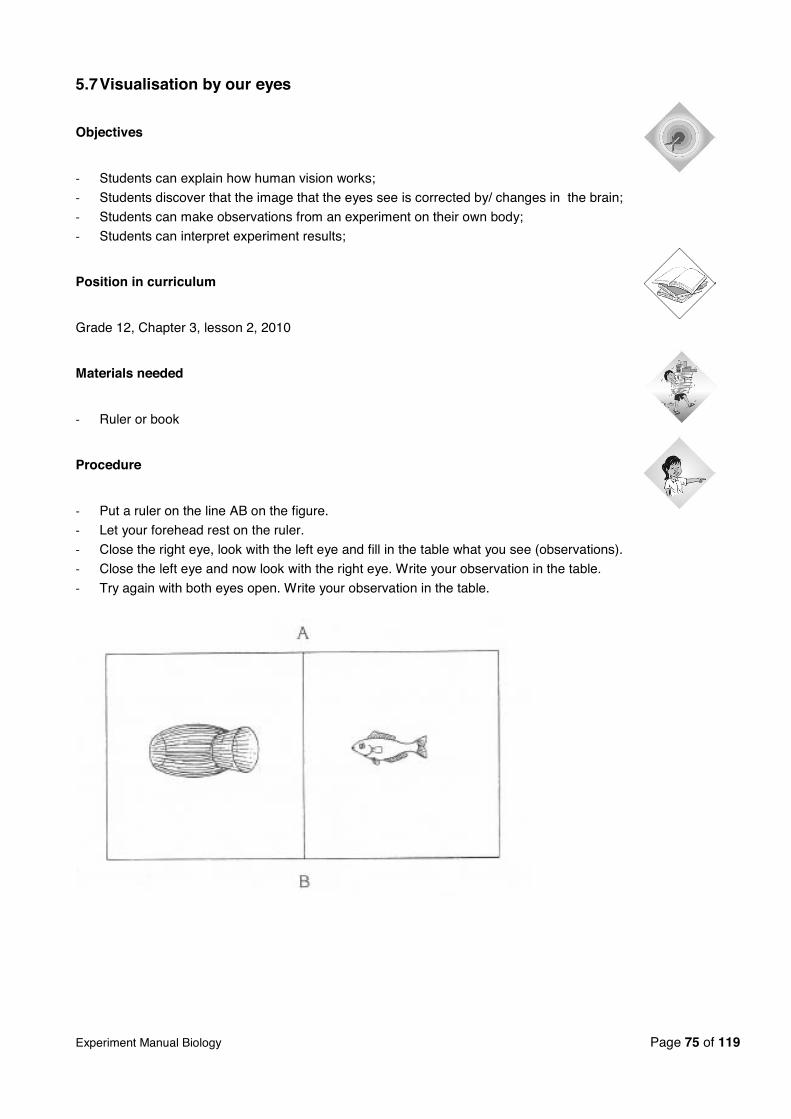
Experiment Manual Biology Page 75 of 119
5.7 Visualisation by our eyes
Objectives
Students can explain how human vision works;
Students discover that the image that the eyes see is corrected by/ changes in the brain;
Students can make observations from an experiment on their own body;
Students can interpret experiment results;
Position in curriculum
Grade 12, Chapter 3, lesson 2, 2010
Materials needed
Ruler or book
Procedure
Put a ruler on the line AB on the figure.
Let your forehead rest on the ruler.
Close the right eye, look with the left eye and fill in the table what you see (observations).
Close the left eye and now look with the right eye. Write your observation in the table.
Try again with both eyes open. Write your observation in the table.

Experiment Manual Biology Page 76 of 119
Observation
Left eye We see a fish pot
Right eye We see a fish
Both eyes We see a fish in a fish pot
Explanation
Since our eyes are located near each other in front of our heads, the area that each eye covers (called the
visual field) overlap. Each eye sees an object from a slightly different angle. When both eyes function, the
visual cortex of the brain interprets and integrates the information from each eye. The image of the left eye
and that of the right eye are combined together in the brains. The result is a three-dimensional perception of the object. The objective of this experiment is to discover that the images of both eyes merge in the brain.
Conclusion
The image we see with our two eyes together is different of the image seen with the left and
right eye separately. The image formed in the left eye and the one formed in the right eye are combined
together in the brain, generating a three-dimensional image, allowing us to estimate distances quite
accurately.

Experiment Manual Biology Page 77 of 119
5.8 Advantage of having two eyes
Objectives
Students can explain how human vision works;
Students discover that the advantage of seeing with 2 eyes is judgment of distance;
Students can interpret experiment results;
Position in curriculum
Grade 12, chapter 3, lesson 2, 2010
Materials needed
Two ballpoints
Procedure
Close one eye.
Hold in each hand a ballpoint and stretch both arms before you.
Move both ballpoints towards each other and try to let the two points touch with each other.
Try this again with both eyes open.
Observation
It is easier to touch with the two points correctly if we use both eyes.
Explanation
Since our eyes are located near each other in front of our heads, the area that each eye covers (called the
visual field) overlaps. Each eye sees an object from a slightly different angle (called parallax). When both
eyes function, the visual cortex of the brain interprets and integrates the information from each eye. The
image of the left eye and that of the right eye are combined together in the brains. The result is a three-
dimensional perception of the object. The objective of this experiment is to let students discover that the advantage of seeing with 2 eyes is the judgment of distance.
Conclusion
We can judge distance when we look with two eyes. We call this judgment of distance.

Experiment Manual Biology Page 78 of 119
5.9 Judgment of distance
Objectives
Students will enable to know about the sensitivity of the eye and without eye to judge on the same objects.
Students recognize the importance of two eyes in the assessment of distances.
Position in curriculum
Grade 12, Chapter 3, lesson 2, 2010
Materials needed
- Board of polystyrene or cardboard
- Fine felt-tip pen
- 6 pins with head (8cm height) in different colours (e.g. toothpicks with flags)
Procedure
- Work in teams of two, an experimenter and a subject.
- Use a fine felt-tip pen to mark out grids on the board (see figure).
- Make little holes on the intersections and remove the grid lines.
- The experimenter, without allowing the subject to watch, sticks the coloured pins upright into the marked block. Each pin is placed at an intersection of the lines so that no two pins are on the same line whether the block is viewed from the side or the front (See Figure). Avoid making a regular pattern as far as possible.
- The subject closes one eye and keeps it closed.
- The experimenter passes the block to the subject, tilting the block away from the subject so that he/she cannot see the marked grid. The subject holds the block quite steady about 30 cm away, tilted so that he or she can see the front edge of the block and the pins but not the marked grid on the top of the block or either of its sides.
- The subject now calls out the colours of the pins, in order from the front to the back and the experimenter writes this down.
- Still holding the block in the same position, the subject opens both eyes and calls out the order of the pins again from front to back.
- The correct answers are marked.
- The experimenter changes the position of the pins and the experiment is repeated twice more.
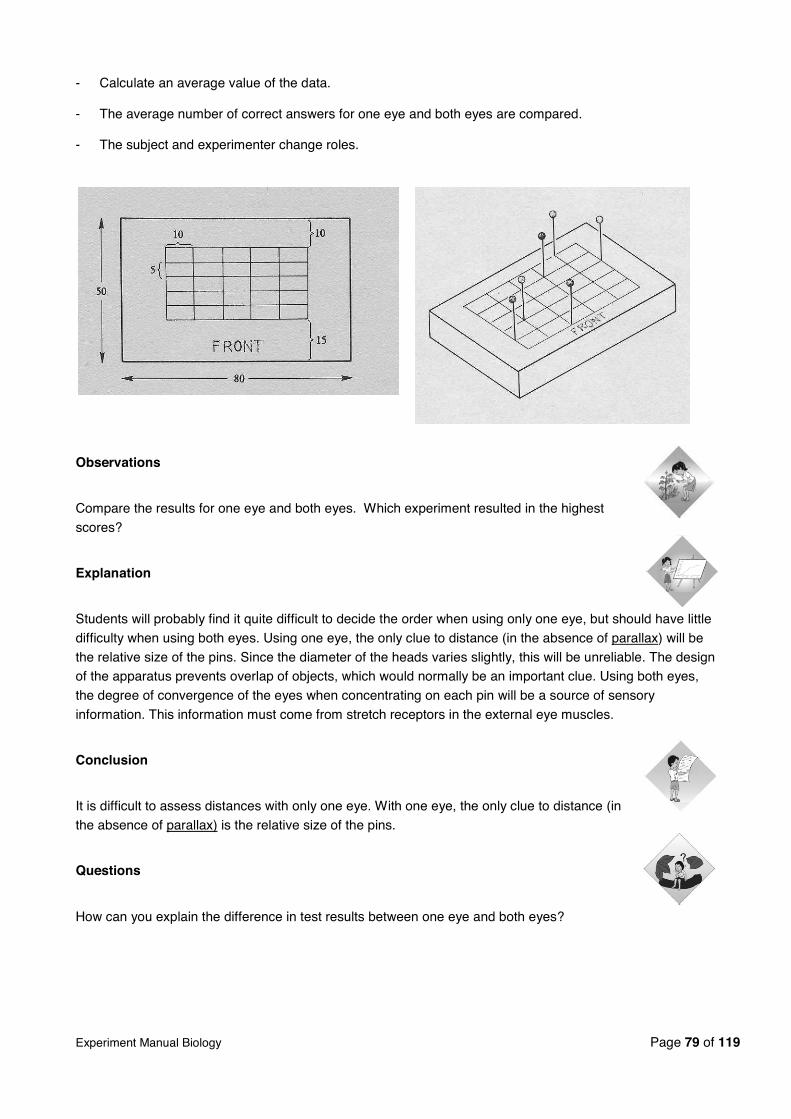
Experiment Manual Biology Page 79 of 119
- Calculate an average value of the data.
- The average number of correct answers for one eye and both eyes are compared.
- The subject and experimenter change roles.
Observations
Compare the results for one eye and both eyes. Which experiment resulted in the highest
scores?
Explanation
Students will probably find it quite difficult to decide the order when using only one eye, but should have little
difficulty when using both eyes. Using one eye, the only clue to distance (in the absence of parallax) will be
the relative size of the pins. Since the diameter of the heads varies slightly, this will be unreliable. The design of the apparatus prevents overlap of objects, which would normally be an important clue. Using both eyes,
the degree of convergence of the eyes when concentrating on each pin will be a source of sensory
information. This information must come from stretch receptors in the external eye muscles.
Conclusion
It is difficult to assess distances with only one eye. With one eye, the only clue to distance (in
the absence of parallax) is the relative size of the pins.
Questions
How can you explain the difference in test results between one eye and both eyes?

Experiment Manual Biology Page 80 of 119
5.10 We see with our eyes... and our brain
Objectives
- Students understand that what we see is determined by the brain, not only by the eye.
Position in curriculum
Grade 12, chapter 3, lesson 2, 2010
Materials needed
Four large sheets of white paper
Pieces of bright red, blue and green card
Scissors
Glue
A black marker pen
Procedure
Draw a fishbowl on one of the large sheets of white paper with the black pen.
Cut out three identical fish shapes (large ones, but smaller than the bowl you have drawn) from the three coloured pieces of card.
Use the glue to stick these to the three remaining sheets of white paper, one on each.
Hang all four sheets of paper on the wall of a bright room.
Stare at the red fish for about 30 seconds, then stare at the fishbowl. What do you see?
Look away, let your eyes return to normal and repeat what you have just done with the green fish.
Repeat again with the blue fish.

Experiment Manual Biology Page 81 of 119
Observations
You should see a green-blue fish in the bowl.
You should see a reddish-blue fish in the bowl.
You should see a yellow fish in the bowl.
Explanation
Sometimes you can see something which is no longer there and see it in a different colour!
The retina of the eye is covered with light-sensitive cells called rods and cones. The rods, of which there are
more than 100 million, pick up on shading and levels of light and dark, while the cones register colour. There
are fewer cones than rods, only around 7 million, but they are concentrated especially in the central area of the retina known as the fovea. There are three types of cones, each sensitive to a different range of colour:
red, green or blue.
The images you see in the bowl after staring at the fish are afterimages. The afterimage is due to the nerve
cells in the eye that process the signals from cone cells. When they keep receiving a red signal from the cones, they start to adapt by turning down the ʻvolumeʼ of the signal they send to the brain. When we look
away from the image the red signal from this part of the eye stays muted for a while. However, the blue and
green signals are sent at the normal ʻvolumeʼ. Your brain doesnʼt appreciate that the red signal has been
turned down and interprets this as a normal signal from your eyes. This means that the fish-shaped patch from which the red signal is reduced, is perceived as a genuine object in your field of vision, leading to the
afterimage which persists even when the object has been removed.
Normally the eye reacts to this by shifting slightly, so the cones are not constantly exposed to the same
image and there is no desensitisation. However, if the image is large enough (like the fish), the small eye movements are not enough to neutralise the effect.
Conclusion
The retina of the eye is covered with light-sensitive cells called rods and cones. Nerve cells in the eye
process the signals from the rod and cone cells. The image that we actually ʻseeʼ has thus been processed
by the brain. Some experiments can therefore make us ʻseeʼ things that are not there.

Experiment Manual Biology Page 82 of 119
Questions
1. Why do the afterimages appear in a different colour from the one you were looking at? When you stare at the red fish, the image fall onto one region of your retina and the cells
responding to red become desensitised. So, when you turn to look at the fishbowl on the white paper, the
red-sensitive cells donʼt respond as strongly as normal to the red part of the light that is reflected back from
the white surface, but the ones that are sensitive to blue and green light do. Thatʼs why you see a green-
blue fish.
2. Why donʼt we perceive this effect in daily life?In daily life continuous small eye movements prevent the cones from being fixed on the same object for a
long time.

Experiment Manual Biology Page 83 of 119
6. Experiments about the sensory system
6.1 Sensitivity of human senses to temperature
Objectives
Students can identify the effects of different temperatures on the sensitivity of the nerve system.
Students can explain how the human sensory system measures temperature changes rather than actual temperatures.
Position in curriculum
Grade 12, chapter 3, lesson 2, 2010
Materials needed
A supply of hot and cold water ;
3 jars or beakers large enough to put a finger in;
Thermometer (optional).
Procedure
Collect three jars or beakers of about the same size. Fill one with cold water (10 -15°C), one with hot water (40-50°C) and the third with warm water (about 25 °C).
Place the first finger of the left hand in the cold water and the first finger of the right hand in the hot water. Leave both fingers immersed for at least one minute.
After one minute, remove both fingers from the jars and dip them repeatedly but alternately in the warm water for about a second at a time. Notice the temperature sensation in each finger.

Experiment Manual Biology Page 84 of 119
Observations
What impression did the left finger and the right finger give about the temperature of the warm water? The finger which has been immersed in cold water will register warmth. The finger previously held in hot
water will register coldness.
Explanation
The experiment shows that the thermo-receptors of the human body respond to changes in
temperature rather than to any particular temperature. In fact, there is a steady stream of nerve impulses
from cold and warmth receptors at all temperatures within certain limits. Sudden changes of temperature cause increased bursts of impulses.
In the experiment the difference in sensations can be attributed to the difference in the temperature of the
fingers after one minute's immersion. This can be tested by repeating the experiment with the left-hand finger
in the hot water and the right-hand finger in the cold water. The sensation on dipping them both into warm water should be the reverse of the first experiment. An alternative explanation is that the warmth receptors
in the hot water become adapted, i.e. after prolonged immersion they no longer send impulses to the brain.
Consequently, on transfer to lukewarm water, there are few impulses sent to the brain from the warmth
receptors of this finger, whereas the warmth receptors in the cold finger fire normally.
The results illustrate that the fingers detect whether they are gaining or losing heat rather than the actual
temperature of an object. Similarly, metal objects at room temperature will feel cold to the touch because
heat is conducted away from the fingers, while wooden objects at the same temperature feel
less cold.
Conclusion
The thermo-receptors of the human body respond to changes in temperature rather than to any particular
temperature.
Questions
1. Why should there be any difference in the sensory information from the two fingers? How
could you modify the experiment to test your suggestion?
2. Does the result mean that the skin of your fingers is incapable of judging whether an object is hot or cold?
3. What does the result suggest about the way in which the skin responds to temperature?

Experiment Manual Biology Page 85 of 119
6.2 Sensation of touch receptor by stimuli
Objectives
Students understand the functioning of the human sensory system.
Students can explain that not every part of the human body has the same sensitivity to sensory stimuli.
Students can perform an experiment to test the sensitivity of areas of the human skin.
Position in curriculum
Grade 12, Chapter 3, lesson 2, 2010
Materials needed
two sharp pointers, such as toothpicks
paper to keep track of results
Procedure
There are two or three people in each team:
- the experimenter who applies the stimuli,
- the subject who receives and reports on the stimulus,
- a recorder who notes the subject's responses. If there is no third person the experimenter must keep a record of the results.
The objective is to determine the minimum distance apart for two simultaneous touch stimuli to be recognized as two sensations rather than one; the subject must not know in advance whether he or she is to
receive one or two stimuli.

Experiment Manual Biology Page 86 of 119
Observations
The experimenter draws up a table and, without showing the subject, writes down a programme of 5 single and 5 double stimuli, randomly distributed. An example is shown below.
The subject closes his/her eyes or turns his/her head so that he/she cannot see the stimulus being applied.
The experimenter makes sure that the two “pointers” are exactly 10 mm apart. He or she then presses the pointer carefully on to the skin on the back of the subject's hand, observing the procedure given below:
- Each stimulus should last for about half a second. Do not merely touch the skin.
- For the double stimulus, both wires must touch the skin simultaneously.
- The stimuli are applied at random over the whole area of the back of the hand.
After each stimulus, the subject must say 'one' or 'two' according to how many stimuli he or she thought they could feel and it is noted in the table how many stimuli were correctly recognized. After 10 stimuli, the correct
responses are added up.
Next, the experiment can be repeated as follows:
- Change the distance between the pointers, for example 5mm.
- Repeat the experiment on another location, such as the tip of the finger (treating all four finger-tips as the test area).
Explanation
The feeling of only one stimulus when two are applied can be explained as follows:
(a) Only one point touches a receptor. It is unlikely that, on the back of the hand, a pressure on the skin will not affect at least one receptor.
(b) Both points touch receptors which feed impulses into only one nerve fibre. A single sensory fibre may receive branches from sensory endings covering a region of several square millimetres.
(c) There are two receptors and two sensory fibres but they cannot be discriminated by the brain. Various sensory systems are associated with greater or lesser areas in the brain and the analytic capabilities of the cortex are more limited for some receptors than for others.
Gap
betwe
en
points
AREA
TESTED …………………………………………………………………...
Total
correct
10mm
type of
stimulus 2 1 2 2 1 2 1 2 1 1
mmsubjectʼs
response

Experiment Manual Biology Page 87 of 119
Conclusion
The touch receptors on the human body and their connections to nerves are not distributed evenly across the human body. Fingertips have a much higher density of receptors and connections than the back of the
hand or the skin of the back. The higher the density of receptors and connectors the more
sensitive that part of the human body is for sensory stimuli.
Questions
1. For each region tested, what were the minimum distances between the points which could still be recognized as separate stimuli?
2. What could be the reasons for the different spatial sensitivity of some regions? The explanations should consider the distribution and density of touch receptors and their possible connections to nerves.
Experiment Manual Biology Page 88 of 119
6.3 Reaction time in seeing the object
Objectives
- Students can explain the functioning of the sensory system;
- Students can perform an experiment involving multiple measurements and calculate an average value.
- Students can explain why there is no difference in reaction time between the two experiments.
Position in curriculum
Grade 12, Chapter 3, lesson 2, 2010
Materials needed
- 50 cm ruler
- Stopwatch
- Pen/pencil
Procedure
It is necessary to work in pairs for this experiment.
The subject marks a pencil line down the centre of his thumb-nail and sits sideways at a bench or table with the forearm resting flat on the bench and the hand over the edge (See Figure).
The experimenter holds a ruler vertically between the subject's first finger and thumb with the zero opposite the line on the thumb but not quite touching either the thumb or fingers.
The subject watches the zero mark and, as soon as the experimenter releases the ruler, the subject grips it between finger and thumb to stop it falling any further. The distance on the ruler opposite the mark on the thumb is recorded in an observation table.
This is repeated 4 times and the average distance calculated.
The experiment is then repeated with the same subject but this time the subject lets the ruler rest lightly against the thumb or fingers, with closed eyes, and grips the ruler as quickly as possible after he or she feels it begin to fall.
The experiment is repeated 4 times and the results are recorded in an observation table. Calculate the average distance again.
The speed of the subject's reaction is a function of the distance the ruler falls before it is stopped.

Experiment Manual Biology Page 89 of 119
Explanation
The experiment compares reaction times from the eyes to the brain and from the fingertips to the brain. The
shorter sensory pathway from eyes to brain might lead one to expect a reduced reaction time. However, the
average class results will probably not show any significant difference. The main reason is that the speed of conduction is so rapid that very large differences in distance would be needed to produce a measurable
difference in reaction time by our crude methods. Other possibilities are that touch receptors respond more
rapidly than the retinal (eye) receptors and so compensate for the longer nervous pathway to be traversed.
Finally, the reaction time is also influenced by other factors than the speed of conduction of nervous
impulses, particularly the time taken for the muscles to contract on receiving an impulse.
Table
Speed of response to sight Speed of response to touch
1 1
2 2
3 3
4 4
Total Total
Average Average
Subjectʼs forearm
rests on bench
Experiment
Mark on your thumb
nail

Experiment Manual Biology Page 90 of 119
Conclusion
There is not a significant difference in reaction time from the eyes to the brain and the fingertips to the brain. Conduction speeds are so high that the small difference in distance can
be neglected.
Questions
1. Was there a significant difference in reaction times using sight and touch (a) for your own results, (b) for the class results when averaged?
2. What differences in results did you expect?
3. Did the class results fulfil this expectation? If they did not, discuss possible reasons for this.

Experiment Manual Biology Page 91 of 119
6.4 Eye – and hand coordination
Objectives
Students can explain the importance of sensory and motor co-ordination in daily life;
Students can perform an experiment to test the importance of sensory and motor co-ordination in daily life;
Students can process the experiment results in a graph;
Students can interpret experiment results.
Introduction
The experiment is a reminder of how much sensory and motor co-ordination we have had to
learn and now take for granted. This experiment can also be used to develop the studentsʼ data gathering and graph constructing skills.
Position in curriculum
Grade 12, Chapter 3, lesson 2, 2010
Materials needed
Small mirror (15 x 15 cm)
Paper with picture of the star
Pencil
Two books or wooden block (to support the mirror)
Stopwatch
Book or piece of paper (to prevent the view on the drawing)
Procedure
It is best to work in pairs; a subject to conduct the trials and an observer to time them. It is
possible, however, to do the experiment on your own. If there is no clamp stand available the observer can
hold the cardboard to prevent the subject to see the ʻstarʼ directly.
Place the mirror vertically and support it, if necessary, with a clamp or book placed behind it.
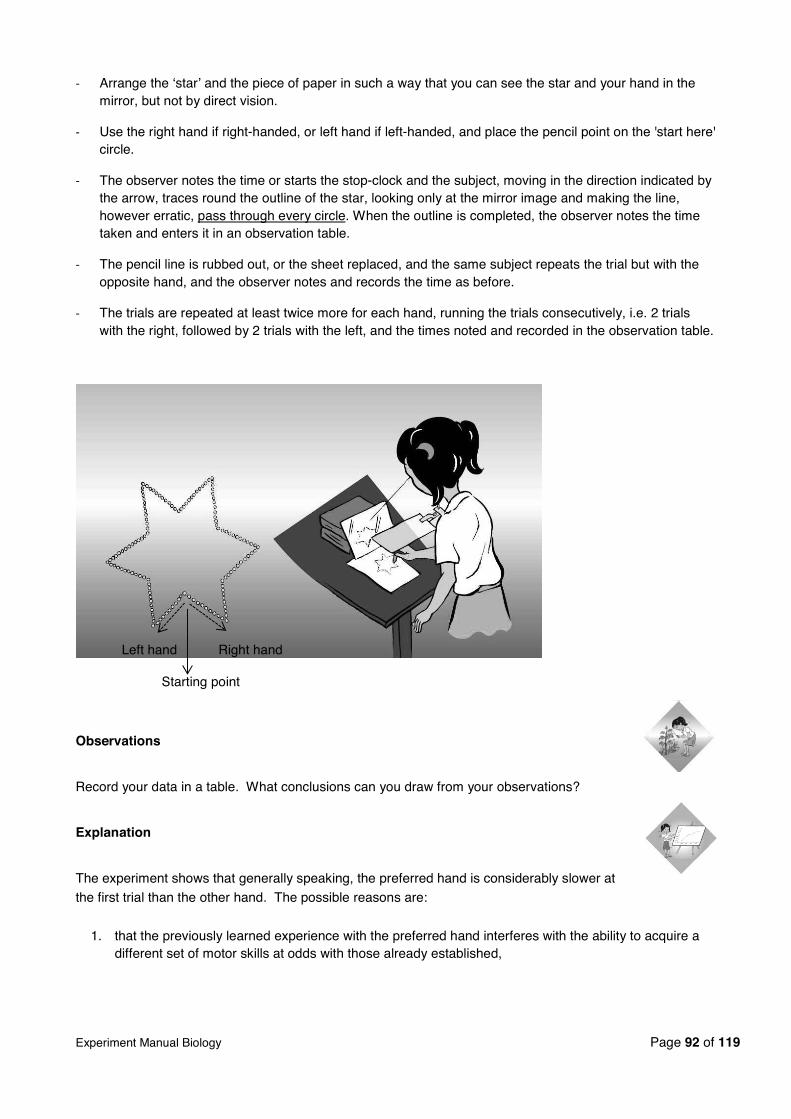
Experiment Manual Biology Page 92 of 119
Arrange the ʻstarʼ and the piece of paper in such a way that you can see the star and your hand in the mirror, but not by direct vision.
Use the right hand if right-handed, or left hand if left-handed, and place the pencil point on the 'start here' circle.
The observer notes the time or starts the stop-clock and the subject, moving in the direction indicated by the arrow, traces round the outline of the star, looking only at the mirror image and making the line, however erratic, pass through every circle. When the outline is completed, the observer notes the time taken and enters it in an observation table.
The pencil line is rubbed out, or the sheet replaced, and the same subject repeats the trial but with the opposite hand, and the observer notes and records the time as before.
The trials are repeated at least twice more for each hand, running the trials consecutively, i.e. 2 trials with the right, followed by 2 trials with the left, and the times noted and recorded in the observation table.
Observations
Record your data in a table. What conclusions can you draw from your observations?
Explanation
The experiment shows that generally speaking, the preferred hand is considerably slower at
the first trial than the other hand. The possible reasons are:
1. that the previously learned experience with the preferred hand interferes with the ability to acquire a different set of motor skills at odds with those already established,
Left hand Right hand
Starting point

Experiment Manual Biology Page 93 of 119
2. that since the preferred hand is tested first, the other hand is benefiting from that first trial, i.e. there is some transfer of the newly tried skill from, say, the right to the left hand.
The best way to study the results, if there are enough of them, would be to plot a graph (see figure). There
is usually a marked improvement in performance with both hands even after only 2 or 3 trials but the improvement with the preferred hand is usually more spectacular, since it is initially so much slower than the
other. On average, the time for the second trial with the preferred hand will be about 40% less than that for
the first. The other hand shows less improvement so that by about the third trial there is little difference in the
times.
Conclusion
The experiment shows that generally speaking, the preferred hand is considerably slower at the first trial
than the other hand. After a few trials though, both hands do the experiment in approx. identical times.
Questions
1. Considering only the times for the first trial of each hand, does there appear to be a significant difference between them?
2. Suggest possible explanations for any differences.
3. As the trials proceeded, was there a decrease in the time taken to complete them? If so, was there a difference in the rate of improvement for the different hands?
4. Two explanations can be given for the results (see background information). Can you think of any way to test the validity of both explanations?
Time
Number of trials
Right hand
Left hand
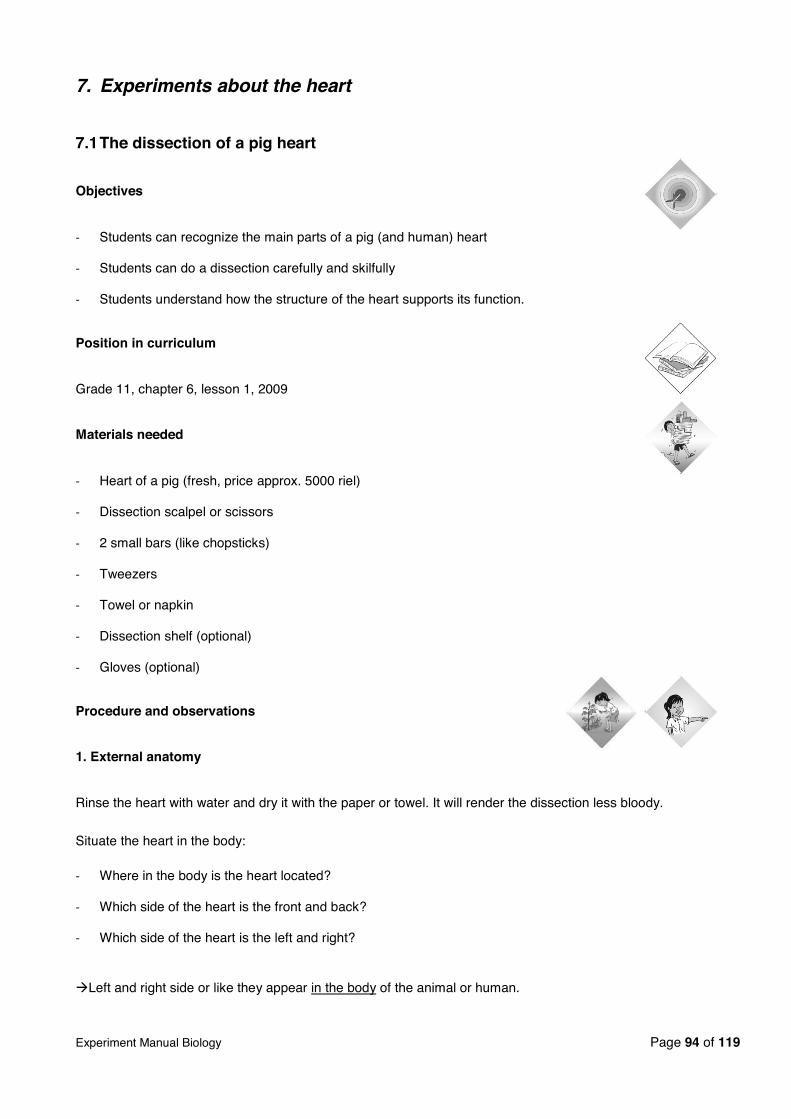
Experiment Manual Biology Page 94 of 119
7. Experiments about the heart
7.1 The dissection of a pig heart
Objectives
Students can recognize the main parts of a pig (and human) heart
Students can do a dissection carefully and skilfully
Students understand how the structure of the heart supports its function.
Position in curriculum
Grade 11, chapter 6, lesson 1, 2009
Materials needed
Heart of a pig (fresh, price approx. 5000 riel)
Dissection scalpel or scissors
2 small bars (like chopsticks)
Tweezers
Towel or napkin
Dissection shelf (optional)
Gloves (optional)
Procedure and observations
1. External anatomy
Rinse the heart with water and dry it with the paper or towel. It will render the dissection less bloody.
Situate the heart in the body:
Where in the body is the heart located?
Which side of the heart is the front and back?
Which side of the heart is the left and right?
Left and right side or like they appear in the body of the animal or human.

Experiment Manual Biology Page 95 of 119
Make following observations:
Lay down the heart with the front site in your direction. You recognize the front site by the beige line that goes from left above to right under. This line is the connective tissue. Observe the veins from the heart
near the surface and the coronary arteries that lie deeper. The connective tissue forms also the division
between the 2 ventricles. The coronary arteries give the heart oxygen and nutrients, whereas the veins
remove the waste materials.
The connective tissue passes round the heart, right under the atria. At the back site of the hearth, the connective tissue goes almost straight to the heart point.
Indicate the 2 atria and the 2 ventricles.
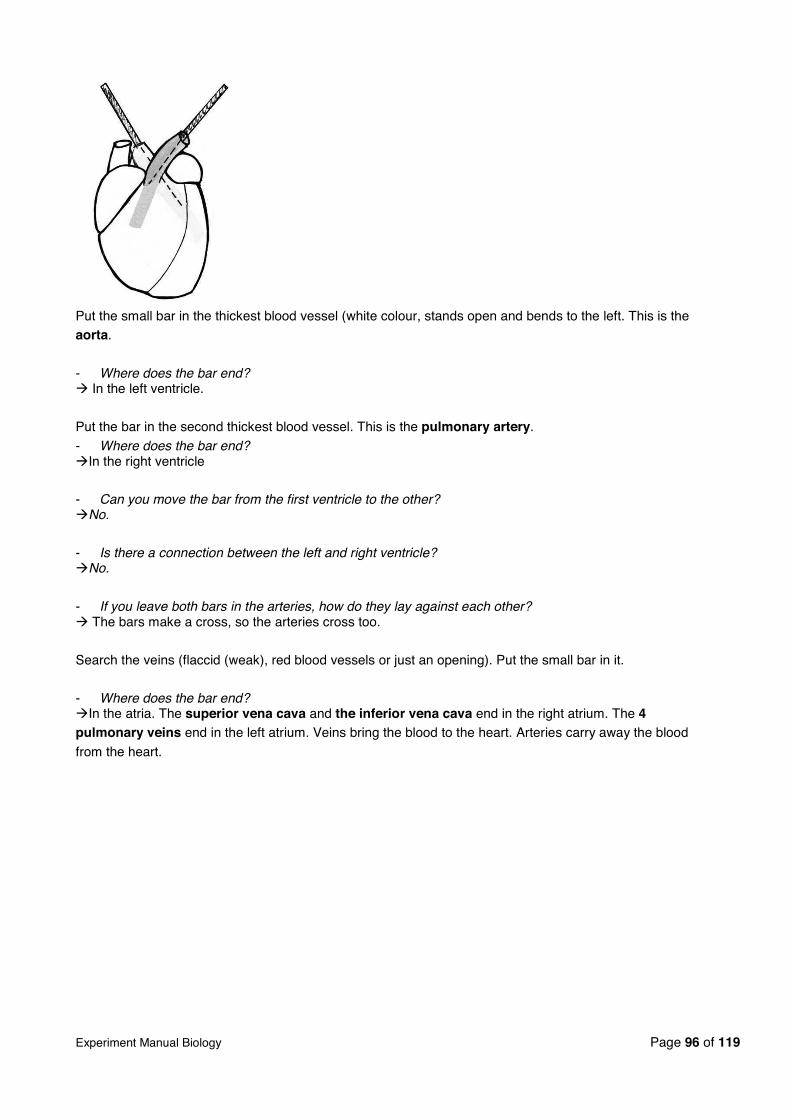
Experiment Manual Biology Page 96 of 119
Put the small bar in the thickest blood vessel (white colour, stands open and bends to the left. This is the aorta.
- Where does the bar end? In the left ventricle.
Put the bar in the second thickest blood vessel. This is the pulmonary artery.
- Where does the bar end? In the right ventricle
- Can you move the bar from the first ventricle to the other? No.
- Is there a connection between the left and right ventricle? No.
- If you leave both bars in the arteries, how do they lay against each other? The bars make a cross, so the arteries cross too.
Search the veins (flaccid (weak), red blood vessels or just an opening). Put the small bar in it.
- Where does the bar end? In the atria. The superior vena cava and the inferior vena cava end in the right atrium. The 4
pulmonary veins end in the left atrium. Veins bring the blood to the heart. Arteries carry away the blood
from the heart.
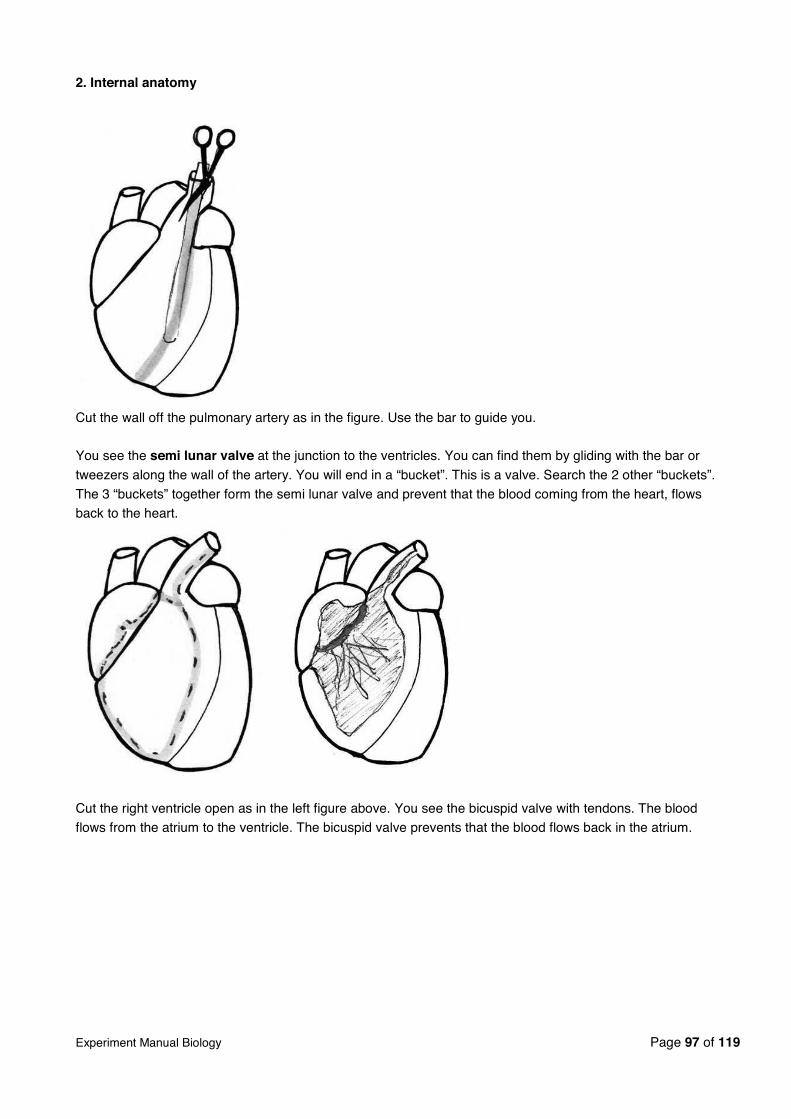
Experiment Manual Biology Page 97 of 119
2. Internal anatomy
Cut the wall off the pulmonary artery as in the figure. Use the bar to guide you.
You see the semi lunar valve at the junction to the ventricles. You can find them by gliding with the bar or
tweezers along the wall of the artery. You will end in a “bucket”. This is a valve. Search the 2 other “buckets”.
The 3 “buckets” together form the semi lunar valve and prevent that the blood coming from the heart, flows
back to the heart.
Cut the right ventricle open as in the left figure above. You see the bicuspid valve with tendons. The blood
flows from the atrium to the ventricle. The bicuspid valve prevents that the blood flows back in the atrium.
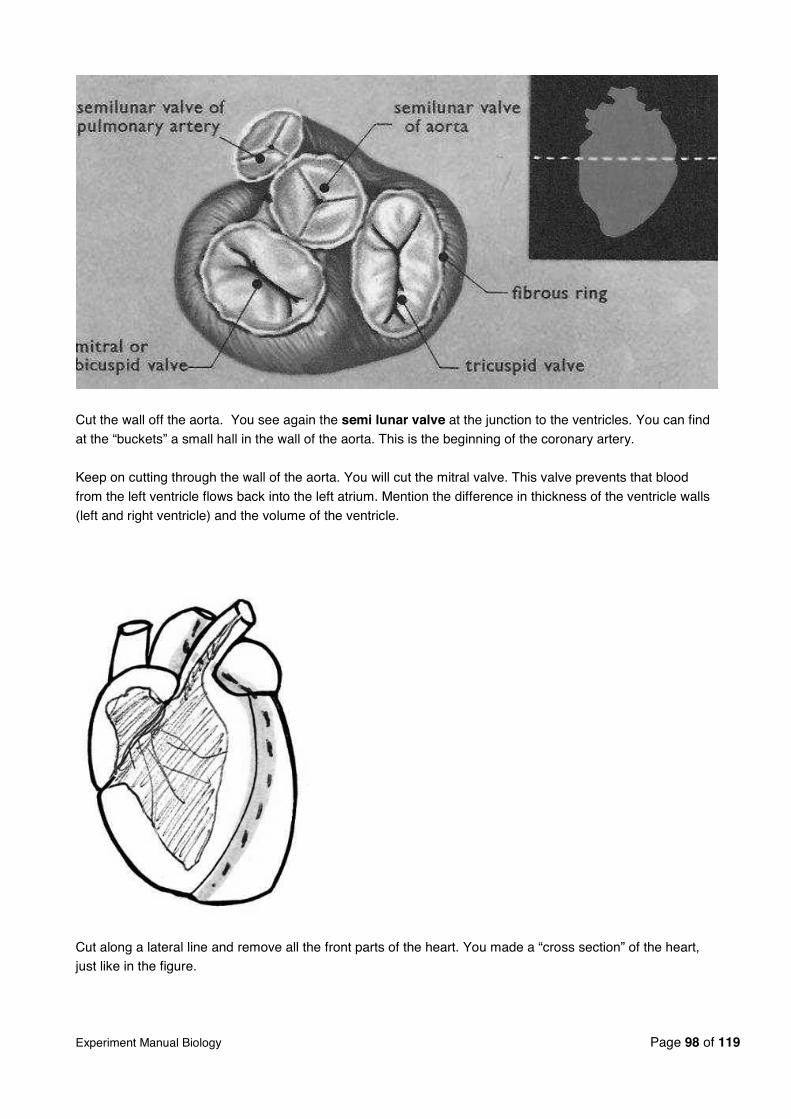
Experiment Manual Biology Page 98 of 119
Cut the wall off the aorta. You see again the semi lunar valve at the junction to the ventricles. You can find
at the “buckets” a small hall in the wall of the aorta. This is the beginning of the coronary artery.
Keep on cutting through the wall of the aorta. You will cut the mitral valve. This valve prevents that blood
from the left ventricle flows back into the left atrium. Mention the difference in thickness of the ventricle walls
(left and right ventricle) and the volume of the ventricle.
Cut along a lateral line and remove all the front parts of the heart. You made a “cross section” of the heart, just like in the figure.
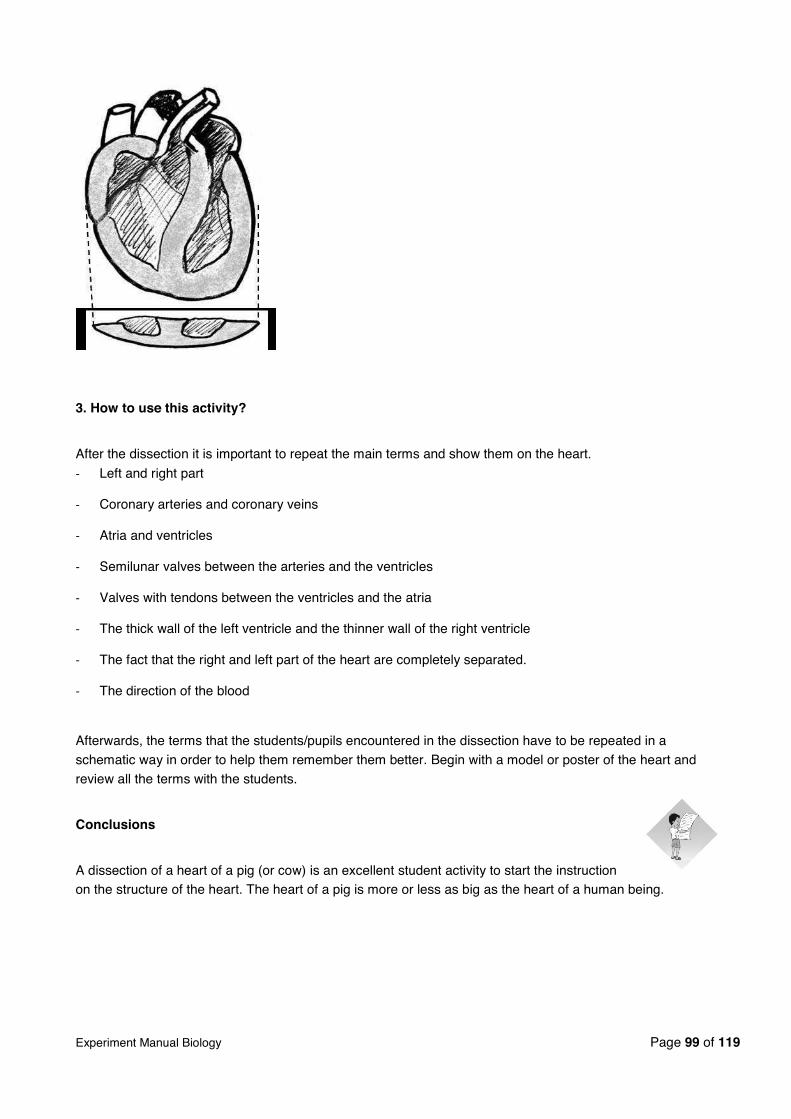
Experiment Manual Biology Page 99 of 119
3. How to use this activity?
After the dissection it is important to repeat the main terms and show them on the heart.
Left and right part
Coronary arteries and coronary veins
Atria and ventricles
Semilunar valves between the arteries and the ventricles
Valves with tendons between the ventricles and the atria
The thick wall of the left ventricle and the thinner wall of the right ventricle
The fact that the right and left part of the heart are completely separated.
The direction of the blood
Afterwards, the terms that the students/pupils encountered in the dissection have to be repeated in a
schematic way in order to help them remember them better. Begin with a model or poster of the heart and
review all the terms with the students.
Conclusions
A dissection of a heart of a pig (or cow) is an excellent student activity to start the instruction on the structure of the heart. The heart of a pig is more or less as big as the heart of a human being.
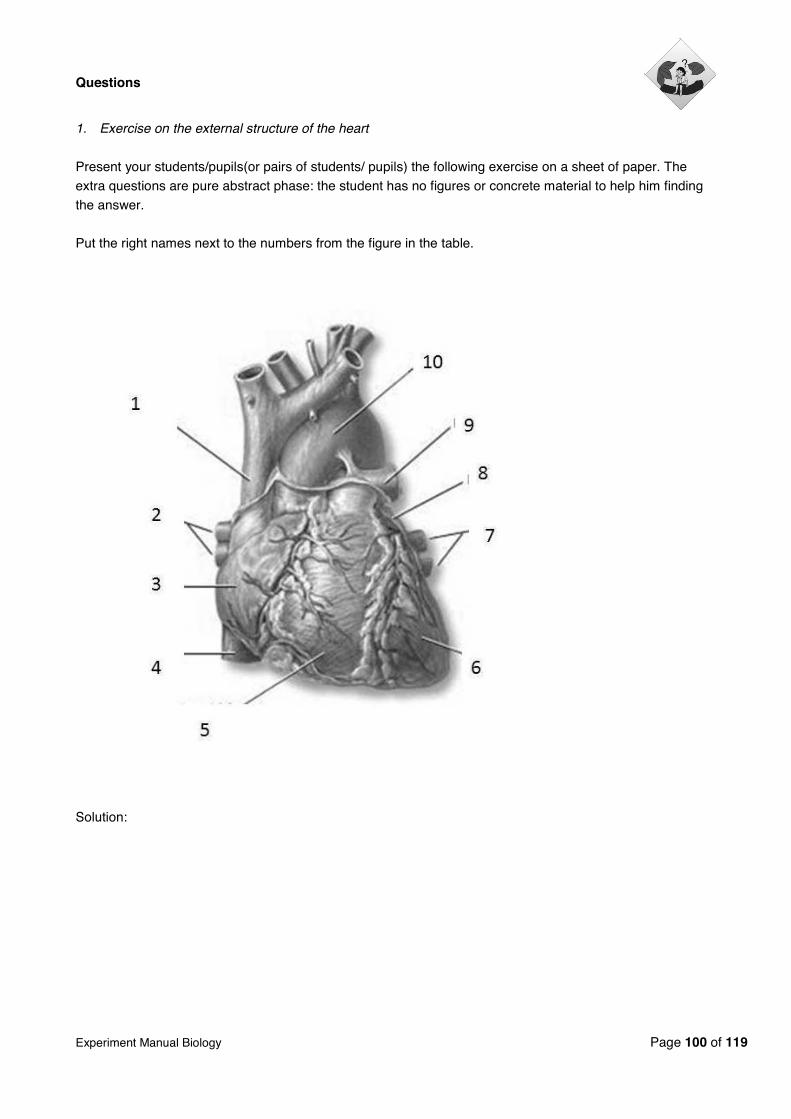
Experiment Manual Biology Page 100 of 119
Questions
1. Exercise on the external structure of the heart
Present your students/pupils(or pairs of students/ pupils) the following exercise on a sheet of paper. The
extra questions are pure abstract phase: the student has no figures or concrete material to help him finding
the answer.
Put the right names next to the numbers from the figure in the table.
Solution:

Experiment Manual Biology Page 101 of 119
Source: http://www.nlm.nih.gov/medlineplus/ency/imagepages/1056.htm
- Which blood vessels give the heart muscle nutrients?
- Which blood vessels drain off the waste materials from the heart muscle?
Colour the figure:
- The left atrium in pale red
- The right atrium in pale blue - The left ventricle in dark red
- The right ventricle in dark blue

Experiment Manual Biology Page 102 of 119
2. Exercise on the internal anatomy of the heart?
Put the right names next to the numbers from the figure in the table.

Experiment Manual Biology Page 103 of 119
Solution
Source of figures: http://www.nlm.nih.gov/medlineplus/ency/imagepages/1056.htm
What is the function of the valves?
Which ventricle is most muscular?
What will be the consequence of that?

Experiment Manual Biology Page 104 of 119
7.2 Constructing a model of the heart valves
Introduction
This model aims at showing students how valves prevent the blood flowing in the “wrong”
direction in the heart. They should be able to explain the functioning of the atrioventricular valves using a
simple model.
Two pairs of heart valves keep blood flowing in a single direction. The atrioventricular valves are located
between each atrium and ventricle. These thin flaps of tissue move in response to pressure changes that
occur when the ventricle contracts. When the ventricle contracts, the pressure increases. This pushes the flaps upwards and prevents blood from moving back into the atrium.
The semilunar valves consist of three flaps that look like a pocket. The flaps form a ring in the arteries just
outside each ventricle. Blood leaving the ventricle can pass these valves easily. Blood moving backward
toward the ventricle, fills these pockets and causes the valves to bulge. This prevents the blood from flowing back.
Objectives
Students can explain the functions of the heart valves.
Students can make and use heart valves.
Position in curriculum
Grade 11, chapter 6, lesson 1, 2009
Materials needed
Scissors
A4 paper
Coffee filters

Experiment Manual Biology Page 105 of 119
Description and use of the model
The model shows the function of the semi lunar valves. Stick two sheets of paper to form a tube (represents the artery). Stick at this tube tree times one side of three coffee filters (representing the “pocket” flaps).
The picture shows the use of the model. An arm can only
enter in one direction. In the same way, the blood can also
just flow in that direction, which is away from the heart.
Remark the model of the heart lying on the table. The model is very useful to explain the anatomy of the heart, after the
students did the dissection.
Conclusion
Two pairs of heart valves keep blood flowing in a single direction: the atrioventricular valves .sevlav ranulimes eht dna
Experiment Manual Biology Page 106 of 119
8. Other experiments
8.1 Extraction of DNA
Objectives
Students understand the function of DNA in living organisms;
Students can extract DNA from banana or tomato.
Position in curriculum
Grade 12, chapter 5, lesson 1, 2010
Materials needed
1 Banana or tomato
1 Small plastic bag
1 Plastic bottle (1/2 cut)
1 Plastic bottle
1 Funnel
1 Toothpick or tweezers
1liter of pure drinking water
50ml of cool alcohol
50ml of buffer
Salt
Detergent (or washing liquid)
1 box of paper tissue
1 Test tubes
Procedure
Squash a small piece of banana (2-3 cm) with a fork
Pour 12 ml extraction buffer1 into a ½-cut plastic bottle- this buffer contains salts necessary for the precipitation of the DNA.
Add 3ml detergent which will break open the cells
Add the banana pulp and mix well
Put two layers of paper tissue into a funnel and moisten them with water. Pour the banana mixture into the funnel and, collect the filtrate in a plastic bottle. Throw away the filter paper with the remains of the banana pulp.
Put 1ml of the filtered banana juice into a plastic tube

Experiment Manual Biology Page 107 of 119
Add 1ml of distilled water and mix well
Carefully pour 8 ml cold alcohol down the side of the tube so that the alcohol remains in a layer above the juice
Let the solution sit for 2-3 minutes.
Observations
You can watch DNA precipitate out into the alcohol layer. A white substance will become visible at the
interface where the two liquids meet. This is the DNA.
If the experiment is successful there will be enough DNA to be lifted out of the tube with a toothpick or
tweezers.

Experiment Manual Biology Page 108 of 119
Explanation
Cells store and use information to guide their functions. The genetic information stored in DNA is used to direct the synthesis of the thousands of proteins that each cell requires. In all organisms, the
instructions for specifying the characteristics of the organism are carried in DNA, a large polymer formed
from subunits of four kinds (A, G, C, and T). The chemical and structural properties of DNA explain how the
genetic information that underlies heredity is both encoded in genes (as a string of molecular "letters") and
replicated (by a templating mechanism). Each DNA molecule in a cell forms a single chromosome.
Francis Crick, James Watson and Maurice Wilkins received the Nobel Prize in 1962 for determining the
molecular structure of DNA in1953.
Conclusion
The genetic information stored in DNA within cells is used to direct the synthesis of the thousands of proteins
that each cell requires. In all organisms, instructions for specifying the characteristics of the organism are carried in DNA.
Questions
1. What is the purpose of using salt and detergent in DNA extraction?
2. What does the cool alcohol function?
3. What happens when alcohol is added to the filtrate of banana juice?
4. Make you observation on the extracted DNA in the tube containing alcohol.
Experiment Manual Biology Page 109 of 119
8.2 What is the effect of a solution on bacteria growth?
Objectives
Students can explain how bacteria can live.
Students can relate the growth of bacteria to the presence of different nutrients.
Students can describe characteristics of bacteria.
Position in curriculum
Grade 10, chapter 1, lesson 2, 2008
Materials needed
Water
Carrot
Salt
Sugar
Soap
10 baby plates
Cooking stove
Pot
Procedure
Take some water and add small pieces of carrot. Make sure that the pieces are fully submerged in the water.
Prepare the following solutions in each plate:
Plate 1: add sugar (maximum concentration)
Plate 2: add salt (maximum concentration)
Plate3: add soap (one tea spoon)
Plate4: only water
Plate5: only some pieces of carrot, no water
Cover all the plates
Place all the plates in the sunlight.
Repeat the procedure but put the glasses in a dark space.

Experiment Manual Biology Page 110 of 119
Top (left to right): water, carrot and sugar; water, carrot and salt; water, carrot and soap
Bottom (left to right): water and carrot; carrot.
Observations
Observe the plates after 24 hours.
Observe also the smell of each solution.
Repeat your observations every 2 days.
Samples
Number of days
1 3 5 7
In sunlight
Out of sunlight

Experiment Manual Biology Page 111 of 119
Explanation
Bacteria are all around us. Given good growing conditions, a bacterium grows slightly in size or length, a new cell wall grows through the centre forming two daughter cells, each with the same genetic material as
the parent cell. If environment is optimum, the two daughter cells may divide into four in 20 minutes. Then
why isnʼt the earth covered with bacteria?
The primary reason is that conditions are rarely optimum. Scientists who study bacteria try to create the optimum environment in the lab: a culture medium with the necessary energy source, nutrients, pH, and
temperature, in which bacteria grow predictably.
Bacteria need to feed on something that gives them energy and allows them to grow. These are called nutrients for bacteria. Bacteria can grow on meat, milk and other foods causing a bad odour and diseases for
people who consume bacteria infected food. Since there are different types of bacteria, their needs to the
food may also vary. By knowing the type of food or nutrients that each specific bacteria needs, we can
control the environment in order to stop the growth of unwanted bacteria and promote the growth of bacteria
that we need. Also for bacteria growth experiments in laboratories, good nutrients are the key to a fast and useable result.
Conclusion
Bacteria feed on nutrients that provide them with energy and allow them to grow. By knowing the type of
nutrients each bacteria needs, we can control the environment in order to stop the growth of unwanted
bacteria and promote the growth of bacteria that we need.

Experiment Manual Biology Page 112 of 119
Questions
1. In which solutions do bacteria and fungi grow well? 2. Why does this happen?
3. How can you explain the strong smell in some of the solutions?
4. Do bacteria and fungi need light to grow?
5. Do you think the observed bacteria are producers or consumers? Explain why.
6. Try to think of other solutions to test bacterial growth. Would bacteria grow well in these solutions? 7. You can repeat the experiment, but using boiled water instead of normal water. What results do you
expect?

Experiment Manual Biology Page 113 of 119
8.3 Models for the digestive system
Objectives
Students can explain process of food digestion by using these models
Students can make and use these models
Students can keep their digestive system healthy
Position in curriculum
Grade 7, chapter 4, lesson 3, 2009
Grade 11, chapter 4, lesson 2, 2009
1. Cube model for surface area
Background knowledge
This model illustrates the role the teeth play in the digestive system. By cutting the food in small parts they
increase the surface of the food particles.
The teeth tear food into small pieces and increase the surface area available for chemical digestion.
Description and use of the model
Make several cubes of the same size. Lay the cubes together to form a big cube (photo left). This big cube represents a food bite (for example: 1 piece of meat). After a time of biting, the big piece of meat will change
in a few smaller pieces of meat, shown by the small cubes (photo right). The total surface of all the small
cubes is higher than the surface of the big cube.

Experiment Manual Biology Page 114 of 119
2. Model peristaltic movement
Background knowledge
The digestive tract consists of a cavity (tube), a mucous membrane and 2 layers of muscles. The circular
muscles of the inner layer circle the tube and constrict the tube when they contract. The longitudinal muscles
in the outer layer run lengthwise and shorten and open the tube when they contract. Waves of contraction are called peristalsis and push the food through the digestive tract.
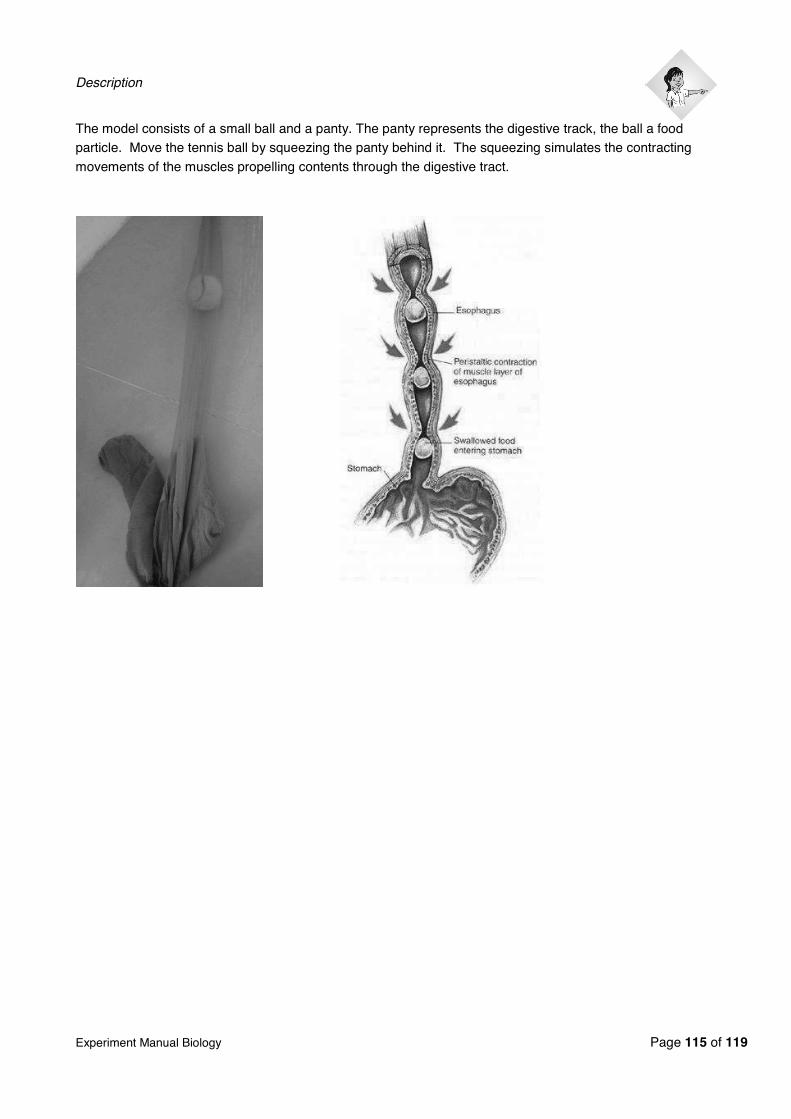
Experiment Manual Biology Page 115 of 119
Description
The model consists of a small ball and a panty. The panty represents the digestive track, the ball a food particle. Move the tennis ball by squeezing the panty behind it. The squeezing simulates the contracting
movements of the muscles propelling contents through the digestive tract.
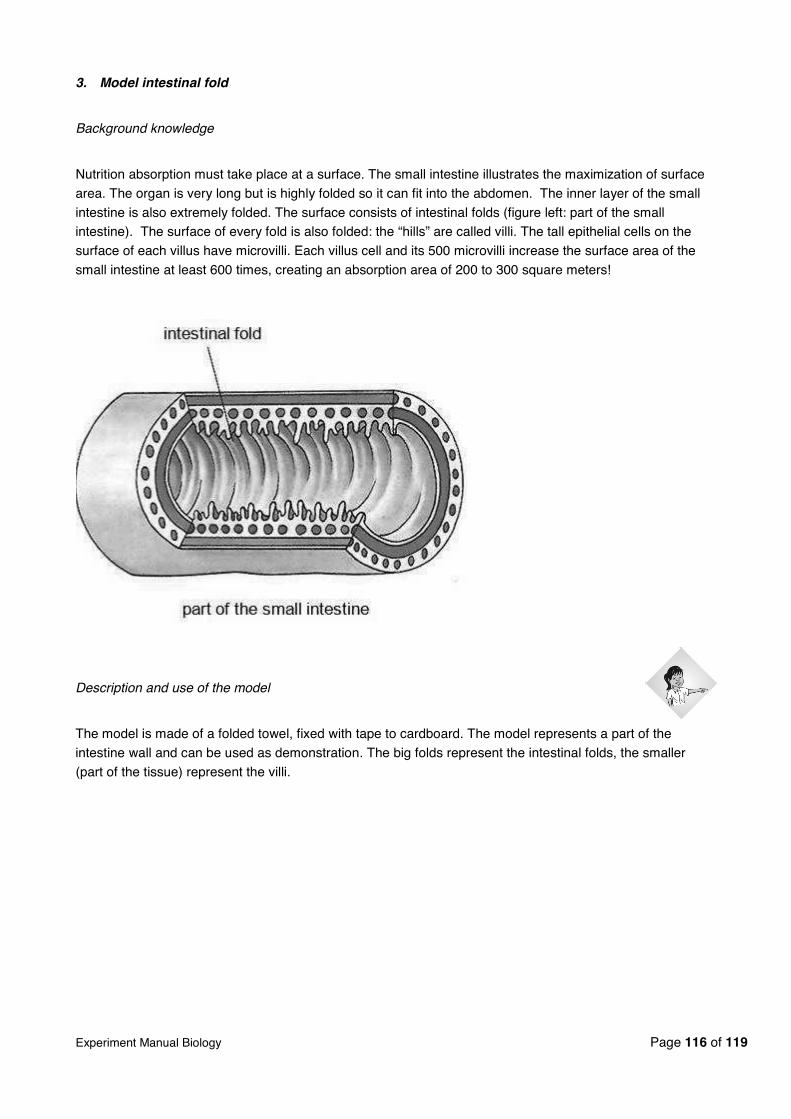
Experiment Manual Biology Page 116 of 119
3. Model intestinal fold
Background knowledge
Nutrition absorption must take place at a surface. The small intestine illustrates the maximization of surface
area. The organ is very long but is highly folded so it can fit into the abdomen. The inner layer of the small
intestine is also extremely folded. The surface consists of intestinal folds (figure left: part of the small intestine). The surface of every fold is also folded: the “hills” are called villi. The tall epithelial cells on the
surface of each villus have microvilli. Each villus cell and its 500 microvilli increase the surface area of the
small intestine at least 600 times, creating an absorption area of 200 to 300 square meters!
Description and use of the model
The model is made of a folded towel, fixed with tape to cardboard. The model represents a part of the
intestine wall and can be used as demonstration. The big folds represent the intestinal folds, the smaller
(part of the tissue) represent the villi.

Experiment Manual Biology Page 117 of 119
Epithelial cells with microvilli

Experiment Manual Biology Page 118 of 119
Front side of model Back side of model Detail: the smaller
folds represent the villi
Conclusion
These models explain important concepts of digestive systems, particularly the digestive
mechanism such as surface area of food particles, peristaltic movement, and intestinal fold.

Experiment Manual Biology Page 119 of 119
References
Biological Science Curriculum (2009) The Biology Teacherʼs Handbook, 4th Edition, 4th ed. National Science Teacher Association.
Campbell, N. and Reece, J. (2005) Biology, 7th, ed. Pearson, Benjamin, Cummings.
Churchill, E.R., Loeschnig, L.V. and Mandell, M. (1997) 365 Simple Science Experiments with Everyday Materials, Unk. Black Dog & Leventhal Publishers.
Koba, S. and Tweed, A. (2009) Hard-To-Teach Biology Concepts: A Framework to Deepen Student Understanding, National Science Teachers Association