King s Research Portal · growing rapidly in urban population. However, at the same time many...
25
King’s Research Portal DOI: 10.1142/S2345737616500196 Document Version Publisher's PDF, also known as Version of record Link to publication record in King's Research Portal Citation for published version (APA): Birkmann, J., Agboola, J., Welle, T., Ahove, M., Odunuga, S., Von Streit, J., & Pelling, M. A. (2017). Vulnerability, Resilience and Transformation of Urban Areas in the Coastal Megacity Lagos: Findings of Local Assessments and a Household Survey in Highly Exposed Areas. DOI: 10.1142/S2345737616500196 Citing this paper Please note that where the full-text provided on King's Research Portal is the Author Accepted Manuscript or Post-Print version this may differ from the final Published version. If citing, it is advised that you check and use the publisher's definitive version for pagination, volume/issue, and date of publication details. And where the final published version is provided on the Research Portal, if citing you are again advised to check the publisher's website for any subsequent corrections. General rights Copyright and moral rights for the publications made accessible in the Research Portal are retained by the authors and/or other copyright owners and it is a condition of accessing publications that users recognize and abide by the legal requirements associated with these rights. •Users may download and print one copy of any publication from the Research Portal for the purpose of private study or research. •You may not further distribute the material or use it for any profit-making activity or commercial gain •You may freely distribute the URL identifying the publication in the Research Portal Take down policy If you believe that this document breaches copyright please contact [email protected] providing details, and we will remove access to the work immediately and investigate your claim. Download date: 19. Aug. 2018
Transcript of King s Research Portal · growing rapidly in urban population. However, at the same time many...

King’s Research Portal
DOI:10.1142/S2345737616500196
Document VersionPublisher's PDF, also known as Version of record
Link to publication record in King's Research Portal
Citation for published version (APA):Birkmann, J., Agboola, J., Welle, T., Ahove, M., Odunuga, S., Von Streit, J., & Pelling, M. A. (2017).Vulnerability, Resilience and Transformation of Urban Areas in the Coastal Megacity Lagos: Findings of LocalAssessments and a Household Survey in Highly Exposed Areas. DOI: 10.1142/S2345737616500196
Citing this paperPlease note that where the full-text provided on King's Research Portal is the Author Accepted Manuscript or Post-Print version this maydiffer from the final Published version. If citing, it is advised that you check and use the publisher's definitive version for pagination,volume/issue, and date of publication details. And where the final published version is provided on the Research Portal, if citing you areagain advised to check the publisher's website for any subsequent corrections.
General rightsCopyright and moral rights for the publications made accessible in the Research Portal are retained by the authors and/or other copyrightowners and it is a condition of accessing publications that users recognize and abide by the legal requirements associated with these rights.
•Users may download and print one copy of any publication from the Research Portal for the purpose of private study or research.•You may not further distribute the material or use it for any profit-making activity or commercial gain•You may freely distribute the URL identifying the publication in the Research Portal
Take down policyIf you believe that this document breaches copyright please contact [email protected] providing details, and we will remove access tothe work immediately and investigate your claim.
Download date: 19. Aug. 2018

Vulnerability, Resilience and Transformationof Urban Areas in the Coastal Megacity Lagos:
Findings of Local Assessments and a HouseholdSurvey in Highly Exposed Areas
Joern Birkmann*,jj, Julius I. Agboola†, Torsten Welle*, Michael Ahove‡,Shakirudeen Odunuga§, Joachim von Streit* and Mark Pelling¶
*Institute of Spatial and Regional Planning,University of Stuttgart, Germany
†Department of Marine Sciences,University of Lagos, Nigeria
‡Center for Environment and Science Education,Lagos State University, Nigeria
§Department of Geography, University of Lagos, Nigeria
¶Kings College London, [email protected]
Published 16 March 2017
Coastal urban regions in low-lying areas in developing countries are often hotspotsof climate change related risks and therefore the analysis of different characteristics ofvulnerability, resilience and transformation is an important prerequisite for planning anddecision making. Even though the concepts of resilience and transformation have beendiscussed for some time, they often remain still very abstract. Against this backgroundthe following paper aims to illustrate how different characteristics of vulnerability:susceptibility, exposure and adaptation from resilience to transformative change can beassessed in practice at the level of individual households and different city districts. Thehousehold survey was conducted in four low-income, at risk areas in the coastalmegacity of Lagos. It reveals important differences between the case study locations in
jjCorresponding author.This is an Open Access article published by World Scientific Publishing Company. It is distributedunder the terms of the Creative Commons Attribution 4.0 (CC-BY) License. Further distribution ofthis work is permitted, provided the original work is properly cited.
J Extreme Events, Vol. 3, No. 3 (2016) 1650019 (24 pages)© The Author(s)DOI: 10.1142/S2345737616500196
1650019-1
J. o
f E
xtr.
Eve
n. 2
016.
03. D
ownl
oade
d fr
om w
ww
.wor
ldsc
ient
ific
.com
by K
ING
`S C
OL
LE
GE
LO
ND
ON
MA
UG
HA
N L
IBR
AR
Y &
IN
FOR
MA
TIO
N S
ER
VIC
ES
CE
NT
RE
(IS
C)
- JO
UR
NA
L S
ER
VIC
ES
on 0
6/08
/17.
For
per
sona
l use
onl
y.
terms of perceived capacities and actual responses of households to extreme events andcreeping hazards. The analysis of behavioral changes undertaken after extreme eventsunderscores that experience of loss and damage is an important stimulus for people tochange their behavior. Moreover perception of actual and future risk management ca-pacities and the performance of government institutions influences risk managementregimes at the household level. It was found that at risk populations experienced both,inaction from government and individual households. This is a corrective to the majorityliterature that focuses on proactive local or government action. In fact, these examples ofsuccess may be quite rare and were not found in the four settlements studied in thisresearch. The survey is part of a larger international project regarding the Transformationand Resilience of Urban Coasts (TRUC (2016). Transformation fo urban coasts Avail-able at www.bel_truc.org) funded by the Belmont Forum and the DFG in particular interms of the research in Lagos.
Keywords: Vulnerability; Resilience; Transformation; Lagos; Megacities; Household survey.
1. Introduction
Lagos is one of the coastal megacities in Africa, a major economic center that isgrowing rapidly in urban population. However, at the same time many migrantsand people with low income face precarious housing conditions and often have tolive in informal settlements with insufficient access to basic infrastructure servicesand limited political power (see e.g., Oyesol 2012). In addition, sea-level rise andextreme weather events (particularly heat stress and heavy precipitation) are likelyto intensify in various regions due to climate change (see IPCC 2014). In thiscontext, the megacity of Lagos is one of the core research areas of the Transfor-mation and Resilience in Urban Coasts (TRUC) project (see TRUC 2016). Next toLagos the household level assessments of vulnerability and transformation have alsobeen conducted in New York and Kolkata. A comparative vulnerability assessmentof all TRUC cities— namely New York, London, Tokyo, Kolkata and Lagos— canbe found in Welle and Birkmann 2016. The survey and assessment below com-plements previous studies regarding the dynamics of resilience and vulnerability toclimate change in coastal megacities (see e.g., Simonovic and Peck (2013)).
1.1. Lagos State and Lagos Metropolitan Area
Lagos State is located on the south-western part of Nigeria and bounded on thenorth and east by Ogun State. Lagos State with a population of about 20–23million (Lagos State Bureau of Statistics and Research 2013; UN 2014; Adelekan2014; Adelekan and Asiyanbi 2016), is the commercial and industrial hub ofNigeria, and an important economic center in West Africa. Lagos State accountsfor 60% of Nigeria’s Gross Domestic Product and 65% of national investments(Lagos Bureau of Statistics 2013; Adelekan 2010, 2015). The Lagos Metropolitan
J Birkmann et al.
1650019-2
J. o
f E
xtr.
Eve
n. 2
016.
03. D
ownl
oade
d fr
om w
ww
.wor
ldsc
ient
ific
.com
by K
ING
`S C
OL
LE
GE
LO
ND
ON
MA
UG
HA
N L
IBR
AR
Y &
IN
FOR
MA
TIO
N S
ER
VIC
ES
CE
NT
RE
(IS
C)
- JO
UR
NA
L S
ER
VIC
ES
on 0
6/08
/17.
For
per
sona
l use
onl
y.
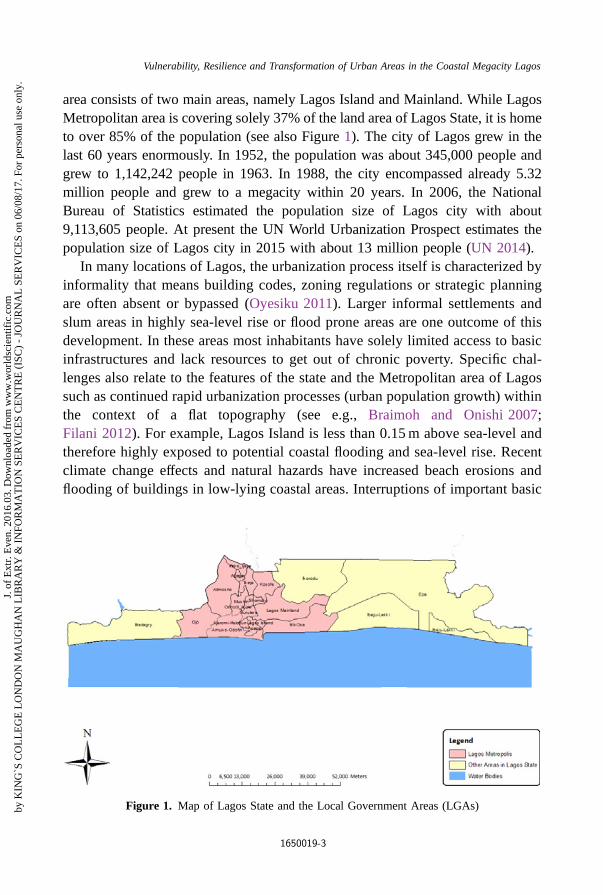
area consists of two main areas, namely Lagos Island and Mainland. While LagosMetropolitan area is covering solely 37% of the land area of Lagos State, it is hometo over 85% of the population (see also Figure 1). The city of Lagos grew in thelast 60 years enormously. In 1952, the population was about 345,000 people andgrew to 1,142,242 people in 1963. In 1988, the city encompassed already 5.32million people and grew to a megacity within 20 years. In 2006, the NationalBureau of Statistics estimated the population size of Lagos city with about9,113,605 people. At present the UN World Urbanization Prospect estimates thepopulation size of Lagos city in 2015 with about 13 million people (UN 2014).
In many locations of Lagos, the urbanization process itself is characterized byinformality that means building codes, zoning regulations or strategic planningare often absent or bypassed (Oyesiku 2011). Larger informal settlements andslum areas in highly sea-level rise or flood prone areas are one outcome of thisdevelopment. In these areas most inhabitants have solely limited access to basicinfrastructures and lack resources to get out of chronic poverty. Specific chal-lenges also relate to the features of the state and the Metropolitan area of Lagossuch as continued rapid urbanization processes (urban population growth) withinthe context of a flat topography (see e.g., Braimoh and Onishi 2007;Filani 2012). For example, Lagos Island is less than 0.15m above sea-level andtherefore highly exposed to potential coastal flooding and sea-level rise. Recentclimate change effects and natural hazards have increased beach erosions andflooding of buildings in low-lying coastal areas. Interruptions of important basic
Figure 1. Map of Lagos State and the Local Government Areas (LGAs)
Vulnerability, Resilience and Transformation of Urban Areas in the Coastal Megacity Lagos
1650019-3
J. o
f E
xtr.
Eve
n. 2
016.
03. D
ownl
oade
d fr
om w
ww
.wor
ldsc
ient
ific
.com
by K
ING
`S C
OL
LE
GE
LO
ND
ON
MA
UG
HA
N L
IBR
AR
Y &
IN
FOR
MA
TIO
N S
ER
VIC
ES
CE
NT
RE
(IS
C)
- JO
UR
NA
L S
ER
VIC
ES
on 0
6/08
/17.
For
per
sona
l use
onl
y.

infrastructure services, including water and drainage networks are some of theconsequences. In 1995 and 2010, 2011 and 2012 the city experienced majorfloods and adverse events. This means that Lagos is a particularly interestinglaboratory to examine, assess and monitor aspects and dynamics of vulnerability,resilience and transformation. In this regard, the household survey did not solelyfocus on characteristics of personal or household vulnerability, but at the sametime investigated the perceived capacities of households to deal with naturalhazards as well as changes in risk management strategies and urban transfor-mation processes. This information is essential for policy processes and decisionmakers that aim to strengthen urban resilience and to promote positive trans-formative change.
1.2. Background: Policy responses to address urban povertyand extreme events
As part of its urban renewal efforts, the Lagos State Government (LSG) in 2008 putin place a new vehicle to upgrade 10 communities in order to improve liveability inLagos. This included slum upgrading projects in the Mushin, Itire and Ijeshatedocommunities. The projects encompassed the upgrading of 30 roads and drains,provision of boreholes as well as upgrading of primary schools. The upgradingsub-projects were developed in response to the expressed demand of the bene-ficiaries in slums — namely Agege, Orile Agege, Ajegunle, Amukoko, Badia,Iwaya, Makoko, Ilaje, Bariga and Ijeshatedo/Itire. The areas selected were basedon a larger survey conducted in 1995 regarding the living conditions in slumcommunities in Lagos State. In addition LSG’s activities in addressing environ-mental change issues including climate change in the last five years have includedthe establishment of a Climate Change Unit.
Against this background and based on research on vulnerability and resilienceof urban areas in general (see e.g., Birkmann 2013; Birkmann et al. 2016) and inLagos in particular (see Ajibade and McBean 2014; Ajibade et al. 2013, 2014) aswell as conceptual work on transformation (Solecki et al. 2017) we examine howlocal households in Lagos perceive different hazards, vulnerabilities and riskmanagement options and actual activities from the past and their potential per-formance in the future. Aspects of vulnerability, resistance, resilience and trans-formation are examined through the perspective of households living in highlyexposed areas in Lagos. Consequently, the study focuses on household levelvulnerability and risk profiles as well as household level risk management regimesand evaluations about the performance of governmental risk management at localscale. The survey is comparable with similar household surveys conducted within
J Birkmann et al.
1650019-4
J. o
f E
xtr.
Eve
n. 2
016.
03. D
ownl
oade
d fr
om w
ww
.wor
ldsc
ient
ific
.com
by K
ING
`S C
OL
LE
GE
LO
ND
ON
MA
UG
HA
N L
IBR
AR
Y &
IN
FOR
MA
TIO
N S
ER
VIC
ES
CE
NT
RE
(IS
C)
- JO
UR
NA
L S
ER
VIC
ES
on 0
6/08
/17.
For
per
sona
l use
onl
y.

the TRUC project in Kolkata and New York. In particular the household surveyexamined the following seven questions:
1. How do different households perceive their susceptibilities and capacities todeal with extreme and adverse events in exposed locations in Lagos?
2. Do people feel prepared regarding present and future risks linked to naturalhazards and climate change?
3. How do households view their own risk management performance in the past?4. Did households change their risk management strategies and behavior after
extreme events?5. Why did households change their risk management and behavior after an
extreme event?6. How do households evaluate risk management actions of local authorities in the
past?7. Do households assume that the performance of local governmental institutions
and their risk management will improve or decrease in the future (next10 years) in terms of supporting households at risk?
The study contributes to emerging discussions on the adaptation-developmentnexus that is interested in the positioning of disaster risk management (DRM) anddevelopment. Solecki et al. (2016) identify four possible relationships: resistance(the aim of DRM is to protect existing development gains from risk); resilience(the aim of DRM is to work with development to facilitate learning and flexibility,to protect core functions); transformation (development is a cause of risk andadjusting development is the best way to achieve RM); collapse (there is nostrategic capacity for orienting DRM). Development is understood to includeexisting land-use, established practices of work, governance and administrativearrangements and technologies. Development is contested and judgement on theadaptation-development nexus will be contingent on viewpoint (policy orientation,scale and value-position of stakeholders). The household survey presented in thispaper contributes to giving voice to populations which are at risk.
The household level survey complements an assessment of vulnerability andrisk at the local level conducted coastal megacities of the TRUC project, namelyKolkata, New York, Tokyo and London (see Welle and Birkmann 2016). While thecomparative vulnerability assessment of these cities is based on official statisticaldata and therefore captures primarily broader issues of susceptibility, coping andadaptation capacities of people or institutions for an entire city, the householdsurvey allows to explore individual changes in risk management regimes athousehold level. In addition, the household survey explores more in-depth howindividual households judge their own situation and risk management context.
Vulnerability, Resilience and Transformation of Urban Areas in the Coastal Megacity Lagos
1650019-5
J. o
f E
xtr.
Eve
n. 2
016.
03. D
ownl
oade
d fr
om w
ww
.wor
ldsc
ient
ific
.com
by K
ING
`S C
OL
LE
GE
LO
ND
ON
MA
UG
HA
N L
IBR
AR
Y &
IN
FOR
MA
TIO
N S
ER
VIC
ES
CE
NT
RE
(IS
C)
- JO
UR
NA
L S
ER
VIC
ES
on 0
6/08
/17.
For
per
sona
l use
onl
y.

Thus, the survey provides important information about shifts and changes in riskmanagement practices and regimes and how risk perceptions and past experiencesinfluence these changes.
Overall, the analysis of vulnerability, resilience and transformative change at thehousehold level allows us to deepen the knowledge on how people exposed reactand modify their risk management in order to deal with their vulnerabilities as wellas past and future adverse events linked to natural hazards and climate change. Inthis regard, Yang et al. (2015) underscore that risk perception and knowledge havean important impact on individuals’ behavior and risk management approaches. Inthis regard, the paper presents new findings on if and how people in Lagos changedtheir behavior and risk perceptions after extreme events and in the context ofpotential future changes due to climate and socio-economic trends. We investigatedbehavioral patterns of households before, during and after extreme events (floodsand heatwaves) and also captured their own evaluation of resources and defi-ciencies in the context of dealing with extreme events and natural hazards. Thedata gathered through the household interviews can help to better understandcommunities’ adaptation processes and adaptation barriers toward risks in coastalmegacities. Furthermore, the information obtained for selected sites in Lagos, forexample the perception about the residential safety, environmental and housingconditions as well as the importance of different natural hazards, can informstrategic development approaches in urban planning and local DRM. In addition,local DRM approaches might utilize the information about behavior changes andthe different stimuli that fostered these changes in their own programmes. Finally,the evaluation of actions of local risk reduction measures by the households ex-posed can be an important information source for improving and strengtheningrespective programmes for individual districts. That means the information gath-ered through the household survey can in part provide feedback and also functionas a monitoring tool that should inform future actions.
2. Methodology and Case Study Selection
The following section explains more in-depth the methodology used within thehousehold survey and the case study selection.
2.1. Case study selection
For the household (HH) survey four LGAs out of 20 total LGAs in Lagos Statewere selected, namely Lagos Mainland, Badagary, Ajeromi-Ifelodun and Shomolu.These areas are highly exposed to inland and potential coastal flooding on onehand and mostly encompass low income households with different livelihood
J Birkmann et al.
1650019-6
J. o
f E
xtr.
Eve
n. 2
016.
03. D
ownl
oade
d fr
om w
ww
.wor
ldsc
ient
ific
.com
by K
ING
`S C
OL
LE
GE
LO
ND
ON
MA
UG
HA
N L
IBR
AR
Y &
IN
FOR
MA
TIO
N S
ER
VIC
ES
CE
NT
RE
(IS
C)
- JO
UR
NA
L S
ER
VIC
ES
on 0
6/08
/17.
For
per
sona
l use
onl
y.

profiles. The case study sites also represent different types of urban areas in termsof density and closeness to the city center versus city fringe. An overview of thestudy location is presented in Figure 2 and Table 1 provides a short outline of thegeneral household profile.
Figure 2. Household Survey Study Locations (LGAs) in Lagos, Nigeria
Table 1. Profile of Households in the Four Selected Survey Locations in Lagos
Profiles/LGAs Badagary Shomolu Lagos Mainland Ajeromi-Ifelodun
Population 505,104 1,361,110 835,779 1,905,717Population
Density1,140 people/sq
km93,227 people/sq km 42,598 people/sq km 137,102 people/
sq kmLand area 6,258.4 Ha 1,145.7 Ha 1,930.6 Ha 4,767.66 HaNeighborhoods
studiedBadagry town
(low income)Aradagun(low income)
Ilaje (low/middleincome)Shomolu (lownad middleincome) Bariga(low/middleincome)
Ebute-meta (middleincome) Makoko(low income)Iwaya/Onike(middle income)
Ajegunle (lowincome)Boundary(low income)
Vulnerability, Resilience and Transformation of Urban Areas in the Coastal Megacity Lagos
1650019-7
J. o
f E
xtr.
Eve
n. 2
016.
03. D
ownl
oade
d fr
om w
ww
.wor
ldsc
ient
ific
.com
by K
ING
`S C
OL
LE
GE
LO
ND
ON
MA
UG
HA
N L
IBR
AR
Y &
IN
FOR
MA
TIO
N S
ER
VIC
ES
CE
NT
RE
(IS
C)
- JO
UR
NA
L S
ER
VIC
ES
on 0
6/08
/17.
For
per
sona
l use
onl
y.

2.2. Sampling framework
The survey research adopted systematic sampling techniques. Lagos city wasclustered into four LGAs with each cluster having three and/or two strata, namely,Badagary (Badagary town, Aradagun and Ibereko area), Shomolu (Shomolu, Ilaje,Bariga), Lagos Mainland (Ebute Metta, Makoko and Iwaya/Onike) and Ajeromi-Ifelodun (Ajegunle, Boundary). Badagary cluster is a low-density city fringe areawith low income residents. The second cluster, Shomolu, is closest to the citycenter area of middle and low-income residents while the Lagos Mainland clusterhouses residents of middle and low income earnings. The fourth cluster, Ajeromi-Ifelodun, is classified as low income area.
A random sampling method was used to select the individual households. In-terview teams were selected every third house to conduct an interview. In case ofthe absence or unwillingness of a household to participate in the survey the nexthousehold was selected. In general, the head of a household was interviewed and inthe case that the head of household was not available, elderly occupants or spouseswere asked to be interviewed. The household survey captured about 600 house-holds with an interview duration between 40 and 50 min per household.
The questionnaire encompassed four core areas, (1) personal information andhousehold profile, (2) evaluation of the importance of different natural hazards, (3)the household’s living conditions (proxies for vulnerabilities and capacities) and(4) risk management strategies of the individual household and the evaluation ofthe local risk management performance (see in detail household survey ques-tionnaire on IREUS website http://www.unistuttgart.de/ireus/forschung/for-schungsprojekte/laufende/truc/index.html). In order to derive a more in-depthinformation base for assessing different aspects of vulnerability, the householdsurvey encompassed, next to aspects of income and education (see also Welle andBirkmann 2016), also issues of health, nutrition, housing and safety as well asenvironmental qualities. These factors that have not been sufficiently captured sofar in official statistical data have been gathered within the interviews using a self-evaluation and ranking methodology, including statistical validation processes.
3. Selected Findings of the Household Survey in Lagos
The following section presents analysis of vulnerability and capacities regardingthe different case study locations investigated. In addition, we explored whichhouseholds changed their behavior after an extreme event. The statistical analysisbased upon assessment of variance (ANOVA) to test the differences between twoor more means in order to evaluate and compare the statistical mean values.Thereafter, the significance of all possible contrasts among the means were
J Birkmann et al.
1650019-8
J. o
f E
xtr.
Eve
n. 2
016.
03. D
ownl
oade
d fr
om w
ww
.wor
ldsc
ient
ific
.com
by K
ING
`S C
OL
LE
GE
LO
ND
ON
MA
UG
HA
N L
IBR
AR
Y &
IN
FOR
MA
TIO
N S
ER
VIC
ES
CE
NT
RE
(IS
C)
- JO
UR
NA
L S
ER
VIC
ES
on 0
6/08
/17.
For
per
sona
l use
onl
y.

calculated (not only the pairwise differences) based on the Scheffe-Test (see e.g.,Norris et al. 2013).
3.1. Susceptibility
Each household was asked to indicate their level of satisfaction with health,nutrition and housing conditions. Significant deficits and problems of householdsin terms of health and nutrition as well as in terms of safe and adequate housingcan be seen as proxies for vulnerability (see e.g., UN-HABITAT 2009; Welle andBirkmann 2015; Birkmann and Welle 2016). Household status on these measuresis an outcome of past developments and shocks, coping and adaptive capacity andindicates the extent to which households in each sample area are able to withstandstress or shock. Respondents were asked to classify input indicators between 10(excellent capacity) and 0 (no capacity). For example, 10 meant that the householdviewed its health status or housing quality as excellent, while low values indicatedclear deficiencies. Also in terms of housing quality, the value zero indicates pre-carious housing conditions with no sanitation and no fresh water and little space,while 10 means that housing conditions are very good or excellent. Similar jud-gements and evaluations were conducted in terms of the safety and the environ-mental conditions of the residential area. The findings, aggregated for each samplesite are shown in Figure 3.
Comparing values across study sites housing (3) and environmental conditions(2) are perceived to be most problematic. The overall low values in terms ofhousing and environmental conditions indicate that problems linked to naturalhazards, such as flooding, might lead to further risk accumulation and cascadingeffects. For example contaminated water bodies and insufficient sewage infra-structure as part of the problematic environmental conditions might lead to thespreading of diseases once a flood or waterlogging occurs within the area. Incontrast respondents from all neighborhoods perceive the least troubling aspects ofsusceptibility to be health and nutrition. This may reflect the more immediatecompounding influence on risk of housing and environmental conditions. Resi-dential safety is a proxy of social capital and will vary greatly by individual(women will perceive safety differently from men), here respondents were over-whelmingly male heads of household. Residential safety had the greatest varianceof any indicator.
Aggregating values for each neighborhood indicates that the highest suscepti-bility can be found in Ajeromi-Ifelodun with an overall score of 4.25 followed byShomolu with 5.07 and Badagary 5.55. Lagos Mainland returns an aggregate scoreof 5.61 indicating a significantly lower susceptibility level compared to the other
Vulnerability, Resilience and Transformation of Urban Areas in the Coastal Megacity Lagos
1650019-9
J. o
f E
xtr.
Eve
n. 2
016.
03. D
ownl
oade
d fr
om w
ww
.wor
ldsc
ient
ific
.com
by K
ING
`S C
OL
LE
GE
LO
ND
ON
MA
UG
HA
N L
IBR
AR
Y &
IN
FOR
MA
TIO
N S
ER
VIC
ES
CE
NT
RE
(IS
C)
- JO
UR
NA
L S
ER
VIC
ES
on 0
6/08
/17.
For
per
sona
l use
onl
y.

areas – especially Ajeromi-Ifelodun and Shomolu. These differences are alsostatistically relevant according to the Scheffe-test. This test shows that the differ-ences in susceptibility between Ajeromi-Ifelodun and Badagary (0.02) as well aswith Lagos Mainland (0.00) and with Shomolu (0.03) are significant. However, thedifferences between Badagary and Lagos Mainland, as well as between Badagaryand Shomolu and between Lagos Mainland compared to Badagary and Shomoluwere not significant statistically. In summary, this means that differences in thelevel of vulnerability can be primarily identified between Ajeromi-Ifelodun and theother three case study locations.
Examining the individual variables by neighborhood helps to explain the cal-culated aggregate differences in susceptibility. The findings show interesting dif-ferences between the case study locations particularly in terms of housingconditions, residential safety and environmental conditions, while in terms of thehealth conditions solely minor differences can be identified between judgements ofhouseholds in the various Local Governance Areas surveyed. Mean neighborhood
Figure 3. Means of Ratings (10 Very Good, 0 Very Bad) of the Personal and Household (HH)
Conditions with Regard to Health, Nutrition, Housing, Residential Safety and Residential Environ-
mental Conditions
Notes: Sample: Health n = 561, Nutrition n = 565, Housing n = 563, Residential safety n = 562,
Environmental conditions n = 563.
J Birkmann et al.
1650019-10
J. o
f E
xtr.
Eve
n. 2
016.
03. D
ownl
oade
d fr
om w
ww
.wor
ldsc
ient
ific
.com
by K
ING
`S C
OL
LE
GE
LO
ND
ON
MA
UG
HA
N L
IBR
AR
Y &
IN
FOR
MA
TIO
N S
ER
VIC
ES
CE
NT
RE
(IS
C)
- JO
UR
NA
L S
ER
VIC
ES
on 0
6/08
/17.
For
per
sona
l use
onl
y.

values rank between 6.1 and 6.78. The statistical validation method of the Scheffetest (Norris et al. 2013) indicates that there are no significant statistical differencesin health ratings across all four LGAs. With regard to nutritional status, somesignificant differences are revealed. While households in Badagary and LagosMainland ranked their nutritional situation with a mean of 6.19 and 6.31 thesituation in Ajeromi-Ifelodun seems to be worse with a mean value of 5.35. Lowervalues indicate more problematic conditions, while high values show less troublingconditions based on the self-ranking of households.
In terms of housing quality and residential safety, significant differences be-tween the locations become evident. The situation in Ajeromi-Ifelodun is signifi-cantly worse compared to Badagary and Lagos Mainland (see Figure 3). TheScheffe test confirms that these differences between Ajeromi-Ifelodun andBadagary are statistically significant as well as the differences between the twolocations and Lagos Mainland. However, no significant differences exist betweenShomolu and Ajeromi-Ifelodun meaning that the housing situation or housingquality conditions based on the self-evaluation are more or less similar in both areas.
The assessment of the residential safety of the neighborhoods shows thatAjeromi-Ifelodun has the lowest value with a mean of 3.73 meaning that theoverall safety situation perceived by the interviewed household is rather bad andproblematic. Even though the value in Badagary with 4.98 also hints towarddeficits in terms of the safety of the residential areas there, it is– however -significantly higher compared to Ajeromi-Ifelodun. Particularly, the inhabitantsinterviewed in Lagos Mainland have in general evaluated their safety situation tobe more positive compared to all other locations. The Scheffe test confirms thatdifferences between Ajeromi-Ifelodun and Badagary as well as Lagos Mainlandare also statistically significant. That means we find the most problematic safetyconditions of residential areas in Ajeromi-Ifelodun and Shomolu, whereas thesituation based on the self-evaluation of the situation in Lagos Mainland andBadagary seems to be better in relative terms.
The self-evaluation of the environmental conditions and qualities between thefour case studies also reveals significant differences. Major differences can par-ticularly be identified between Ajeromi-Ifelodun and the other three case studyareas, namely Shomolu, Badagary and Lagos Mainland. The validation with theScheffe test confirms that the differences identified are also statistically significant.
Self-evaluations by households can encompass a bias in some cases however,we assume that the ranking and particularly the significant differences confirmedby the Scheffe test in terms of the mean values for the different locations provide afirst reliable information layer about the differential level of susceptibility in thefour LGAs. The rankings in terms of health and nutrition status, safety and crime
Vulnerability, Resilience and Transformation of Urban Areas in the Coastal Megacity Lagos
1650019-11
J. o
f E
xtr.
Eve
n. 2
016.
03. D
ownl
oade
d fr
om w
ww
.wor
ldsc
ient
ific
.com
by K
ING
`S C
OL
LE
GE
LO
ND
ON
MA
UG
HA
N L
IBR
AR
Y &
IN
FOR
MA
TIO
N S
ER
VIC
ES
CE
NT
RE
(IS
C)
- JO
UR
NA
L S
ER
VIC
ES
on 0
6/08
/17.
For
per
sona
l use
onl
y.

as well as environmental conditions within the LGAs based on the householdinterviews are first proxies that help to assess the differential vulnerability ofpeople in medium and low-income areas in Lagos exposed to natural hazards andadverse event.
3.2. Importance of different natural hazards
Next to the ranking of the living conditions of households and their susceptibilitydiscussed above, we aimed to better understand the importance of various naturalhazards for the households interviewed. In this regard households were asked to rankthe importance of different hazards, such as rainfall flooding and waterlogging,coastal flooding, heat stress and high temperatures. The results shown in Figure 4underscore that various households view natural hazards as not important for them.Among the natural hazards that are seen as relevant it is particularly rainfall floodingand waterlogging that most of the households view as most important.
Interestingly, heat stress seems to be a hazard that is highly relevant formany households interviewed in the selected case study locations in Lagos
Figure 4. Ranking of the Importance of Different Natural Hazards (Answers in Percentage of
Respondents)
Notes: Sample: Heat stress n = 557, Rainfall/waterlogging n = 557, Coastal Flooding n = 556.
J Birkmann et al.
1650019-12
J. o
f E
xtr.
Eve
n. 2
016.
03. D
ownl
oade
d fr
om w
ww
.wor
ldsc
ient
ific
.com
by K
ING
`S C
OL
LE
GE
LO
ND
ON
MA
UG
HA
N L
IBR
AR
Y &
IN
FOR
MA
TIO
N S
ER
VIC
ES
CE
NT
RE
(IS
C)
- JO
UR
NA
L S
ER
VIC
ES
on 0
6/08
/17.
For
per
sona
l use
onl
y.

(see Figure 4). This supports the findings of Ajibade et al. (2016) that shows cityexperts rank heat stress as a priority with existing city action lagging behind risk.In contrast, coastal flooding has a lower priority even though some of the districtsare located on the coast. Consequently, households in the survey locations viewquite opposite phenomena, namely heat stress and high temperatures on one handand waterlogging and rainfall flooding on the other, as important hazards. Coastalflooding is not an issue at least is not perceived as important as the other twohazards.
3.3. Ranking of exposure
Beside the evaluation of the importance of selected natural hazards (Figure 4),we examined how households perceive their own exposure to hazards outlinedbefore — namely heat stress/high temperatures, rainfall flooding/waterloggingand coastal flooding. The ranking of exposure to rainfall flooding/waterloggingwas used since many households see rainfall flooding and waterlogging as aproblem. The analysis reveals that the highest mean value of the householdsinterviewed is shown for the case study area Badagary, followed by Ajeromi-Ifelodun and thereafter the other three case study areas with a nearly similar value(see Figure 5).
Figure 5. Ranking of Exposure to Flooding
Notes: Sample: n = 563.
Vulnerability, Resilience and Transformation of Urban Areas in the Coastal Megacity Lagos
1650019-13
J. o
f E
xtr.
Eve
n. 2
016.
03. D
ownl
oade
d fr
om w
ww
.wor
ldsc
ient
ific
.com
by K
ING
`S C
OL
LE
GE
LO
ND
ON
MA
UG
HA
N L
IBR
AR
Y &
IN
FOR
MA
TIO
N S
ER
VIC
ES
CE
NT
RE
(IS
C)
- JO
UR
NA
L S
ER
VIC
ES
on 0
6/08
/17.
For
per
sona
l use
onl
y.

The difference between Ajeromi-Ifelodun and Badagary is significant and alsothe differences in terms of perceived exposure between Ajeromi-Ifelodun andLagos Mainland. The statistical validation based on the Scheffe test underscoresthat the differences observed between Lagos Mainland and Badagary are statis-tically significant. That means that even though the exposure to rainfall floodingand waterlogging is perceived by interviewed households to be higher inBadagary compared to Ajeromi-Ifelodun the susceptibility level of people ismore problematic in Ajeromi-Ifelodun compared to Badagary. Interestingly, thelowest exposure level is shown for Lagos Mainland and this area also shows thebest values in terms of the assessed safety of the residential area based on theself-assessment of the households (see Figures 4 and 5). Overall, households inBadagary rate their own exposure to flooding and waterlogging higher comparedto all other case study locations. This correlates with a ranking of flooding as themost important hazard in this location compared to all other case study sites(see Figure 4).
3.4. Behavior change in the context of extreme events
Shifts in households risk management regimes can be used as proxies for trans-formations at the household level. We examined whether households interviewedin the four case study areas have changed their behavior in the context of extremeand hazardous events in Lagos. Interestingly, the survey shows that the majorityof the respondents indicated that no change of behavior was undertaken afterextreme events (see Figure 6). However, in some locations a significant proportionof households — for example in Badagary about 40% — reported that they had
Figure 6. Behavior Change After a Hazardous Event (in Percentage)
J Birkmann et al.
1650019-14
J. o
f E
xtr.
Eve
n. 2
016.
03. D
ownl
oade
d fr
om w
ww
.wor
ldsc
ient
ific
.com
by K
ING
`S C
OL
LE
GE
LO
ND
ON
MA
UG
HA
N L
IBR
AR
Y &
IN
FOR
MA
TIO
N S
ER
VIC
ES
CE
NT
RE
(IS
C)
- JO
UR
NA
L S
ER
VIC
ES
on 0
6/08
/17.
For
per
sona
l use
onl
y.

undertaken changes in their risk management strategies and actions throughbehavioral change. The number and the percentage of households that reportedthat they have undertaken behavior change differs significantly between theareas examined. While in Badagary the percentage is quite significant with morethan 40% of the respondents that answered the questions, the percentage of thosewho indicated that they have modified their behavior and risk management strat-egies in Lagos Mainland is much lower and accounts solely for about 20% of therespondents.
When asking those households that have undertaken changes in their behaviorafter extreme events regarding their reasons for these changes, we found that in alllocations experienced damage was an important trigger for behavioral changesfollowed by the recommendations of friends. Much fewer households said thatchanges of behavior were due to recommendations by local governments or due toinjured household members (see Figure 7). This indicates a failure of risk man-agement to reach out and support those at risk and recently impacted. Further workcould usefully explore the reasons for this gap.
Furthermore, we explored which measures households have taken in the contextof behavior change and their risk management strategies. About 34% of therespondents in Ajeromi-Ifelodun said that concrete changes encompassedimprovements of the house, followed by activities undertaken jointly withneighbors to strengthen resilience. Approximately 13% of the households
Figure 7. Reasons for Behavior Change after a Hazardous Event
Notes: Sample: n = 195.
Vulnerability, Resilience and Transformation of Urban Areas in the Coastal Megacity Lagos
1650019-15
J. o
f E
xtr.
Eve
n. 2
016.
03. D
ownl
oade
d fr
om w
ww
.wor
ldsc
ient
ific
.com
by K
ING
`S C
OL
LE
GE
LO
ND
ON
MA
UG
HA
N L
IBR
AR
Y &
IN
FOR
MA
TIO
N S
ER
VIC
ES
CE
NT
RE
(IS
C)
- JO
UR
NA
L S
ER
VIC
ES
on 0
6/08
/17.
For
per
sona
l use
onl
y.

interviewed answered that they had temporarily moved out of the house or resi-dential location. Very few mentioned that behavior changes also included findingadditional income sources or eating cheaper food. Similar patterns were revealed inthe other case study locations. Most important changes undertaken were improve-ments of the house or housing situation. Also temporary migration was mentionedby various households as a response measure undertaken after a hazard stroke.
3.5. Preparedness
When asking households about their current feeling of being prepared (or not)most households indicated that they donot feel sufficiently prepared (see Figure 8).That means none of the respondents rated the own preparedness higher than 5.25(scores between 0 and 10) and some households even said that their level ofpreparedness is very low— shown with scores between 2 and 3. Overall, the meanvalue of all answers is 4.06. This means that the perceived preparedness level ismediocre. The differences regarding the judgements about the own preparednesslevel in the case study locations are significant and underscore that households inAjeromi-Ifelodun feel less prepared (mean 3.33) compared to households in LagosMainland (mean 4.23) and Badagary (mean 4.69). The Scheffe test confirms thatthe differences between Ajeromi-Ifelodun and Badagary are significant but thedifferences between Ajeromi-Ifelodun and Lagos Mainland or Shomolu are notsignificant.
-0.8
-0.6
-0.4
-0.2
0
0.2
0.4
0.6
0.8
AJEROMI-IFELODUN
BADAGARY LAGOS MAINLAND SHOMOLU
Figure 8. Feeling of Preparedness — Differences from the Mean in the Four Survey Locations
Notes: Sample: n = 195.
J Birkmann et al.
1650019-16
J. o
f E
xtr.
Eve
n. 2
016.
03. D
ownl
oade
d fr
om w
ww
.wor
ldsc
ient
ific
.com
by K
ING
`S C
OL
LE
GE
LO
ND
ON
MA
UG
HA
N L
IBR
AR
Y &
IN
FOR
MA
TIO
N S
ER
VIC
ES
CE
NT
RE
(IS
C)
- JO
UR
NA
L S
ER
VIC
ES
on 0
6/08
/17.
For
per
sona
l use
onl
y.

In addition, the evaluation of actual risk reduction practice in the householdsconfirms such differential capacities between the households in the case studylocations. While households in Ajeromi-Ifelodun ranked their risk reductionpractice rather low with about 3.24 scores, the households in Lagos Mainland andBadagary ranked their capacities and risk reduction practices with about 4.6 and4.9 in average. The Scheffe test confirms that the difference between Ajeromi-Ifelodun on one hand and Badagary and Lagos Mainland on the other are sig-nificant but no statistically significant differences can be identified betweenAjeromi-Ifelodun and Shomolu. In a similar way, the assessment of existing fi-nancial resources to recover confirmed the different levels of vulnerability betweenthe case study locations. Interestingly, the rating of support and help from friendsdoes not reveal major differences between the survey locations. The help receivedfrom friends was rated with about 3.12 on average.
Next to the evaluation of the individual risk management strategies and supportreceived from social networks, we also examined how different households rate thesupport received and performance of local government and local governmentinstitutions in order to better cope and adapt to extreme events and adverse hazardimpacts.
3.6. Rating of support from local government
The ratings regarding the support received from local governmental institutionsduring and after adverse events shows that none of the four survey locations has ascore above 2 in the mean. That means that most households in various locations ofthe survey perceive the performance level of local governmental institutions in termsof providing support after an extreme or hazardous event as rather weak and poorwith ratings between 1.09 inAjeromi-Ifelodun and 1.88 in Shomolu. The Scheffe testindicates that no significant differences can be found in terms of the answers andscores between the case study locations. This is also true for the access to earlywarning information,which is rated a bit betterwith about 2.76 scores on average, butwhich still shows a low level of performance or perceived performance.
Also the evaluation of the actions by the local government and governmentalinstitutions over the past 10 years confirms that overall most households rank theseactions and related improvements with low performance value of about 2.53 scoresas the mean. However, the analysis of the rankings between the case study loca-tions reveals important differences (see Figure 9).
Figure 9 shows that households in Lagos Mainland evaluate the performanceand actions of the local government in the past 10 years in terms of risk reductionmore positively compared to Badagary and Ajeromi-Ifelodun. The Scheffe test
Vulnerability, Resilience and Transformation of Urban Areas in the Coastal Megacity Lagos
1650019-17
J. o
f E
xtr.
Eve
n. 2
016.
03. D
ownl
oade
d fr
om w
ww
.wor
ldsc
ient
ific
.com
by K
ING
`S C
OL
LE
GE
LO
ND
ON
MA
UG
HA
N L
IBR
AR
Y &
IN
FOR
MA
TIO
N S
ER
VIC
ES
CE
NT
RE
(IS
C)
- JO
UR
NA
L S
ER
VIC
ES
on 0
6/08
/17.
For
per
sona
l use
onl
y.

confirms that the differences found between Lagos Mainland and Ajeromi-Ifelodunare statistically significant. Also the Gabriel test confirms this statement.
In the next section, we compare the evaluation of the performance of localgovernmental institutions in the past 10 years with the perception about the po-tential performance in the future (next 10 years) by the households interviewed interms of the level of support in dealing with hazards, e.g., floods. The findings (seeFigure 10) show that many households are not sure whether the performance willimprove or reduce (see yellow bar chart).
0 0.5 1 1.5 2 2.5 3 3.5
Ajeromi-Ifelodun
Badagary
Lagos Mainland
Shomolu
Figure 9. Evaluation of Actions of Local Government Regarding Risk Reduction in the Past 10
Years
Notes: Sample: n = 195.
0% 5% 10% 15% 20% 25% 30% 35% 40%
Ajeromi-Ifelodun
Badagry
Lagos Mainland
Shomolu
don't know increase maintain reduce
Figure 10. Assumption of the Performance of Local Government Risk Reduction in the Next 10
Years
Notes: Sample: n = 449.
J Birkmann et al.
1650019-18
J. o
f E
xtr.
Eve
n. 2
016.
03. D
ownl
oade
d fr
om w
ww
.wor
ldsc
ient
ific
.com
by K
ING
`S C
OL
LE
GE
LO
ND
ON
MA
UG
HA
N L
IBR
AR
Y &
IN
FOR
MA
TIO
N S
ER
VIC
ES
CE
NT
RE
(IS
C)
- JO
UR
NA
L S
ER
VIC
ES
on 0
6/08
/17.
For
per
sona
l use
onl
y.

At the same time the answers reveal that many households that answered thequestions in Ajeromi-Ifelodun and in Shomolu expect that the performance ofgovernmental actions in terms of risk reduction will increase in the future. Incontrast, a significant number of people interviewed are also sceptical and par-ticularly in Lagos Mainland about 20% and in Shomolu and Ajeromi-Ifelodunabout 18% said that they expect a reduction in the performance of governmentalinstitutions in terms of supporting risk reduction. These differences are difficult toexplain, however, they underscore that the assumptions about the future perfor-mance of local governmental institutions does not differ that much betweenthe survey locations, but more between the households interviewed within eachlocation. When comparing the expectations about the governmental support in thefuture, particularly whether government support will increase, will be maintainedat the same level or reduce with the HH-income groups, the survey reveals thathouseholds with a lower income (first 2 lowest income groups) in tendency thinkthat governmental support will be maintained or even reduce.
These results, however, cannot be statistically validated due to the small size ofthe sub-groups. Another factor, however, that supports the assumption thathousehold status (e.g., socio-economic capacity) has an influence on the judge-ments of the level of support of governmental institutions in the future is “edu-cation”. Respondents with a relatively low educational level (primary and secondaryeducation) rather assume that the governmental support will be maintained or de-crease instead of increase. In contrast, households where the head of the householdholds a bachelor or master degree as the highest education completed rather thinkin tendency that the governmental support will increase (see Figure 11). It has to bementioned that the group sizes for the different categories are small and thereforeno statistical verification can be made. Statistically the relation between educa-tional level and the assumptions about the government performance in the future is
Government support in the future
Totalmaintain reduce Increase do not know
Education 1 Primary Education 19.3% 9.9% 8.8% 4.2% 11.1%
2 Secondary Education 36.1% 46.5% 41.9% 43.1% 41.6%
3 Polytechnics 21.8% 20.8% 14.9% 23.6% 19.5%
4 Bachelor 17.6% 16.8% 23.0% 29.2% 21.1%
5 Master 5.0% 5.9% 11.5% 6.6%
Total 100.0% 100.0% 100.0% 100.0% 100.0%
Figure 11. Cross-Tabulation Between the Highest Educational Level of the Respondent and the
Assumed Development of Governmental Support in the Future (q118 education * q72 gov Support
Future)
Vulnerability, Resilience and Transformation of Urban Areas in the Coastal Megacity Lagos
1650019-19
J. o
f E
xtr.
Eve
n. 2
016.
03. D
ownl
oade
d fr
om w
ww
.wor
ldsc
ient
ific
.com
by K
ING
`S C
OL
LE
GE
LO
ND
ON
MA
UG
HA
N L
IBR
AR
Y &
IN
FOR
MA
TIO
N S
ER
VIC
ES
CE
NT
RE
(IS
C)
- JO
UR
NA
L S
ER
VIC
ES
on 0
6/08
/17.
For
per
sona
l use
onl
y.

confirmed by cramers V¼ 0.15 which is a rather weak correlation. However, thecorrelation, even though weak, has a significance level of 99%.
4. Discussion and Conclusions
The findings of the household survey provide important information about theliving conditions and differential susceptibilities of people exposed in selectedlocations in Lagos that encompass primarily low and middle income households.The results show how different households view their own risk management ca-pacities and actions in the past and present as well as their perception about thefuture. The juxtaposition of the evaluation of individual risk management regimesand the perception of the risk management performances of local governmentalinstitutions and official authorities in the past and in the future also highlighted thatmany households rather view the performance of governmental institutions morenegatively compared to their own risk management performance.
The rating of the importance of different hazards often correlates with theranking of the perceived exposure of the households. This can be inferred to meanthat people who have not yet experienced certain hazards view their own exposurein tendency rather low. Hence, motivating households to prepare for not-yet ex-perienced hazards, such as sea-level rise in Lagos, still seems to be a challenge,since most households do not regard these hazards as a major problem.
However, changes in risk management regimes at the household level werealso detected. The interviews and the respective data of more than 500 house-holds in the selected case study sites in Lagos revealed that household riskmanagement regimes were modified or changed, particularly if the household hadexperienced damages due to natural hazards in the past. While some householdshave undertaken significant modifications of their personal risk managementregime, for example in terms of strengthening the structure of the house or evenin terms of temporal migration, it is evident that many households have notmodified their risk management actions. It is important to note that manyhouseholds regard the present risk management of local governmental institu-tions as insufficient and expect that the level of support will be maintained ordecrease rather than increase. When examining the educational profile and in-come structure of these households it became evident that particularly house-holds with a low income (first two income categories) and a low level ofeducation view the performance of risk management of governmental institutionsat the local level more negative compared to those with a higher educational leveland higher income. Many of the households with a low level of formal educationand low income did not undertake any changes in the risk management regime at
J Birkmann et al.
1650019-20
J. o
f E
xtr.
Eve
n. 2
016.
03. D
ownl
oade
d fr
om w
ww
.wor
ldsc
ient
ific
.com
by K
ING
`S C
OL
LE
GE
LO
ND
ON
MA
UG
HA
N L
IBR
AR
Y &
IN
FOR
MA
TIO
N S
ER
VIC
ES
CE
NT
RE
(IS
C)
- JO
UR
NA
L S
ER
VIC
ES
on 0
6/08
/17.
For
per
sona
l use
onl
y.

their (household) level. Even though the size of the household survey does notallow for further statistical validation, it is likely that on a continuum frompositive transformation, preparedness, resistance and collapse, many of thesehouseholds can be classified as shifting toward categories of not being preparedand even likely to experience partial collapse, if new extreme events and hazards(e.g., sea-level rise) strike or the intensities and frequencies of these phenomena(inland flooding, heat stress) might increase.
In this regard, it is an open question whether conventional strategies to addressurban vulnerability such as enforcing urban planning laws, as proposed by Adelekan(2010), would be appropriate. The findings of the household survey indicate to someextent that most vulnerable and poor households with only a basic level of educationhave limited trust in governmental institutions and therefore evaluate their past andfuture performance rather negative. Even though Lagos is a relatively wealthymegacity and a major economic hub compared to other urban areas in West Africa,the past urban renewal program seem to have not sufficiently improved slum and lowincome areas and might have privileged specific other neighborhoods.
For example, the significant differences between the performance evaluation ofgovernmental institutions in terms of their risk management support along thefour case study areas show that households in Lagos Mainland seem to have — inpart — benefited from past actions, while the very low values in Badagary andAjeromi-Ifelodun show that many households in these areas seem to have been leftout of this support or do not perceive it as effective. Against this background it is abit surprising that various households in Ajeromi-Ifelodun compared to the othercase study areas assume that governmental risk management performance willincrease or be maintained in the future.
Even though many households have not changed their own risk managementregime, it is a positive sign that many households, which experienced damages inthe past, changed their risk management behavior. Hence, another scenario mightemerge in the future where households that will experience extreme events— onceimpacted — undertake changes and transformations in their risk managementregime rapidly. These findings represent an important difference to the majority ofpublished works on low income at risk populations. Here works has tended tofocus on successful examples of community-based risk management either incollaboration with government or filling gaps where government is inactive. Thecurrent study shows a more common place, but less frequently described situationwhere there is a negative overlapping of government and household inaction.
Overall, the household survey underscores the heterogeneity of perceptions andbehavioral changes at the micro scale (household level). While experienceddamage due to extreme events and hazards seems to be a major trigger for
Vulnerability, Resilience and Transformation of Urban Areas in the Coastal Megacity Lagos
1650019-21
J. o
f E
xtr.
Eve
n. 2
016.
03. D
ownl
oade
d fr
om w
ww
.wor
ldsc
ient
ific
.com
by K
ING
`S C
OL
LE
GE
LO
ND
ON
MA
UG
HA
N L
IBR
AR
Y &
IN
FOR
MA
TIO
N S
ER
VIC
ES
CE
NT
RE
(IS
C)
- JO
UR
NA
L S
ER
VIC
ES
on 0
6/08
/17.
For
per
sona
l use
onl
y.

households to change their behavior, the survey also revealed that the evaluation ofthe risk management performance by local governmental institutions is perceivedquite differently dependent on the educational level and income level of thehousehold interviewed. Particularly those households that are marginalized interms of the low level of education and income rather do not expect much from thegovernment at present and in the future. In contrast households with higher income(higher medium income categories) and higher educational degrees in tendencyassume that local governmental risk management will improve in the future. Eventhough it still is open whether local governmental risk management performancewill increase or decrease in the next 10 years, it is important to acknowledge thatthose who are particularly marginalized might need to be addressed differently inthe future by risk management strategies and development policies due to theirmore negative and critical judgements and opinions that might also indicate a lackof trust in governmental institutions in general.
In this regard, the assessment and evaluation of factors that make people moreprone to be negatively affected by extreme events (Fig. 3), such as precarioushousing conditions, environmental problems in the neighborhood and a low resi-dential safety are areas where risk management and urban development need to actjointly. Solely integrated strategies that link governmental disaster risk reductionand risk management (early warning, preparedness, etc.), climate change adapta-tion and broader strategies of urban development/urban renewal (urban and spatialplanning) with specific household risk management strategies can be effective. Theimproved understanding of various risk management regimes at the householdlevel and the identification of changes and transformation processes within theseregimes are important prerequisites for such efforts.
Acknowledgments
Research reported on in this paper was undertaken as part of the Belmont Forumfunded Transformation and Resilience on Urban Coasts (TRUC) project. Thisproject was supported by Japan Society for the Promotion of Science, the UKNatural Environment Research Council and Economic and Social ResearchCouncil (NE/L008971/1) the German Research Foundation (GZ: BI 1655/1-1),The Ministry of Earth Sciences, Government of India (MoES/01-CZM/Truc/2013)and US National Science Foundation.
References
Adelekan, I (2015). Flood risk management in the coastal city of Lagos, Nigeria. Journalof Flood Risk Management, 9(3): 255–264.
J Birkmann et al.
1650019-22
J. o
f E
xtr.
Eve
n. 2
016.
03. D
ownl
oade
d fr
om w
ww
.wor
ldsc
ient
ific
.com
by K
ING
`S C
OL
LE
GE
LO
ND
ON
MA
UG
HA
N L
IBR
AR
Y &
IN
FOR
MA
TIO
N S
ER
VIC
ES
CE
NT
RE
(IS
C)
- JO
UR
NA
L S
ER
VIC
ES
on 0
6/08
/17.
For
per
sona
l use
onl
y.

Adelekan, I (2014). Flood risk management by public and private agents in the coastal cityof Lagos. Paper Presented at the 6th International Conference on Flood Manage-ment in Sao Paulo, Brazil.
Adelekan, I (2010). Vulnerability of poor urban coastal communities to flooding in Lagos,Nigeria. Environment and Urbanization, 22(2): 433–450.
Adelekan, I and Asiyanbi A (2016). Flood risk perception in flood-affected communities inLagos, Nigeria. Natural Hazards, 80(1): 445–469.
Ajibade, I and McBean G (2014). Climate extremes and housing rights: A political ecologyof impacts, early warning and adaptation constraints in Lagos slum communities.Geoforum, 55: 76–86.
Ajibade, I, McBean G and Bezner-Kerr R (2013). Urban flooding in Lagos, Nigeria:Patterns of vulnerability and resilience among women. Global EnvironmentalChange, 23(6): 1714–1725.
Ajibade, I, Armah FA, Kuuire VZ, Luginaah I, McBean G and Tenkorang EY (2014).Assessing the bio-psychosocial correlates of flood impacts in coastal areas of Lagos,Nigeria. Journal of Environmental Planning and Management, 58(3): 445–463.
Birkmann, J (ed.) (2013). Measuring Vulnerability to Natural Hazards - Towards DisasterResilient Societies, Tokyo, 2nd Edition, New York, Paris; United Nations UniversityPress.
Birkmann, J, Welle T, Solecki W, Lwasa S and Garschagen M (2016). Boost the resilienceof small- and mid-sized cities. Nature, 537: 605–608.
Birkmann, J and Welle T (2016). The WorldRiskIndex 2016: Reveals the necessity forregional cooperation in vulnerability reduction. Journal of Extreme Events, 3(1),DOI:10.1142/S2345737616500056.
Braimoh, AK and Onishi T (2007). Spatial determinants of urban land sse change in Lagos,Nigeria. Land Use Policy, 24: 502–515.
Filani, MO (2012). The changing face of lagos – From vision to reform and transformation,Ibadan, Nigeria, Available at http://www.citiesalliance.org/sites/citiesalliance.org/files/Lagos-reform-report-lowres.pdf.
IPCC (Intergovernmental Panel on Climate Change) (2014). Climate Change 2014: ImpactAdaptation and Venerability. Geneva: WG2AR5 Summary for Policymakers.
Lagos Bureau of Statistics (2013). Digest of Statistics 2013: Ministry of Economic Plan-ning and Budget, Lagos State Government, Nigeria, Ikeja, Lagos.
Norris, G, Quershi F, Howitt D and Cramer D (2013). Introduction to Statistics with SPSSfor Social Science. New York: Routledge.
Oyesiku, K (2011). Development before town planning, the cause of flooding in Nigeria,Available at http://www.vanguardngr.com/2011/07/development-before-town-plan-ning-cause-of-flooding-in-nigerian/.
Oyesol, B (2012). Urban infrastructure - urban headaches. DþC Development andCooperation. Available at https://www.dandc.eu/en/article/lagos-city-dreams-and-nightmares.
Simonovic, S and Peck A (2013). Dynamic resilience to climate change caused naturaldisasters in coastal megacities quantification framework. British Journal of Envi-ronment and Climate Change, 3(3): 378–401.
Vulnerability, Resilience and Transformation of Urban Areas in the Coastal Megacity Lagos
1650019-23
J. o
f E
xtr.
Eve
n. 2
016.
03. D
ownl
oade
d fr
om w
ww
.wor
ldsc
ient
ific
.com
by K
ING
`S C
OL
LE
GE
LO
ND
ON
MA
UG
HA
N L
IBR
AR
Y &
IN
FOR
MA
TIO
N S
ER
VIC
ES
CE
NT
RE
(IS
C)
- JO
UR
NA
L S
ER
VIC
ES
on 0
6/08
/17.
For
per
sona
l use
onl
y.

Solecki, WD, Pelling M and Garschagen M (2017). Transitions between risk managementregimes in cities. Ecology and Society. (in press).
TRUC (2016). Transformation of Urban Coasts, Available at www.bel truc.org.UN HABITAT (2009). The Right to Adequate Housing, Geneva.UN (United Nations) (2014). World Urbanization Prospects, New York: Department of
Economic and Social Affairs.Welle, T and Birkmann J (2016). Comparative vulnerability assessment in five coastal
megacities. Journal of Extreme Events. (in press).Welle, T and Birkmann J (2015). The World Risk Index – An approach to assess risk and
vulnerability on a global scale. Journal of Extreme Events, 2(1), DOI:10.1142/S2345737615500037.
Yang, ZJ, Seo M, Rickard LN and Harrison TM (2015). Information sufficiency andattribution of responsibility: Predicting support for climate change policy andpro-environmental behaviour. Journal of Risk Research, 18(6): 727–746.
J Birkmann et al.
1650019-24
J. o
f E
xtr.
Eve
n. 2
016.
03. D
ownl
oade
d fr
om w
ww
.wor
ldsc
ient
ific
.com
by K
ING
`S C
OL
LE
GE
LO
ND
ON
MA
UG
HA
N L
IBR
AR
Y &
IN
FOR
MA
TIO
N S
ER
VIC
ES
CE
NT
RE
(IS
C)
- JO
UR
NA
L S
ER
VIC
ES
on 0
6/08
/17.
For
per
sona
l use
onl
y.


![[Pearl Bridge] 淡路IC/SA Awaji IC/SAAkashi Stn. Akashi Port Nishi-Akashi Stn. Kakogawa Stn. Himeji Stn. Iwaya Port Maiko Stn. Nushima Port Ohnaruto Bridge Kansai International Airport](https://static.fdocuments.us/doc/165x107/5e5c05eec7044819c25233b8/pearl-bridge-eicsa-awaji-icsa-akashi-stn-akashi-port-nishi-akashi-stn.jpg)