
Kinetics of the 0(3P) + N20 Reaction. 1. Direct Measurements at ...
20
Kinetics of the 0(3P) + N20 Reaction. 1. Direct Measurements at Intermediate Temperatures by Arthur Fontijn, Abdellatif Goumri, Abel Fernandez, William R. Anderson, and Nancy E. Meagher AF&RP-10 November 2000 A reprint from The Journal of Physical Chemistry A, vol. 104, no. 25, pp. 6003-6012,200O. Approved for public release; distribution is unlimited.
Transcript of Kinetics of the 0(3P) + N20 Reaction. 1. Direct Measurements at ...
Kinetics of the 0(3P) + N20 Reaction. 1. Direct Measurements at Intermediate Temperatures
by Arthur Fontijn, Abdellatif Goumri, Abel Fernandez, William R. Anderson, and Nancy E. Meagher
AF&RP-10 November 2000
A reprint from The Journal of Physical Chemistry A, vol. 104, no. 25, pp. 6003-6012,200O.
Approved for public release; distribution is unlimited.
The findings in this report are not to be construed as an official Department of the Army position unless so designated by other authorized documents.
Citation of manufacturer’s or trade names does not constitute an official endorsement or approval of the use thereof.
Destroy this report when it is no longer needed. Do not return it to the originator.

Army Research Laboratory Aberdeen Proving Ground, MD 2 10055066
ARL-RP-10 November 2000
Kinetics of the 0(3P) + N20 Reaction. 1. Direct Measurements at Intermediate Temperatures
Arthur Fontijn, Abdellatif Gournri, and Abel Rensselaer Polytechnic Institute
.
William R. Anderson Weapons and Materials Research Directorate, ARL
Nancy E. Meagher ASEE Postdoctoral Research Associate
Fernandez
A reprint from The Journal of Physical Chemistry A, vol. 104, no. 25, pp. 6003-6012,200O.
Approved for public release; distribution is unlimited.

Abstract
Rate coefficients for the consumption of 0 atoms by their reaction with N20 have been measured, at pressures from 130 to 500 mbar, using the high-temperature photochemistry technique. These represent the first direct measurements of k values of the reaction. The ground-state oxygen atoms were produced by laser photolysis of SO2, or by flash photolysis either SO2 or 02, and monitored by time-resolved resonance fluorescence. The results yield k(1075-1140 K) = 3.2 x 10-r’ exp(-9686KIT) cm3 molecule-’ s-l with 20 precision limits of +12% corresponding 20 accuracy limits of &26%. Results from several sources in the literature indicate a high sensitivity of the 0 + N20 reaction system to traces of H20, which increases the rates if present as a contaminant. For this reason, possible effects of traces of Hz0 on the results were modeled. Simulated decay curves with a hypothetical Hz0 contaminant were used as a test of the experimental data reduction procedures. Although the concentration of Hz0 needed to significantly affect the results is small, the amount that could have been present is even less and is shown to have had negligible effects. The results are in qualitative agreement with a recent T 2 1680 K shock tube study (D. F. Davidson, M. D. DiRosa, A. Y. Chang, and R. K. Hanson, ref 9) in that extrapolation of their results to the present temperatures indicates rate coefficients much larger than had been previously thought. However, though the results agree within error limits for such a long extrapolation, the present results are about a factor of 4 smaller. Combined with the results of the companion paper by Meagher and Anderson (ref 6, following paper in this issue), in which the prior literature is critically reevaluated, it is found that the 02 + N2 product channel dominates at the present temperatures.

Kinetics of the O(3P) + N20 Reaction. 1. Direct Measurements at Intermediate Temperatures
Arthur Fontijn, Abdellatif Goumri, and Abel Fernandez
High-Temperature Reaction Kinetics Laboratory, The lsermann Department of Chemical Engineering, Rensselaer
Polytechnic institute, Troy, New York 12180-3590
William R. Anderson and Nancy E. Meagher
U.S. Army Research Laboratory, Aberdeen Proving Grounds, Maryland 210055066
The Journal of
Physical ChemistryA” Reprinted from
Volume 104, Number 25, Pages 6003-6012

J. Phys. Chem. A 2000,104, 6003-6012 6003
Kinetics of the 0(3P) -I- N20 Reaction. 1. Direct Measurements at Intermediate Temperatures
Arthur Fontijn,” Abdellatif Goumri,t and Abel Fernandez
High-Temperature Reaction Kinetics Laboratory, The Isermann Deparhzent of Chemical Engineering, Rensselaer Polytechnic Institute, Troy, New York 12180-3590
William R. Anderson* and Nancy E. Meaghefl
U.S. Army Research Laboratory, Aberdeen Proving Grounds, Maryland 21005-5066
Received: December 23, 1999
Rate coefficients for the consumption of 0 atoms by their reaction with NrO have been measured, at pressures from 130 to 500 mbar, using the high-temperature photochemistry technique. These represent the first direct measurements of k values of the reaction. The ground-state oxygen atoms were produced by laser photolysis of SOr, or by flash photolysis of either SOr or 02, and monitored by time-resolved resonance fluorescence. The results yield k(1075-1140 K) = 3.2 x 10-t’ exp(-9686KIT) cm3 molecule-’ s-t with 20 precision limits of f12% and corresponding 20 accuracy limits of f26%. Results from several sources in the literature indicate a high sensitivity of the 0 + NaO reaction system to traces of HrO, which increases the rates if present as a contaminant. For this reason, possible effects of traces of Hz0 on the results were modeled. Simulated decay curves with a hypothetical H20 contaminant were used as a test of the experimental data reduction procedures. Although the concentration of Hz0 needed to significantly affect the results is small, the amount that could have been present is even less and is shown to have had negligible effects. The results are in qualitative agreement with a recent T L 1680 K shock tube study (D. F. Davidson, M. D. DiRosa, A. Y. Chang, and R. K. Hanson, ref 9) in that extrapolation of their results to the present temperatures indicates rate coefficients much larger than had been previously thought. However, though the results agree within error limits for such a long extrapolation, the present results are about a factor of 4 smaller. Combined with the results of the companion paper by Meagher and Anderson (ref 6, following paper in this issue), in which _ _ the prior literature is critically reevaluated, present temperatures.
I. Introduction
The role of nitrous oxide (N20) in combustion and its thermal decomposition have been studied extensively. Motivation for the present investigation stems from the fact that N20 is a major intermediate oxidizer species formed during the combustion of many types of solid propellants and their energetic raw materials.’ Therefore, it is important for the development of solid propellant models to understand the role of this oxidizer in the combustion process. N20 also plays a major role in the formation of NO, pollutants during combustion.2 In addition, dissociation of nitrous oxide offers the possibility of initiating combustion reactions by the atomic oxygen produced,3 and has been used as a test case for unimolecular reaction theories.4
O-tN,O-Not-NO AH0 = -36 kcal/mol (Rl)
O+N,O-02+N2 AH0 = -79 kcaUmo1 (R2)
An early critical review5 (BDH73) of the extensive literature published through 1973 on 0 + NzO and other reactions concluded that the two channels have identical rate coefficients:
k,(T) = b(T) = 1.7 x 10-‘0exp(-14100K/T) cm3
molecule-’ s-l (1200-2000 K) (1)
For the preceding reasons, it is important to understand the reactions of NrO with the three primary combustion radicals, H, 0, and OH. The reaction of NzO with 0 atoms, which plays major roles in both the combustion and the thermal decomposi- tion of NzO, has two significant product channels:
* Cm-rent address: Department of Chemistry, University of North Texas, Denton, TX 76203.
*Contribution performed in part as an ASEE Postdoctoral Research Associate at the U.S. Army Research Laboratory. Current address: Depart- ment of Chemistry and Physics, Texas Woman’s University, Denton, TX 76204.
Modeling of some of the experiments utilized to determine the kl recommendation of BDH73 has recently been performed. This work is discussed in detail in the following paper in this issue.6 The study has revealed that assumptions about the ancillary chemistry utilized in complex modeling to extract kl, or its reverse, from the data in some of the most important of the works cited in BDH73 are incorrect, invalidating both those results and the BDH73 recommendation. It is also shown in ref 6 that at temperatures below about 1700 K most of the currently available studies for k, and all for k2 are invalid. The kl expression from BDH73 strongly affects most of the later recommendations. Subsequent reviews have accepted the sound- ness of the choices made in BDH73 regarding the best values from early works. The expression given in eq 1 was used as
lO.l021/jp99447Ov CCC: $19.00 0 2000 American Chemical Society Published on Web 06/02/2000
it is found that the O2 + N2 prod&- channel dominates at the

6004 J. Phys. Chtm. A, Vol. 104, No. 25, 2000 Fontijn et al.
part of the fitted data to obtain a ki recommendation in ref 7 (HS85). Recommendations from HS85 for the two channels are
k,(T) = 1.2 x lo-lo exp(- 134OOKIT) cm3 molecule-’ s-l
(1200-4100 K) (2)
k*(T) = 1.7 x lo-lo exp(-141OOKIT) cm3 molecule-’ s-*
(1200-3200 K) (3)
These expressions only differ modestly from those of BDH73. The recommendations of HS85 were subsequently accepted in a review pertinent to propellant chemistry modeling.8 However, a recent high-temperature shock tube determination9 (DDCH92), which involved direct UV absorption measurements of the 02 and NO products, yielded a very different result:
significantly affect the results. Although the necessary amounts are very small, the effects of Hz0 are proven to be insignificant. Results have been obtained for the total reaction rate coefficients, km, = kl + kz, in the temperature range 1076-1276 K.
In the companion paper,6 an evaluation of all literature relevant to the title reaction and new recommendations for kl and k2 are presented, utilizing all retained data to provide fits. The present experimental results are that ktot is indeed much larger at intermediate temperatures than had been previously believed, but not as large as extrapolation of DDCH92 would suggest.
II. Experimental Procedures
k,(T) = 4.8 x lo-” exp(- 1165OKIT) cm3 molecule-’ s-l
(1680-2430 K) (4)
k(T) = 2.3 x lo-l2 exp(-5440KIT) cm3 molecule-’ s-l
(1940-3340 K) (5)
ki from DDCH92 agrees very well with that from HS85. But, although the magnitude of kz is similar to that of previous expressions at -2000 K, the slope of the Arrhenius plot is very different. The activation energy, Ea, corresponding to k2 is only 11 kcal/mol as opposed to -28 kcalZmo1 from prior sources. Thus, extrapolation of the kz expression to lower temperatures, where few data are available, would lead to much larger total rate coefficients than yielded by the earlier expressions. The two sets of expressions from HS85 and DDCH92 were recently tested by comparison of flow systemdata on COZN2OZHzOZN2 mixtures at 950-l 123 K vs modeling results using a complex mechanism.iO That work concludes that the data favor adoption of expressions from HS85 rather than DDCH92. However, rate coefficients of magnitude between those of HS85 and DDCH92 were not tested. The expressions from DDCH92 are recom- mended in a recent critical review” with an admonition that there is still “appreciable uncertainty” regarding kz.
The older style HTP reactorI was used. Briefly, it consists of an alumina reaction tube (5.1 cm i.d.) which is surrounded by helical Sic heating elements and insulation and enclosed in a water-cooled, steel vacuum chamber. To achieve the desired temperatures without decomposition of the reactant gases, a movable, air-cooled inlet is used. After emerging, the gases are mixed with the heated Ar bath gas. The residence time needed for the mixture to reach the reaction zone is adjusted so that the reactant gases are at least 95% mixed with Ar.14 The temperature of the reaction zone was measured before and after each experiment by a Pt-Pt/l3% Rh thermocouple, which was doubly shielded to minimize radiation effects. An FPI pressure transducer was used. The gas flow rates were controlled by Teledyne-Hasting flow controllers.
Ground-state 0(3P) atoms were generated by laser photolysis of SO2 at 193 nm or by flash photolysis of either SO2 (through a Suprasil Quartz window) or 02 (through a MgFz window). The decrease in the relative concentration of 0(3P) atoms was monitored by fluorescence of the 130.2-130.6 mn resonance triplet. The fluorescence was induced by a cw microwave discharge lamp, through which flowed 99.999% He which contains 02 as an impurity. A CaF2 lens was used to focus the 0 atom radiation and filter Lyman a-radiation. The 0 atom fluorescence was detected by a solar blind photomultiplier tube (PMT) and fed to a multichannel scaler signal averager.
The 0 -I- N20 reaction is important at all temperatures for propellant chemistry. Temperatures between 1200 and 1600 K are especially pertinent to modeling the dark zone structure of solid propellants (nonluminous gaseous region between the condensed-phase propellant and luminous flame zonela). The uncertainty regarding the extrapolation to lower temperatures and the lack of any prior measurements under isolated conditions indicated a need for a direct determination of the reaction rate coefficients at temperatures below 1700 K. The analysis errors in prior works indicated a need for a thorough reassessment of the literature regarding this reaction. Note in this and the companion paper, 6 “intermediate temperatures” refer to the approximate range 1000-1700 K and “high temperatures” to higher values.
.
The experiments were csrried out under pseudo-first-order conditions, where [0] << m20] -X [Ar]. Under these conditions, the fluorescence intensity I, which is proportional to [O], is expressed by
Z = Z, exp(-&it) + B (6)
The first measurements of the title reaction under conditions in which it is clearly isolated from the effects of other reactions (that is, complex modeling with heavy reliance on ancillary
I kinetic data is not required to extract the rate coefficients) are reported in this paper. Measurements of the total rate of 0 atom
‘disappearance in an excess of known concentrations of N20 were performed at the Rensselaer Polytechnic Institute @PI) using the I-HP (high-temperature photochemistry) technique. Modeling of the possible effects of Hz0 as a contaminant, whose effects have been suggested in another recent NzO study,12 was done at the U.S. Army Research Laboratory. The modeling provides an estimate of the concentrations of Hz0 necessary to
where kpsl = k,,[NzO] is the pseudo-first-order rate coefficient, I,, + B the intensity at time t = 0, and B the background, due mainly to scattered light. The values of kpsi were obtained by a weighted fit of the observed I vs t profiles to eq 6.15 Typically, five or six kpsi measurements at varying [NzO], with the minimum [NzO] a factor of about 5-10 lower than the maximum values listed in Table 1, were used to obtain km, at the temperature and pressure of the experiment.
The exponentiality of the I vs t plots was tested by a two- stage residual plot analysis consisting of, first, a visual inspection of the plotted residuals (experimental minus fitted values) and, second, a runs test.16 The data must pass both tests. An example of an experimental [0] decay, its fit to eq 6, and the associated residuals plot are given in Figure 1. The residuals consist of both positive and negative values. In Figure 1, these occur in a band centered about zero; thus, that decay passes the visual inspection test. For a given decay, the runs test gives a measure of how “random” the residuals are by comparing the actual number of rnns (the number of groups of adjacent residuals

Kinetics of the O(3P) i- NzO Reaction J. Phys. Chem. A, Vol. 104, No. 25, 2000 6005
TABLE 1: Summary of Rate CoeffXent Measurements on the 0 + NzO Reaction
(G P WI [photolytel
&) NOlm
(10’5 cm+) (A) D
(mW (1 018 cms3) (lOI cm-s) k f ok,
(cm s-1) ( lo-t4 cm3 molecule-1 s-t)
1076 413 2.78 1.72 40 4.00 17 12 0.36 f 0.02 1076 492 3.31 4.84 27 3.00 10 7 0.45 * 0.01 1097 375 2.47 2.35 33 4.30 10 9 0.45 * 0.04 1099 283 1.87 1.60 40 3.70 10 14 0.40 l 0.01 1101 197 1.30 1.5Y 13d 3.42 8 14 0.48 f 0.06 1121 228 1.47 9.606 22d 2.90 8 11 0.55 f 0.03 1132 320 2.04 5.01
Gd 3.12 10 13 0.71 l 0.06
1141 355 2.24 7.94c 4.50 8 6 0.62 f 0.14 1142 133 0.84 2.5W 13d 3.10 10 16 0.75 & 0.06 1142 324 2.05 3.24c 226 4.32 10 8 0.53 It 0.07 1178 496 3.05 4.15 40 4.40 10 7 1.12 * 0.12 1178 549 3.45 4.70 27 4.50 16 7 1.01 f 0.08 1179 495 3.10 2.58 13 3.40 5 9 1.55 f 0.14 1179 556 3.40 4.85
:; 4.00 10 8 1.57 f 0.11
1202 148 0.89 3.66’ 2.11 10 16 1.40 * 0.15 1219 328 1.95 9.8W 226 2.50 17 9 1.29 f 0.07 1230 475 2.80 5.50 47 5.80 10 8 2.02 f 0.20 1230 526 3.14 6.12 13 7.10 10 7 1.38 f 0.06 1251 176 1.00 8.00” 9d 2.40 8 14 2.61 f 0.14 1272 400 2.30 2.80 20 4.07 10 10 3.06 It 0.13 1273 345 1.97 4.1 40 4.72 10 10 2.% i 0.12 1276 403 2.28 2.52 33 4.48 6 10 3.02 f 0.18
’ dT = 3~2%. b 9 was photolyzed by the flash lamp through a MgFz window. c SOr was photolyzed by the flash lamp through a Suprasil window. d For these flash-lamp experiments these energies are in joules; all of the other experiments used laser photolysis of SOz, with energies expressed in millijoules.
- 3
2400
z 0 2200 z
.g 2000 z
d E 1800
2 1600
s 8 k
1400
2 1200
100
0.00 0.04 0.08 0.12
Time (seconds)
0.16
Figure 1. Example experimental [0] decay and residuals plot at 1142 K, total pressure 133 mbar, and [NzO] = 1.1 x lOI cmm3. The fitted I,, kpslr and B values are 1088.7, 34.67 s-l, and 1300, respectively. Z = -0.014. Contribution to kpst due to diffusion found by fitting the ([NzO], kpst) data, kd = 26 s-l. Upper panel: measured decay (points) and fit to eq 6 (curve). Lower panel: residuals plot; a line is drawn at zero in the lower panel as an aid for visual inspection.
having the same sign), U, to the mean number of such runs expected for the number of data points used in the fit. Assuming that the number of runs follows a normal distribution, the
deviation of u from the mean is given by the unit normal deviate, Z.16J7 Z gives a quantitative measure to decide whether the residuals are randomly distributed about the fitted curve. We have found that a stringent and adequate criterion is IZI I 1.5; this corresponds to a rejection region in the 6.68% tails of the normal distribution.
The possible effects of contaminants, especially H20, on the NzO system reactions are of considerable concern. Normal precautions in performing the experiments are described below to emphasize the validity of the data presented herein. All supply lines leading to the reactor are kept at pressures above atmospheric up to the flow controllers which are in line just prior to the reactor. All parts of the apparatus, especially the flow lines at subatmospheric pressure, were regularly checked with a helium leak detector. The reactor, as a matter of course, is continuously baked out at high temperature; thus, it cannot be a source of significant H20. Therefore, there are two major contaminant sources to consider, the supply gases and air leaks. Only high-purity gases were used (see below). It is only important to consider the Ar carrier gas since the others are present in much smaller amounts and were passed through drying towers. The carrier could have up to 20 ppm impurity. However, the carrier is stored as a liquid and vaporized as needed during the experiments. Thus, any impurities in the carrier must have a very low boiling point to pass into the test mixture. Hz0 from this source is clearly excluded. Air leaks would lead to addition of, mainly, Nz, 02, Ar, and Hz0 to the test mixture. The first three would have no effect on the present experiments. Since the modeling indicates a very high sensitivity to Hz0 as a contaminant, a measurement of the air leak rate was performed at operating temperatures. From this, it was inferred that the maximum concentration of Hz0 which could possibly be present in the reactor is 0.2 ppm, assuming a laboratory relative humidity of 100%.
,
The gases used were N20 (99.99%) from Matheson, 5% 02 (99.99%) in Ar (99.998%) from Scott, 1% SO:! (99.98%) in Ar (99.998%) from Matheson, and Ar (99.998%) from the liquid (Praxair).
6006 J. Phys. Chem. A, Vol. 104, No. 25, 2000 Fontijn et al.
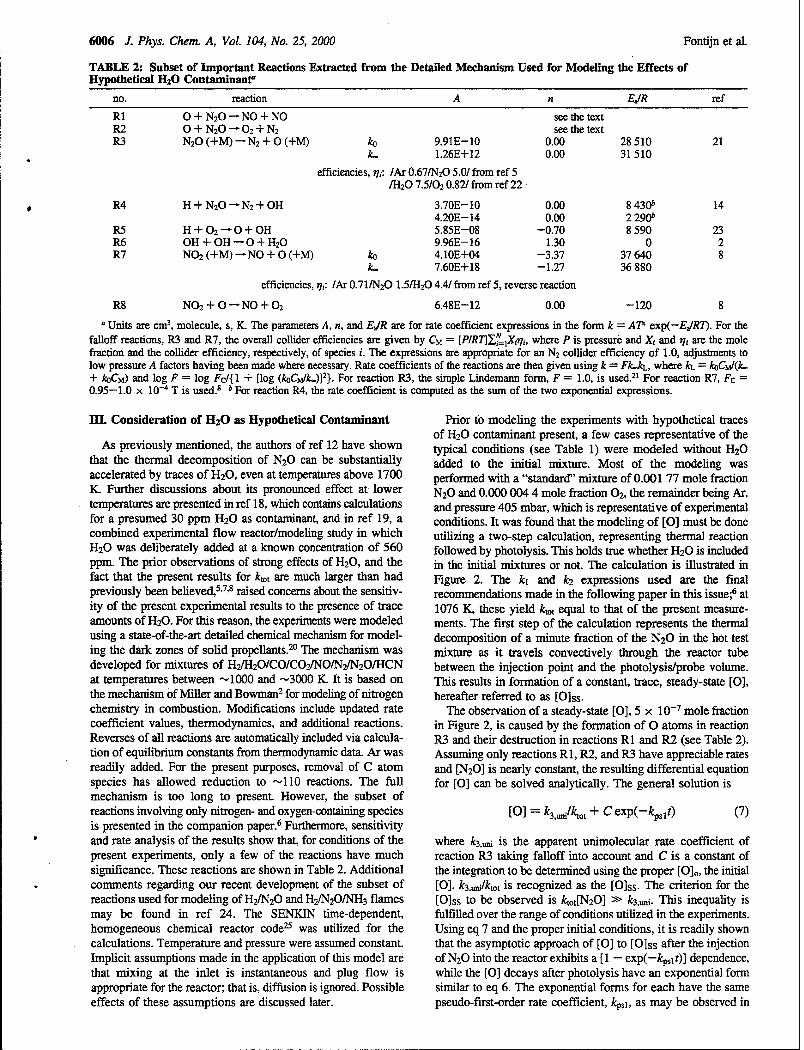
TABLE 2: Subset of Important Reactions Extracted from the Detailed Mechanism Used for Modeling the Effects of Hypothetical IX20 Contaminant
IlO.
: R3
reaction A n EJR ref
O+NzO-NO+NO see the text O+N~O-O~+NZ see the text N20 (+M) - Nz + 0 (+M) ko 9.91E-10 0.00 28 510 21
k, 1.26E+12 0.00 31510
efficiencies, vi: /Ar 0.67/&O S.O/ from ref 5 /I&O 7.5/a 0.82/ from ref 22
R4
R5 R6 R7
H+NzO-Nz+OH 3.7OE-10 0.00 4.2OE-14 0.00
H + 02 -O+OH 5.85E-08 -0.70 OH+OH-O+HzO 9.%E-16 1.30 N02 (+M) -NO + 0 (+M) ko 4.1OE+O4 -3.37
k, 7.6OE+18 -1.27
efficiencies, vi: k 0.71/&O 1.5IHzO 4.41 from ref 5, reverse reaction
8 43ob 14 2 29ob 8 590 23
0 2 37 640 8 36 880
R8 N&+0-NO+02 6.48E-12 0.00 -120 8
o Units are cm3, molecule, s, K. The parameters A, n, and EJR are for rate coefficient expressions in the form k = AP exp(-EJR7). For the falloff reactions, R3 and R7, the overall collider efficiencies are given by CM = [P/RT]C~,X~~i, where P is pressurk and Xi and vi are the mole fraction and the collider efficiency, respectively, of species i. The expressions are appropriate for an N2 collider efficiency of 1.0, adjustments to low pressure A factors having been made where necessary. Rate coefficients of the reactions are then given using k = Fk&, where kL = &T&k. + k&) and log F = log Fc/{ 1 + [log (k&&J]2}. For reaction R3, the simple Lindemarm form, F = 1.0, is ~sed.~l For reaction R7, Fc = 0.95-1.0 x 10e4 T is used.s b For reaction R4, the rate coefficient is computed as the sum of the two exponential expressions.
IIL Consideration of Hz0 as Hypothetical Contaminant
As previously mentioned, the authors of ref 12 have shown that the thermal decomposition of N20 can be substantially accelerated by traces of H20, even at temperatures above 1700 K. Further discussions about its pronounced effect at lower temperatures are presented in ref 18, which contains calculations for a presumed 30 ppm Hz0 as contaminant, and in ref 19, a combined experimental flow reactor/modeling study in which Hz0 was deliberately added at a known concentration of 560 ppm. The prior observations of strong effects of H20, and the fact that the present results for kWt are much larger than had previously been believti5*‘ys raised concerns about the sensitiv- ity of the present experimental results to the presence of trace amounts of H20. For this reason, the experiments were modeled using a state-of-the-art detailed chemical mechanism for model- ing the dark zones of solid propellants.2o The mechanism was developed for mixtures of H2/H20/CO/C02/NO~~2O~CN at temperatures between -1000 and -3000 K. It is based on the mechanism of Miller and Bowman2 for modeling of nitrogen chemistry in combustion. Modifications include updated rate coefficient values, thermodynamics, and additional reactions. Reverses of all reactions are automatically included via calcula- tion of equilibrium constants Erom thermodynamic data. Ar was readily added. For the present purposes, removal of C atom species has allowed reduction to -110 reactions. The full mechanism is too long to present. However, the subset of reactions involving only nitrogen- and oxygen-containing species is presented in the companion paper.6 Furthermore, sensitivity and rate analysis of the results show that, for conditions of the present experiments, only a few of the reactions have much significance. These reactions are shown in Table 2. Additional comments regarding our recent development of the subset of reactions used for modeling of Hz/N20 and H$N2OiNH3 flames may be found in ref 24. The SENKIN time-dependent, homogeneous chemical reactor code2* was utilized for the calculations. Temperature and pressure were assumed constant. Implicit assumptions made in the application of this model are that mixing at the inlet is instantaneous and plug flow is appropriate for the reactor; that is, diffusion is ignored. Possible effects of these assumptions are discussed later.
Prior to modeling the experiments with hypothetical traces of Hz0 contaminant present, a few cases representative of the typical conditions (see Table 1) were modeled without Hz0 added to the initial mixture. Most of the modeling was performed with a “standard” mixture of 0.00177 mole fraction NzO and 0.000 004 4 mole fraction 9, the remainder being Ar, and pressure 405 mbar, which is representative of experimental conditions. It was found that the modeling of [O] must be done utilizing a two-step calculation, representing thermal reaction followed by photolysis. This holds true whether Hz0 is included in the initial mixtures or not. The calculation is illustrated in Figure 2. The kl and kz expressions used are the final recommendations made in the following paper in this issue$ at 1076 K, these yield k,, equal to that of the present measure- ments. The first step of the calculation represents the thermal decomposition of a minute fraction of the N20 in the hot test mixture as it travels convectively through the reactor tube between the injection point and the photolysis/probe volume. This results in formation of a constant, trace, steady-state [O], hereafter referred to as [O]ss.
The observation of a steady-state [0], 5 x 10m7 mole fraction in Figure 2, is caused by the formation of 0 atoms in reaction R3 and their destruction in reactions Rl and R2 (see Table 2). Assuming only reactions Rl, R2, and R3 have appreciable rates and [NzO] is nearly constant, the resulting differential equation for [0] can be solved analytically. The general solution is
PI = k3,ti&ot + C exP(+& (7)
where k3.e is the apparent unimolecular rate coefficient of reaction R3 taking falloff into account and C is a constant of the integration to be determined using the proper [0],, the initial [O]. k3,Jktot is recognized as the [O]ss. The criterion for the [O]ss to be observed is k&N201 B k3,,,,+ This inequality is fulfilled over the range of conditions utilized in the experiments. Using eq 7 and the proper initial conditions, it is readily shown that the asymptotic approach of [0] to [O]ss after the injection of NzO into the reactor exhibits a [ 1 - exp(-kplt)] dependence, while the [0] decays after photolysis have an exponential form similar to eq 6. The exponential forms for each have the same pseudo-first-order rate coefficient, kpsl, as may be observed in

Kinetics of the 0(3P) + NzO Reaction J. Phys. Chem. A, Vol. 104, No. 25, 2000 6007
N20 decomposition at the higher temperatures. Because this decomposition leads to NO and NO2 formation, the -R7 and R8 reaction sequence may be important at the highest temper- atures utilized (-R7 indicates the reverse of reaction R7). The consequences will be discussed later.
When hypothetical traces of Hz0 were added to the modeling mixtures, both [0] and [OH] during the thermal decomposition step increase to nearly constant plateau levels after a small fraction of the residence time. Between the inlet tube and the photolysis zone, the [OH] builds to a trace value due to N20 + M- N2 + 0 + M (R3) and 0 + H20 - OH + OH (-R6). After the photolysis pulse, in addition to reactions Rl -R3, the reactions H + N20 - 0H+N2(R4)andO+OH-02+H (-R5) are predicted to have the largest effects, accelerating the 0 atom decays. Note that reaction R4 combined with reaction -R5 represents a cycle catalyzed by H and OH. Therefore, even though only small traces of H and OH could be present, these species would not be consumed during the [0] decrease. This fact explains why the effects of even a few parts per million Hz0 as a contaminant could significantly alter the resulting apparent rate coefficient.
For the present experimental conditions, modeling indicates Hz0 would increase both the rates of [0] growth to constant [O]ss levels during the thermal decomposition step and the decay rates to these levels in the photolysis step by equal amounts. Plots of the predicted [0] decreases with [Hz01 in the mixtures appeared to be exponential upon visual examination. However, fits of these decays to eq 6 revealed such mixtures would actually produce small deviations from exponential behavior. For example, the differences between predicted [0] decreases and exponential fits were about 5% relative to [0], - [O]ss for 5-20 ppm H20.
Parametric studies of the fitted decays have revealed two additional features of the chemical system. These features would complicate detection of the effects of H20. First, the predicted order of the rate in [N20] is fairly close to unity, for the range of [N20] used in the experiments, if all other variables are held constant. Second, the order in [Hz01 is much less than unity (0.33 at 1076 K; 0.4 at 1276 K). These characteristics make ruling out possible systematic errors due to the presence of Hz0 nontrivial because (1) small deviations from exponential behavior are difficult to see in real data with noise and (2) the [NzO] order being near unity means plots of predicted kpsl vs [N20] exhibit approximately linear behavior despite the assumed [HzO]. Also, the standard procedure followed in the experiments to reveal the presence of contaminants or impurities is to widely vary reactant and carrier gas partial pressures. Were a contami- nant present, this procedure would yield differing reactant-to- contaminant ratios. It is expected that varying these ratios will reveal the presence of appreciable contaminant effects because extracted rate coefficients will exhibit systematic trends. How- ever, since the predicted order in [Hz01 is small, the effect of varying Hz0 contaminant-to-reactant ratios would not be as large as one expects for a contaminant of higher reaction order.
An example of a predicted [0] decrease with significant [Hz01 present is shown in Figure 3, upper panel. In this example, the standard mixture with 5 ppm Hz0 added was used with the standard pressure and an assumed temperature of 1076 K. The HS85 kl and k2 expressions were used. Also shown in Figure 3, upper panel, is a least-squares fit of the exponential function of eq 6 to the simulated decay curve, the time intervals in the latter having been first interpolated to match the data sampling rate of the experiment. As can be seen, although the predicted decay curve looks nearly exponential, the exponential fit is not
3.0 ,
2.5 ” Calculation
Step 1 ++-
Calculation + Step 2
/ / I
L
0.0 0.5 1.0 1.5 2.0
Time (seconds) Figure 2. 0 atom profile for an example modeling run. The example used the standard mixture (no Hz0 present) and pressure described in the text, and 7’~ 1076 K. The klol value used is taken from ref 6. The portion from 0 to 1 .O s, a typical residence time, indicates exponential [0] increase to a constant, steady-state level due to thermal reaction of a small fraction of the NzO during that period. Photolysis was assumed to occur at 1.0 s. The exponential decay titer photolysis represents the experimentally measured quantity.
Figure 2. These curious characteristics result from decomposition producing the reactant radical and would occur in other, similar cases. Because the [O]ss is constant, its presence does not adversely affect the extraction of kpsl via fits to eq 6. The value of the [O]ss formed during the thermal reaction phase, and to which [O] decays after the photolysis, is independent of [NzO] as long as an appreciable [N20] is present. Following these predictions, experiments have shown, by observing background variation vs reactor temperature, that the [O]ss can contribute substantially to the background constant, B, in eq 6.
The concentrations of all species except 0 atoms at the end of the thermal reaction step are then used as initial conditions for the second, photolysis step of the calculation. The calcula- tions indicate that if the thermal reaction step is ignored and the modeling is initiated with an assumed [O] formed by photolysis smaller than that found at the steady state, then the [O] is predicted to increase to the [O]ss after the photolysis pulse. Growth in [O] after the pulse contradicts the experimental observations, proving the necessity of the thermal decomposition calculations.
For the photolysis step, the initial [0] is increased above the [O]ss, and the calculation is reinitiated. The [0] then decays back to the baseline [O]ss (see Figure 2). Fits of the simulated decays to eq 6 are excellent. These fitted kpsl values almost exactly reflect the assumed values of kmt and initial [N20], as expected, at the lowest temperatures used. However, possible deviations were predicted due to contributions from significant

6008 J. Phys. Gem. A, Vol. 104, No. 25, 2000 Fontijn et al.
j 0.8 x ii a2
0.6
6 E E 0.4 0
z
Q 0.2
“0
; 0.4
2 0.2 .I E 0.0
g S -0.2 Y 5 -0.4 ‘i: E -0.6 E fj -0.8
0.0 0.1 0.2 0.3 0.4 0.5 Time (seconds)
Figure 3. predicted 0 atom decay curve (up& panel) and residual plot (lower panel) with Hz0 as a hypothetical contaminant at 5 ppm. In the upper panel, the solid line represents the [0] profile, while the dotted line shows the least-squares fit to an exponential function, eq 6, for the oxygen atom decay. An enlargement of the early-time [0] curve is presented in the inset in the upper panel, revealing the deviation from exponential behavior. kl and k2 from HS8S7 were used. The assumed conditions were identical to those in Figure 2.
perfect; the differences are undoubtedly very much larger than the numerical error of the SENKIN code. At short times, the exponential fit is slightly higher than the predicted “experimen- tal” decay curve, crosses it at 0.014, 0.075, and 0.373 s, and finally approaches the same baseline asymptotically at long times. A plot of the residua@ of the fitting procedure is shown in Figure 3, lower panel. If the predicted curve were exponential, the residuals would be zero at all times. However, the residuals plot has a strange shape, reflective of the slight difference from exponential decay shown in the upper panel, with zeros at the points where the upper panel curves cross.
.
.
The following question naturally arises: If the HS85 recom- mended rate coefficients were correct, and if enough Hz0 had been present in the current experiments to account for the measured decays, would the experimental data reduction procedures have revealed the deviation from exponential@ and led to rejection of the data? To answer this question, simulated decay curves were prepared. Enough constant-level white noise was added, using a random number generator, to mimic the S/SC ratios observed in typical experiments. Here, S/SC is defined as the signal-to-scatter ratio, where S is equivalent to I,,, and SC is the full width of scatter at the baseline. One such curve, with exponentia1 fit, is shown in Figure 4, upper panel. The curve has S/SC = 5; larger S/SC values were achieved in most of the actual experiments. The corresponding residuals plot is shown in Figure 4, lower panel, which demonstrates that the band of residuals from noisy “data” is centered about the noise-free plot
6 0.0 0.1 0.2 0.3 0.4 0.5 Time (seconds)
Figure 4. predicted 0 atom decay curve with random noise added (upper panel) and corresponding residuals plot (lower panel). Assumed conditions are the same as for Figure 3, except that noise has been added to simulate a S/SC (signal-to-scatter ratio) of 5. The solid line in the upper panel is the fit of the simulated data points to eq 6. The noise-free residuals plot from Figure 3, lower panel, is repeated as the solid curve in the lower panel here to demonstrate that the scatter envelope is centered about the noise-free plot, as expected.
as one would expect. The unusual departures at short times from the expected band centered about zero would have been detected even by visual inspection during data reduction, if present in the actual experiments.
The simulated case in Figure 4, upper panel, with S/SC = 5 and 2 = -1.28 shows that such a low S/SC would not cause the runs test to lead to data rejection. However, the unusual shape of the residuals plot shown in the lower panel would be the basis for rejection of the data using the visual inspection method. A similar example was tested with S/SC = 10, which resulted in Z = -2.25 and an even more unusual residuals plot; the result is rejection of the data by either method. The nonexponentiality of the simulated [O] decreases in the presence of 5 ppm Hz0 becomes more obvious as the S/SC ratio increases. In the experiments, attempts to increase S/SC by averaging results from more photolysis flashes would have been made in such a case. However, such efforts could only have resulted in an increased awareness of the nonexponentiality of the decays. Many of the experimental decays have S/SC L 10. All the experimental [0] decays, such as in Figure 1 with S/SC x 6, pass both tests of exponential&y, thus yielding strong evidence that [Hz01 cannot be as high as 5 ppm in the actual experiments.
IV. Results
The determinations of k,, are summarized in Table 1. The experimental parameters P, total pressure; [Ml, the total gas

Kinetics of the 0(3P) + N20 Reaction J. Phys. Chem. A, Vol. 104, No. 25, 2000 6009
1-
Temperature, K 1250 1136 1042
I I I I
7.6 8.0 8.4 8.8 9.2 9.6
(l/T) x 104, K-’ Figure 5. Arrhenius plot of measured data points fork,,. The solid
sy’mbols represent retained data, while the open symbols represent data
rejected from the final fit for recommended rate coe&ients. Key: . . . . . . least-squares fit to the present measurements;
- recommendation from Ref. 6, fit to retained literature data
using only the present 10 lowest-temperature data points; - -fit to
retained literature data including all present measurements; 0, l the
0 atom source was So2 laser photolysis; O,+ theOatomsource
was SO2 flash-lamp photolysis; A.A theOatomsourcewas02
flash-lamp photolysis.
concentration; z, the distance from the top of the cooled inlet to the center of the reaction zone; E, the average linear gas velocity; [photolyte], the concentration of the 0 atom precursor; and F, the energy of the laser or the flash lamp, were varied over wide ranges. To demonstrate that the rate coefficients do not depend on any of these parameters, plots of [k(T) - kJ/ k(T) vs these parameters were made (not shown), where k(T) represents the rate coefficients obtained from the fit expression given below and ki are the individual k,,, rate coefficients measured. These residuals plots are independent of these parameters. To avoid systematic errors due to the nature of the 0 atom precursor or the photolysis source, two precursors (SO2 or 02) and laser photolysis or flash photolysis were used. No dependence on these factors is found, either. Below 1076 K the reaction became too slow for accurate measurements. Attempts at measuring k,, at temperatures above 1276 K exhibited increasing scatter and a dependence on residence times, indicating significant decomposition of the N20. These measurements were disregarded.
Figure 5 shows the present data fitted to the form A exp(- E,IRT) where &ok, and fqfT = 2% contribute to the weighting of each point. The fitted expression is
k;,,(1075--1275 K) = 2.7 x 10d9 exp(-14580KIT) cm3
molecule-’ s-* (8)
The variances and covariance are ~~~ = 1.02 A2, a2 = 1.41 x 10⁶, and a,@ = 1.2 x 10³ A. The variances and covariance are combined by the method of Wentworth, which yields a precision at the 2u level of rt12% to f22%, depending upon temperature. Allowing +20% for any unrecognized systematic errors then leads to a 20 accuracy level of f29%.
In modeling the present experiments, computations for the highest temperatures used predict that during its travel down the reactor tube a substantial portion of the N20 could decompose, producing, among other species, N2, NO, and NO2. Predictions indicate formation of NO and NO2 could substan- tially increase the observed rate of 0 atom decay by catalysis via the -R7 and R8 reaction sequence. Simulation indicates that if this were to occur, the [0] decays would still be closely exponential; pseudo-first-order kinetics are obtained because [NzO], [NO], and [NO21 are nearly constant on the time scale of the decays. However, the situation is complicated because this effect would be compensated by a decrease in the decay rate due to a substantial decomposition of the N20. The situation is too sensitive to key rate parameters for reliable quantitative prediction and, indeed, even to bc sure whether the measured km, values would be low or high. Calculations indicate the N20 decomposition and NO/N02 catalytic effect are altogether negligible at the lower temperatures used. However, it cannot be accurately assessed at what temperature these effects become important. At high enough temperatures, reactant decomposition generally results in a large amount of scatter in measured rate coefficients; this is what was observed above 1280 K. Although there does appear to be slightly higher scatter in the 1178- 1276 K portion of the data, the difference vs scatter at the lower temperatures is not large. In addition, the predicted temperature at which NzO decomposition becomes important might be -5O- 100 K different fmm experimental observations for several reasons: (1) the amount of decomposition predicted depends swngly on assumed rate coefficients and their uncertainty limits, especially k3, (2) during the first few centimeters of travel through the tube past the injection point, the NzO must mix with hot gases and reach thermal equilibrium before much reaction commences, and (3) during travel through the tube, reactant gases come into contact with the wall; for O-atoms, this results in a constant, diffusion-related loss (wall recombina- tion), reducing the background [O]ss discussed in the previous section. There is no simple way to include these effects in the modeling. Since the rate constant for loss due to diffusion is essentially constant as [N20] is varied, it does not affect the reliability of the predictions. Therefore, diffusion was ignored in the computations. However, the effect could reduce the amount of N20 decomposition in the experiments, as compared to the model, because the [O]ss and, hence, the rates of reactions Rl and R2 are reduced.
Since the 1178- 1276 K data have survived the exponentiality tests and do not exhibit great scatter, they have been presented in Table 1. Nevertheless, there is slightly larger scatter in that temperature range as opposed to the lower temperature portion of the data. Also, there appears to be a trend toward slightly larger Z values in the higher temperature portion of the data set (not shown), though the values meet standards normally used (IZI 5 1.5). When all 22 of the present data points are included in the fit to obtain recommendations for kl and k2 expressions (the present data set plus nine from the literature; see ref 6), a skewing of the slope of kmt from the overall fit vs the trend of
.

6010 J. Phys. Chem. A, Vol. 104, No. 25, 2000 Fontijn et al.
the present full data set results, Figure 5. A linear fit of the 12 highest temperature points has a suspiciously high A factor of 1 x 10Tg cm3 molecule-1 s-l, as does the fit to all 22 points, eq 8. Further, this 12-point fit has a slope about 1.4 times that of the 10 lowest temperature points. This slope change seems large for such a short temperature range. These observations may be indicative of an underlying systematic effect. These considerations, coupled with the modeling prediction that decomposition likely increases & values toward the high- temperature end of the data set, have led us to retain only the lower temperature portion of the data in the fit for recommended values. As can be seen in Figure 5, when only that portion is used, the overall fit passes through those 10 points with excellent agreement in slope. Fitting those 10 points at lowest tempera- tures alone, the recommended result of the present work is
to temperatures of the present study. The I-lTP data fall between the two earlier results. The present data agree with DDCH92 in that ktot is much larger at low temperatures than had been thought previously (e.g., HS85). At the low-temperature end of the current da@ the results are a factor of 5 larger than the HS85 recommendation, well outside tolerances (-50%) implied by a short extrapolation of the recommendation. They are a factor of 4 smaller than an extrapolation of the DDCH92 results. Considering the error limits in the kl and k2 expressions from DDCH92, the present results are within tolerances of the extrapolation of the DDCH92 results, although such a long extrapolation is a suspect procedure.
&(1075-1140 K) = 3.2 x 10-l’ exp(-9686KIT) cm3
molecule-’ s-l (9)
(not shown). The corresponding 2u precision and accuracy limits are f12% and &26%, respectively.
v. Dlscusslon
The assumption of 5-10 ppm Hz0 used for much of the modeling in section III is of special interest. A 5 ppm concentration is required at the highest temperatures and 10 ppm at the lowest temperatures used in the experiments to explain the observations if the HS85 rate coefficient expressions were correct and conjectural Hz0 contamination caused the fast observed [0] decreases. The computed decay in Figure 2, which was obtained with tt values equal to those measured in the present experiments at 1076 K and no Hz0 in the modeling mixture, has a 0.037 s half-life, which is typical of the experiments. If instead the HS85 ki and k2 values are used for the same conditions, the computed half-life is 0.134 s. Retaining the HS85 k values, but including 5 ppm Hz0 in the initial mixture, as in Figure 3, upper panel, the half-life is 0.047 s. With 10 ppm H20 and the HS85 k values, the half-life is 0.037 s (not shown). These results demonstrate the potentially large effect of Hz0 as a contaminant. However, the modeling results also clearly indicate that if 5 ppm or more Hz0 had been present, the experimental residual analysis procedures would have revealed an underlying problem. Such is not the case, leading to the conclusion that the HS85 values are too small for the present temperature range. Predictions were also made assuming concentrations of Hz0 less than 5 ppm. At [Hz03 5 1.5 ppm, it is uncertain whether the residuals analysis would have detected the nonexponentiality of the decays. However, as discussed in detail in the Experimental Section, the [Hz01 could not have been higher than 0.2 ppm. This value is a very conservative estimate. Therefore, calculations were performed with and without 0.2 ppm Hz0 in the initial mixture, using either the HS85 rate coefficients or those measured in the present work. The difference in decay rates caused by such a trace amount of Hz0 is calculated to be only a few percent, which is negligible considering the experimental tolerances. Thus, it has been shown on the basis of two lines of reasoning that Hz0 contamination in the experiments cannot account for the diflerence between the present rate coeficients and the smaller ones from previous recommendations.
In Figure 6, the present retained data are compared to other results of interest. First, consider the HS85 recommendation7 and the DDCH92 result9 for kut (obtained in each case by adding kl(T) and k$“) expressions). Note both have been extrapolated
The present data are further compared with recent data on the title reaction in Figure 6. The solid curve is the recommended k](T) + kz(T) from the following paper in this issue.6 The high- temperature portion of this fit is in fair agreement with prior recommendations.5~7~8~11 Also shown at high temperatures is the result for kz from DDCH92. As can be seen, at high tempera- tures, kz from DDCH92 is much smaller than k,,; their measured kl and kz values indicate that kl (not shown) is considerably larger than kz above -2050 K and that kl and kz are equal at -2050 K. Their measurements on k2 extended to a lower limit of 1940 K. At this temperature, because of the error limits in the reported expressions, one cannot conclude directly that k2 > kl. However, on the basis of their fitted expressions, the authors of DDCH92 suggested k2 dominates below -2050 K. Estimates for the kl expression of the critical review,‘j obtained using the retained measurements of kl from the literature prior to fitting, indicated the proper kl rate coefficients would be much smaller at the temperatures of the present study than the presently observed kmt values. Thus, the present experimental klor results, combined with the retained kl values,6 yield the conclusion that 02 i- N2 is the primary intermediate temperature product channel, confirming the DDCH92 suggestion.
Also shown in Figure 6 are the results of earlier intermediate temperature measurements. The recent upper limit ktot values from Ross et al.27 disagree rather strongly with the present results. Their upper limit data points result from complex modeling of shock tube experiments designed primarily to obtain rate coefficients for NrO -I- M. It is theoretically difficult to reconcile such small intermediate temperature rate coefficient values with the well-established, near-linear region of the high- temperature results (about 1675-4080 K), whether the notion is accepted that reaction Rl dominates at high temperature or not. A fit of the high-temperature data together with the ref 27 data would produce a k,, Arrhenius plot with a very pronounced downward curvature. On the other hand, an Arrhenius plot with upward curvature, such as the recommendation from the companion papefl shown in Figure 6, is easily explained by the occurrence of the two reaction channels.6 Additionally, kl could be inferred via studies on the reverse reaction at intermediate temperatures as low as 1370 K, as discussed in detail in ref 6. These rate coefficient measurements survived critical tests and are used in the overall fit for recommended expressions. The intermediate temperature rate coefficients agree well with the high-temperature data for kl. The kl expression from these studies of the reverse reaction is much larger at intermediate temperatures than the results of ref 27 would indicate. Thus, the ref 27 results disagree with not only the data presented herein but all pertinent prior results.
Qualitative support for the notion that reaction R2 dominates the reaction at intermediate temperatures, and that ktot is larger than most prior works indicate, is provided by preliminary results of Lin and Tsayz8 for kz (see Figure 6). Comparison of

Kinetics of the O(3P) i- NaO Reaction J. Phys. Chem. A, Vol. 104, No. 25, 2000 6011
Temperature, K
5000 3000 2000 1500 1250 1000
lo-"
10-12 ': m m 'aJ 3 ii 3 lo-'3 E
ma 0
8 10-14
i
g A
10-15
lo-16
i Q,
2.0 3.0 4.0 5.0 6.0 7.0 8.0 9.0 10.0 11.0
(l/T) x 104, K-’
values fork,,, from Ross et al;” 0 present experimental data.
the present kto, values directly to k2 from Lin and Tsay is reasonable because the companion papefi concludes that ki only contributes -10% to kmt at the present temperatures. The Lin and Tsay experiments utilized a static reactor with mixtures of NzO/Ar. Complex modeling was necessary to extract the rate coefficients. Their result agrees well with an extrapolation of the DDCH92 results for k2 (or km,); it is larger than the present direct measurements indicate. Note, though, that the slope of Lin et al’s k2 agrees quite well with the present results for k,,,. Exact conditions and error limits for their results were not available at the time of writing of this paper.
VI. Conclusions
The first measurements on the title reaction performed under conditions in which it is well isolated from the effects of other reactions, i.e., complex chemical modeling was not required to
Figure 6. Arrhenius plot comparing the present results to prior works. Extrapolation beyond the recommended temperature range for a particular rate
expression is denoted by a dotted line with a hollow symbol at the end. Key: v, .. ‘. .‘I DDCH92Y /cz result; H recommendation fort,,
from ref 6; V-v DDCH92’k,,, result; e ‘. -@ HS85’ t,, recommendation; o-_-O 4 from Lin and Tsay,28 upper limit
obtain the result, were reported. The data, combined with other works, support the suggestion of a recent high-temperature shock tube study, DDCH92,g that the two product channels do not have equal rate coefficient expressions, as previously thought. Rather, the 02 + N2 chatmel dominates at intermediate temperatures. The new data provide a much more precise intermediate temperature determination of the total rate coef- ficients of the 0 + N20 reaction than can be obtained by extrapolation of high-temperature results. In the companion paper,6 the HTP data are considered along with earlier studies, and recommended rate coefficients for the two channels are presented.
Acknowledgment The work at RPI was supported by AR0 under Grants DAAHO4-95-l-0098 and DAAGS-98-1-0183. We thank W. F. Flaherty for his valuable technical assistance and M. Leanovich for his help with some of the measurements.

6012 J. Phys. Chem. A, Vol. 104, No. 25, 2000
References and Notes
(1) (a) Fifer, R. A. In Ik&mten~ab of Solid-Propellant Combustion; Kuo, K. K., Summertield, M., Eds.; Progress in Astronautics and Aero- nautics, Vol. 90, American Institute of Aeronautics and Astronautics: New York, 1984; Chapter 4. (b) Melius, C. F. In Chemistry and Physics of Energetic Materials; Bulusu, S. N., Ed.; Khrwer: Dordrecht, The Nether- lands, 1990; Chapter 4.
(2) Miller, J. A.; Bowman, C. T. Prog. Energy Cornbust. Sci. 1989, 15,281.
(3) Dove, J. E.; Nip, W. S.; Teitelbaum, H. Fifteenth Symposium (IntemationaZ) on Combustion; The Combustion Institute: Pittsburgh, 1975; D 903.
Fontijn et al.
(15) Marshall, P. Compur. Ckm 1987,11,219. (16) Ko, T.; Adusei, G. Y.; Fontijn, A. J. Phys. Chem. 1991,95, 8745. (17) Draper, N. R.; Smith, H. Applied Regression Analysis; Wiley: New
York, 1981; Chapter 3. (18) Johnsson, J. E.; Glarborg, P.; Dam-Johansen, K. Twenty-Fourth
Symposium (International) on Combustion; The Combustion ~kitute: Pittsburgh, 1992; p 917.
(4) Troe, J.; Wagner, H. Gg. Jn Physical Chemistry of Fast Reactions; Levitt, B. P., Ed.; Plenum: London, 1973; Chapter 1.
(5) Baulch, D. L.; Drysdale, D. D.; Home, D. G. Eualuared Kinetics Data for High-Temperature Reactions. Vol. 2. Homogeneous Gas-Phase Reactions of the Hg-Nz-02 System; Butterworths: London, 1973.
(6) Meagher, N. E.; Anderson, W. R. J. Phys. Chem. A 2000, 104, 6013.
(7) Hanson, R. K.; Salimian, S. In Combustion Chemistry; Gardiner, W. C., Ed.; Springer: New York, 1985; Chapter 6.
(8) Tsang, W.; Herron, J. T. J. Phys. Chem. Ref Data 1991,20,609. (9) Davidson, D. F.; DiRosa, M. D.; Chang, A. Y.; Hanson, R. K. In
Shock Waves; Takayama, K., Ed.; Springer: Berlin, 1992; Vol. 2, p 813. (10) Allen, M. T.; Yetter, R. A.; Dryer, F. L. Cornbust. Flnme 1997,
109, 449. (11) Dean, A. M.; Bozzelli, J. W. Combustion Chemistry of Nitrogen.
In Gas-Phase Combustion Chemisrrv: Gardiner. W. C.. Jr.. Ed.: Sorineer- Verlag: New York, 2000; Chapter 2:
(12) Zuev, A. P.; Starikovskii, A. Y. Khim. Fiz 1991, IO, 179; Sov. J. Chem Phys. (Engl. Transl.) 1992, 10, 255.
(13) Ko, T.; Marshall, P.; Fontijn, A. J. Phys. Chem. 1990, 94, 1401. (14) Marshall, P.; Ko, T.; Fontijn, A. .I. Phys. Chem. 1989, 93, 1922.
(19) Allen, M.-T.; Yetter, R. A.; Dryer, F. L. Int. J. Chem. Kinet. 1995, 27, 883.
(20) (a) Anderson. W. R.: Ilincic. N.: Meaaher. N. E.: Seshadri. K.: Vanderhbff, J. A. 32nd JAHHAF Combustion Subcommittee Meeting and 1995 Propulsion Systems Hasa& Subcommittee Meeting, Joint Sessions; CPJA Publication 638; 1995; Vol. 1, p 197. (b) Anderson, W. R.; Meagher, N. E.; Ilincic, N.; Sesbadri, K.; Vanderhoff, J. A. Manuscript in preparation.
(21) Rohrig, M.; Petersen, E. L.; Davidson, D. F.; Ha&n, k. K. Inr. J. Chem. Kinet. 1996, 28, 599.
(22) Glarborg, P.; Johnsson, J. E.; Dam-Johansen, K. Combusr. Flame 1994,99,523.
(23) Masten, D. A.; Hanson, R. K.; Bowman, C. T. J. Phys. Chem 1990, 94, 7119.
(24) (a) Sausa, R. C.; Anderson, W. R.; Dayton, D. C.; Faust, C. M.; Howard, S. L. Comhst. Flame 1993,94,407. (b) Dayton, D. C.; Faust, C. M.; Anderson, W. R.; Sausa, R. C. Combus?. Flame 1994, 99, 323. (c) Sausa R. C.; Sit&, G.; Lemire, G. W.: Anderson. W. R. Twentv-Sixth Symposium (Inrer&ional) on Comb&on; The Combustion Institute: Pittsburgh, 1996; p 1043.
(25) Lutz, A. E.; Kee, R. J.; Miller, J. A. Sandia National Laboratories Technical Report SAND87-8248; October 1988.
(26) Wentworth, W. E. J. Chem E&c. 1965,42, 96, 162. (27) Ross, S. K.; Sutherland, J. W.; Kuo, S. C.; Klemm, R. B. J. Phys.
Chem. A 1997, 101, 1104. (28) (a) Lin, M. C. Private communication. (b) Tsay, T. S. Master’s
Thesis, Emory University, 1994.

INTENTIONALLY LEFT BLANK.

1
1
1
1
1
1
1
4
w
ORGANIZATION
DEFENSE TECHNICAL INFORMATION CENTER DTIC DDA 8725 JOHN J KINGMAN RD STE 0944 FT BELVOIR VA 22060-62 18
HQDA DAM0 FDT 400 ARMY PENTAGON WASHINGTON DC 203 lo-0460
OSD OUSD(A&T)/ODDDR&E( RJTREW THE PENTAGON WASHINGTON DC 20301-7100
DPTY CG FOR RDA us ARMY MATERIEL CMD AMCRDA 5001 EISENHOWER AVE ALEXANDRIA VA 22333-0001
INST FOR ADVNCD TCHNLGY THE UNIV OF TEXAS AT AUSTIN PO BOX 202797 AUSTIN TX 78720-2797
DARPA B KASPAR 3701 N FAJRFAX DR ARLINGTON VA 22203-1714
NAVAL SURFACE WARFARE CTR CODE B07 J PENNELLA 17320 DAHLGREN RD BLDG 1470 RM 1101 DAHLGREN VA 22448-5100
US MILITARY ACADEMY MATH SC1 CTR OF EXCELLENCE MADNMATH MAJ HUBER THAYER HALL WEST POINT NY 10996-1786
NO. OF COPIES
1
ORGANIZATION
DIRECTOR US ARMY RESEARCH LAB AMSRLD DRSMlTH 2800 POWDER MILL RD ADELPHI MD 20783-l 197
DIRECTOR US ARMY RESEARCH LAB AMSRL DD 2800 POWDER MILL RD ADELPHI MD 20783-l 197
DIRECTOR US ARMY RESEARCH LAB AMSRL CI AI R (RECORDS MGMT) 2800 POWDER MILL RD ADELPHI MD 20783-1145
DIRECTOR US ARMY RESEARCH LAB AMSRL CI LL 2800 POWDER MJLL RD ADELPHI MD 20783-l 145
DIRECTOR US ARMY RESEARCHLAB AMSRL CI AP 2800 POWDER MILL RD ADELPHJ MD 20783-l 197
ABERDEEN PROVING GROUND
DIR USARL AMSRL CI LP (BLDG 305)

INTENTIONALLYLEFTBLANK.

REPORT DOCUMENTATION PAGE Form Approved OMB No. 0704-0188
‘ublic rep0Ring burden for this collection of information is estimated lo average 1 hour per response, including the time for reviewing instwcdons. searching existing data sources.
lathering and maintaining the data needed. and completing and reviewing the collection of information. Send ccmments regarding this burden estimate Or any Other aspeti Of this
ollection of infotiion. including suggestions for reducing this burden. 10 Washington Headquarters Services. Directorate for lnfomtion Operations and Reports, 1215 Jefferson Davis Highway. Suite 1204, Arlimton. VA 22202402, and to the Office of Management and Budoef. Paperwork Reduction Proiec1f07M0188). Washington. DC 20503.
I. AGENCY USE ONLY (Leave blank) 2. REPORT DATE 3. REPORT TYPE AND DATES COVERED
November 2000 Final, September 1995 - December 1999 1. TITLE AND SUBTITLE 5. FUNDING NUMBERS
Kinetics of the OCP) + N20 Reaction. 1. Direct Measurements at [ntermediate Temperatures
5. AUTHOR(S)
Arthur Fontijn,* Abdellatif Goumri,* Abel Femandez,* William R. Anderson, and Nancy E. Meaghe?
AH43i6.1
r. PERFORMING ORGANIZATION NAME(S) AND ADDRESS
U.S. Army Research Laboratory
4Tl-N; AMSRL-WM-BD
4berdeen Proving Ground, MD 2 1005-5066
8. PERFORMING ORGANIZATION REPORT NUMBER
ARL-R.P- 10
2. SPONSORlNGlMONlTORlNG AGENCY NAMES(S) AND ADDRESS 1O.SPONSORING/MONlTORlNG AGENCY REPORT NUMBER
11. SUPPLEMENTARY NOTES
A reprint from The Journal ofphysical Chemistry A, vol. 104, no. 25, pp. 6003-6012,200O. * High-Temperature Reaction Kinetics Laboratory, Rensselaer Polytechnic Institute, Troy, NY 12 180-3590. ’ ASEE Postdoctoral Associate at the U.S. Army Research Laboratory.
12a. DlSTRlBUTlONlAVAlLABlLlTY STATEMENT 12b. DISTRIBUTION CODE
Approved for public release; distribution is unlimited.
13. ABSTRACT(Maximum 200 words)
Rate coefficients for the consumption of 0 atoms by their reaction with N20 have been measured, at pressures from 130 to 500 mbar, using the high-temperature photochemistry technique. These represent the first direct measurements of k values of the reaction. The ground-state oxygen atoms were produced by laser photolysis of SOz, or by flash photolysis either SO2 or 02, and monitored by time-resolved resonance fluorescence. The results yield k(1075-1140 K) = 3.2 x IO-” exp(-9686KIT) cm3 molecule-’ s-’ with 20 precision limits of &12% corresponding 20 accuracy limits of +26%. Results from several sources in the literature indicate a high sensitivity of the 0 + N20 reaction system to traces of HzO, which increases the rates if present as a contaminant. For this reason, possible effects of traces of Hz0 on the results were modeled. Simulated decay curves with a hypothetical Hz0 contaminant were used as a test of the experimental data reduction procedures. Although the concentration of Hz0 needed to significantly affect the results is small, the amount that could have been present is even less and is shown to have had negligible effects. The results are in qualitative agreement with a recent 7’2 1680 K shock tube study (D. F. Davidson, M. D. DiRosa, A. Y. Chang, and R. K. Hanson, ref 9) in that extrapolation of their results to the present temperatures indicates rate coefficients much larger than had been previously thought. However, though the results agree within error limits for such a long extrapolation, the present results are about a factor of 4 smaller. Combined with the results of the companion paper by Meagher and Anderson (ref 6, following paper in this issue), in which the prior literature is critically reevaluated, it is found that the O2 + N2 product channel dominates at the present temperatures. 14. SUBJECT TERMS 15. NUMBER OF PAGES
kinetics, 0 + N20 reaction, nitrogen chemistry, combustion 15 16. PRICE CODE
17. SECURITY CLASSIFICATION 18. SECURITY CLASSIFICATION 19. SECURITY CLASSIFICATION 20. LIMITATION OF ABSTRACT
OF REPORT OF THIS PAGE OF ABSTRACT
UNCLASSIFIED UNCLASSIFIED UNCLASSIFIED UL hlChl -rGlnn,_,~n_r;~nn Standard Form 298 (Rev. 2-69) ___..__ _ -. _~~
Prescribed by ANSI Std. 239-18 298-102

USER EVALUATION SHEET/CHANGE OF ADDRESS
This Laboratory undertakes a continuing effort to improve the quality of the reports it publishes. Your comments/answers to the items/questions below will aid us in our efforts.
1. ARL Report Number/Author ARL-RP-10 (Fontiin) Date of Report November 2000
I 2. Date Report Received
3. Does this report satisfy a need? (Comment on purpose, related project, or other area of interest for which the report will be
c used.)
4. Specifically, how is the report being used? (Information source, design data, procedure, source of ideas, etc.)
5. Has the information in this report led to any quantitative savings as far as man-hours or dollars saved, operating costs
avoided, or efficiencies achieved, etc? If so, please elaborate.
6. General Comments. What do you think should be changed to improve future reports? (Indicate changes to organization,
technical content, format, etc.)
Organization
CURRENT ADDRESS
Name
Street or P.O. Box No.
E-mail Name
City, State, Zip Code
7. If indicating a Change of Address or Address Correction, please provide the Current or Correct address above and the Old
or Incorrect address below.
& Organization
OLD ADDRESS
Name
Street or P.O. Box No.
City, State, Zip Code
(Remove this sheet, fold as indicated, tape closed, and mail.) (DO NOT STAPLE)