Kinetics of submicron oleic acid aerosols with...
23
Taken from doctoral thesis, Chemical Kinetics and Microphysics of Atmospheric Aerosols, © copyright by James W. Morris, 2002. 86 Chapter 5 Kinetics of submicron oleic acid aerosols with ozone Heterogeneous reactions involving particles and gas-phase species can alter important chemical and microphysical properties of aerosols, complicating modeling efforts to assess their effects on climate and human health. Organic aerosols are usually the most abundant component of fine aerosols (< 2 µm) after sulfates, and it is in this size range that one finds those aerosols responsible for the majority of environmental effects 1 . Precursors to organic aerosols include vegetation, the ocean surface, and various combustion processes. Ozone is an important oxidant in the troposphere, often in concentrations sufficient to cause adverse effects on human health and vegetation 2 . Oleic acid is one of a group of organic species proposed as an important tracer species for use in source characterization of ambient aerosols 3 . However, the relative fraction of these species may change as the particle ages, and new product species are likely to be introduced. Very little is known about the kinetics of organic species in atmospheric aerosols. Such knowledge is necessary for quantitative assessment of field studies as well as for use in climate and air quality models often relied upon for regulatory policy decisions intended to safeguard human health. The relatively recent field of aerosols kinetics has grown out of more general efforts to study gas-liquid interactions. The experimental exploration of such interactions includes approaches involving aerosol levitation devices, Knudsen cells, smog chambers,
Transcript of Kinetics of submicron oleic acid aerosols with...

Taken from doctoral thesis, Chemical Kinetics and Microphysics of Atmospheric Aerosols, © copyright by James W. Morris, 2002.
86
Chapter 5
Kinetics of submicron oleic acid aerosols with ozone Heterogeneous reactions involving particles and gas-phase species can alter important
chemical and microphysical properties of aerosols, complicating modeling efforts to
assess their effects on climate and human health. Organic aerosols are usually the most
abundant component of fine aerosols (< 2 µm) after sulfates, and it is in this size range
that one finds those aerosols responsible for the majority of environmental effects1.
Precursors to organic aerosols include vegetation, the ocean surface, and various
combustion processes. Ozone is an important oxidant in the troposphere, often in
concentrations sufficient to cause adverse effects on human health and vegetation2. Oleic
acid is one of a group of organic species proposed as an important tracer species for use
in source characterization of ambient aerosols3. However, the relative fraction of these
species may change as the particle ages, and new product species are likely to be
introduced. Very little is known about the kinetics of organic species in atmospheric
aerosols. Such knowledge is necessary for quantitative assessment of field studies as
well as for use in climate and air quality models often relied upon for regulatory policy
decisions intended to safeguard human health.
The relatively recent field of aerosols kinetics has grown out of more general
efforts to study gas-liquid interactions. The experimental exploration of such interactions
includes approaches involving aerosol levitation devices, Knudsen cells, smog chambers,
Taken from doctoral thesis, Chemical Kinetics and Microphysics of Atmospheric Aerosols, © copyright by James W. Morris, 2002.
87
horizontal and vertical bubblers, wetted wall or thin film reactors, and droplet trains.
Here, we introduce a novel technique for the study of such interactions over a wide range
of conditions. For our first set of experiments illustrating the capabilities of the
technique, we chose to study the kinetics of oleic acid (C18H34O2) aerosols with ozone.
In addition to kinetics information, data from these studies were used to determine the
aerosol size change due to uptake of ozone, assess reaction stoichiometry, and obtain
qualitative information about the volatility of the reaction products. The size dependence
of the aerosol kinetics as discussed by Hanson and Lovejoy is clearly demonstrated4.
5.1 Experimental approach
The aerosol kinetics apparatus is shown in fig. 5-1. Poly-disperse aerosols, produced in a
constant output atomizer (TSI Model 3076) from a solution of oleic acid in methanol, are
entrained in a flow of dry filtered air at atmospheric pressure. Most of the methanol
evaporates after passing through a silica gel diffusion dryer. (The amount of residual
methanol in the particles is estimated from the particle mass spectra to be 2% by weight =
0.15 mole fraction.) The oleic acid aerosols are then carried into a differential mobility
analyzer (DMA – TSI Model 3071A). Within the DMA, particles are electrostatically
classified by their mobility diameter. Most of the aerosols carry one, two or three
charges. Therefore, three or more known sizes are pre-selected and emerge
simultaneously from the DMA. The selected distribution can be limited to one, singly
charged size by tuning the DMA to large particles (typically > 500 nm in diameter, at the
high end of the initial size distribution).
Taken from doctoral thesis, Chemical Kinetics and Microphysics of Atmospheric Aerosols, © copyright by James W. Morris, 2002.
88
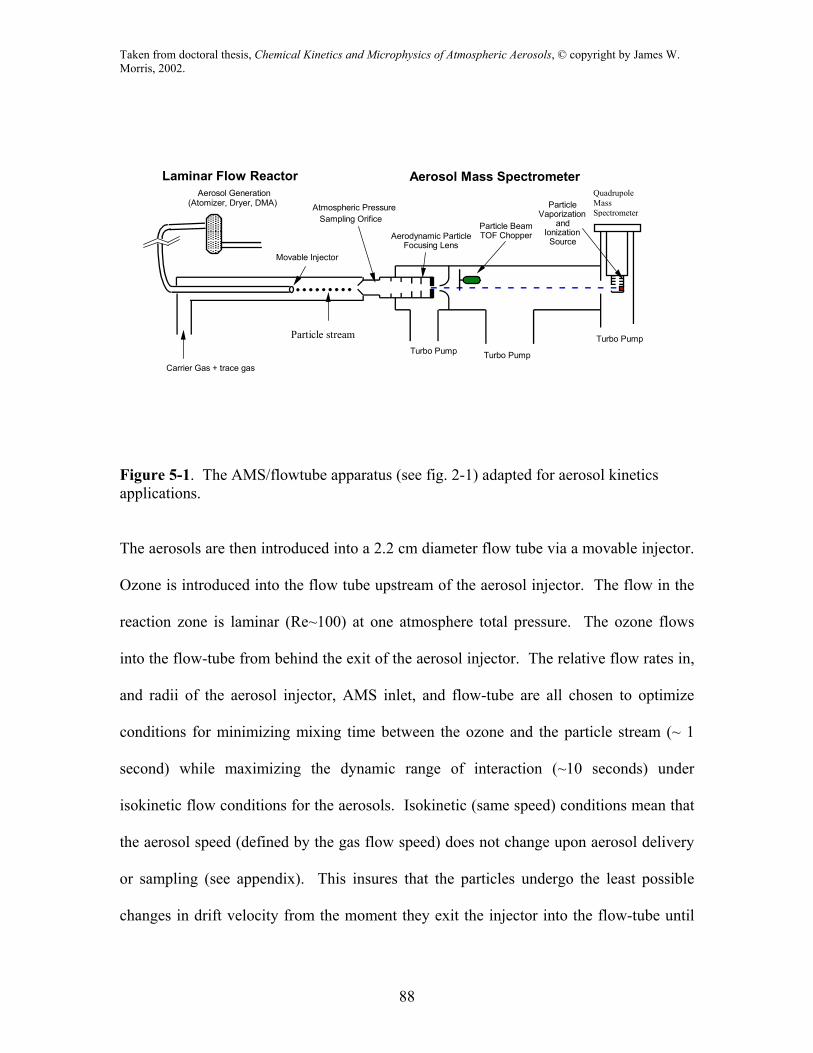
Figure 5-1. The AMS/flowtube apparatus (see fig. 2-1) adapted for aerosol kinetics applications.
The aerosols are then introduced into a 2.2 cm diameter flow tube via a movable injector.
Ozone is introduced into the flow tube upstream of the aerosol injector. The flow in the
reaction zone is laminar (Re~100) at one atmosphere total pressure. The ozone flows
into the flow-tube from behind the exit of the aerosol injector. The relative flow rates in,
and radii of the aerosol injector, AMS inlet, and flow-tube are all chosen to optimize
conditions for minimizing mixing time between the ozone and the particle stream (~ 1
second) while maximizing the dynamic range of interaction (~10 seconds) under
isokinetic flow conditions for the aerosols. Isokinetic (same speed) conditions mean that
the aerosol speed (defined by the gas flow speed) does not change upon aerosol delivery
or sampling (see appendix). This insures that the particles undergo the least possible
changes in drift velocity from the moment they exit the injector into the flow-tube until
Atmospheric Pressure Sampling Orifice
Aerosol Mass Spectrometer
Carrier Gas + trace gas
Laminar Flow Reactor Aerosol Generation
(Atomizer, Dryer, DMA)
Movable Injector
Quadrupole Mass Spectrometer
Particle Vaporization
and Ionization
Source Particle Beam TOF ChopperAerodynamic Particle
Focusing Lens
Turbo Pump Turbo Pump
Turbo Pump Particle stream

Taken from doctoral thesis, Chemical Kinetics and Microphysics of Atmospheric Aerosols, © copyright by James W. Morris, 2002.
89
they are sampled into the AMS inlet. The isokinetic condition also minimizes mixing in
the flow-tube, such that aerosol – trace gas interaction times can be known with high
certainty. By matching the flow speeds (~ 8 cm/s) of the carrier gas and injector flows
entering the reaction zone, the aerosols are isokinetically injected along the center axis of
the flow tube (see appendix).
By translating the injector from 10 to 60 cm, the aerosol-ozone interaction time
can be varied from 1 to 7 s. The aerosols are then sampled (again isokinetically) at 1.5
cc/s flow, through a 120 µm orifice opening into the AMS. Isokinetic conditions are
necessary for accurate determination of gas-particle interaction times. Due to the low
diffusion coefficients of submicron aerosols (D ~10-5 cm2/s), there is negligible Brownian
diffusion of the aerosols in the absence of convective mixing. This means that the
particle stream maintains its initial diameter (defined by the injector diameter, ~ 0.6 cm)
over typical measurement times. Once exposed to a known partial pressure of ozone for
a known interaction time, the particles are sampled into the AMS inlet for size and
compositions analysis.
As described in ch. 2, the AMS consists of three differentially pumped chambers.
In the present experiments, velocities range between 150 m/s and 90 m/s for 150 nm and
1 µm particles respectively. The pressures in the next two chambers are 10-5 torr and 10-7
torr respectively, such that each particle maintains its velocity as it traverses the
chambers. In the third chamber the particles strike a resistively heated surface where the
aerosols vaporize in 20 to 200 microseconds depending on particle composition and
heater temperature. The vapor plume is ionized by electron impact and the resulting ions
are mass analyzed with a quadrupole mass spectrometer. It has been experimentally
Taken from doctoral thesis, Chemical Kinetics and Microphysics of Atmospheric Aerosols, © copyright by James W. Morris, 2002.
90
verified that the mass spectrometer signal at the oleic acid parent peak is directly
proportional to the amount of oleic acid in the particles (detection efficiency ~ 10-7 ions
counted per molecule).
The AMS can be operated in either of two modes: In the TOF mode, signal
proportional to the mass of the particles is monitored as a function of TOF or
aerodynamic diameter for a given atomic mass unit (AMU). In the mass spectrum mode,
the entire mass spectrum of the particles is displayed from 1 to 300 AMU. The TOF
signal can be processed in both a single particle mode and in an integrated signal mode.
In the integrated mode (used here) the quadrupole current is averaged over 103 to 104
particles.
By comparing oleic acid particle signal with and without ozone as a function of
injector distance for a known ozone pressure in the flow-tube, we are able to plot the
fraction of initial oleic acid remaining for different sized aerosols as a function of ozone
exposure.
5.2 Results and discussion
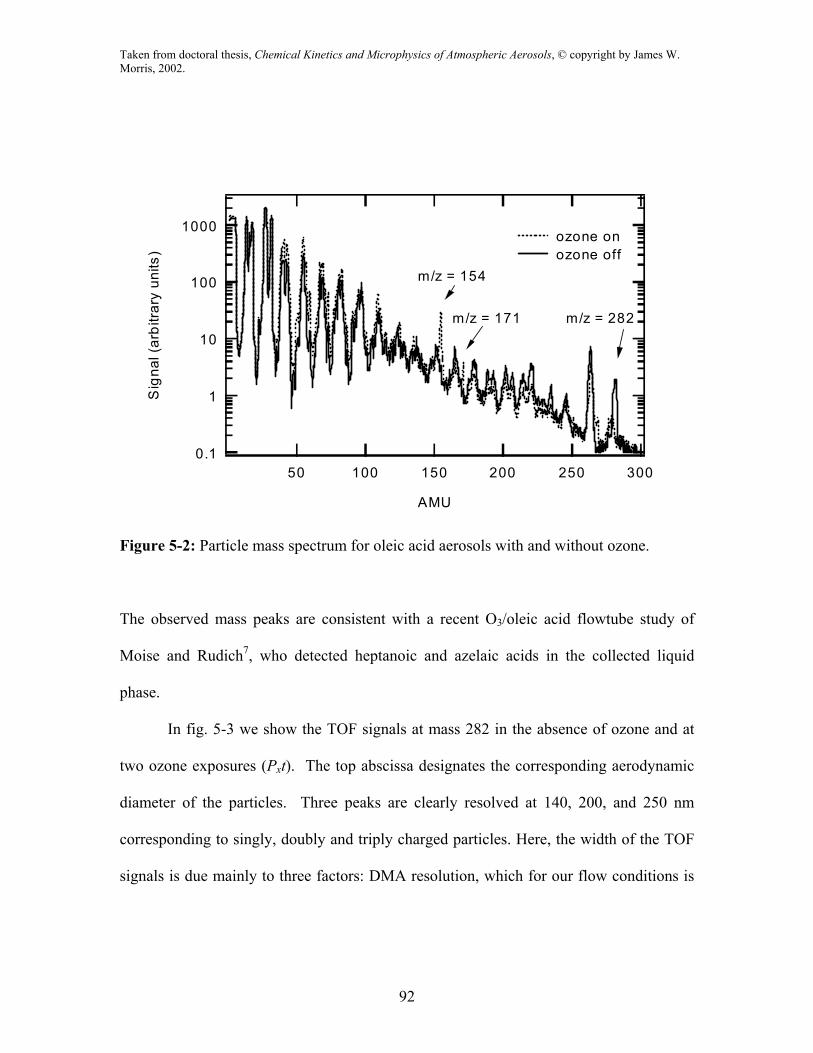
In fig. 5-2 we show mass spectra obtained from the vaporized particles of pure oleic acid
(solid line) and oleic acid after exposure to ozone (dotted line). In this experimental run
the diameter of the particles was approximately 600 nm. The reacted particles were
exposed to O3 at about 10-5 atm for 7 seconds. The pure oleic acid mass spectrum in fig.
5-2 compares well with the one in the NIST library5. The signal at mass 282 is the oleic
acid parent peak. The decrease in this signal in the presence of ozone is clearly evident,
Taken from doctoral thesis, Chemical Kinetics and Microphysics of Atmospheric Aerosols, © copyright by James W. Morris, 2002.
91
as is the appearance of product peaks at masses 154 and 171. We have chosen the oleic
acid parent peak at mass 282 for our kinetic analysis.
The reaction of ozone with oleic acid proceeds most likely via insertion of ozone
to the double bond, forming an ozonide with pathways to several possible products6. The
observed peaks appearing with ozone exposure are likely due to product decomposition at
the vaporizing heater or ionizer.
Taken from doctoral thesis, Chemical Kinetics and Microphysics of Atmospheric Aerosols, © copyright by James W. Morris, 2002.
92
Figure 5-2: Particle mass spectrum for oleic acid aerosols with and without ozone.
The observed mass peaks are consistent with a recent O3/oleic acid flowtube study of
Moise and Rudich7, who detected heptanoic and azelaic acids in the collected liquid
phase.
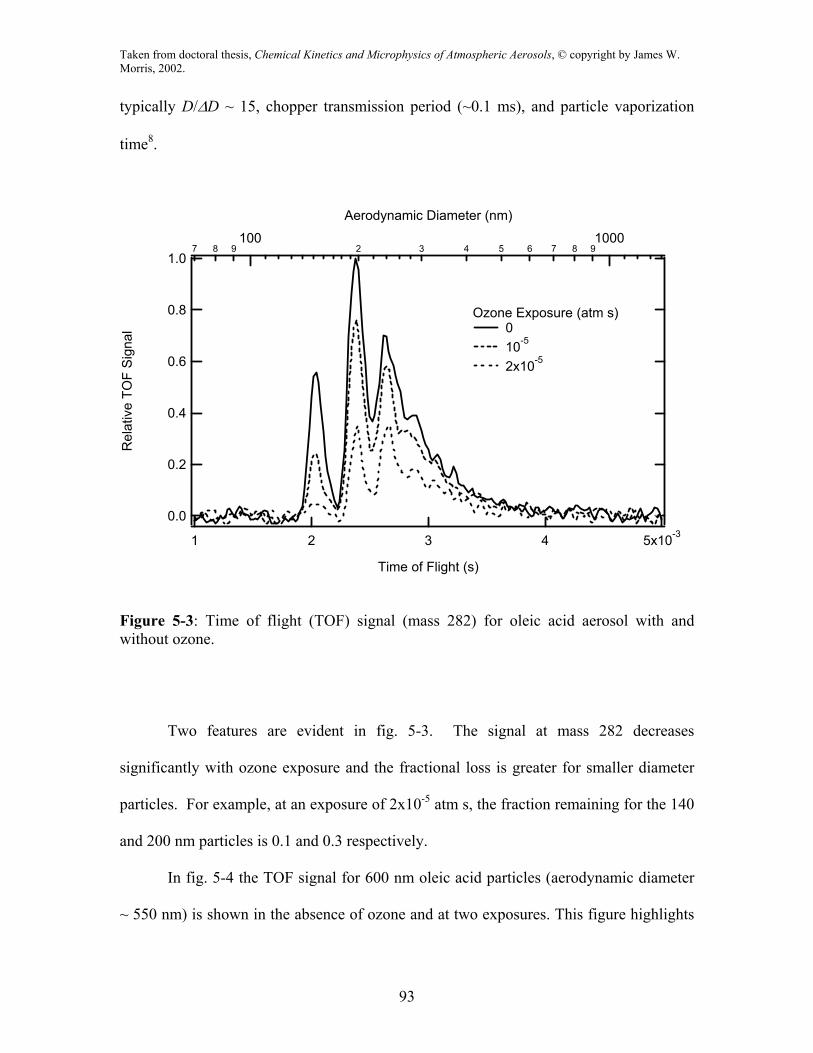
In fig. 5-3 we show the TOF signals at mass 282 in the absence of ozone and at
two ozone exposures (Pxt). The top abscissa designates the corresponding aerodynamic
diameter of the particles. Three peaks are clearly resolved at 140, 200, and 250 nm
corresponding to singly, doubly and triply charged particles. Here, the width of the TOF
signals is due mainly to three factors: DMA resolution, which for our flow conditions is
0.1
1
10
100
1000
Sig
nal (
arbi
trary
uni
ts)
30025020015010050
AMU
ozone on ozone off
m/z = 154
m/z = 171 m/z = 282
Taken from doctoral thesis, Chemical Kinetics and Microphysics of Atmospheric Aerosols, © copyright by James W. Morris, 2002.
93
typically D/∆D ~ 15, chopper transmission period (~0.1 ms), and particle vaporization
time8.
Figure 5-3: Time of flight (TOF) signal (mass 282) for oleic acid aerosol with and without ozone.
Two features are evident in fig. 5-3. The signal at mass 282 decreases
significantly with ozone exposure and the fractional loss is greater for smaller diameter
particles. For example, at an exposure of 2x10⁻⁵ atm s, the fraction remaining for the 140
and 200 nm particles is 0.1 and 0.3 respectively.
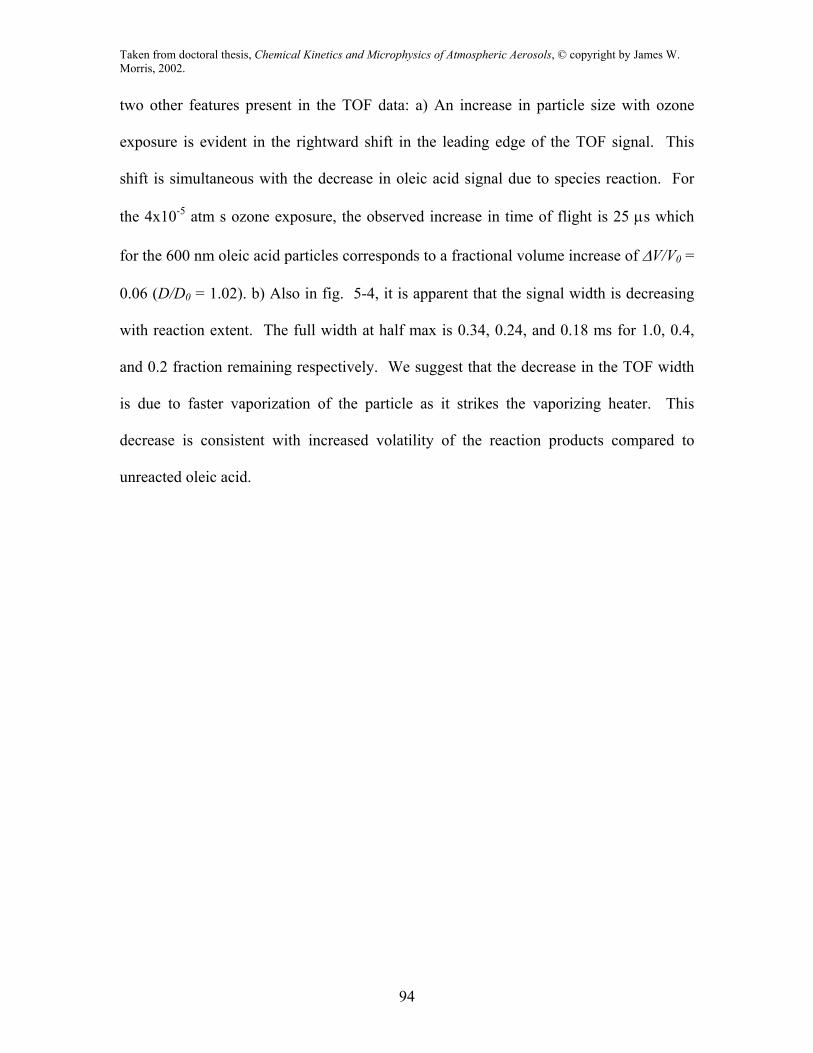
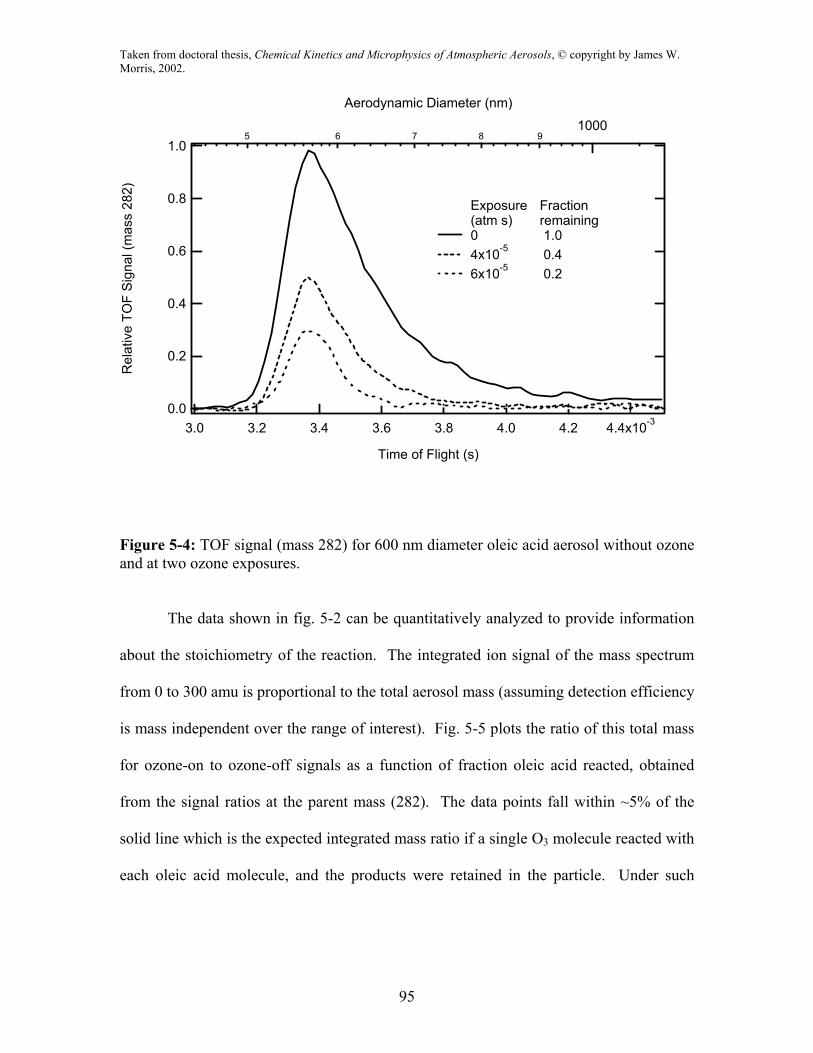
In fig. 5-4 the TOF signal for 600 nm oleic acid particles (aerodynamic diameter
~ 550 nm) is shown in the absence of ozone and at two exposures. This figure highlights
1.0
0.8
0.6
0.4
0.2
0.0
Rel
ativ
e TO
F S
igna
l
7 8 9100
2 3 4 5 6 7 8 91000
Aerodynamic Diameter (nm)
5x10-34321
Time of Flight (s)
Ozone Exposure (atm s) 0 10-5
2x10⁻⁵
Taken from doctoral thesis, Chemical Kinetics and Microphysics of Atmospheric Aerosols, © copyright by James W. Morris, 2002.
94
two other features present in the TOF data: a) An increase in particle size with ozone
exposure is evident in the rightward shift in the leading edge of the TOF signal. This
shift is simultaneous with the decrease in oleic acid signal due to species reaction. For
the 4x10⁻⁵ atm s ozone exposure, the observed increase in time of flight is 25 µs which
for the 600 nm oleic acid particles corresponds to a fractional volume increase of ∆V/V0 =
0.06 (D/D0 = 1.02). b) Also in fig. 5-4, it is apparent that the signal width is decreasing
with reaction extent. The full width at half max is 0.34, 0.24, and 0.18 ms for 1.0, 0.4,
and 0.2 fraction remaining respectively. We suggest that the decrease in the TOF width
is due to faster vaporization of the particle as it strikes the vaporizing heater. This
decrease is consistent with increased volatility of the reaction products compared to
unreacted oleic acid.
Taken from doctoral thesis, Chemical Kinetics and Microphysics of Atmospheric Aerosols, © copyright by James W. Morris, 2002.
95
Figure 5-4: TOF signal (mass 282) for 600 nm diameter oleic acid aerosol without ozone and at two ozone exposures.
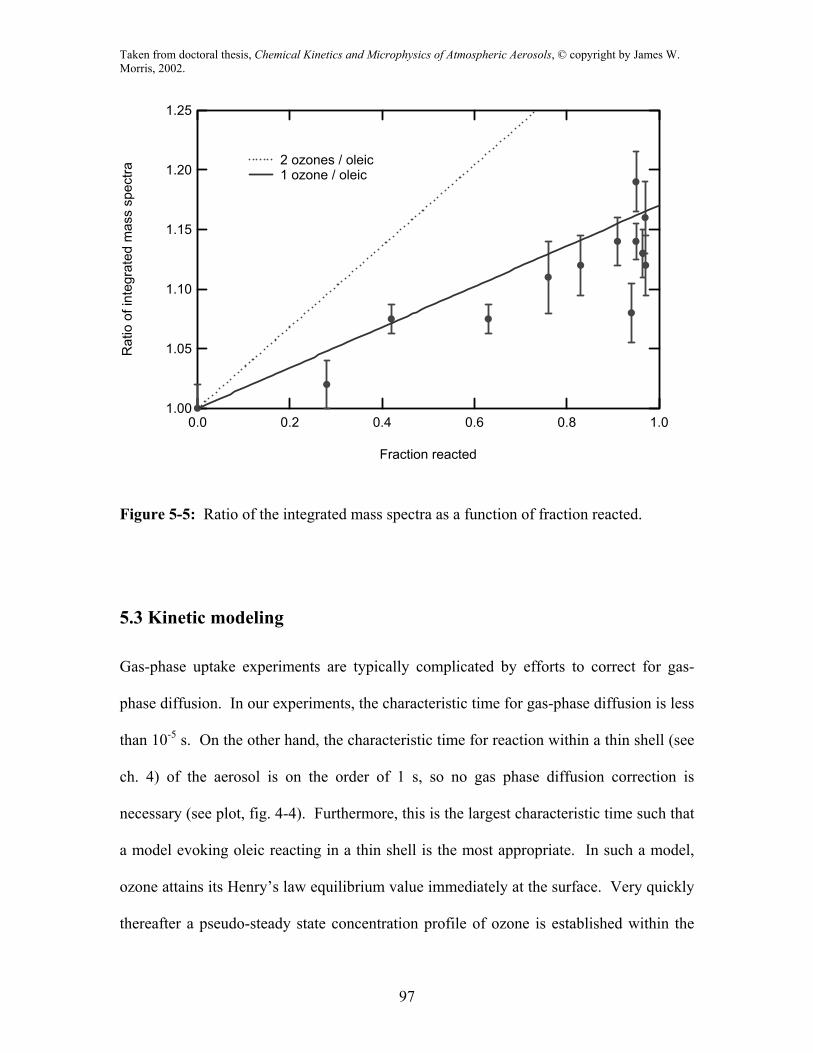
The data shown in fig. 5-2 can be quantitatively analyzed to provide information
about the stoichiometry of the reaction. The integrated ion signal of the mass spectrum
from 0 to 300 amu is proportional to the total aerosol mass (assuming detection efficiency
is mass independent over the range of interest). Fig. 5-5 plots the ratio of this total mass
for ozone-on to ozone-off signals as a function of fraction oleic acid reacted, obtained
from the signal ratios at the parent mass (282). The data points fall within ~5% of the
solid line which is the expected integrated mass ratio if a single O3 molecule reacted with
each oleic acid molecule, and the products were retained in the particle. Under such
1.0
0.8
0.6
0.4
0.2
0.0
Rel
ativ
e TO
F S
igna
l (m
ass
282)
5 6 7 8 91000
Aerodynamic Diameter (nm)
4.4x10-34.24.03.83.63.43.23.0
Time of Flight (s)
Exposure Fraction(atm s) remaining
0 1.0 4x10⁻⁵ 0.4 6x10⁻⁵ 0.2

Taken from doctoral thesis, Chemical Kinetics and Microphysics of Atmospheric Aerosols, © copyright by James W. Morris, 2002.
96
assumptions, the ratio of the new to old mass as a function of reaction extent, ε or
fraction reacted (1-fraction remaining) is:
εy
xMnM
mm
+= 10
(5.3)
Here n is the number of ozone molecules reacting per oleic and Mx and My are the
molecular weights of ozone and oleic respectively. The dashed line assumes that two
ozone molecules react per oleic acid molecule (n = 2). As is evident, the former is
consistent with the results. Similar information is obtained from the data in fig. 5-4 by
converting the change in TOF (measuring particle diameter) to a mass change (see
below).
Taken from doctoral thesis, Chemical Kinetics and Microphysics of Atmospheric Aerosols, © copyright by James W. Morris, 2002.
97
Figure 5-5: Ratio of the integrated mass spectra as a function of fraction reacted.
5.3 Kinetic modeling
Gas-phase uptake experiments are typically complicated by efforts to correct for gas-
phase diffusion. In our experiments, the characteristic time for gas-phase diffusion is less
than 10-5 s. On the other hand, the characteristic time for reaction within a thin shell (see
ch. 4) of the aerosol is on the order of 1 s, so no gas phase diffusion correction is
necessary (see plot, fig. 4-4). Furthermore, this is the largest characteristic time such that
a model evoking oleic reacting in a thin shell is the most appropriate. In such a model,
ozone attains its Henry’s law equilibrium value immediately at the surface. Very quickly
thereafter a pseudo-steady state concentration profile of ozone is established within the
1.25
1.20
1.15
1.10
1.05
1.00
Rat
io o
f int
egra
ted
mas
s sp
ectra
1.00.80.60.40.20.0
Fraction reacted
2 ozones / oleic 1 ozone / oleic
Taken from doctoral thesis, Chemical Kinetics and Microphysics of Atmospheric Aerosols, © copyright by James W. Morris, 2002.
98
aerosol. It is important to note that such a profile depends on the concentration of
organic within the particle; the ozone will diffuse more deeply on average into the
particle the less organic there is for it to react with. A further simplifying assumption is
that there be no oleic concentration gradient within the particle. This is justified by the
very short characteristic time for oleic diffusion to the surface (~10-4 seconds). Diffusion
of oleic into any potentially depleted region would be much faster than the rate of
reaction there, such that no appreciable gradient in oleic concentration would be allowed
to form.
The reactive uptake coefficient is therefore expected to govern the overall rate. A
key parameter in the formulation of Γrxn is the ratio l/a, where a is the particle radius and
l is the reacto-diffusive length, given by l = (D/k2[Y])1/2. Here D is the diffusion
coefficient (cm2 s-1) of ozone in oleic acid, k2 is the second order rate constant for the
reaction between ozone and oleic acid, and [Y] is the concentration of oleic acid.
The magnitude of l can be estimated as follows. The initial concentration, [Y]0 is
3.15 M. The parameters D and k2 have not been measured, however, they are expected9
to be on the order D ~ 10-6 cm2 s-1 and k2 ~ 106 M-1 s-1. With these values, the reacto-
diffusive length is estimated to be l ~ 5 nm. This is less than 10% of the radius for even
the smallest particles studied here. In this limit, Γrxn is (see sec. 4.3.3 above):
][42 YDk
cHRT
rxn =Γ (5.4)
Here, H (M atm-1) is the Henry's law coefficient for ozone in oleic acid, R is the gas
constant (8.206x10⁻² atm K-1 M-1), T is the temperature, and c is the mean thermal speed
of the impinging trace gas (cm s-1). The experimentally monitored quantity is the fraction
of initial particle species [Y]/[Y]0 remaining after a given exposure time at a known
Taken from doctoral thesis, Chemical Kinetics and Microphysics of Atmospheric Aerosols, © copyright by James W. Morris, 2002.
99
ozone pressure. With Γrxn given by eq. 5.4, this fraction can be expressed (see eq. 4.34
above) as,
tPYaDkH
YY
x0
2
0 ][23
1][][
−= (5.5)
where, Px, is the partial pressure of ozone (atm). In eq. 5.5 we have assumed a (cm) to
be constant during the uptake process. Here the exposure, Pxt, is the experimental
variable. This expression indicates that the fractional consumption of oleic acid is more
rapid in smaller particles, as is observed experimentally (fig. 5-3). Further, the model
predicts that a plot of ([Y]/[Y]0)1/2 as a function of the exposure yields straight lines with
slopes inversely proportional to the particle radius.
We note that as the 0.6 cm diameter particle stream enters the reaction zone, the
particles do not immediately come into contact with the reactant trace gas (in this case
O3). The trace gas must mix with the particle stream. If we assume that during some
effective mixing time τ, the aerosols are not in contact with the reactive gas, then the
effective reaction time is (t - τ), which is to be substituted in eq. 5.5.
In fig. 5-6 we show plots of ([Y]/[Y]0)1/2 as a function of Px(t-τ) for three particle
diameters; 200 nm, 400 nm, and 600 nm. The straight lines in the figure show the global
fit to the experimental data with two fitting parameters; H(Dk2)1/2 and τ. With a and [Y]0
given ([Y]0 = 3.15 M), best fit to the data is obtained with H(Dk2)1/2 = 0.33 ± 0.03 (M1/2
atm cm s-1) and τ = 0.35 s. The effective mixing time of 0.35 s is consistent with the
characteristic diffusion time into a 0.6 cm diameter stream (~ 0.5 s). We note that the
same value of the product H(Dk)1/2 fits the kinetics of the reaction over the full range of
oleic acid decay. In the face of this result, one is led to conclude that the parameters H,

Taken from doctoral thesis, Chemical Kinetics and Microphysics of Atmospheric Aerosols, © copyright by James W. Morris, 2002.
100
D, and k either remain the same from reactant to product, or are changing in opposing
directions such that the product remains nearly constant.
Figure 5-6: Oleic acid depletion in the form ([Y]/[Y]o)1/2 as a function of exposure P(t-τ) for aerosol diameters 200, 400 and 600 nm. The dashed lines are model fits to the data.
As is evident, the observed oleic acid decay is in accord with the model, clearly
exhibiting size dependent aerosol kinetics. With the fitted value of H(Dk2)1/2, eq. 5.4
yields the reactive uptake coefficient for ozone on oleic acid, Γrxn = 1.6 (±0.2) x 10-3, in
reasonable agreement with wetted wall experiments performed by Moise and Rudich
1.0
0.8
0.6
0.4
0.2
0.0
([Y]/[
Y] 0)
1/2
120x10-6100806040200
Px(t-τ) (atm s)
Particle diameter (nm)
600 400 200

Taken from doctoral thesis, Chemical Kinetics and Microphysics of Atmospheric Aerosols, © copyright by James W. Morris, 2002.
101
using O3 and oleic acid and by de Gouw and Lovejoy 10 using O3 and other liquid
alkenes.
In choosing the model to describe the present experiments we assumed that the
reacto-diffusive length was much smaller than the particle radius (l<<a). Using the more
general formulation of the reactive process (allowing l ~ a) as in eq. 4.19, the model is
observed to fit the data only for l < 10 nm. This defines an upper limit on the value
l=(D/k2[Y]0)1/2. With [Y]o known, it follows that D/k2 < 3.2 x10⁻¹² cm2 M. An order of
magnitude value for H of ozone in oleic acid is estimated to be 10-1 M atm-1, using earlier
approximated values for D and k2.
We also performed experiments as a function of relative humidity and could
detect no change in the rate of chemical processing within the oleic acid particles from
3% to 80% relative humidity.
5.4 Atmospheric implications
The value of H(Dk2)1/2 obtained from data analysis implies an atmospheric half-life with
respect to O3 reaction on the order of minutes for submicron aerosols of pure oleic acid in
atmospheres polluted with 100 ppb O3. On the other hand, in the Los Angeles area, field
measurements together with source flux estimates, imply an oleic acid atmospheric
lifetime on the order of days11. The longer atmospheric lifetime is likely due to the fact
that oleic acid in atmospheric aerosols can be found in semi-solid, highly viscous
mixtures such as with stearic and palmitic acids present12. Diffusion coefficients for gases
in solids are typically 105 times smaller than in liquids so trapping the oleic acid in a solid
matrix would diffusively shield it from the incoming ozone, leading to a much longer
Taken from doctoral thesis, Chemical Kinetics and Microphysics of Atmospheric Aerosols, © copyright by James W. Morris, 2002.
102
lifetime. Indeed, the quantitative nature of our result enables us to extrapolate to
approximate "solid" oleic acid lifetimes by virtue of the expected changes on H(Dk)1/2.
The diffusion coefficient, D for O3 in solids is expected to be 105 times smaller, such that
H(Dk)1/2 will be almost 103 times smaller, and the lifetime passes from minutes to days,
consistent with field observations. Also, the existence of a short reacto-diffusive length (l
< 10 nm) would confine the reaction to a thin shell near the surface of the aerosol, so that
in such viscous particles the reaction is slowed down by diffusive transport of oleic acid
to the surface (see sec. 4.2.4 above). Another possibility is the existence of a thin
ammonium nitrate shell encapsulating the organic aerosol, which would be solid at low
relative humidity13.
5.5 Directions for future research
This section is designed to benefit the researcher using aerosol mass spectrometry with
thermal vaporization schemes such as the AMS used here. The treatment is commentary
in nature, purposing to outline future research directions. In many cases, these
experiments were attempted, and potential pitfalls are summarized where applicable.
Elaidic acid is an especially interesting follow-up to oleic acid from the standpoint
of particle morphology. Elaidic acid has very similar chemical structure to oleic acid
(same location of double bond, same molecular weight), but it is a solid at room
temperature. Such experiments would help elucidate the role of particle phase in aerosol
kinetics, and could progress to mixtures of oleic and elaidic acids in such a way as to
develop a model of phase/size dependent kinetics. Preliminary efforts to measure the
kinetics of elaidic acid and ozone showed no difference from the oleic/ozone system. We
Taken from doctoral thesis, Chemical Kinetics and Microphysics of Atmospheric Aerosols, © copyright by James W. Morris, 2002.
103
concluded that leftover solvent within the elaidic particles made them liquid while
reacting with ozone in the flowtube.
Another mixture of interest is oleic and stearic acid. Stearic acid is identical to
oleic except that it has no double bond, and is a solid at room temperature. Initial
experiments performed on this system yielded no discernible difference in rate when
compared to the pure oleic particles. As was previously noted, particles generated in the
atomizer are typically not completely devoid of solvent. This may be even more
important for solid particles whose exteriors may dry first, encapsulating the remaining
solution within the particle.
Nucleation/condensation particle generation
One possible technique for drying particles produced from the atomizer would be to heat
them while flowing them through a drying tube. This may lead to complications however
as some organics decompose upon heating. Mixtures of atmospherically relevant organic
and inorganic species can perhaps best be made mimicking actual production processes in
the atmosphere. An example would be to evaporate mixtures of organics and then re-
condense them within a cooled flow of gas, either on a seed aerosol or through
homogeneous nucleation. Such particle generators have been developed, including the
Sinclair-LaMer model. Such condensation particle generation typically produces very
homogeneous (single size) aerosol ensembles, easily controlled by adjusting flow
conditions and heating temperatures (vapor pressure of species to be condensed).
Information from particle size change
In the case of reactive uptake of trace gas, particles in general undergo both mass and
density changes. As mentioned above, there was some detection of size change with
Taken from doctoral thesis, Chemical Kinetics and Microphysics of Atmospheric Aerosols, © copyright by James W. Morris, 2002.
104
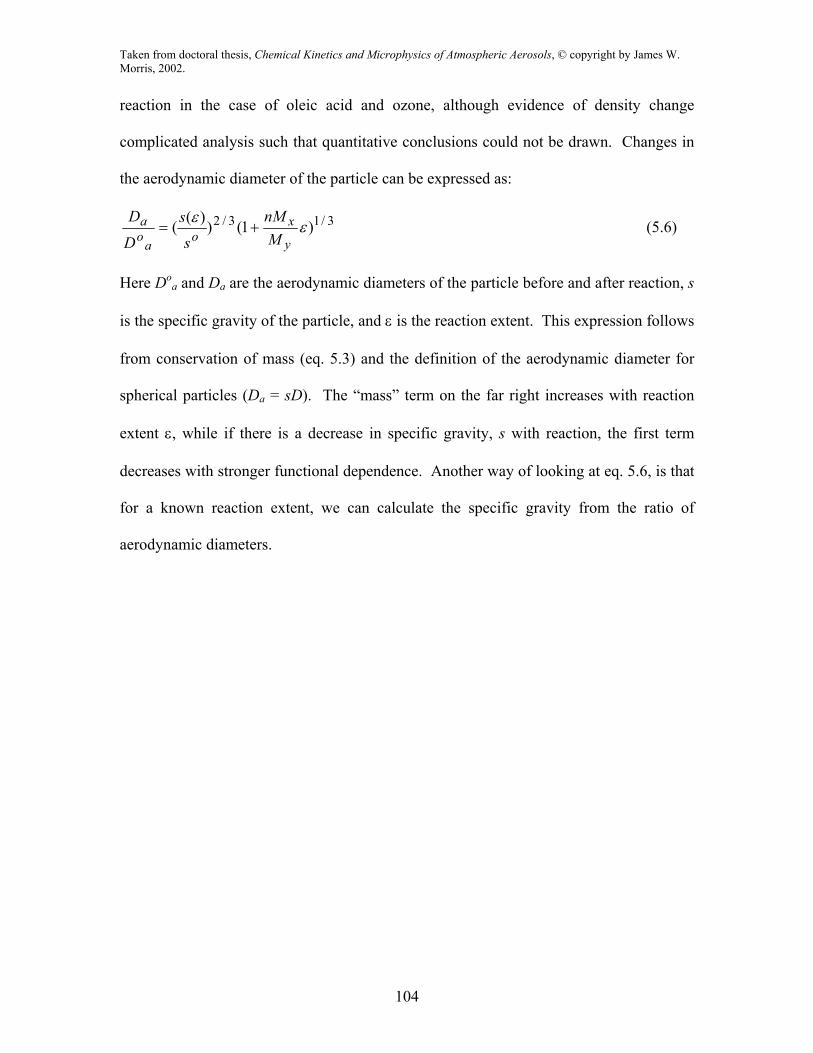
reaction in the case of oleic acid and ozone, although evidence of density change
complicated analysis such that quantitative conclusions could not be drawn. Changes in
the aerodynamic diameter of the particle can be expressed as:
3/13/2 )1())(( εε
y
xo
aoa
MnM
ss
D
D+= (5.6)
Here Doa and Da are the aerodynamic diameters of the particle before and after reaction, s
is the specific gravity of the particle, and ε is the reaction extent. This expression follows
from conservation of mass (eq. 5.3) and the definition of the aerodynamic diameter for
spherical particles (Da = sD). The “mass” term on the far right increases with reaction
extent ε, while if there is a decrease in specific gravity, s with reaction, the first term
decreases with stronger functional dependence. Another way of looking at eq. 5.6, is that
for a known reaction extent, we can calculate the specific gravity from the ratio of
aerodynamic diameters.
Taken from doctoral thesis, Chemical Kinetics and Microphysics of Atmospheric Aerosols, © copyright by James W. Morris, 2002.
105
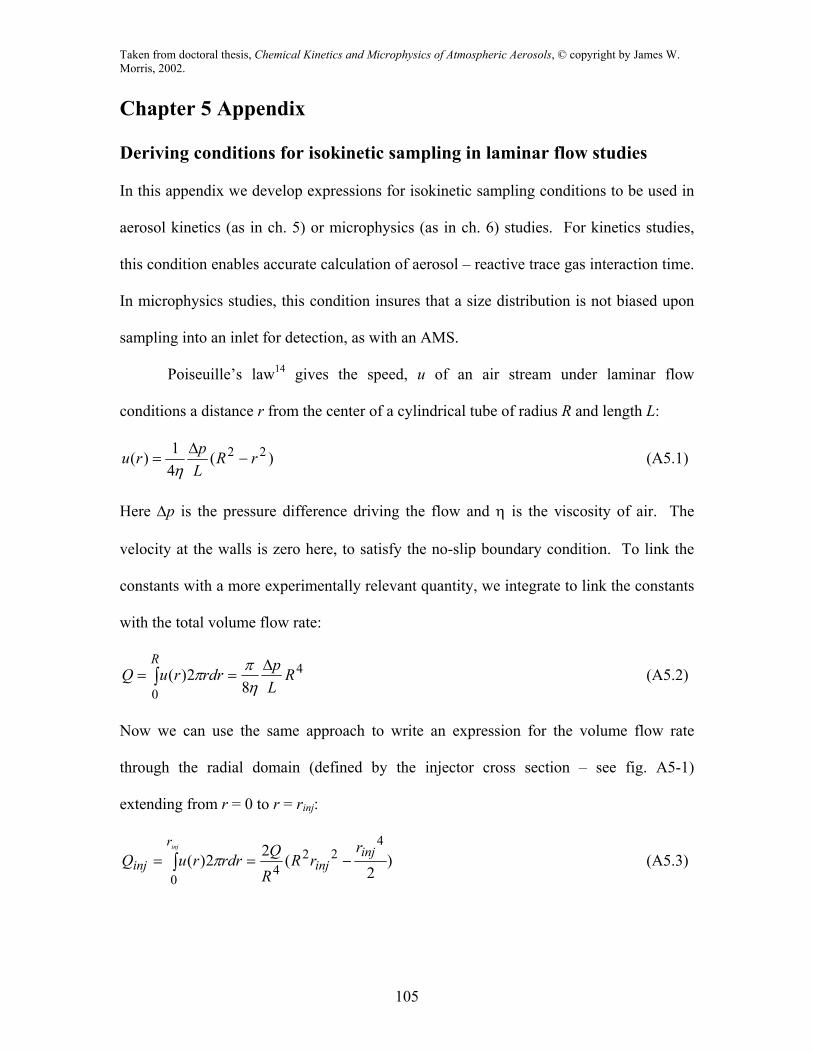
Chapter 5 Appendix Deriving conditions for isokinetic sampling in laminar flow studies In this appendix we develop expressions for isokinetic sampling conditions to be used in
aerosol kinetics (as in ch. 5) or microphysics (as in ch. 6) studies. For kinetics studies,
this condition enables accurate calculation of aerosol – reactive trace gas interaction time.
In microphysics studies, this condition insures that a size distribution is not biased upon
sampling into an inlet for detection, as with an AMS.
Poiseuille’s law14 gives the speed, u of an air stream under laminar flow
conditions a distance r from the center of a cylindrical tube of radius R and length L:
)(41)( 22 rR
Lpru −
∆=
η (A5.1)
Here ∆p is the pressure difference driving the flow and η is the viscosity of air. The
velocity at the walls is zero here, to satisfy the no-slip boundary condition. To link the
constants with a more experimentally relevant quantity, we integrate to link the constants
with the total volume flow rate:
4
0 82)( R
LprdrruQ
R ∆== ∫ ηππ (A5.2)
Now we can use the same approach to write an expression for the volume flow rate
through the radial domain (defined by the injector cross section – see fig. A5-1)
extending from r = 0 to r = rinj:
)2
(22)(4
224
0
injinj
r
injr
rRRQrdrruQ
inj
−== ∫ π (A5.3)

Taken from doctoral thesis, Chemical Kinetics and Microphysics of Atmospheric Aerosols, © copyright by James W. Morris, 2002.
106
Here, we have used eq. A5.2 to express Qinj as a function of Q. This is the flow rate
through a radial domain of the flowtube with the same cross section as the injector (see
fig. A5-1). The average velocity within this cross section is given by Qinj/πr2inj. This is
of course identical to the average velocity within the injector itself, by definition. It
follows that setting Qinj to the value given by eq. A5.3 assures that the average speed of
the particles leaving the injector will be equal to the average speed of the air in the
flowtube over the domain of the injector. The choice of injector flowrate is thus
constrained by the choice of flowtube flow rate, Q and radius, R. Once the particles have
been entrained within the flowtube, they are sampled into the AMS inlet (see fig. A5-1).
We can extend the same arguments to establish isokinetic conditions at the inlet to the
AMS. Having established an analogous expression to A5.3 for the inlet, we may divide
the two and obtain:
)2/(
)2/(
2/
2/422
222
422
422
inlinl
injinj
inlinl
injinj
inl
inj
rRr
rRr
rrR
rrRQQ
−
−=
−
−= (A5.4)
In the limit where rinj << R and rinl << R this gives the same result as if we were to simply
match the average velocities of the injector and the inlet. In fact, a reasonable
approximation to the condition met by eq. A5.4 is to set each average velocity equal to
the maximum within the flowtube, or twice the average.
Under such conditions the drift velocity of the aerosols sampled at the inlet is
given by:
)2
(2 22
4inl
driftr
RRQv −=
π (A5.5)
Taken from doctoral thesis, Chemical Kinetics and Microphysics of Atmospheric Aerosols, © copyright by James W. Morris, 2002.
107
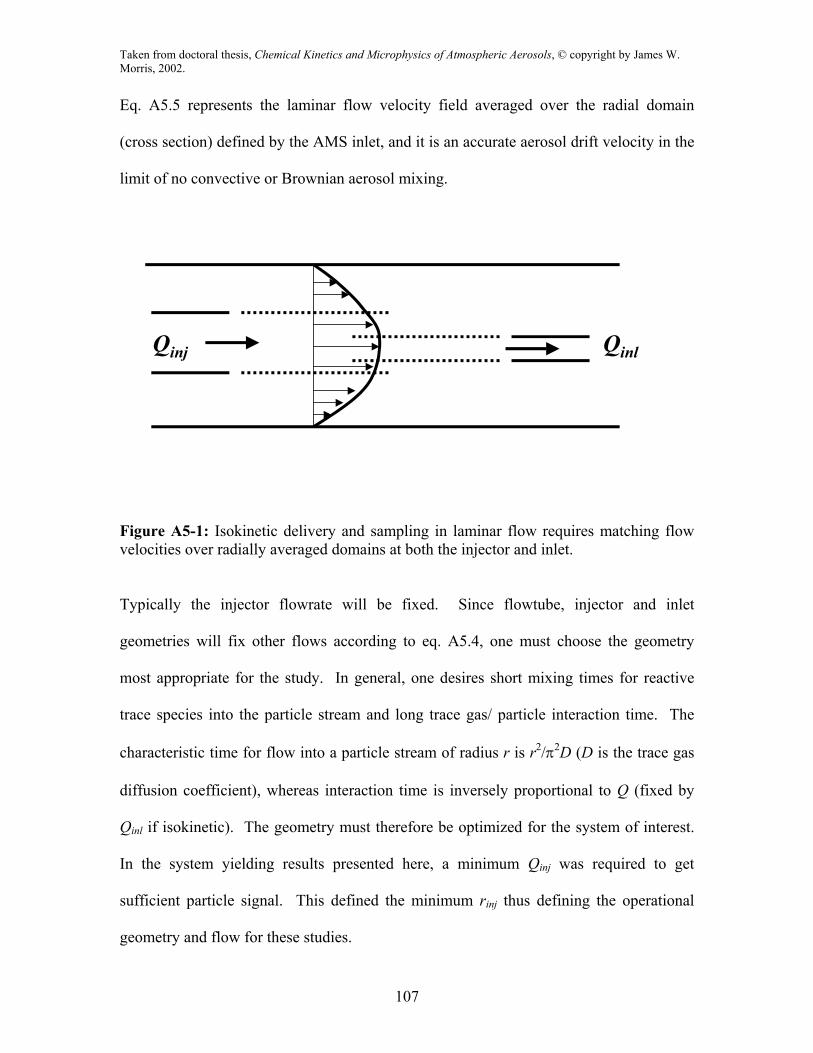
Eq. A5.5 represents the laminar flow velocity field averaged over the radial domain
(cross section) defined by the AMS inlet, and it is an accurate aerosol drift velocity in the
limit of no convective or Brownian aerosol mixing.
Figure A5-1: Isokinetic delivery and sampling in laminar flow requires matching flow velocities over radially averaged domains at both the injector and inlet.
Typically the injector flowrate will be fixed. Since flowtube, injector and inlet
geometries will fix other flows according to eq. A5.4, one must choose the geometry
most appropriate for the study. In general, one desires short mixing times for reactive
trace species into the particle stream and long trace gas/ particle interaction time. The
characteristic time for flow into a particle stream of radius r is r2/π2D (D is the trace gas
diffusion coefficient), whereas interaction time is inversely proportional to Q (fixed by
Qinl if isokinetic). The geometry must therefore be optimized for the system of interest.
In the system yielding results presented here, a minimum Qinj was required to get
sufficient particle signal. This defined the minimum rinj thus defining the operational
geometry and flow for these studies.
QinlQinj
Taken from doctoral thesis, Chemical Kinetics and Microphysics of Atmospheric Aerosols, © copyright by James W. Morris, 2002.
108
Chapter 5 References 1 M. C. Jacobson, H. Hanson, K. Noone, and R. Charlson, Reviews of Geophysics, 38,
267 (2000).
2 J. Seinfeld and S. Pandis, Atmospheric Chemistry and Physics, (John Wiley & Sons,
1998, 107).
3 J. J. Schauer, W. F. Rogge, L. M. Hildemann, M. A. Mazurek, G. R. Cass, and B. R.
Simoneit, Atmos. Env, 30, 3837 (1996).
4 D. R. Hanson and E. R. Lovejoy, Science, 267, 1326 (1995).
5 NIST/EPA/NIH Mass Spectral Library, Search / Analysis Programs and Data for
Microsoft Windows 95, 98, NT, 2000, January 2001.
6 S. Rakovsky and G. Zaikov, Kinetics of Ozone Reactions with Organic and Polymeric
Compounds in Liquid Phase (Nova Science Publishers, 1998, 112).
7 T. Moise and Y. Rudich, submitted to J. Phys. Chem., 2002.
8 J. Jayne, D. Leard, Z. Zhang, P. Davidovits, C. Kolb, and D. Worsnop. Aerosol Sci.
Technol., 33, 49 (2000).
9 Rakovsky, et al., p. 125.
10 J. A. de Gouw and E. R. Lovejoy, Geophys. Res. Lett., 25, 931 (1998).
11 W. F. Rogge, L. M. Hildemann, M. A. Mazurek, G. R. Cass, and B. R. T.
Simoneit, Environ. Sci. Technol., 25, 1112 (1991).
12 J. J. Schauer, M. J. Kleeman, G. R. Cass, and B. R. T. Simoneit, Environ. Sci.
Technol., 33, 1566 (1999).
13 A. S. Wexler and J. H. Seinfeld, Atmos. Env., 24A, 1231 (1990).
14 T. E. Faber, Fluid dynamics for physicists, (Cambridge, 1995).