Base Catalyzed Decomposition (BCD) formerly called Base Catalyzed Dechlorination

Kinetics and Modeling of ReductiveDechlorination at High PCEand TCE Concentrations
Seungho Yu, Lewis Semprini
Department of Civil, Construction, and Environmental Engineering, OregonState University, Corvallis, Oregon 97331; telephone: 541-737-6895;fax: 541-737-3099; e-mail: [email protected]
Received 26 March 2004; accepted 8 July 2004
Published online 21 September 2004 in Wiley InterScience (www.interscience.wiley.com). DOI: 10.1002/bit.20260
Abstract: Two biokinetic models employing the Michaelis-Menten equation for anaerobic reductive dechlorinationof tetrachloroethylene (PCE) and trichloroethylene (TCE)were developed. The models were compared with resultsfrom batch kinetic tests conducted over a wide range ofPCE and TCE concentrations with two different dechlorin-ating cultures. One model applies Michaelis-Menten ki-netics with competitive inhibition among chlorinatedaliphatic hydrocarbons (CAHs), while the other model in-cludes both competitive inhibition and Haldane inhibitionat high CAH concentrations. Model simulations with com-petitive inhibition simulated the experimental results wellfor PCE concentrations lower than 300 AM. However, sim-ulations deviated from the experimental observations forPCE or TCE concentrations greater than 300–400 AM.The kinetic model that incorporated both competitive andHaldane inhibitions better simulated experimental data forPCE concentrations near the solubility limit (1000 AM), andTCE concentrations at half its solubility limit (4000 AM).Based on the modeling analysis of the experimental re-sults, the PM culture (Point Mugu, CA) had very high Hal-dane inhibition constants for cis-1,2-dichlororethylene(c-DCE) and vinyl chloride (VC) (6000 and 7000 AM, re-spectively), indicating very weak Haldane inhibition, whilethe EV culture (the Evanite site in Corvallis, OR) had lowerHaldane inhibition constants for TCE, c-DCE, and VC of900, 750, and 750 AM, respectively. The BM culture (a bi-nary mixed culture of the PM and EV cultures) had trans-formation abilities that represented the mixture of the EVand PM cultures. Model simulations of the BM culturetransformation abilities were well represented by separaterate equations and model parameters for the two indepen-dent cultures that were simultaneously solved. Modelingresults indicated that a combination of competitive andHaldane inhibition kinetics is required to simulate dechlo-rination over a broad range of concentrations up to thesolubility limit of PCE and half the solubility limit of TCE.B 2004 Wiley Periodicals, Inc.
Keywords: reductive dechlorination; PCE; TCE; compet-itive inhibition; Haldane inhibition
INTRODUCTION
Chlorinated ethylenes are ubiquitous soil and groundwater
contaminants (Westrick et al., 1984), for which bioreme-
diation is a promising technology. Anaerobic reductive de-
chlorination is an important process in the subsurface,
especially for the dechlorination of highly chlorinated com-
pounds such as PCE and TCE, which can be present at high
concentrations due to the presence of dense non-aqueous
phase liquid (DNAPL; Rittmann et al., 1994).
Although intrinsic biotransformation of PCE and TCE
occurs, observations at many contaminated sites show trans-
formation often stalls at c-DCE and VC (Major et al., 2002).
This may be due to an absence of appropriate dechlorinating
bacteria. A study of 24 chlorinated ethylene-contaminated
sites reported that Dehalococcoides organisms were not de-
tected at sites where incomplete dechlorination was ob-
served (Hendrickson et al., 2002). Bioaugmentation with
dechlorinating cultures that can completely transform PCE
and TCE to ethylene (ETH) can be an appropriate strategy
to enhance reductive dechlorination (Ellis et al., 2000;
Harkness et al., 1999).
The use of a binary mixed culture consisting of two
different aerobic pure cultures has been reported to show
interspecies interactions and changes in the rate and extent
of biodegradation (Fairlee et al., 1997; Rogers et al., 2000).
The studies revealed that the utilization of a binary mixed
culture could enhance the biodegradation of mixed pollu-
tants such as toluene, phenol, and benzene. Previously, we
reported (Yu and Semprini, 2002a) that a binary anaerobic
mixed culture isolated from two different contaminated
groundwaters was more effective in reductively dechlorin-
ating PCE to ETH than each individual culture.
Various models have been developed that describe re-
ductive dechlorination of chlorinated ethylenes. For com-
plete reductive dechlorination of PCE to ETH, competitive
inhibition of VC dechlorination by the other chlorinated eth-
ylenes was assumed, and model simulations were compared
with the experimental data (Tandoi et al., 1994). Fennell
and Gossett (1998) simulated both fermentation of electron
B 2004 Wiley Periodicals, Inc.
Correspondence to: Lewis Semprini
Contract grant sponsor: U.S. Environmental Protection Agency-
sponsored Western Region Hazardous Substance Research Center
Contract grant number: R-828772

donors and competition for the evolved H2 between hy-
drogenotrophic PCE dechlorinators and methanogens, but
did not consider inhibition between the chlorinated ethyl-
enes. Tonnaer et al. (1997) also incorporated competitive
dechlorination between PCE and TCE in a model to predict
PCE reductive dechlorination. Garant and Lynd (1998)
showed that competitive kinetics for complete reductive
dechlorination of PCE achieved better model fits of the
experimental data than noncompetitive inhibition. Other
modeling studies included competitive inhibition between
c-DCE and VC with a dechlorinating culture using c-DCE
and VC as electron acceptors for energy (Cupples et al.,
2004; Haston 1999).
Recently, we experimentally determined maximum rates
(kmax) and half-velocity coefficients (KS) for each step of
the dechlorination of PCE to ETH for two different mixed
cultures (Yu, 2003) and evaluated inhibition between chlo-
rinated ethylenes. The study presented here aims to sim-
ulate with independently measured kinetic parameters the
sequential transformation of PCE and TCE to ETH over a
broad range of concentrations up to the solubility limit of
PCE and half the solubility limit of TCE in water. The ki-
netic models developed for each culture were also com-
bined to simulate the transformation ability of a binary
mixed culture composed of each dechlorinating culture.
MATERIALS AND METHODS
Chemicals
Chlorinated ethylenes including PCE (99.9%, spectropho-
tometric grade), TCE (99.9%), and c-1,2-dichloroethylene
(c-DCE) (97%) used for preparing stock feed solutions and
analytical standards were obtained from Acros Organics
(Pittsburgh, PA). Gaseous VC and ETH (both 99.5%, Al-
drich Chemical, Milwaukee, WI) were used to prepare ana-
lytical standards. Hydrogen gas (99%, Airco, Inc., Albany,
OR) was used as an electron donor for dechlorination and
1-butanol (99.8%, HPLC grade, Aldrich Chemical, Mil-
waukee, WI) was used as a fermenting substrate.
Analytical Methods
The sample gas concentrations of all chlorinated ethylenes,
ETH, and hydrogen were determined using gas chromatog-
raphy. PCE, TCE, c-DCE, VC, and ETH were quantified
with an HP-6890 gas chromatograph (GC) equipped with a
photoionization detector (PID) and flame ionization de-
tector (FID) connected in series. The GC was fitted with a
30 m � 0.53 mm GS-Q column (J&W Scientific, Folsom,
CA), and helium was used as the carrier gas (15 mL/min).
Then 100–200 AL batch reactor headspace samples were
introduced into the GC. The GC oven was initially held
at 80jC for 1.5 min, heated at 65jC/min to 170jC and
40jC/min to 220jC, and kept at 220jC for 2.7 min. Quan-
tification of hydrogen concentrations in headspace gas
samples (200 AL) was accomplished using an HP-5890 GC
with a thermal conductivity detector (TCD), operated iso-
thermally at 220jC. The gas samples were chromato-
graphically separated with a Carboxen 1000 column (15 ft� 1/8 in; Supelco, Bellefonte, PA), using argon as carrier gas
at a flow rate of 15 mL/min. The hydrogen detection limit
was 4 nM (aqueous concentration).
Enrichment Cultures and Kinetic Batch Reactors
The two anaerobic mixed cultures used in this study were
isolated from subsurface samples from Point Mugu Naval
Weapon Facility, California (PM) and the Evanite site in
Corvallis, Oregon (EV). The third culture used was a binary
mixed culture (BM), representing a mixture of the PM and
EV cultures (1:1 volume ratio). Details of the enrichment
process are provided by Yu (2003). PCR assay targeting
genes encoding for 16S ribosomal RNA indicated that
the PM and EV cultures had Dehalococcoides-like micro-
organisms present with the ability of complete reduc-
tive dechlorination to ETH (Yu, 2003). The two cultures
were grown in separate batch mother reactors (total volume
1.2 L with liquid volume of 1 L) as described in Yu and
Semprini (2002b) and Yu (2003). The mother reactors were
amended with an aqueous TCE or PCE concentration of
100 mg/L for the PM and EV cultures, respectively. 1-
Butanol (40–60 mg/L) was added as a fermenting substrate
and hydrogen (10% in the headspace) was added as an
electron donor. The liquid cultures for kinetic studies were
obtained from the batch mother reactor after 50–100% of
the PCE or TCE added was converted to ETH.
Batch kinetic reactors [serum bottles—156 mL total
volume with 125 mL liquid—fitted with gray chlorobutyl
rubber septa (Wheaton Industries, Millville, NJ)] were con-
structed in an anaerobic glove box. The reactors contained
125 mL enrichment liquid culture and 31 mL anaerobic gas
headspace. After construction in the glove box, the reactors
were purged with a mixed gas mixture of N2 (70%), CO2
(20%), and H2 (10%) that was treated in a tube furnace to
remove trace oxygen. After purging, neat PCE or TCE and
butanol were added to each reactor to achieve the desired
initial concentration. To evaluate different PCE concen-
trations (Table I), the kinetic reactors were purged after
each experimental run, and higher PCE concentrations were
introduced along with butanol and hydrogen. The batch
reactors were shaken at 200 rpm and incubated at 20jC.
Prior to each experimental run, the total cell concentration,
X, was determined by a protein analysis, as previously de-
scribed (Yu, 2003).
Batch kinetic tests of the sequential transformation of
PCE and TCE were conducted in duplicate with the PM,
EV, and BM cultures (Table I). Neat PCE was added, and
the batch reactors were vigorously shaken to achieve tar-
get PCE concentrations from 39 AM up to the solubility
limit. Tests were conducted at a single TCE concentra-
tion of approximately 4000 AM, representing half of its
solubility in water. The experimental data are presented
452 BIOTECHNOLOGY AND BIOENGINEERING, VOL. 88, NO. 4, NOVEMBER 20, 2004

as the average of the duplicate reactors for each kinetic
test. Differences between measured values in duplicate re-
actors were usually smaller than the size of the figure
symbols. Butanol was added at the beginning of each ex-
periment to provide more than 3 times the electron donor
required for complete dechlorination of PCE and TCE. Hy-
drogen was also added to the batch reactors’ headspace and
maintained above 0.03 atm (3% hydrogen in headspace =
24.4 AM aqueous concentration) by adding hydrogen
(99%), if necessary.
Microbial Community
A PCR assay targeting 16S ribosomal DNA was performed
to identify the microbial populations catalyzing the re-
ductive dechlorination of chlorinated ethylenes. Genomic
DNA was extracted from the PM and the EV mixed cul-
tures with a FastDNA spin kit for soil (Qbiogene, Inc.,
Carlsbad, CA). For each culture, PCR was performed on
5 AL of DNA extracted from the cultures with three dif-
ferent pairs of primers: (1) DSM-205F, Escherichia coli
16S rRNA positions 205 to 222 and DSM-1015R, 1033 to
1015, specific for the Desulfuromonas (Loffler et al.,
2000); (2) DHG-728F, 728 to 750 and DHG-1155R, 1172
to 1155 (Loffler et al., 2000); (3) Fp DHC1, 1 to 17 and Rp
DHC-1377, 1385 to 1366 (Hendrickson et al., 2002). The
last two primer pairs were specific to the Dehalococcoids
group (D. ethenogens and FL2). Both the PM and the EV
enrichment cultures yielded bright positive PCR signals
with both DHG and DHC primers, but were negative with
the DSM primers. This PCR assay indicated that the PM
and EV cultures contain Dehalococcoides-like microorgan-
isms (Yu, 2003). Molecular analysis using terminal re-
striction fragment length polymorphism (T-RFLP) with
the restriction endonuclease MnlI was conducted on the
extracted DNA. Of the 71 sequences in GenBank identified
as Dehalococcoides sp., 5 included the recognition se-
quence for the universal bacterial primer, 27F, used in the
T-RFLP analysis. Of these, only three sequences were ob-
tained from TCE contaminated sites undergoing reductive
dechlorination and they produced expected terminal frag-
ment lengths (TFLs) of 124 or 125 bp. The culture showed
a predominant peak at 123.6 bp, consistent with the ex-
pected TFL for Dehalococcoides sp., corresponding to 65%
of the total sample DNA indicating that the culture is
highly enriched in Dehalococcoides-like microorganisms.
Several other smaller peaks were also present (<7% of total
sample DNA each) and most likely represented the fer-
menting microbial population.
MODEL DEVELOPMENT
A number of models have been developed to describe an-
aerobic reductive dechlorination for different cultures
(Bagley, 1998; Cupples et al., 2004; Fennell and Gossett,
1998; Garant and Lynd, 1998; Haston, 1999; Tandoi et al.,
1994; Tonnaer et al., 1997). Competitive Michaelis-Menten
kinetics have been commonly used to model reductive de-
chlorination of PCE and TCE. Tonnaer et al. (1997) used
competitive inhibition to model reductive dechlorination
of PCE and TCE. Competitive inhibition kinetics were ob-
served and modeled for c-DCE and VC dechlorination
(Cupples et al., 2004; Haston, 1999). The inhibition con-
stants for c-DCE on VC transformation was comparable
to its half-velocity coefficients, but the inhibition constant
for VC inhibition on c-DCE dechlorination was greater than
its half-velocity coefficient (Cupples et al., 2004; Haston,
1999). Our previous studies with two anaerobic mixed
cultures (PM and EV) indicated inhibition was competi-
tive and the more chlorinated ethylenes inhibited reductive
dechlorination of the less chlorinated ethylenes with in-
hibition constants equal to the KS values (Yu, 2003). How-
ever, the less chlorinated ethylenes very weakly inhibited
the more chlorinated ethylenes. PCE inhibited reductive
TCE dechlorination, but not c-DCE or VC dechlorination,
while TCE strongly inhibited c-DCE and VC dechlorination.
c-DCE also inhibited VC transformation to ETH. The ex-
periments and corresponding model simulations were con-
ducted at low CAH concentrations. A recent kinetic study
using purified PCE-RDase from Dehalobacter restrictus
indicated that CAH itself can be inhibitory at high
concentrations of PCE and TCE (up to 1000 AM) (Maillard
et al., 2003).
Two models were developed here; one with Michaelis-
Menten kinetics and competitive inhibition as previously
described by Yu (2003), and the other includes both com-
Table I. Experimental conditions of kinetic batch reactors.
PM EV BM
Run
Initial
CAH (AM)
Measured Cell
Concentration
(mg of protein/L)
Initial
CAH (AM)
Measured Cell
Concentration
(mg of protein/L)
Initial
CAH (AM)
Measured Cell
Concentration
(mg of protein/L)
Relative Proportions
of Each Cultures
(PM:EV) (mg of protein/L)
1 92a 25 39a 30 43a 28 13:15
2 282a 34 282a 30 317a 31 14:17
3 1128a 34 1057a 27 1128a 30 14:16
4 3875b 35 4173b 40 4173b 37 17:20
aPCE.bTCE.
YU AND SEMPRINI: REDUCTIVE DECHLORINATION AT HIGH PCE AND TCE CONCENTRATIONS 453

petitive inhibition and Haldane inhibition (Bailey and Ollis,
1986). The models were solved using STELLA (High
Performance Systems) using independently measured ki-
netic parameters and compared with the experimental data.
Haldane inhibition constants were fit to experimental re-
sults and determined through trial and error analysis. As
previously reported by Yu (2003), the PM culture is as-
sumed to grow on PCE, TCE, and c-DCE, and the EV cul-
ture on PCE, TCE, c-DCE, and VC (Pon et al., 2003).
A multiple equilibration method in a single reactor was
used to determine kmax and KS values for PCE, TCE,
c-DCE, and VC as described by Yu (2003). The method
involved stepwise increases of the CAH concentration in a
single reactor over a short time interval and measuring
parent compound disappearance and daughter product pro-
duction at each concentration. Nonlinear regression of the
rate vs. concentration results were used to determine kmaxand KS values.
Competitive Inhibition Model
Based on previous studies (Yu, 2003), a competitive inhi-
bition model was used. The kinetic equations for reduc-
tive dechlorination by the mixed cultures are presented as
Eqs. (1), (2), (3), (4), and (5), with both competitive and
Haldane inhibition included. When the Haldane inhibition
constant (KHI, AM) is very high (l), the equation reduces
to competitive inhibition only. Electron donor limitations
were not included in the model equations by providing
H2 and 1-butanol in excess in the experiments. These
equations are simultaneously solved by STELLA using
Euler’s method.
dCPCE
dt¼ �kmax;PCEXCPCE
KS;PCE þ CPCE
ð1Þ
dCTCE
dt¼ �kmax;TCEXCTCE
KS;TCE 1 þ CPCE
KCI;PCE
� �þ CTCE 1 þ CTCE
KHI;TCE
� �
þ kmax;PCEXCPCE
KS;PCE þ CPCE
ð2Þ
dCc�DCE
dt¼ �kmax;c�DCEXCc�DCE
KS;c�DCE 1 þ CTCE
KCI;TCE
� �þ Cc�DCE 1 þ Cc�DCE
KHI;c�DCE
� �
þ kmax;TCEXCTCE
KS;TCE 1 þ CPCE
KCI;PCE
� �þ CTCE 1 þ CTCE
KHI;TCE
� �
ð3Þ
dCVC
dt¼ �kmax;VCXCVC
KS;VC 1 þ CTCE
KCI;TCEþ Cc�DCE
KCI;c�DCE
� �þ CVC 1 þ CVC
KHI;VC
� �
þ kmax;c�DCEXCc�DCE
KS;c�DCE 1 þ CTCE
KCI;TCE
� �þ Cc�DCE 1 þ Cc�DCE
KHI;c�DCE
� �
ð4Þ
dCETH
dt¼ kmax;VCXCVC
KS;VC 1 þ CTCE
KCI;TCEþ Cc�DCE
KCI;c�DCE
� �þ CVC 1 þ CVC
KHI;VC
� �
ð5Þ
dX
dt¼ Y
dC
dt� kdX ð6Þ
In the above equations, C is the CAH aqueous concen-
tration (AM), kmax is the maximum specific CAH dechlo-
rination rate (Amol/mg of protein/d), KS is the half-velocity
coefficient (AM), and inhibition constants of each chlorin-
ated ethylene, KCI (AM), were set equal to their respective
half-velocity coefficients (KS) as previously reported (Yu,
2003).X is the total cell concentration (mg of protein /L), and
microbial growth was calculated with respect to the trans-
formation rate of each chlorinated ethylene. In the model
for biomass growth, values for growth yield, Y (= 0.006 mg
of protein/Amol of Cl� dechlorinated), and decay con-
stant, kd (= 0.024 d�1), were obtained from the literature
(Fennell and Gossett, 1998; Maymo-Gatell et al., 1997).
The protein concentration was used as the input value
for dechlorinating microorganism concentration in the
model. The independently measured kmax values were also
determined on a total protein basis. Thus, protein was the
most appropriate measure of dechlorinating biomass, in the
absence of the specific biomass of the dechlorinating pop-
ulation. Increase in biomass was also linked only to CAH
dechlorination, because the enrichment culture was highly
enriched based on the T-RFLP analysis.
The two separate models for the PM and the EV cultures
were incorporated to depict PCE dechlorination to ETH
and microbial growth of the BM culture. The CAH dechlo-
rination models [Eqs. (1)–(5)] and microbial growth rates
[Eq. (6)] were solved simultaneously to simulate the per-
formance of the BM culture with the kinetic values ob-
tained from kinetic studies with the single mixed cultures.
The initial protein content of the BM culture was based
on the measured protein concentrations at the start of each
test, and the relative 1:1 volumetric proportion of the PM
and EV cultures was added. Based on their initial protein
concentrations of 25 and 30 mg/L for the PM and EV cul-
tures, respectively, the relative starting proportions of each
culture were estimated (Table I).
Haldane Inhibition Model
Haldane inhibition (Bailey and Ollis, 1986) was used to
model inhibition resulting from high CAH concentrations.
The Haldane inhibition for TCE dechlorination is provided in
Eq. (2), where TCE concentration appears in the denomi-
nator. In contrast to competitive inhibition, where one CAH
inhibits the transformation of another CAH, with Haldane
inhibition the CAH inhibits its own transformation. Maillard
et al. (2003) observed that the transformations of PCE and
TCE were inhibited at high concentrations, similar in form
454 BIOTECHNOLOGY AND BIOENGINEERING, VOL. 88, NO. 4, NOVEMBER 20, 2004

to Haldane inhibition. In model simulations presented here
both Haldane and competitive inhibition among chlorin-
ated ethylenes was used and compared with the experimental
data [Eqs. (1)–(5)]. Haldane inhibition at high PCE concen-
trations was not included in this study, since no signifi-
cant inhibition at PCE concentrations near its solubility limit
was indicated in our study. Similar observations were made
in the study of Maillard et al. (2003).
RESULTS
Reductive Dechlorination of PCE by the PM Culture
Figures 1 and 2 present results of a PCE transformation test
by the PM culture at aqueous concentrations ranging from
92 to 1128 AM, and corresponding model simulations with
competitive inhibition. The transformation of VC to ETH
Figure 1. Reductive dechlorination kinetics at different initial PCE
concentrations by the PM culture. The lines represent model simulations
with competitive inhibition kinetics.
Figure 2. Reductive dechlorination kinetics at different initial PCE
concentrations by the PM culture. The lines represent model simulations
with both Haldane and competitive inhibition kinetics.
YU AND SEMPRINI: REDUCTIVE DECHLORINATION AT HIGH PCE AND TCE CONCENTRATIONS 455
was very slow compared to the other CAHs (Figs. 1 and 2).
PCE was transformed rapidly, with little accumulation of
TCE or c-DCE. At an initial PCE concentration of 92 AM,
TCE and c-DCE were not detected, and VC was very
slowly transformed to ETH. The rate of VC transformation
to ETH increased with higher initial PCE concentrations,
resulting from a high KS value of 602 AM reported by Yu
(2003). The aqueous concentration of PCE with the PM
culture, when fed neat PCE of 160 Amol, exceeded the PCE
solubility limit of 900 AM (Yaws, 1999). Simulations were
performed using the total mass added to yield a computed
aqueous concentration of 1128 AM. The initial PCE con-
centrations in model simulations were generally higher than
the measured PCE aqueous concentrations. The difference
between the simulated and measured concentrations pos-
sibly resulted from incomplete and slow dissolution of
the neat PCE added. However, these differences were in-
significant because PCE was dechlorinated very rapidly at
the beginning of the tests.
Model simulations without (Fig. 1) and with Haldane in-
hibition (Fig. 2) yield similar results. The models used the
same independently measured kinetic parameters reported
in our previous study, as listed in Table II (Yu, 2003). The
KHI values for TCE, c-DCE, and VC were obtained from
heuristic fits of both PCE dechlorination (Figs. 1 and 2) and
TCE dechlorination data (Figs. 7a and 8a, as will be dis-
cussed). The initial measured cell concentration on a pro-
tein basis of 25, 34, 34 mg of protein/L was input as an
initial biomass. The model fits for the different initial PCE
concentrations captured the overall trends in the exper-
imental data very well. TCE and c-DCE did not accumu-
late, consistent with experimental observations. The results
show that both models simulate very well the temporal
histories of chlorinated ethylenes, as well as the response
to changes in initial PCE concentrations.
Reductive Dechlorination of PCE by the EV Culture
The same procedure of step-wise increase in PCE con-
centrations was used with the EV culture (Table I). As
shown in Figures 3 and 4, almost complete reductive de-
chlorination to ETH was obtained at all PCE concen-
trations within 1.2, 3.5, and 15 days, respectively. No lag
time to initiate PCE dechlorination was observed even at
the highest PCE concentration (1057 AM) (Figs. 3c and 4c).
c-DCE accumulated at all PCE concentrations tested, and
reached a maximum concentration of 700 AM at an initial
PCE concentration of 1057 AM. For all PCE concentra-
tions, ETH production occurred after most of c-DCE was
transformed to VC, indicating c-DCE strongly inhibits VC
dechlorination to ETH, consistent with the observations of
Yu (2003).
Simulations shown in Figures 3 and 4 were performed
with initial measured cell concentrations of 30, 30, 27 mg-
protein/L, respectively. The simulations with competitive
inhibition model fit the experimental data reasonably well
for initial PCE concentrations of 39 and 282 AM (Fig. 3a, b).
At the highest PCE concentration of 1057 AM, however, the
model did not simulate sequential PCE dechlorination as
well (Fig. 3c). Simulated c-DCE concentrations were much
lower than those experimentally observed, and the exper-
imental production and transformation rates of VC and
ETH were much slower than predicted by the model sim-
ulations (Fig. 3c).
Figure 4 shows model simulations incorporating both
competitive and Haldane inhibition kinetics. The KHI val-
ues for TCE, c-DCE, and VC of 900, 750, and 750 AM were
obtained by heuristic fitting of the PCE (Fig. 4) and TCE
results (Fig. 8b). The simulation presented in Figure 4a at
the lowest PCE concentration provides similar results as
those without Haldane kinetics in Figure 3a, indicating
little effect of Haldane kinetics at the low initial PCE con-
centration of 39 AM. At the highest PCE concentration of
1057 AM (Fig. 4c), the simulations including both com-
petitive and Haldane inhibition kinetics fit the experimental
data better than those only with competitive inhibi-
tion (Fig. 3c). The simulation with both competitive and
Haldane inhibition kinetics also better reproduced the ex-
perimental results at the intermediate initial PCE concen-
tration of 282 AM.
Table II. Kinetic parameters used in the model simulations.
PM EV
PCE TCE c-DCE VC PCE TCE c-DCE VC
kmaxa (Amol/mg
of protein/d)
13.3 124 22.0 2.44 12.4 125 13.8 8.08
KSa (AM) 3.86 2.76 1.90 602 1.63 1.80 1.76 62.6
KCI (AM) 3.86 2.76 1.90 602 1.63 1.80 1.76 62.6
KHIb (AM) 900 6000 7000 900 750 750
Y c (mg-protein/
Amol of CI�0.006 0.006 0.006 0.006 0.006 0.006 0.006
kdc(d�1) 0.024 0.024
aYu (2003).bObtained from the experimental data fitting (Figs. 2, 4, 6, 8).cMaymo-Gatell et al., (1997); Fennell and Gossett (1998). KCI = KS.
456 BIOTECHNOLOGY AND BIOENGINEERING, VOL. 88, NO. 4, NOVEMBER 20, 2004

Reductive Dechlorination of PCE by the BM Culture
Batch kinetic experiments were also performed with the
BM culture representing a 1:1 mixture of the PM and EV
cultures (volume basis). At the lowest PCE concentration
of 43 AM, 80% of the initial PCE was converted to ETH
within 1.2 days (Fig. 5a). The ETH production rate of the
BM culture was slightly lower than that of the EV culture
for all PCE concentrations tested, but much greater than
that of the PM culture. Complete reductive dechlorin-
ation at a PCE concentration of 317 AM was achieved on
day 4.5, while the EV culture completed PCE dechlorin-
ation to ETH at an initial concentration of 282 AM by
3.5 days. However, with the highest PCE concentration of
1128 AM, 100% transformation to ETH was observed
Figure 4. Reductive dechlorination kinetics at different initial PCE
concentrations by the EV culture. The lines represent model simulations
with both Haldane and competitive inhibition kinetics.
Figure 3. Reductive dechlorination kinetics at different initial PCE
concentrations by the EV culture. The lines represent model simulations
with competitive inhibition kinetics.
YU AND SEMPRINI: REDUCTIVE DECHLORINATION AT HIGH PCE AND TCE CONCENTRATIONS 457

within 15–20 days for both the EV and BM cultures.
The maximum c-DCE concentration was measured around
day 2, yielding an aqueous concentration of 310 AM (about
50% of the maximum concentration observed with the
EV culture).
Model simulations of the BM culture were performed by
modeling the kinetics for the PM and EV cultures simul-
taneously, but each had its own biomass and set of
kinetic parameters. The initial biomass of each culture is
given in Table I. The KHI values obtained from the fitting
of the PM and EV experiments were used. Similar to the
model fits for the PM and EV cultures, the rate of PCE
transformation to TCE was simulated well by models with
and without Haldane inhibition at all initial PCE concen-
Figure 5. Reductive dechlorination kinetics at different initial PCE con-
centrations by the BM culture. The lines represent model simulations with
competitive inhibition kinetics.
Figure 6. Reductive dechlorination kinetics at different initial PCE con-
centrations by the BM culture. The lines represent model simulations with
both Haldane and competitive inhibition kinetics.
458 BIOTECHNOLOGY AND BIOENGINEERING, VOL. 88, NO. 4, NOVEMBER 20, 2004

trations, indicating no or very weak Haldane inhibition.
Both models showed similar sequential transformation at
the lowest PCE concentration (43 AM) as represented in
Figures 5a and 6a. At the higher PCE concentrations of 317
and 1128 AM, the model with competitive and Haldane
inhibition kinetics provided a better fit to the experimental
data than the model with only competitive inhibition ki-
netics. Like the test results, the model simulations of the
BM culture yield results between those obtained by the in-
dividual cultures.
Figure 7. Reductive dechlorination kinetics at high TCE concentrations by the PM, EV, and BM cultures. The lines represent model simulations with
competitive inhibition kinetics.
YU AND SEMPRINI: REDUCTIVE DECHLORINATION AT HIGH PCE AND TCE CONCENTRATIONS 459
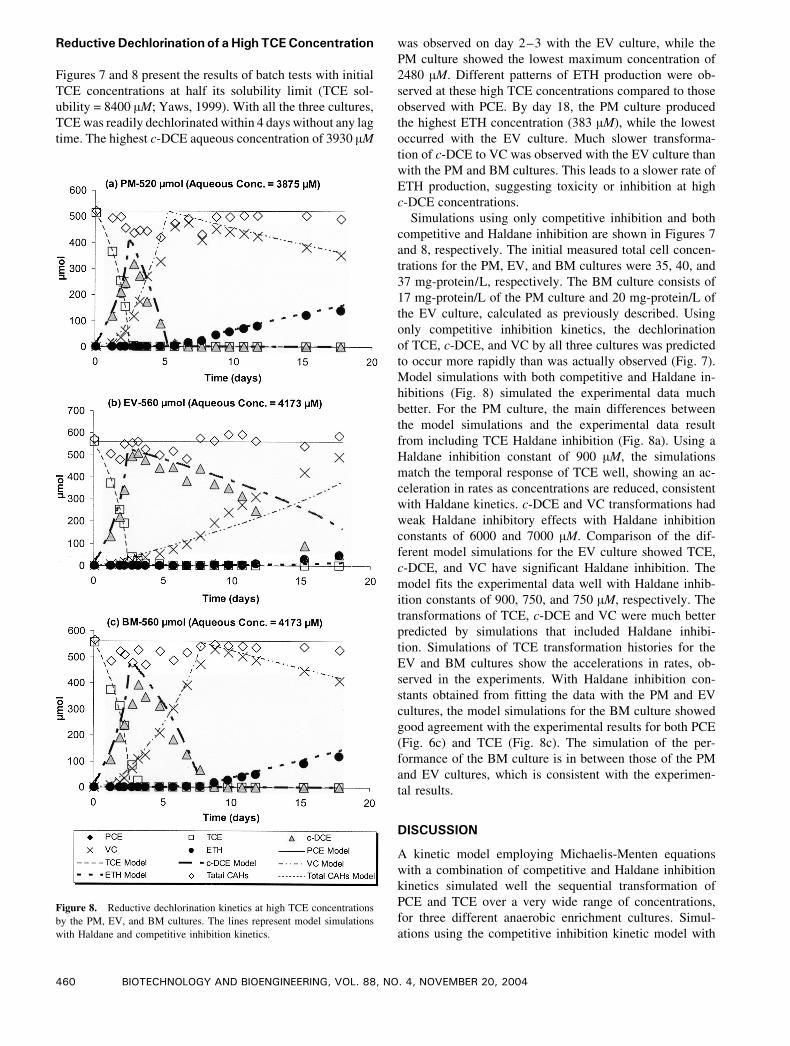
ReductiveDechlorination of aHigh TCEConcentration
Figures 7 and 8 present the results of batch tests with initial
TCE concentrations at half its solubility limit (TCE sol-
ubility = 8400 AM; Yaws, 1999). With all the three cultures,
TCE was readily dechlorinated within 4 days without any lag
time. The highest c-DCE aqueous concentration of 3930 AM
was observed on day 2–3 with the EV culture, while the
PM culture showed the lowest maximum concentration of
2480 AM. Different patterns of ETH production were ob-
served at these high TCE concentrations compared to those
observed with PCE. By day 18, the PM culture produced
the highest ETH concentration (383 AM), while the lowest
occurred with the EV culture. Much slower transforma-
tion of c-DCE to VC was observed with the EV culture than
with the PM and BM cultures. This leads to a slower rate of
ETH production, suggesting toxicity or inhibition at high
c-DCE concentrations.
Simulations using only competitive inhibition and both
competitive and Haldane inhibition are shown in Figures 7
and 8, respectively. The initial measured total cell concen-
trations for the PM, EV, and BM cultures were 35, 40, and
37 mg-protein/L, respectively. The BM culture consists of
17 mg-protein/L of the PM culture and 20 mg-protein/L of
the EV culture, calculated as previously described. Using
only competitive inhibition kinetics, the dechlorination
of TCE, c-DCE, and VC by all three cultures was predicted
to occur more rapidly than was actually observed (Fig. 7).
Model simulations with both competitive and Haldane in-
hibitions (Fig. 8) simulated the experimental data much
better. For the PM culture, the main differences between
the model simulations and the experimental data result
from including TCE Haldane inhibition (Fig. 8a). Using a
Haldane inhibition constant of 900 AM, the simulations
match the temporal response of TCE well, showing an ac-
celeration in rates as concentrations are reduced, consistent
with Haldane kinetics. c-DCE and VC transformations had
weak Haldane inhibitory effects with Haldane inhibition
constants of 6000 and 7000 AM. Comparison of the dif-
ferent model simulations for the EV culture showed TCE,
c-DCE, and VC have significant Haldane inhibition. The
model fits the experimental data well with Haldane inhib-
ition constants of 900, 750, and 750 AM, respectively. The
transformations of TCE, c-DCE and VC were much better
predicted by simulations that included Haldane inhibi-
tion. Simulations of TCE transformation histories for the
EV and BM cultures show the accelerations in rates, ob-
served in the experiments. With Haldane inhibition con-
stants obtained from fitting the data with the PM and EV
cultures, the model simulations for the BM culture showed
good agreement with the experimental results for both PCE
(Fig. 6c) and TCE (Fig. 8c). The simulation of the per-
formance of the BM culture is in between those of the PM
and EV cultures, which is consistent with the experimen-
tal results.
DISCUSSION
A kinetic model employing Michaelis-Menten equations
with a combination of competitive and Haldane inhibition
kinetics simulated well the sequential transformation of
PCE and TCE over a very wide range of concentrations,
for three different anaerobic enrichment cultures. Simul-
ations using the competitive inhibition kinetic model with
Figure 8. Reductive dechlorination kinetics at high TCE concentrations
by the PM, EV, and BM cultures. The lines represent model simulations
with Haldane and competitive inhibition kinetics.
460 BIOTECHNOLOGY AND BIOENGINEERING, VOL. 88, NO. 4, NOVEMBER 20, 2004

inhibition constants set equal to the measured KS values
(Yu, 2003) matched experimental data well for PCE con-
centrations lower than 300 AM, but deviated from exper-
imental data at PCE and TCE concentrations higher than
300–400 AM. The model that included both competitive
and Haldane inhibition kinetics provided much better fits
to the experimental results at elevated concentrations.
A number of modeling studies described reductive de-
chlorination of PCE using competitive inhibition (Cupples
et al., 2004; Garant and Lynd, 1998; Haston, 1999; Tandoi
et al., 1994; Tonnaer et al., 1997). These studies were all
conducted at aqueous PCE concentrations lower than
300 AM. Our modeling and experimental results indicate
that a kinetic model that incorporates both competitive and
Haldane inhibition kinetics results in a better match to
experimental results near the saturation PCE concentration
(1000 AM), and for a TCE concentration of 4000 AM, that is
50% of its solubility limit in water. Maillard et al. (2003)
reported kinetics for PCE reductive dehalogenase (PCE-
RDase) purified from Dehalobacter restrictus that exhib-
ited Haldane type kinetics for TCE concentrations higher
than approximately 300–400 AM. The results also showed
limited inhibition of PCE transformations, consistent with
the results of this study.
Additional model simulations, including only compet-
itive inhibition, were run in our study for high concen-
trations of PCE (1000 AM) and TCE (4000 AM). The cell
decay constant, kd (0.024 d�1) (Fennell and Gossett, 1998)
that was used in all the simulations, was increased up to
0.09 d�1 as reported by Cupples et al. (2003). This higher
decay constant slightly improved the agreement with the
experimental data, but the model continued to predict much
faster production and transformation rates of CAHs than
were observed experimentally.
Changes in total cell concentrations during PCE dechlo-
rination experiments were simulated as shown in Figure 9.
PCE kinetic experiments were conducted with the incre-
mental additions of PCE in succession (Table I). Total cell
concentrations as measured by protein analysis at the
beginning of each run were used as the model simulation
inputs. As shown in Figure 9, simulated cell concentrations
for the PM, EV, and BM cultures were reasonably consistent
with the protein concentrations measured at the beginning
of each PCE experiment.
A limitation of this study is that the measured biomass
based on protein content does not represent only dechlo-
rinating microorganisms. The cultures, however, were
highly enriched with dechlorinating microorganisms, based
on T-RFLP analysis. The kmax used were based on protein
content, resulting in a normalization in rates on a protein
concentration basis. The simulated and measured total
biomass values appeared to match well at the beginning and
end of each PCE experiment. Thus, our assumption that
most of the protein was associated with dehlorinating
microorganisms seems reasonable.
Haldane kinetic parameters obtained from our model
simulation fits to the experimental results were used to con-
struct Haldane rate vs. concentration curves. Figures 10 and
11 present the calculated Michaelis-Menten and Haldane
curves for TCE, c-DCE, and VC for the two cultures. The
PM and EV cultures showed different Haldane inhibition
patterns. The PM culture has very high Haldane inhibition
constants for c-DCE and VC (6000 and 7000 AM, respec-
tively), indicating very weak Haldane inhibition effects.
The EV culture, however, showed significant Haldane in-
hibition for TCE, c-DCE, and VC. Figures 10b and c would
indicate that little reduction in dechlorination rates should
occur at relatively high c-DCE and VC concentrations with
the PM culture. However, significant decreases in dechlo-
rination rates are expected with increases of TCE concen-
tration for the PM culture (Fig. 10a), and TCE, c-DCE, and
VC concentrations with the EV culture (Fig. 11a, b, c).
One possible explanation for the PM culture having less
Haldane inhibition effects is that it was acclimated more to
a high TCE concentration of 100 mg/L, while the EV
Figure 9. Model simulations of total cell concentrations during PCE
reductive dechlorination Runs 1, 2, and 3 as listed in Table I.
YU AND SEMPRINI: REDUCTIVE DECHLORINATION AT HIGH PCE AND TCE CONCENTRATIONS 461

culture was enriched with PCE. TCE kinetics using a model
with noncompetitive inhibition as reported by Maillard
et al. (2003) was compared in Figures 10a and 11a. An
inhibition constant of 760 AM (close to the KHI value of
900 AM observed in our study) and a half-velocity coef-
ficient of 23.7 AM were used in their model kinetics. Since
Maillard et al. (2003) used purified PCE-RDase, their
enzyme-based rates were reduced by a factor of 140 to
compare our inhibition patterns with theirs. It is very inter-
esting that our Haldane model used to fit to our experimental
data with whole cells has a similar concentration vs. rate
dependence as that observed by Maillard et al. (2003).
Thus, our observation of Haldane type kinetics at a high
TCE concentration is consistent with their observations.
As shown in Figures 1 through 6, the BM and EV cul-
tures more effectively transformed PCE to ETH. How-
ever, PCE solubility is much lower than that of the other
chlorinated ethylenes. TCE has a solubility of 8400 AMand high concentrations may be found near DNAPL source
zones in soil and groundwater. The experimental and
modeling results shown in Figures 7 and 8 show sequential
dechlorination of TCE at an average initial concentration
Figure 11. Michaelis-Menten kinetics with and without Haldane
inhibition for the EV culture. Rates were determined based on a total
dechlorinating cell concentration of 30 mg/L.
Figure 10. Michaelis-Menten kinetics with and without Haldane
inhibition for the PM culture. Rates were determined based on a total
dechlorinating cell concentration of 30 mg/L.
462 BIOTECHNOLOGY AND BIOENGINEERING, VOL. 88, NO. 4, NOVEMBER 20, 2004

of 4073 AM. The pattern of reductive dechlorination be-
tween three different mixed cultures differed from that
of PCE dechlorination in Figures 1 through 6. The PM
and BM dechlorinating cultures showed greater trans-
formations of high TCE concentrations to ETH than the
EV culture. The EV and BM cultures, however, show better
transformation of PCE to ETH than the PM culture. The
results of our modeling analysis indicate factors causing this
response. At higher TCE concentrations, the EV culture is
experiencing greater Haldane inhibition of c-DCE and VC
transformation. The experimental results in Figure 8 showed
that TCE depletion rates of the PM, EV, and BM cultures are
almost the same, but differences for c-DCE and VC
transformations are observed between the PM and EV
cultures. Our modeling studies indicated the EV culture has
lower KHI values of 750 AM for both c-DCE and VC com-
pared to those of 6000 and 7000 AM of the PM, respectively,
indicating higher c-DCE and VC concentrations to the EV
culture are potential toxic or inhibitory. Strong inhibition of
c-DCE on VC transformation limits ETH production in all
the cultures, as previously observed (Yu, 2003). The
modeling presented here indicates that the modeling of
c-DCE transformation with Haldane kinetics is an important
process to predict reductive dechlorination of PCE to ETH
at high concentrations.
From the reductive dechlorination results with a broad
range of PCE and TCE concentrations, the BM culture
obtained transformation abilities of both cultures. This led
to overall good performance when both PCE and TCE test
results were considered. Bioaugmentation with a binary
mixed culture might be more effective at real contaminated
sites, where wide ranges in concentrations and contaminant
mixture are present. Further investigations utilizing more
complex microbial multi-systems of defined cultures with
different degradation properties need to be performed to
better utilize and understand their potential for application
in the polluted environments as suggested by Fairlee et al.
(1997) and Rogers et al. (2000).
A variety of reductive CAH dechlorination models have
been proposed (Bagley, 1998; Fennell and Gossett, 1998;
Garant and Lynd, 1998; Haston, 1999;Tonnaer et al., 1997).
Fennell and Gossett (1998) developed a model for com-
plete PCE reductive dechlorination to ETH, in which PCE
concentration was a 70 AM PCE aqueous concentration
and no inhibition between chlorinated ethylenes was con-
sidered. Previously proposed models focused on compet-
itive inhibitions between PCE and TCE (Tonnaer et al.,
1997), and c-DCE and VC (Cupples et al., 2004; Haston,
1999). To the best of our knowledge, the experimental data
and simulations presented here are the first to describe the
sequential transformation of PCE and TCE over a wide
range of concentrations. Both competitive and Haldane
kinetics were required to model the experimental observa-
tions for the anaerobic reductive dechlorination of CAHs at
high concentrations, possibly produced from DNAPL
source zone. Kinetic studies are now needed with these
cultures at high concentrations of TCE, c-DCE, and VC, to
confirm the Haldane kinetics obtained from our heuristic
fitting of the high concentration test results.
The research was supported by a research grant from the U.S.
Environmental Protection Agency-sponsored Western Region Haz-
ardous Substance Research Center under agreement R-828772. This
article has not been reviewed by the agency, and no official en-
dorsement should be inferred. We thank Mark Dolan for his help
with the molecular characterization of the cultures.
References
Bagley DM. 1998. Systematic approach for modeling tetrachloroethene
biodegradation. J Environ Eng 124:1076– 1086.
Bailey J, Ollis D. 1986. Biochemical engineering fundamentals. New
York: McGraw-Hill.
Cupples AM, Spormann AM, McCarty PL. 2003. Growth of a Dehalococ-
coides-like microorganism on vinyl chloride and cis-dichloroethene
as electron acceptors as determined by competitive PCR. Appl Environ
Microbiol 69:953–959.
Cupples AM, Spormann AM, McCarty PL. 2004. Vinyl chloride and
cis-dichloroethene dechlorination kinetics and microorganism
growth under substrate limiting conditions. Environ Sci Technol 38:
1102– 1107.
Ellis DE, Lutz EJ, Odom JM, Buchanan RJ Jr, Lee MD, Bartlett CL,
Harkness MR, Deweerd KA. 2000. Bioaugmentation for accelerated
in situ anaerobic bioremediation. Environ Sci Technol 34:2254– 2260.
Fairlee JR, Burback BL, Perry JJ. 1997. Biodegradation of groundwater
pollutants by a combined culture of Mycobacterium vaccae and a
Rhodococcus sp. Can J Microbiol 43:841– 846.
Fennell DE, Gossett JM. 1998. Modeling the production of and com-
petition for hydrogen in a dechlorinating culture. Environ Sci Technol
32:2450– 2460.
Garant H, Lynd L. 1998. Applicability of competitive and noncompetitive
kinetics to the reductive dechlorination of chlorinated ethenes. Bio-
technol Bioeng 57:751–755.
Harkness MR, Bracco AA, Brennan MJ Jr, Deweerd KA, Spivack JL.
1999. Use of bioaugmentation to stimulate complete reductive de-
chlorination of trichloroethene in Dover soil columns. Environ Sci
Technol 33:1100–1109.
Haston ZC. 1999. Factors affecting growth and utilization in the anaero-
bic dehalogenation of chlorinated ethenes. Ph.D. thesis, Stanford
University.
Hendrickson ER, Payne JA, Young RM, Starr MG, Perry MP, Fahnes-
tock S, Ellis DE, Ebersole RC. 2002. Molecular analysis of De-
halococcoides 16S ribosomal DNA from chloroethene-contaminated
sites through North America and Europe. Appl Environ Microbiol 68:
485–495.
Loffler FE, Sun Q, Li J, Tiedje JM. 2000. 16S rRNA gene-based detection
of tetrachloroethene-dechlorinating Desulfuromonas and Dehalococ-
coids spies. Appl Environ Microbiol 66:1369–1374.
Maillard J, Schumacher W, Vazquez F, Regeard C, Hagen WR, Hollinger
C. 2003. Characterization of the corrinoid iron-sulfur protein tetra-
chloroethene reductive dehalogenase of Dehalobacter restrictus. Appl
Environ Microbiol 69:4628– 4638.
Major DM, McMaster ML, Cox EE, Edwards EA, Dworatzek SM, Hen-
drickson ER, Starr MG, Payne JA, Buonamici LW. 2002. Field dem-
onstration of successful bioaugmentation to achieve dechlorination of
tetrachloroethene to ethene. Environ Sci Technol 36:5106 – 5116.
Maymo-Gatell X, Chien Y-T, Gossett JM, Zinder SH. 1997. Isolation of
bacterium that reductively dechlorinates tetrachloroethene to ethene.
Science 276:1568– 1571.
Pon G, Hyman MR, Semprini L. 2003. Acetylene inhibition of tri-
chloroethene and vinyl chloride Reductive dechlorination. Environ Sci
Technol 37:3181–3188.
Rittmann BE, Seagren E, Wrenn BA. 1994. In-situ bioremediation. 2nd ed.
Parkridge, NJ: Noyes Publications. p 37– 50.
YU AND SEMPRINI: REDUCTIVE DECHLORINATION AT HIGH PCE AND TCE CONCENTRATIONS 463

Rogers JB, DuTeau NM, Reardon KF. 2000. Use of 16S-rRNA to inves-
tigate microbial population dynamics during biodegradation of toluene
and phenol by a binary culture. Biotechnol Bioeng 70:436–445.
Tandoi V, DiStefano TD, Bowser PA, Gossett JM, Zinder SH. 1994. Re-
ductive dehalogenation of chlorinated ethenes and halogenated eth-
anes by a high-rate anaerobic enrichment culture. Environ Sci Technol
28:973–979.
Tonnaer H, Alphenaar A, Wit HD, Grutters M, Spuij F, Gerritse J, Gottschal
JC. 1997. Modelling of anaerobic dechlorination of chloroethenes for
in-situ bioremediation. In: Alleman BC, Leeson A, editor. Proceedings
of the Fourth International Conference on In Situ and On-Site Bio-
remediation. Columbus OH: Battelle Press. p 591– 596.
Westrick JJ, Mello JW, Thomas RF. 1984. The groundwater supply
survey. J Am Water Works Assoc 76:52–59.
Yaws CL. 1999. Chemical properties handbook: Physical, thermodynam-
ics, environmental, transport, safety, and health related properties for
organic and inorganic chemicals. New York: McGraw-Hill.
Yu S. 2003. Kinetics and modeling investigations of the anaerobic re-
ductive dechlorination of chlorinated ethylenes using single and bi-
nary mixed cultures and silicon-based organic compounds as slow-
release substrates. Ph.D. thesis, Oregon State University, Corvallis.
Yu S, Semprini L. 2002a. Dechlorination of PCE DNAPL with TBOS
using a binary mixed culture. In: Gavaskar AR, Chen ASC, editors.
Proceedings of the Third International Conference on Remediation of
Chlorinated and Recalcitrant Compounds. Columbus OH: Battelle
Press. p 2B–49.
Yu S, Semprini L. 2002b. Comparison of trichloroethylene reductive
dehalogenation by microbial communities stimulated on silicon-based
organic compounds as slow-release anaerobic substrate. Water Res 36:
4985–4996.
464 BIOTECHNOLOGY AND BIOENGINEERING, VOL. 88, NO. 4, NOVEMBER 20, 2004