Kinetically Adjustable Pore Space Dilation Bioaugmentation and
9
Kinetically Adjustable Pore Space Dilation Bioaugmentation and Biostimulation Injections at CCAFS and PAFB Corresponding author: Christopher Adkison, Jacobs Engineering, 7001 N. Atlantic Avenue #202, Cape Canaveral, Florida, 32920 USA. 321-783-7033, 321-868-0826. [email protected] Coauthors: Guy Fazzio, Jacobs Engineering, 7001 N. Atlantic Avenue #202, Cape Canaveral, Florida, 32920 USA. 321-783-7033, 321-868-0826. [email protected] Mark A. Kershner, US Air Force, 45 CES/CEVR, 1224 Jupiter Street MS 4125, Patrick AFB, Florida, 32925 USA. 321-853-0964, 321-853-5435. [email protected] Harlan Faircloth, CORE Engineering and Construction, 1340 Palmetto Avenue, Winter Park, Florida 32789 USA. 407-622-2673, 407-622-2674. [email protected] Raymond Robinson, CORE Engineering and Construction, 1340 Palmetto Avenue, Winter Park, Florida 32789 USA. . 407-622-2673, 407-622-2674. [email protected] Randy Robinson, Renegade Environmental Services, 3412 Ondich Road, Apopka, Florida, 32712 USA. 407-884-8829, 407-889-2944. [email protected] C.W. Price, Renegade Environmental Services, 3412 Ondich Road, Apopka, Florida, 32712 USA. 407-884-8829, 407-889-2944. [email protected]
Transcript of Kinetically Adjustable Pore Space Dilation Bioaugmentation and

Kinetically Adjustable Pore Space Dilation Bioaugmentation and Biostimulation Injections at CCAFS and PAFB
Corresponding author: Christopher Adkison, Jacobs Engineering, 7001 N. Atlantic Avenue #202, Cape Canaveral, Florida, 32920 USA. 321-783-7033, 321-868-0826. [email protected] Coauthors: Guy Fazzio, Jacobs Engineering, 7001 N. Atlantic Avenue #202, Cape Canaveral, Florida, 32920 USA. 321-783-7033, 321-868-0826. [email protected] Mark A. Kershner, US Air Force, 45 CES/CEVR, 1224 Jupiter Street MS 4125, Patrick AFB, Florida, 32925 USA. 321-853-0964, 321-853-5435. [email protected] Harlan Faircloth, CORE Engineering and Construction, 1340 Palmetto Avenue, Winter Park, Florida 32789 USA. 407-622-2673, 407-622-2674. [email protected] Raymond Robinson, CORE Engineering and Construction, 1340 Palmetto Avenue, Winter Park, Florida 32789 USA. . 407-622-2673, 407-622-2674. [email protected] Randy Robinson, Renegade Environmental Services, 3412 Ondich Road, Apopka, Florida, 32712 USA. 407-884-8829, 407-889-2944. [email protected] C.W. Price, Renegade Environmental Services, 3412 Ondich Road, Apopka, Florida, 32712 USA. 407-884-8829, 407-889-2944. [email protected]

Kinetically Adjustable Pore Space Dilation Bioaugmentation and Biostimulation Injections at CCAFS and PAFB
Mark A. Kershner ([email protected]) (US Air Force, 45 CES/CEVR, Cape Canaveral AFS,
Florida, USA). Christopher Adkison ([email protected]) and Guy Fazzio ([email protected]) (Jacobs
Engineering, Cape Canaveral, Florida, USA) Harlan Faircloth ([email protected]) and Raymond Robinson ([email protected])
(CORE Engineering and Construction, Winter Park, Florida, USA) Randy Robinson ([email protected]) and C.W. Price ([email protected]) (Renegade
Environmental Services, Apopka, Florida, USA) ABSTRACT Kinetically adjustable pore space dilation injection techniques are being used for in-situ treatment for both DNAPL source areas and dissolved halocarbon plumes at sites on Cape Canaveral Air Force Station (CCAFS) and Patrick Air Force Base (PAFB), Florida. The hydraulic injection technique was pioneered and tested first at Space Launch Complex 15 on CCAFS. Dye studies were performed to verify horizontal and vertical radius of influence for injections of vegetable oil. Along with vegetable oil, emulsified zero valent iron (EZVI) was injected around an area of trichloroethene DNAPL underlying the launch stand. The EZVI supplier has verified that the delivery technique leaves micelles intact. The technique was further developed for delivery of vegetable oil, monoammonium phosphate and KB-1™ at Facility 60600 at CCAFS and for vegetable oil and KB-1™ at Site OT-30 at PAFB. The system's ability to inject at multiple points simultaneously shortened the estimated duration for performance of in-situ treatment at both sites. “Slip-streaming” technology was also developed in order to inject dual phase liquids simultaneously, thus reducing the need for separate injection events. This injection technology has proven adaptable and successful for subsurface application of materials including vegetable oil, emulsified zero valent iron, KB-1™, HRC® products, and nutrient solutions. It has a variable velocity directional nozzle, which allows not only 360° injections, but 90°, 180°, or 270° injections, as dictated by site characteristics. The kinetically adjustable pore space dilation hydraulic injection system allows for variable injection flow rates. Variable flow rates are essential in allowing amendments to diffuse into limited pore spaces. High flow rates coupled with the multi-configurable nozzle are utilized to increase kinetic influence and energize diffusion into these limited pore spaces. As a result, 15-22 ft. radius of influence has been routinely observed. The hydraulic injection system also provides instrumentation that allows real-time data collection of flow rates, temperatures and pressures. To further enhance distributive contact into the diffusion limited pore spaces, a staged lateral injection process is utilized. This process basically allows a more complete vertical in-situ pore space mixing between adjacent injection point locations.

INTRODUCTION Prior to the development of the Kinetically Adjustable Pore Space Dilation injection system, current injection techniques had great limitations. Small radiuses of influence (ROI) were routinely observed. As a result, typically large amounts of injection material could not be injected at a single location. Limited ROI’s also could cause “daylighting” of injection material. “Daylighting” is a term used when the injection material returns to the surface. Another limitation of current injection techniques is least path of resistance. Injection material would follow preferential pathways or paths of least resistance. As a result, injection material distribution is greatly reduced. In areas of reduced permeability, diffusion of injection material becomes the primary mechanism for contaminant contact. These are referred to as diffusion limited pore spaces. These diffusion limited pore spaces absorb and sequester contaminants. By relying on diffusion to be the primary mechanism for contact between injection material and the contaminants, these diffusion limited pore spaces will serve as areas for contaminant rebound. The Kinetically Adjustable Pore Space Dilation injection system has demonstrated advantages over the current injection techniques. This injection system is a hydraulic injection system that has evolved beyond traditional direct-push technology (DPT). However, the system incorporates several enhancements including hydraulic top-side injection equipment and configurable down-hole injection nozzles. Coupled with the ability for real-time injection telemetry and other data sensing capabilities, the Kinetically Adjustable Pore Space Dilation injection system improves horizontal distribution while eliminating “daylighting.” Further enhancements also allow for dual phase injections of separate liquids simultaneously, multiple port injections of up to four separate products simultaneously, and several essential injection techniques and processes. By implementing the Kinetically Adjustable Pore Space Dilation injection system, injections can be conducted either “top-down” or “bottom-up.” The ability to perform the “bottom-up” injection technique with enhanced radius is solely due to the enhancements of the Kinetically Adjustable Pore Space Dilation Injection System. These enhancements allow the injection system to overcome the potential least path of resistance issues associated with the “bottom-up” injection technique and the “daylighting” of injection material.
This injection technology has been utilized at Space Launch Complex (SLC) 15 and Facility 60600 at CCAFS and OT-30 at PAFB. Based upon site conditions, average flow rates during injection events

have been 33-35 gallons per minute. At these three groundwater remediation sites, ROI’s have been verified between 15-22 ft. As a result of the Kinetically Adjustable Pore Space Dilation injection system, increased efficiencies have been documented. At OT-30, 11,700 gallons of injection material was delivered in one day and the average delivery volume throughout the entire job was 6,640 gallons per day. MATERIALS AND METHODS Variable Flow Rates The Kinetically Adjustable Pore Space Dilation injection system allows for variable injection flow rates. Variable flow rates are essential in allowing amendments to diffuse
into limited pore spaces. Increased flow rates, not increased pressure, cause vertical in-situ pore space mixing of injection materials. The vertical mixing potential causes vertical equilibrations of injection material during injections. As a result of the vertical mixing potential, vertical distribution of injection material is increased. Throughout injections at CCAFS and PAFB vertical distributions of 4-5 ft. were routinely
observed. Thus, high flow rates coupled with the multi-configurable nozzle, increase kinetic influence and energize diffusion into these limited pore spaces. Specialized Directional/Radial Injection Nozzles Directional nozzles are also utilized by the Kinetically Adjustable Pore Space Dilation injection system. Variable velocity directional nozzles not only allow for radial injections, but can be configured for 90°, 180°, or 270° injections. Due to the large radial properties associated with the Kinetically Adjustable Pore Space Dilation injection system, protection of current monitoring well network infrastructures from injection material intrusion was needed. As a result, these variable velocity directional nozzles were developed in order to inject “around” the current monitoring network infrastructure. Directional injections are obviously site-specific, but they have been utilized also at CCAFS and PAFB, to inject beneath permanent structures such as launch stand foundations and building foundations. With the development and implementation of directional injections, targeted placement of injection material and limited impact to neighboring infrastructures is possible. Slip-stream and Dual Phase Operations
Slip-stream technology was first developed on the Kinetically Adjustable Pore Space Dilation injection system at CCAFS. This technology was also developed in order to
inject dual phase liquids or biological amendments simultaneously. During the bioaugmentation injections at CCAFS and PAFB, KB-1™ was slip-streamed into the injection material. By utilizing this dual-phase injection technology, the need for separate injection events was not required. Staged Lateral Injection Process Another technique utilized by the Kinetically Adjustable Pore Space Dilation injection system is the Staged Lateral Injection Process. Based on the documented properties that the system can deliver larger radial influences and has the ability to create vertical pore space mixing potential, this injection technique was developed to further enhance in-situ delivery contact. At lower injection volumes, the injection pattern becomes more “clover-like” or constricted. However, at larger injection volumes, the injection pattern does become more radial due to natural kinetic boundaries with the formation. A constricted injection pattern becomes problematic due to the void between the injection ports. In this situation, little or no injection material might be found, which limits the amount of contact the injection material has with the contaminants. Again, in this situation, diffusion becomes the primary mechanism for injection material and contaminant contact. In order to evenly distribute injection material throughout the entire formation, staggered nozzle orientations were utilized. Injection nozzles are arranged such that adjacent locations are configured to inject injection material into the void from adjacent injection locations. The Staged Lateral Injection Process coupled with the vertical pore space mixing potential; result in optimum distribution of injection material. CONCLUSIONS To date, definite benefits from the Kinetically Adjustable Pore Space Dilation injection system have been observed with documented increases in ROIs, greater vertical distribution, increased injection efficiency and productivity, and the Facility 60600 and OT-30 groundwater corrective measures implementations. Verification of ROI and vertical distribution was conducted with DPT macrocore sampling. Various lines of evidence indicate continued effective contamination reduction efficiencies via the bioaugmentation/biostimulation injections of VO and KB-1™ at Facility 60600 and OT-30. Lines of evidence for development of these conclusions include groundwater sampling using traditional monitoring wells and multi-chamber wells (MCWs), overall plume monitoring and molar equivalents. Prior to full scale application at SLC 15, bulk vegetable oil was dyed red in order to visibly verify the presence of vegetable oil throughout the formation following vegetable oil injections. Macrocore samples were collected at varying distances and locations surrounding injection locations. Soil samples were also collected at injection depth, as well as, both above and below injection depths. These soil samples verified pore space mixing between the injection material and the formation. As the injection proceeds, the injection material moves rapidly from the injection nozzle. This rapid movement causes turbulent flows and currents that allows for pore space mixing. These turbulent flows and currents begin to expand vertically until the formation and injection pressures come

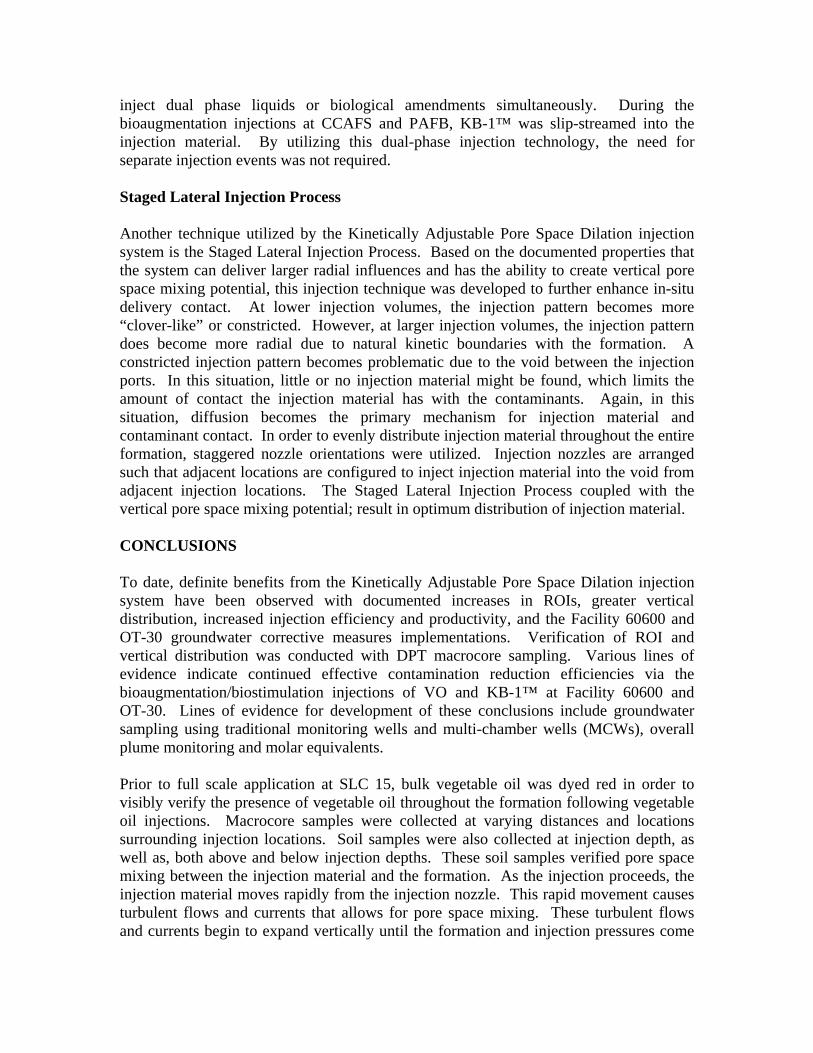
to equilibrium. Figure 1 is a picture of a macrocore sample collected from SLC-15. The red striations throughout the sample indicate evidence of pore space mixing. They indicate that vegetable oil was mixing throughout the formation both above and below the injection interval. Figure 2 illustrates vertical pore space mixing during injection.
Figure 1 Vertical Pore Space Mixing and ROI Macrocore Sample
Figure 2 Vertical Pore Space Mixing
Macrocore sampling further verified these turbulent flows increased in intensity with increased flow rates, as a result pore space mixing and vertical distribution increased.
KKiinneettiicc LLoocckk
Directional Flow Segment

Flow rates also influenced ROI. Low-flow rates proved that the injection material could not overcome the subsurface pressure wall generated near the injection rods and injection nozzles. The subsurface pressure wall is the pressure of the formation on the injection tooling. Without overcoming this subsurface pressure wall, injection material pools around the injection nozzle and injection tooling, ROIs are minimal, and “daylighting” of injection material becomes a major issue. As injection flow rates are increased, injection material is able to overcome the subsurface pressure wall and greater ROIs are observed. As the injection proceeds with higher flow rates, the injection material moves away from the injection nozzle horizontally until the formation and injection pressures come to equilibrium. Marcocore sampling documented that with an optimal flow rate of 30-35 gallons per minute, an 18-22 ft. ROI could be expected. Greater ROIs could be seen with increased flow rates; however, vegetable oil pore space ratio was reduced as a result. At SLC 15, Facility 60600, and OT-30, a 6-8% VO to pore space concentration was targeted. Flow rates between 30-35 gallons per minute, consistently yielded the correct vegetable oil pore space ratio and 18-22 ft. ROIs. Through the implementation of the Kinetically Adjustable Pore Space Dilation injection system greater injection efficiency and greater productivity has been observed. At OT-30 83,000 gallons of injection material (bulk vegetable oil and water) was injected in 12.5 days. As a result, on average 6,640 gallons of injection material was injected per day and 11,700 gallons of injection material was delivered on one day. These daily production numbers demonstrate significantly greater production than other injection technologies available. During the bioaugmentation/biostimulation injections at Facility 60600 and OT-30 and the supplemental bioaugmentation/biostimulation at Facility 60600, a total of 670.7 liters of KB-1™ was slip-streamed in during injections. By slip-streaming in the KB-1™, separate bioaugmentation injections were not needed. By eliminating separate injection events an estimated $68,750 was saved at Facility 60600 and $101,765 was saved at OT-30. Marked decreases in DCE and vinyl chloride levels have been observed in the immediate vicinity of Facility 60600. Near Hangar R&D, DCE levels have decreased, with variability in vinyl chloride concentrations. As a whole, the results indicate that the combined treatment with KB-1™, vegetable oil and monoammonium phosphate have been effective in accelerating biodegradation of chlorinated VOCs. In portions of the treatment area where nutrients (monoammonium phosphate) were introduced but no vegetable oil or KB-1™ were applied, results are more varied. At the well furthest downgradient in the treatment area, HGRAF-IW23 (20-25'), DCE and vinyl chloride trended upward, but showed significant decline throughout 2008. On the upgradient end, at 60600-MW15 (23-28'), DCE concentrations are low and stable, while vinyl chloride levels rose throughout 2007 and have fluctuated throughout 2008. For both locations, these results are attributed to the migration of contaminants from upgradient and enhanced biodegradation resulting in greater vinyl chloride production. Samples from 60600-MW18, east of IW23, demonstrated a remarkable increase in Dhc

population following the initial nutrient addition and an associated slow reduction in DCE with fluctuating vinyl chloride levels. It appears that the supplemental treatment event accelerated dechlorination. Results for the wells positioned on either side of the treatment area, 60600-MW20 and -MW21, suggest that the injection activities may be causing some lateral migration of contaminants. However, the relatively recent removal of paving from the area between Facilities 60600 and 1709 with construction of stormwater retention features probably contributes substantially to the movement based upon groundwater contours. This trend in reduction can also be seen when examining the calculated molar equivalents for the sampled performance monitoring wells; Table 1, presented below, tabulates the molar equivalents for the performance monitoring wells. The data compares the performance monitoring wells sampled in August 2006 (baseline) and September 2008 (post-supplemental injection treatment). In seven monitoring wells, significant reduction has been realized, upwards of 90%. In three of the monitoring wells reduction greater than 50% has been observed. In three monitoring wells, a net increase of total VOCs has been observed, attributed mostly to DCE and vinyl chloride increases, potentially indicating high rates of dechlorination, or increased movement of VOCs resulting from the removal of impervious surfaces adjacent to Facility 60600, and the installation of stormwater retention ponds. All other monitoring wells showed reductions in total VOCs, just at lower rates than many of the other monitoring wells. These wells were located in areas that received no treatment or nutrient only injections.
Table 1 Facility 60600 Treatment Area - Comparison of Molar Concentrations
Well Identification
Molar Concentration1 Net
Change August-
06 September-
08 60600-MWD01 2.78 0.45 -2.33
60600-MW13 (20-25') 14.94 0.03 -14.91 60600-MW13 (25-30') 317.8 1.08 -316.72 60600-MW14 (23-28') 3.74 0.11 -3.63 60600-MW14 (30-35') 26.08 6.2 -19.88 60600-MW14 (35-40') 3.74 0.04 -3.70 60600-MW15 (23-28') 34.84 27.95 -6.89 60600-MW16 (23 - 28') 82.58 0.26 -82.32 60600-MW17 (23-28') 94.39 6.62 -87.77 60600-MW18 (23-28') 101.05 43.22 -57.83
HGRAF-IW-23I 41.53 48.48 6.95 HGRAF-IW-23ID 0.86 0.74 -0.12
60600-MW20 (23-28') 8.17 19.13 10.96 60600-MW21 (23-28') 1.3 1.44 0.14
HKRE-MWD01 1.58 0.1 -1.48
-579.53 1: Sum of TCE, cis- and trans-1,2-DCE, and vinyl chloride

Samples from multi-chamber and traditional monitoring wells in and near the Building 533 source area at OT-30 document the positive changes on the whole that have resulted from treatment, with continuing reduction. Prior to any treatment, TCE concentrations in well samples were as high as 150,000 ppb. Post-second treatment, the highest is 2,500 ppb in a MCW well which has historical data. For cis-1,2-DCE, the highest result pre-treatment was 90,000 ppb and the highest post-second treatment is now 67,000 ppb. For vinyl chloride, the pre- and post-second treatment maximums are 9,600 and 31,000 ppb, respectively. Though simplistic, this data indicates conversion from TCE to DCE, and DCE to vinyl chloride. This trend in reduction can also be seen when examining the calculated molar equivalents for the sampled MCWs. Table 2, presented below, tabulates the molar equivalents for the MCWs sampled. The data compares only chambers sampled in both December 2004 (baseline) and January 2008 (post-second treatment). In six of fourteen MCWs, significant reduction has been realized, upwards of 90%. In six of the MCWs reduction greater than 48% has been observed, attributed to the destruction of TCE. In five of fourteen MCWs, a net increase of total VOCs has been observed, attributed mostly to DCE and vinyl chloride increases, thus indicating high rates of dechlorination. Little net change in terms of molar equivalents was seen in the others.
Table 2 OT-30 Treatment Area - Comparison of Molar Concentrations
Well Identification
Molar Concentration1 Net
Change December-
04 January-
08 0T-30-MCW1 2097.48 790.12 -1307.36 0T-30-MCW2 478.64 53.57 -425.07 0T-30-MCW3 4330.48 997.01 -3333.47 0T-30-MCW4 44.39 283.51 239.12 0T-30-MCW6 30.15 102.65 72.50 0T-30-MCW7 0.04 0.09 0.05 0T-30-MCW8 0.06 0.33 0.27 0T-30-MCW9 627.29 325.65 -301.65
0T-30-MCW10 1710.18 777.35 -932.83 0T-30-MCW11 337.07 154.89 -182.18 0T-30-MCW12 484.87 962.12 477.25 0T-30-MCW13 291.16 428.9 137.74 0T-30-MCW14 3.66 4.51 0.85 0T-30-MCW15 4.76 17.59 12.83
-5541.92 1: Sum of TCE, cis- and trans-1,2-DCE, and vinyl chloride
Trends at any given performance monitoring location are variable. As a generality, TCE concentrations have decreased with little rebound. At a number of Building 533 sampling points, TCE has either fallen below its GCTL or fallen off completely, resulting in a non-detect. Cis-1,2-DCE concentrations continue to be the most variable. This likely can be attributed to the generation of DCE from destruction of TCE occurring along with degradation of DCE to vinyl chloride, with the rate of each process varying.